1. Introduction
DNA microarrays and RNA sequencing (RNA-seq) are the two significant technologies in carrying out high-throughput analysis of transcript abundance. The advancement of these technologies has enabled scientists to accumulate massive gene expression microarray data. ArrayExpress and Gene Expression Omnibus are two examples of an online repository of transcriptome data with repositories size close to a million DNA microarray datasets. The main challenge posed by microarray data is the restricted number of samples compared to the high dimensionality of genes, which makes the classification method to select the salient genes for the classification process difficult [
1]. The main aim of the microarray dataset is to create an effective model to discriminate the gene expression of samples, i.e., to differentiate between the normal or abnormal states of cancers and assign tissue samples to various types of disease.
Selecting a subset of genes that is optimal for the purpose classification is an arduous and crucial task because the number of genes that have a high correlation with a specific phenotype is very small compared to the thousands of genes in the sample. To facilitate this task, a feature selection method was proposed in reducing the dimensionality of features by choosing the most salient genes and eliminating the redundant and irrelevant genes while retaining high classification accuracy.
The feature selection problem is an NP-hard problem. This is because the search space of potential subsets of features grows exponentially along with the number of features. Therefore, performing an exhaustive search will not lend itself to be conducted using an exhaustive search through the entire solution search space because doing so will take a long computing time and incur a high cost. To tackle this problem, the only features relevant for classification tasks and highly correlated with specific phenotypes must be chosen, and irrelevant, redundant, and unproductive features must be removed to enhance classification accuracy and computational efficiency.
The search strategy is an essential part of any FS technique to return the given dataset’s salient features. Many works have been performed using various strategies to treat the searching process problem using a few methods. One of the methods is called sequential forward strategy (SFS) [
2]. SFS starts the search with a new idle set and successfully adds the most relevant features from the original set into the new set sequentially. In contrast, another method is the sequential backward strategy (SBS) [
3]. SBS works opposites to SFS, where it starts with a complete set and can successfully delete the most irrelevant features from the set without degrading the performance. A third alternative strategy, called bidirectional selection [
4], is based on FSF and SBS: the algorithm starts from both ends, where it starts to delete and add features simultaneously. In addition, the fourth choice as a strategy is one where the search is started with a chaotic selected subset based on SFS, SBS, or a bidirectional strategy. The complete search strategy [
5] may provide better solutions to an FS task owing to the precision in its search, but it is not practically applicable for a large number of features.
The search strategies, as mentioned earlier, try to find a solution between near-optimal and sub-optimal regions because the local search is used instead of meta-heuristics search algorithms. Furthermore, these search techniques suffer from computational complexity and employ a partial search in the feature space. Therefore, near-optimal solutions are rather hard to obtain using the aforementioned methods. Hence, many researchers started focusing on meta-heuristics algorithms due to their efficiency in getting better solutions within a reasonable time. In the past few decades, many search strategies have been used to execute and solve the feature selection problem, including genetic algorithms, hybrid genetic algorithms [
6], particle swarm optimization [
7], binary particle swarm optimization (BPSO) [
8], tabu search [
9], simulated annealing [
10,
11], and ant colony optimization [
12].
Gene selection techniques for the microarray data could be grouped into three major models: filter, wrapper, and hybrid [
5]. The filter technique is often used as a pre-processing phase and is contingent upon the data’s intrinsic properties as opposed to being biased towards a specific classifier; it relies on ranking the genes by computing the weight values of genes according to their correlation with the class before employing the classifier. In general, the filter method is computationally efficient, but it does not consider the interaction between the genes and the classifier; this method also fails to address redundancy amongst the chosen genes. The wrapper method uses machine learning to evaluate the subsets’ relative usefulness and search for the best set of genes in the search space. Typically, the wrapper method outperforms the filter method when it comes to classification accuracy. Still, it is computationally more expensive than the filter method because the classifier must be used to estimate a value for each new generating subset. The third model is the hybrid approach [
5] and cooperatively introduces two approaches: filter and wrapper. There are many techniques in the pattern recognition field that are not designed to treat a huge amount of redundant and irrelevant genes. Therefore, in the last few decades, the hybridization of feature selection techniques has demonstrated great potential to address a huge amount of data [
13,
14,
15].
Many meta-heuristic approaches to gene selection problems have been proposed due to their effectiveness in obtaining better solutions in a reasonable time. The harmony search algorithm (HSA) is a population-based method that is of interest to researchers because it is more flexible and has a well-balanced mechanism to improve global and local exploration abilities [
16]. HSA continues to be of interest to researchers [
17] for several reasons:
- (i)
Compared to the GA, the HSA can overcome the drawback of the building block theory of GAs by considering all existing solutions instead of considering only two solutions (parents) in its reproduction. Also, it does not require crossover and mutation operators. Thus it needs less computational effort, in terms of memory and runtime;
- (ii)
In contrast to heuristic techniques, the HSA is more flexible and has a well-balanced mechanism to improve global and local exploration capabilities.
Despite some progress in improving HSA approaches, researchers must still overcome some flaws, such as slow convergence caused by the HSA’s entirely random mechanism for generating the initial harmony memory. The HSA also has a high degree of diversification (higher exploration), but its exploitation capabilities are limited. Aside from these disadvantages of the HSA, gene selection problems pose some challenges in over-fitting and issues caused by randomness when generating the initial harmony memory (HM). The HSA’s entirely random mechanism that generates the initial harmony memory (HM) may have a negative effect on the quality of the improvised solution. A solution can be discarded because its quality is worse than the existing solutions in the HM. However, HSA can identify the location of reasonable solutions by exploring multiple search spaces at a time. But HSA is poor in exploiting the desired solutions in the search space because it focuses more on exploring the search space. This means that the HSA has a strong exploration capability but is weak in exploitation. Therefore, there is an imbalance between search diversity and intensification.
These issues prompted the investigation of the HSA, which has yet to be applied to gene selection problems. This paper proposes a hybrid SU filter with an enhanced HSA, dubbed the hybrid Symmetrical Uncertainty and the Reference Set Harmony Search Algorithm (SU-RSHSA), to address the aforementioned drawbacks. The SU-RSHSA works by obtaining the most relevant subset of genes, resulting in improved classification accuracy, a smaller number of genes selected, and a shorter computational time. The following summarizes the contributions made by this paper:
It proposed a method for selecting genes based on the HSA and enhancing the initial harmony memory construction process through the use of a reference set mechanism within the HSA (RSHSA);
It proposed a hybrid SU filter with an RSHSA wrapper to improve gene selection accuracy while requiring less computational time (SU-RSHSA).
The rest of the paper is organized as follows. In
Section 2, the HSA is introduced briefly before explaining how the HSA is hybridized with a filter method. An in-depth description of our proposed SU-RSHSA is also described in
Section 2.
Section 3, in comparison, contains the presentation of the experimental results and the comparison of the current algorithm with other existing gene selection algorithms. The discussion section (
Section 4) includes the analysis with the interpretation of the experimental results and how it can be further improved as future work. In the end, the paper is wrapped up in
Section 5 with a summary and a few remarks.
2. Materials and Methods
2.1. The Harmony Search Algorithm
The Harmony Search Algorithm (HSA) is a population-based meta-heuristic algorithm based on the improvisation process of a skilled musician. It can be conceptualized using an analogy with a group of musicians or music bands searching for a harmony of a perfect state by adjusting the pitch of their musical instruments within a possible range. If all the pitches make a pleasing harmony, the musicians will memorize the pitches. Based on this memorized harmony, the chances of playing a better harmony are enhanced in their next rehearsal. The process of improvisation will improve their music, rehearsal after rehearsal. The quality of the improvised harmony is examined using an aesthetic standard [
18]. Geem et al. [
17] found this fascinating connection between optimization methods and the music band improvisation process and proposed the HSA. Like the other population-based algorithm, HSA starts with generating initial solutions randomly. The quality of every solution is evaluated by incorporating the decision variables values into the objective function. Objective function values determine the quality of decision variables of an optimization problem. Suppose any of the generated solution quality is good, the value the value of the decision variables will be memorized, and the chance to make a better solution will improve, iteration after iteration.
HSA was suggested by [
17] and is a population-based meta-heuristic optimization method, which has been used in numerous optimization problems successfully, including rostering [
19], dynamic optimization problems [
20], word sense disambiguation [
21], nonlinear discrete-time systems [
22], and complex high-dimensional optimization problems [
23]. Generally, a musician can utilize one of the three following rules when they want to improvise their music: (1) playing a well-known or memorized pitch or music; (2) playing a pitch that is almost similar to a pitch in their memory, and (3) playing new composed notes or random notes. These three rules are the main elements of HAS as formalized by [
18]. The three corresponding elements are HM, randomization, and pitch adjustment.
The HSA comprises of the following six steps: Step 1: HSA Parameter Initialization; Step 2: Initializing Harmony Memory (HM); Step 3: Improvising new harmony (G′); Step 4: Updating the Harmony Memory; Step 5: Repeating steps 2–3 until termination criteria are reached; and Step 6: Cadenza.
The parameters involved include the following:
- (a)
Harmony Memory Size (HMS): The HMS defines the number of solution vectors that the HM can store.
- (b)
Harmony Memory Consideration Rate (HMCR): HMCR is employed to improvise a new harmony vector.
- (c)
Pitch Adjusting Rate (PAR): HSA uses this parameter in the sub-process of improvisation process called pitch adjustment.
- (d)
Number of iterations (NI) as the termination criteria.
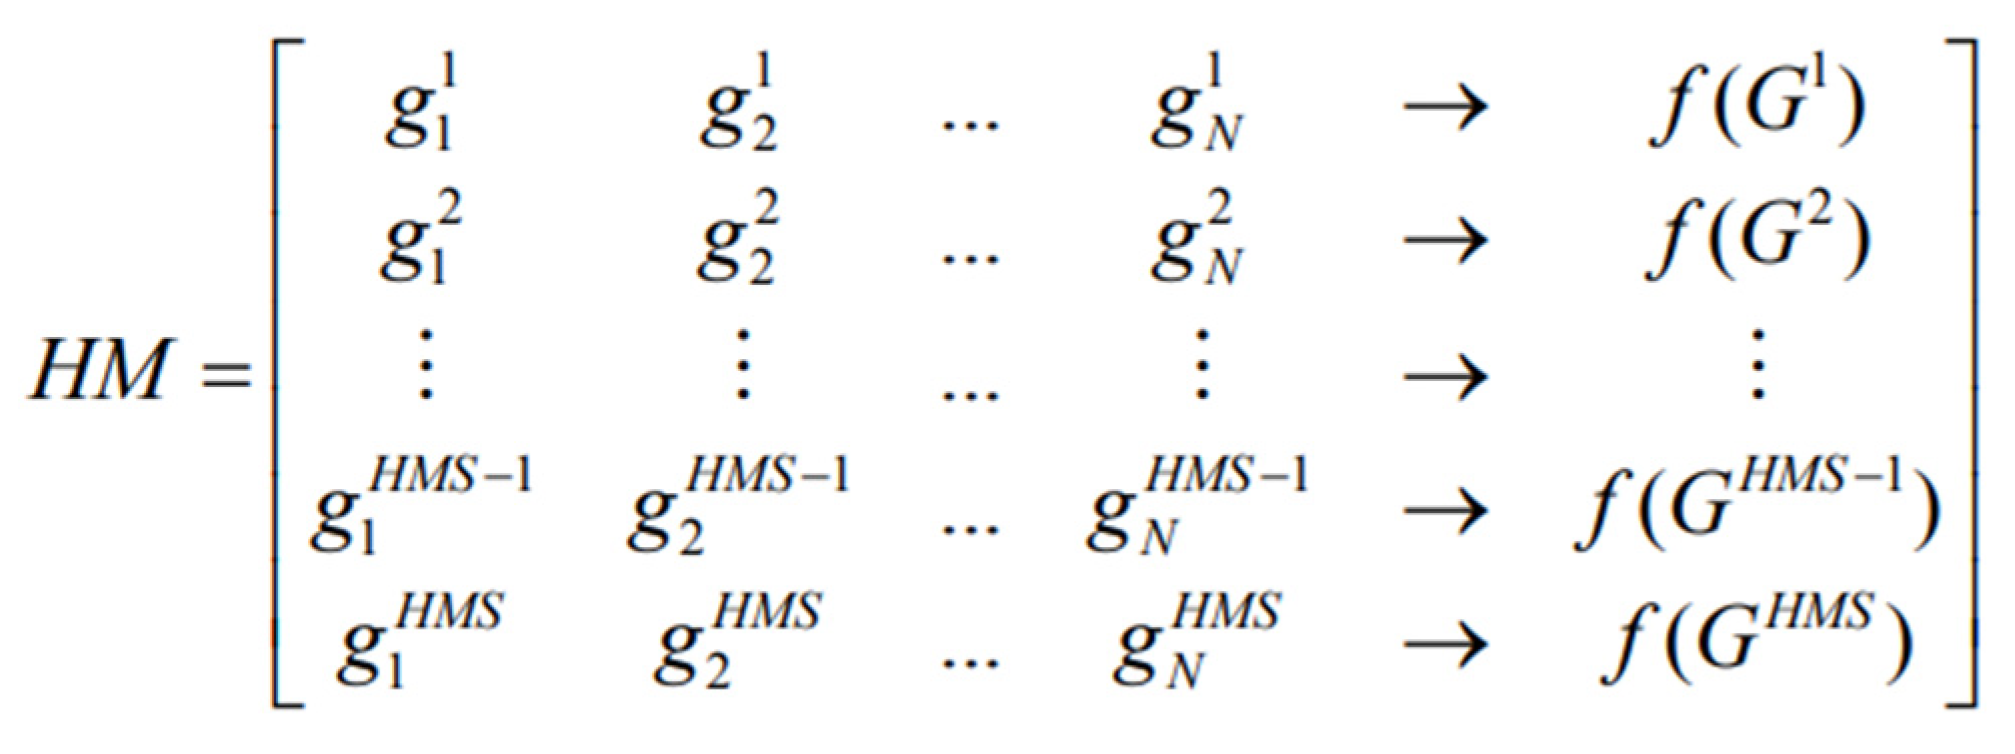
The initial population of Harmony Memory (HM) contains HMS vectors generated randomly in a structure of a two-dimensional matrix.
Figure 1 shows an HM structure where each row represents one chromosome (solution). Based on the fitness values f(G), solutions are reversely arranged in the HM. The fitness value in this work is termed classification accuracy (obtained through the NB classifier, which is based on selected genes). In this work, the HSA adopts the binary-coding scheme for the gene selection problem, where a binary string represents every decision variable.
The main aim of this step is to improvise a new harmony (solution) by utilizing the primary HSA operator. In this step, the diversification (exploration) and intensification (exploitation) in the search space remain, where the HMCR and PAR parameters are the major important factors to intensify or diversify the search, respectively, for solutions improved locally and globally [
24]. In this step, a new harmony is being improvised and involves three steps: (i) memory consideration, (ii) pitch adjustment, and (iii) random consideration.
- (i)
Memory consideration
By basing on HMCR, a new solution is generated. First, a random number, R, is generated within the range [0, 1] and compared to HMCR. Suppose R is fewer than the HMCR (R < HMCR), then the first gene (or decision variable) is chosen from the memory consideration; the second gene, g2, is chosen from , and the process is being repeated. If the R-value is larger than HMCR (R > HMCR), a random consideration process is used to determine the gene. Usually, the selected HMCR value is between 0.7 and 0.95 because if the HMCR is very low, only a few best genes are chosen and will slowly converge. However, if the HMCR is set nearly to 1, nearly all the genes will be employed in the HM. This incremental step ensures that good harmonies consider the new harmony elements.
- (ii)
Pitch adjustment
The second step is pitch adjustment. The pitch adjustment is similar to the genetic algorithm’s mutation procedure. Every gene obtained during the memory consideration process is evaluated to determine if there is a need to be tuned (‘pitch-adjusted’) with the probability PAR or leave it as it is with the probability (1 − PAR). For example, if the value of PAR is 0.3, the probability of tuning the decision variable value is 30%, while (1 − PAR) = (1 − 0.3) = 70% is the probability of not introducing any change to the variable. The adjustment here mutates (flipped or not) the gene from either 0 to 1 or 1 to 0 because only two values, i.e., ‘0’ and ‘1’, exist in binary space. This process employs the PAR, as given in Equation (1):
- (iii)
Random consideration
The third step is random consideration or randomization. This step selects a random value from the possible value range to enhance the diversity of the solution to obtain global optimization. Genes not chosen from the HM with (1 − HMCR) probability are chosen randomly, as depicted in Equation (2) (the possibility of range value for the problem, in this case, is either 0 or 1).
For example, if HMCR = 0.7, the probability of choosing the decision variable value from the HM is 70% (memory consideration), while the probability of selecting a value randomly (random consideration) from the possible range of values of the variable is 30%, i.e., (1 − HMCR).
The improvised harmonies are checked based on the objective function f(G), and should the harmony vector be better than the worst harmony, the worst harmony in the HM will be replaced with the improvised harmony. If not, the new harmony would be ignored.
The NI represents the number of iterations for which the HSA will be repeated. The maximum NI (or classification accuracy, equal to 100%) is regarded as the termination criterion. If the termination criterion is met, the computation will be stopped. If not, steps 3 and 4 are being repeated.
A cadenza (from Italian: kaˈdɛntsa] is generically known as an improvised musical passage played by a soloist while other musicians rest or sustain a note or chord. Usually, a cadenza will occur over the final note in a piece of musical work, and at the end of the cadenza, other orchestra musicians re-enter. During a cadenza, the soloist plays a musical chord sequence moving to a harmonic close, indicating that the performer should return to the most fantastic harmony played in the improvisation process. With respect to HSA, a cadenza could be regarded as the last step taking place at the final stage of the search for the best harmony. The HSA returns the best harmony in this process that was found and stored in the HM, referencing the fitness function f(G).
2.2. Hybridizing an Enhanced HSA with a Filter Method
The HSA for the gene selection problem has been discussed thoroughly in the prior section. The major six steps of the HSA were elaborated in detail. The experiment results tabulated in
Section 3 reveal that the HSA could obtain viable solutions. Still, they were not as impressive as the results reported in the literature, which may be due to the entirely random mechanism of initializing the HM and the fully random selection in the HMCR and PAR procedures. This random mechanism can lead to poor performance and slower convergence, and the difficulty of dealing with high-dimensionality datasets thus becomes high.
To enhance the quality of the solutions, a set of modifications to the HSA mechanism and a filter method are proposed to be hybridized to address the HSA weaknesses. The enhanced HSA is called the Reference Set Harmony Search Algorithm (RSHSA), while the filter method is termed by Kannan [
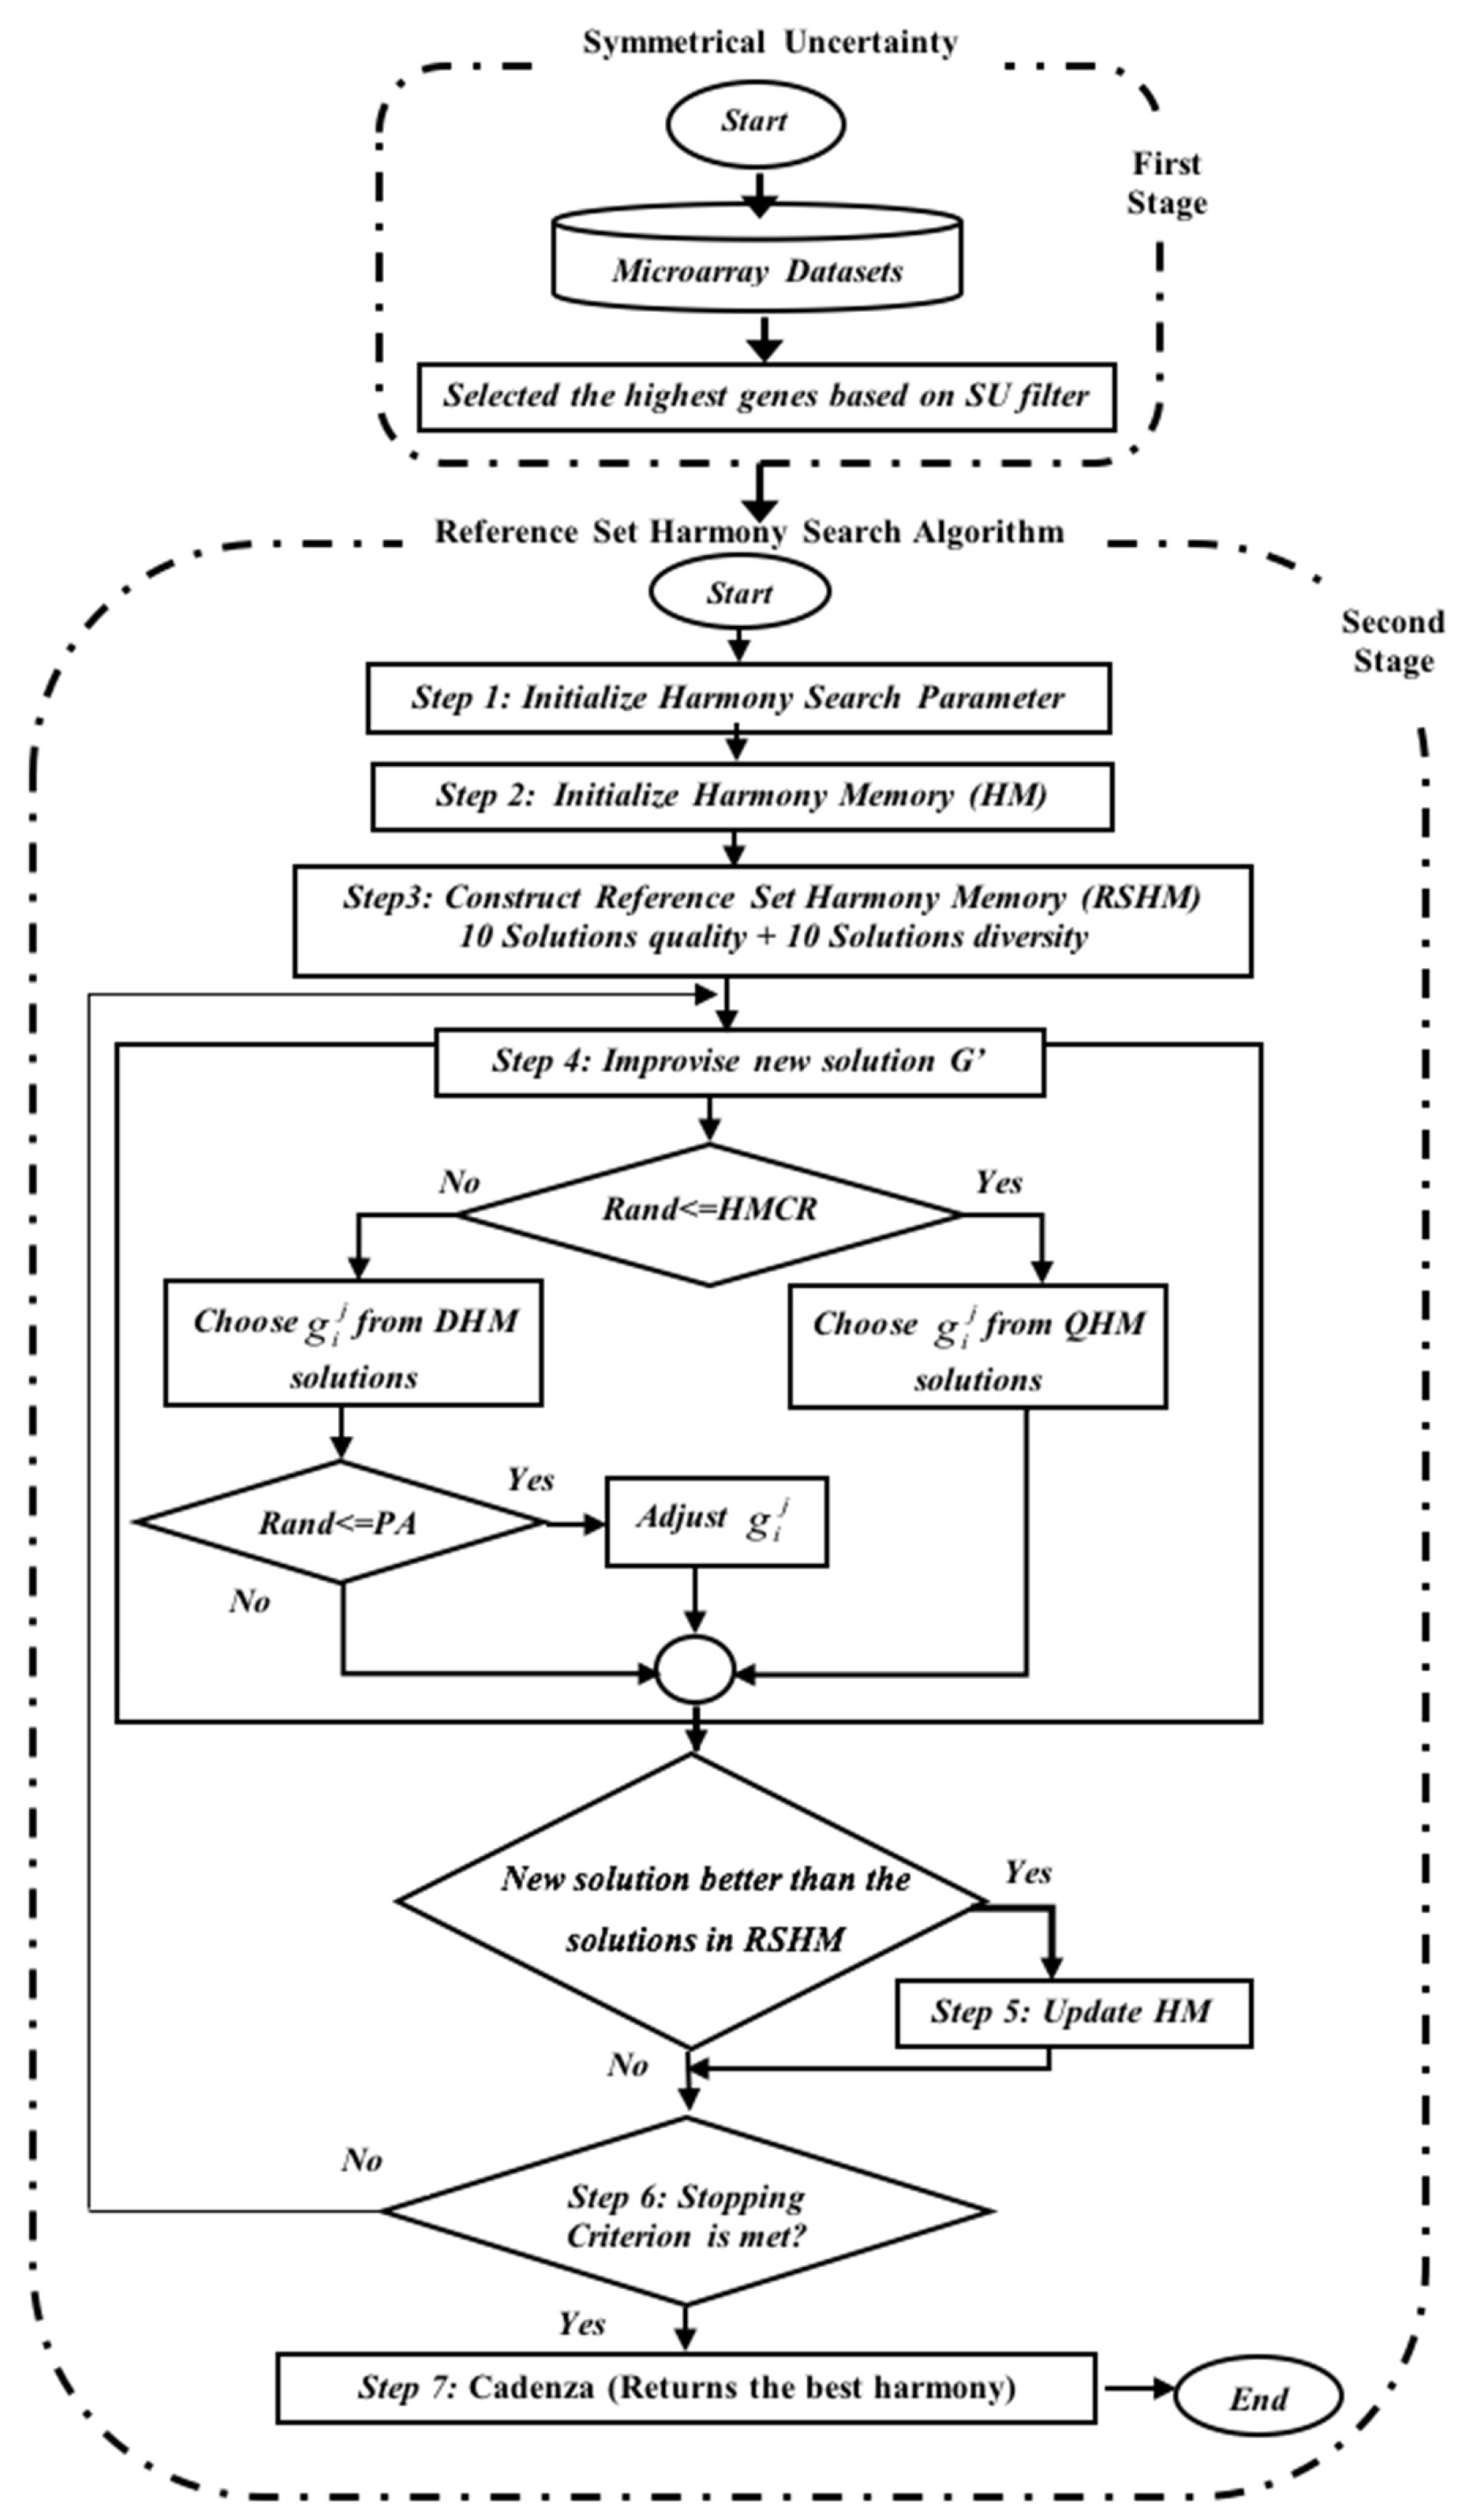
25] as the Symmetrical Uncertainty (SU). The hybridized method is called the SU-RSHSA, which is designed to select the best genes in two stages, as displayed in
Figure 2.
Section 2.3 and
Section 2.4 reveal how SU-RSHSA performs in two stages in detail.
2.3. First Stage: Selecting Genes Using Symmetrical Uncertainty (SU)
The first stage sees the SU filter selecting the gene having the highest SU score for initializing the HM. The second stage sees the RSHSA wrapper (that is, a combination of the RSHSA search strategy with an NB classifier) being employed to identify the gene subset. This stage’s main objective is to eliminate the redundant and irrelevant genes and thus reduce the dataset dimensionality. It is important to obtain an optimal set of genes to eliminate non-informative association information. Moreover, reducing the dimensionality of the dataset with the least information loss will improve the system’s efficiency. According to the SU value, each gene is evaluated using SU and ranked in ascending order.
A SU-based correlation measure is used to measure the goodness of the genes for the classification between the genes and the target concepts. It is employed to help eliminate irrelevant genes. The SU value is computed for every gene, and the ranking of the values is in the order from the highest to the lowest, based on their SU value. Generally, the genes with the highest SU values have a greater probability of being chosen for the next stage, and those with lower SU values are likely to be removed.
Therefore, we choose Fast Correlation-Based Filter (FCBF) in this proposed algorithm, which was earlier introduced by [
26] to achieve the first stage objective. The FCBF is contingent upon the entropy’s information-theoretical concept [
25], a measure of the random variable uncertainty. The variable
X entropy is defined as in Equation (3):
and after observing values of another variable
Y, the definition of entropy of
X is as in Equation (4):
where
) is the prior probability for all values of
X, and
is the posterior probabilities of
X, given the values of
Y. The amounts by which the entropy of
X decreases reflects additional information about
X that is provided by
Y and is termed as the Information Gain (
IG), provided by Equation (5):
Based on Equation (5), a gene
Y is regarded as more correlated to gene
X than to gene
Z, if
[
24].
The information obtained for the two random variables,
X and
Y is symmetrical [
26]. Eom and Zhang [
27] state that the desired property measures the correlation between features is termed as symmetry but is biased in favor of genes with higher values. In ensuring that the values are comparable and that they have the same effect, they must be normalized. Therefore, the symmetrical uncertainty as depicted in Equation (6) which was introduced by [
28] and applied by [
25] is also used in this work:
The IG’s bias towards features that have more values is compensated by Symmetrical Uncertainty. The range of possible values for SU is between 0 and 1 intervals. The value ‘1’ represents knowledge of ‘0’ predicting the value of ‘1’, or vice versa completely (i.e., the knowledge of one feature completely predicts the other) and the value ‘0’ indicates that X and Y are independent (i.e., X and Y are uncorrelated). Thus, a pair of features is treated symmetrically by SU.
2.4. Stage 2: Reference Set Harmony Search Algorithm (RSHSA)
In this stage, the RSHSA explores the gene subset space (which has been filtered by SU) with the highest gene rank score based on the
SU value from the first stage. Therefore, the complexity of the search gene space is reduced to a smaller searching space, thereby reducing the computational effort of the induction algorithm. The highest gene in the rank is chosen to be used in the second stage (the wrapper phase). A wrapper method that combines RSHSA and an NB classifier is employed in the second stage in accomplishing the gene subset selection. The goodness of gene subsets is analyzed using classification accuracy techniques. The RSHSA consists of the seven major steps as depicted in
Figure 2:
Step 1: Initialization of the parameters of the RSHSA, namely, the Reference Set Harmony Memory Size (RSHMS), Quality Harmony Memory Size (QHMS), Diversity Harmony Memory Size (DHMS), HMCR, PAR, and NI;
Step 2: Initialization of the HM;
Step 3: Constructing the RSHM;
Step 4: Improvisation of a new harmony (G′);
Step 5: Updating the RSHM;
Step 6: Inspecting the stopping criterion; and
Step 7: Cadenza returns the best harmony.
These steps show that the RSHSA steps are similar to HSA, but the main difference lies in the method used to initialize the HM; in the former, the HM is initialized randomly, whereas the HM in the SU-RSHSA is initialized with reference to top-ranked genes from the first stage (
Figure 2). Therefore, please kindly note that this section on RSHSA only describes the modified steps (i.e., Steps 2–4, and 6) because Steps 5 and 7 are similar to the HSA discussed in the previous section.
The proposed RSHSA algorithm begins with similar steps in HSA, initialization. However, in the basic HSA, the initialization step of the Harmony Memory (HM) is randomly filled with candidate solutions, and the improvisation process is based on this HM. However, in RSHSA, the proposed methods attempt to enhance HSA by introducing the following modifications:
- (i)
the initialization of the HM mechanism is enhanced by using the RS mechanism in generating a new HM called the Reference Set Harmony Memory (RSHM);
- (ii)
the fully random selection mechanism in the HMCR and PAR procedures is modified and guided by referring to the quality and diversity of solutions from the RSHM; and
- (iii)
the update mechanism of HM is modified. However, the stopping criterion is unmodified and is the same as that used in the HSA, as presented above. The following subsections describe these modifications.
2.4.1. Modification 1: Construct the Reference Set Harmony Memory (RSHM)
In the basic HSA, the initialization step of the HM is randomly filled with candidate solutions, and the improvisation process is based on this HM. However, in this paper, instead of using a fully random mechanism of HM used in the HSA, the proposed RS is employed to construct a new harmony called the RSHM as a first modification. Algorithm 1 illustrates the pseudo-code for the construction of the RSHM. The size of the evolving RSHM set of elite solutions has a comparatively small or moderate size (20), whereas the RSHM has a wide collection of elite solutions selected systematically.
| Algorithm 1 Construction of the Reference Set Harmony Memory |
1: begin
2: for I =( 1 to HMS) do
3: RSHM = ∅;
4: Divide the RSHM into two sets
5: Select the top 10 quality harmony memory solutions from the HM
and save it in Quality Harmony Memory (QHM)
6: Select the most diverse harmony memory solutions from the QHM and save it in
Diversity Harmony Memory (DHM)
7: Order the solutions in QHM according to their objective function
8: Order the solutions in DHM according to their dissimilarity value
9: end for
10: end |
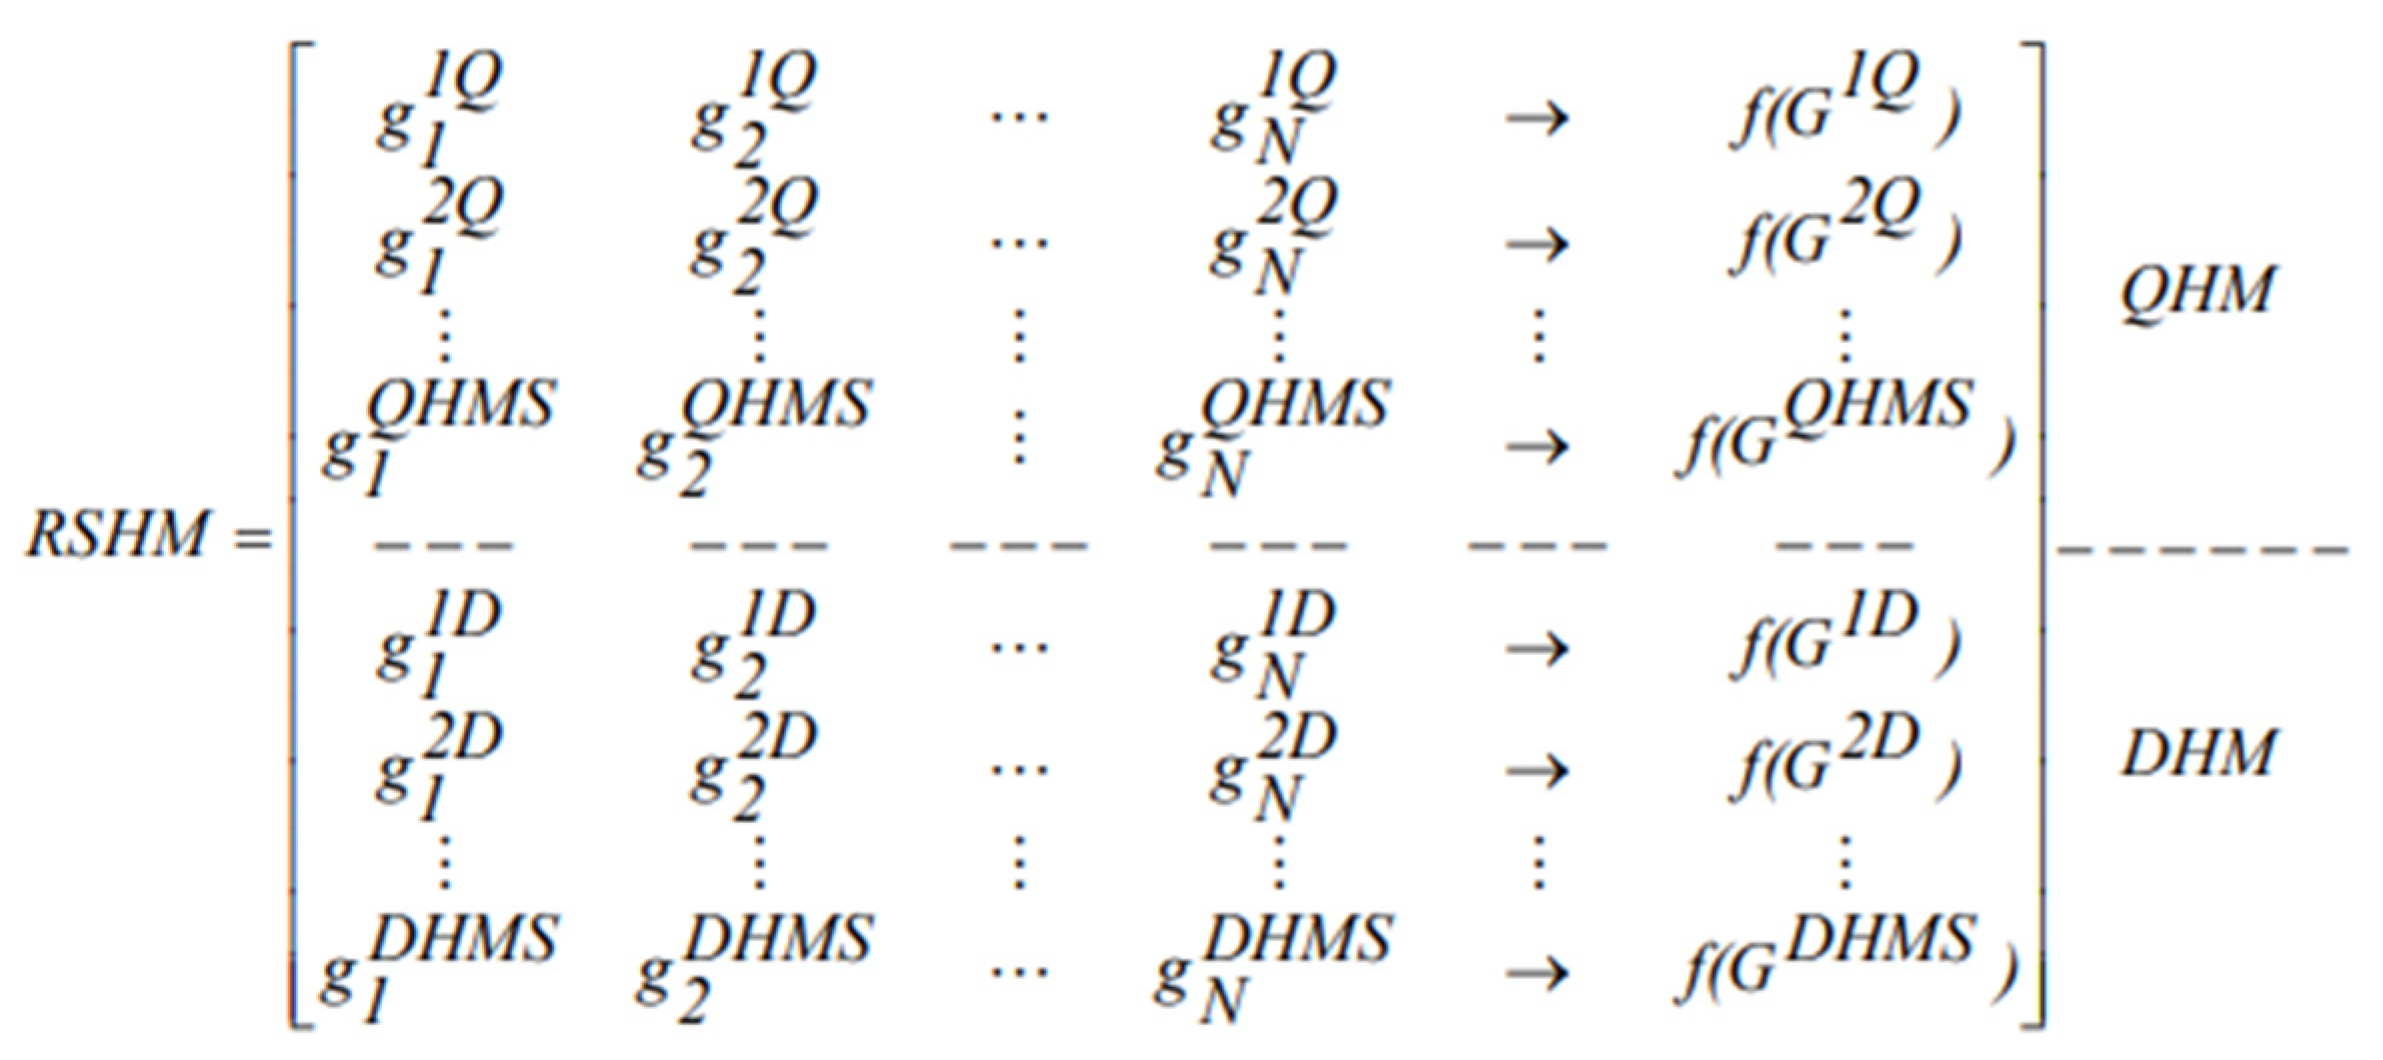
In the third step of the RSHSA, an initial reference set with the size of 20 harmonies, called the RSHM (
Figure 3), is created (only at the first iteration) based on the HM. These are elite reference solutions chosen systematically from the HM, where the highest quality and diversity solutions are considered. This ensures the search process is diverse while maintaining high-quality solutions [
7], whereby elite solutions are identified in this work following Mansour et al. [
29], whereby in their study, the size of the RSHM is equal to 0.4. RSHM is divided into two subsets, QHM and DHM (RSHM = QHM + DHM), as follows:
- (a)
Select the top 10 quality solutions from the initial HM and store them in QHM;
- (b)
Measure the diversity of the remaining solutions in the HM. This is completed by measuring the similarities to the ten best-quality solutions in the QHM. This process is carried out by counting the similarity between the solutions;
- (c)
From the HM, the best diverse solutions are chosen from the 10 solutions that are least similar to the best-quality ones in the QHM and are stored in the DHM, as previously described [
30]. The least similar solutions have other solution structures that are obtained from various areas in the search space.
Figure 3.
Reference Set Harmony Memory (RSHM).
Figure 3.
Reference Set Harmony Memory (RSHM).
2.4.2. Modification 2: Improvise a New Harmony Based on the RSHM
The second modification in the RSHSA addresses methods to combine the existing solutions in the RSHM (QHM+DHM) and thereby improvise new better-quality solutions. The improvised solution in the basic HSA is randomly filling the HM. The HM has a significant reliance on randomization in choosing the solutions. These solutions are selected during the improvisation step. However, the RSHSA improvised solution is unlike that of the basic HSA because the improvised solution is based on the RSHM, where the solutions with better fitness values (higher-quality solutions) and the solutions with the maximum, minimum distances from the high-quality harmonies have a higher chance of being selected to improvise new harmonies. This is based on the fact that musicians usually select a relatively good pitch from their most recent memory to improvise the best harmonies. The improvisation process in the RSHSA invokes the following processes in succession:
- (a)
First, a random number R is being generated in [0, 1].
- (b)
If the random number R that is generated is less than HMCR, then the value of the first decision variable,
, of the new solution, G′, is selected from
. The second gene is chosen from
, and the process is repeated. Otherwise, the decision variable value of
(that are not picked from the QHM with the probability of (1 − HMCR)) is chosen from the DHM, as shown in Equation (7). Thus, the algorithm preserves or even improves the good characteristics of the original solutions from the QHM and DHM.
- (c)
Next, the pitch adjusting process is carried out using the predetermined PAR value. The role of the pitch adjusting process is making the adjustment to the decision variable value chosen previously from the DHM into neighboring value. Every gene obtained from the DHM will be evaluated in deciding if there is a need for it to be tuned (pitch-adjusted) with the probability of PAR or leave it as it is with the probability (1 − PAR) through the generation of a random number between [0, 1]. Should the number generated be lower than the PAR value, the value of the decision variable should be adjusted. Otherwise, the decision variable value must remain unchanged with probability (1 − PAR). The decision variable value is changed by mutating the gene from 1 to 0 or vice versa. The improvisation process is being repeated until a complete harmony is generated.
As it can be observed, the RSHSA controls the balance between the quality and the diversity of the solutions with the use of the values of HMCR and PAR. If the values of HMCR were too high, the new harmony would be inherent to most of the decision variables from the QHM, whereas a small value of HMCR will randomly generate most of the decision variables from the DHM. Therefore, by taking the quality and diversity of the solutions in the RSHM into consideration while improvising a new harmony, it may also help in generating a better harmony. On the other hand, the diversification process in the RSHSA is controlled by the PAR value, and it is applied only to the DHM. A high value of PAR implies a high diversification, whereas a small value of PAR implies less diversification in the search process (the PAR is similar to a mutation operator in a GA). Algorithm 2 depicts the improvisation step’s pseudo-code but only shows the proposed modifications.
| Algorithm 2 Pseudo-Code of the Improvisation Process in the Reference Set Harmony Search Algorithm |
1: for i = 1 to the maximum number of iterations (NI)
2: = empty
3: for j = 1 to number of decision variables
4: r1 = uniform random number between [0, 1]
5: if (r1 < HMCR)
6: = randomly selected from QHM j
7: else
8: = randomly generated from DHM (with probability 1 − HMCR) j
9: r2 = uniform random number between [0, 1]
10: if (r2 < PAR)
11: pitch adjusted mutate g i j
12: else
13: do not change the decision variable value
14: end if
15: end if
16: Add to HM
17: end for j
18: end for i |
2.4.3. Modification 3: Update Reference Set Harmony Memory
The third modification in the RSHSA addresses updating the RSHM. The RSHSA has different update strategies for updating the RSHM when there is a better quality of solution, or a more diverse solution obtained.
In this step, the improvised harmonies are checked by basing on the objective function f(G′). The improvised harmony would be replacing the worst solution in the HM should the quality of the new harmony turn out to be better (replacing solution with the worst quality in QHM by the newly improvised solution G′; if not, replace the solution in DHM that shows the worst diversity (more similarity)). Otherwise, the new harmony is discarded.
As it can be observed, the update process relies on memory usage, which is limited, to sustain a good balance between the search’s diversification and intensification and can cover various promising areas in the solution space, which enables it to eliminate solution duplications. In contrast, in the HSA, the update process of the search relies only on the relative fitness function value.
2.5. Datasets
The experiments were carried out on a collection of 10 machine learning datasets from the University of California at Irvine repository that could be freely accessed from
http://csse.szu.edu.cn/staff/zhuzx/Datasets.html (accessed on 30 November 2021).
Table 1 describes the datasets used in this paper. These datasets were chosen to test the proposed algorithm’s effectiveness in handling varying dimensionalities. As shown in
Table 1, the datasets used for this research suffer samples imbalance. There is huge discrimination between the dataset regarding the number of genes across the selected datasets.
2.6. Parameter Settings
Table 2 reveals the parameter settings for the algorithm proposed. In the SU stage of this approach, the SU filter is terminated after the top 100 genes have been selected, as per the recommendation of [
31].
The comparisons in this paper are performed in relation to the accuracy of classification, the minimal number of genes selected, and computational time. In addition, a statistical test (Wilcoxon sum rank test) is carried out to identify if significant disparities between the proposed methods present with regards to the minimal chosen genes and the classification accuracy. The overall purpose of this comparison is to evaluate the effectiveness of using an RS mechanism and a SU filter in an HSA to gain high classification accuracy based on the obtained minimal number of genes.
3. Results
The algorithms proposed were being implemented in the Java programming language and are based on the WEKA environment [
32]. The experiments were run on an Intel Core i5-2450M–2.5 GHz CPU with 4 GB of RAM. The NB classifier with 10-fold cross-validation as per the recommendation of [
33] is used in validating and assessing the solutions generated. Four comparisons are carried out: (i) a comparison of HSA with RSHSA; (ii) a comparison of HSA with SU-RSHSA; (iii) a comparison of RSHSA with SU-RSHSA; and (iv) a comparison of our proposed methods with state-of-the-art methods.
In this experiment, we evaluated and compared our results with HSA and evaluated using 10-fold cross-validation on each dataset. Naïve Bayes classifier was used in this experiment to collect the classification accuracy. The datasets were divided into two segments: the first segment with 90% of the dataset was employed to train or learn a model, and the other 10% that formed the second segment was used to validate the model. The procedure is repeated 31 times.
3.1. Results of Using the Reference Set Harmony Search Algorithm
3.1.1. Classification Accuracy
The results that
Table 3 presents below show a comparison of the performance of the RSHSA and HSA. For each dataset,
Table 3 illustrates two pieces of information: the average accuracy and the average computing time over 31 independent runs. The best results for every dataset are highlighted in bold.
From
Table 3, it is evident that the RSHSA achieves higher classification accuracy as compared to the HSA in six of the 10 datasets. Moreover, it can be noted from
Table 3 that the RSHSA performed faster than the HSA in all datasets. This may be due to the lower number of solutions in the RSHM compared with the number of solutions in the original HM. The RSHSA performed faster than the HSA in all datasets. This may be due to the lower number of solutions in the RSHM when compared to the number of solutions in the original HM. The average running time for the HSA and the RSHSA was about 183 and 142 s, respectively. Thus, the HSA is around 25.23% faster on average than the RSHSA.
3.1.2. Selected Genes
Table 4 shows the average number of genes selected by RSHSA and HSA. A lower average number of selected genes is indicative of better performance. These outcomes show the RSHSA’s ability to obtain fewer genes in most datasets (seven out of 10, except for ALL-AML-3C, Colon, and Breast). The reduction in the size of the gene subsets also implies a lower level of search space complexity; the subsets with a smaller number of genes have a smaller search space, which in turn implies that less computational processing time is required.
From
Table 4, it can be seen that the RSHSA outperforms the HSA because the RSHSA finds fewer genes for seven out of 10 datasets in comparison with the HSA method. By referring to the outcomes in
Table 3 and
Table 4, the RSHSA overcomes the shortcomings of the HSA and outperforms the HSA in most datasets and that it can obtain high accuracy of classification with a minimal number of selected genes, which is because of the reasons laid out below:
- (a)
The proposed changes that use the RS mechanism appear to enhance the initialization of the initial HM because this mechanism gives a deterministic selection of a reference set of elite solutions with regards to the quality and diversity, which aids the algorithm to better exploit and explore the search space, which in turn improves the algorithm’s ability to improvise better solutions. In addition, the RS mechanism has provided a chance for the high-quality solution to survive during the improvisation process.
- (b)
The improvisation process is based on structured solution combinations that are contingent upon the quality and diversity of the solutions based on the QHM and DHM, respectively, where they are not simply relying on randomization.
- (c)
The search has evolved as a strategic update to preserve the diversity and quality of the solutions and avoid the duplication of solutions.
3.1.3. Statistical Test
In this section, a statistical test (Wilcoxon sum rank test) is carried out to identify if a significant difference between the proposed RSHSA and HSA methods is present with regards to determining the accuracy of the classification and the minimal selected genes. The purpose of this comparison is to evaluate the RSHSA effectiveness in obtaining high classification accuracy based on the obtained minimal genes.
The results are listed in
Table 5 with a 95% significance interval (α = 0.05).
p-values that do not show significant differences are shown in bold. The tabulated
p-values reveal that there is a significant difference between the RSHSA and HSA.
Table 3 and
Table 4 present the same pattern where RSHSA produces different quality of solutions compared to HSA. Therefore, it can be concluded that the use of an RS in the HSA (RSHSA) leads to superior performance over the HSA due to the ability of the RSHSA to improvise good-quality solutions that are better than the solutions in the HM where it keeps updating the HM at each iteration, which leads to diverse solutions in the HM, i.e., the diversity is maintained throughout the search process.
3.2. Results of Using the HSU and the RSHSA
To measure the merits of incorporating SU into the RSHSA, the SU-RSHSA results are compared with the ones gained by using the HSA (without a filter). The importance of the combination of an SU filter and an RSHSA in a single process is the focus of this comparison process.
3.2.1. Classification Accuracy
Table 6 reveals the comparison outcome of the HSA and the SU-RSHSA on the 10 datasets.
Table 6 reveals two pieces of information for every dataset: the average accuracy and the computing time over 31 independent runs. The best outcomes for every dataset are highlighted in bold.
Table 6 shows that the SU-RSHSA outperforms its competitor (HSA) on all 10 datasets in terms of accuracy. Moreover, it can be noted that the SU-RSHSA performed faster than the HSA on all datasets. This may be due to the algorithm in the wrapper stage because it explores only a reduced number of genes that are generated by the filter stage. Hence, the feature space’s complexity is being reduced to a smaller search space, thus reducing the computational effort in the classification algorithm.
3.2.2. Selected Genes
Table 7 reveals the average number of the genes selected of the SU-RSHSA and the average number of the chosen genes of the HSA. A lower average number of chosen genes indicates better performance, while best outcomes are given in bold. The results show that the SU-RSHSA can select fewer genes in 6 out of 10 datasets. The tabulated result shows the redundant and irrelevant genes have been eliminated effectively by the SU-RSHSA.
Based on the results in
Table 6 and
Table 7, it can be observed that all solutions provided by the SU-RSHSA have a classification rate of over 80%. With regards to the number of selected genes, the SU-RSHSA was able to obtain fewer than 20 selected genes on average for eight of the datasets. This result suggests that the significant improvement that is achieved by the SU-RSHSA compared with the HSA, i.e., finding small subsets of genes with high accuracy of classification, occurs because it uses SU in selecting genes with the highest effectiveness (based on the SU evaluation) when initializing the HM of the RSHSA. This finding agrees with prior research on the combination of a filter with the wrapper in one method, which normally has achieved very good results compared to the wrapper alone [
34].
Figure 4,
Figure 5,
Figure 6,
Figure 7,
Figure 8,
Figure 9,
Figure 10,
Figure 11,
Figure 12 and
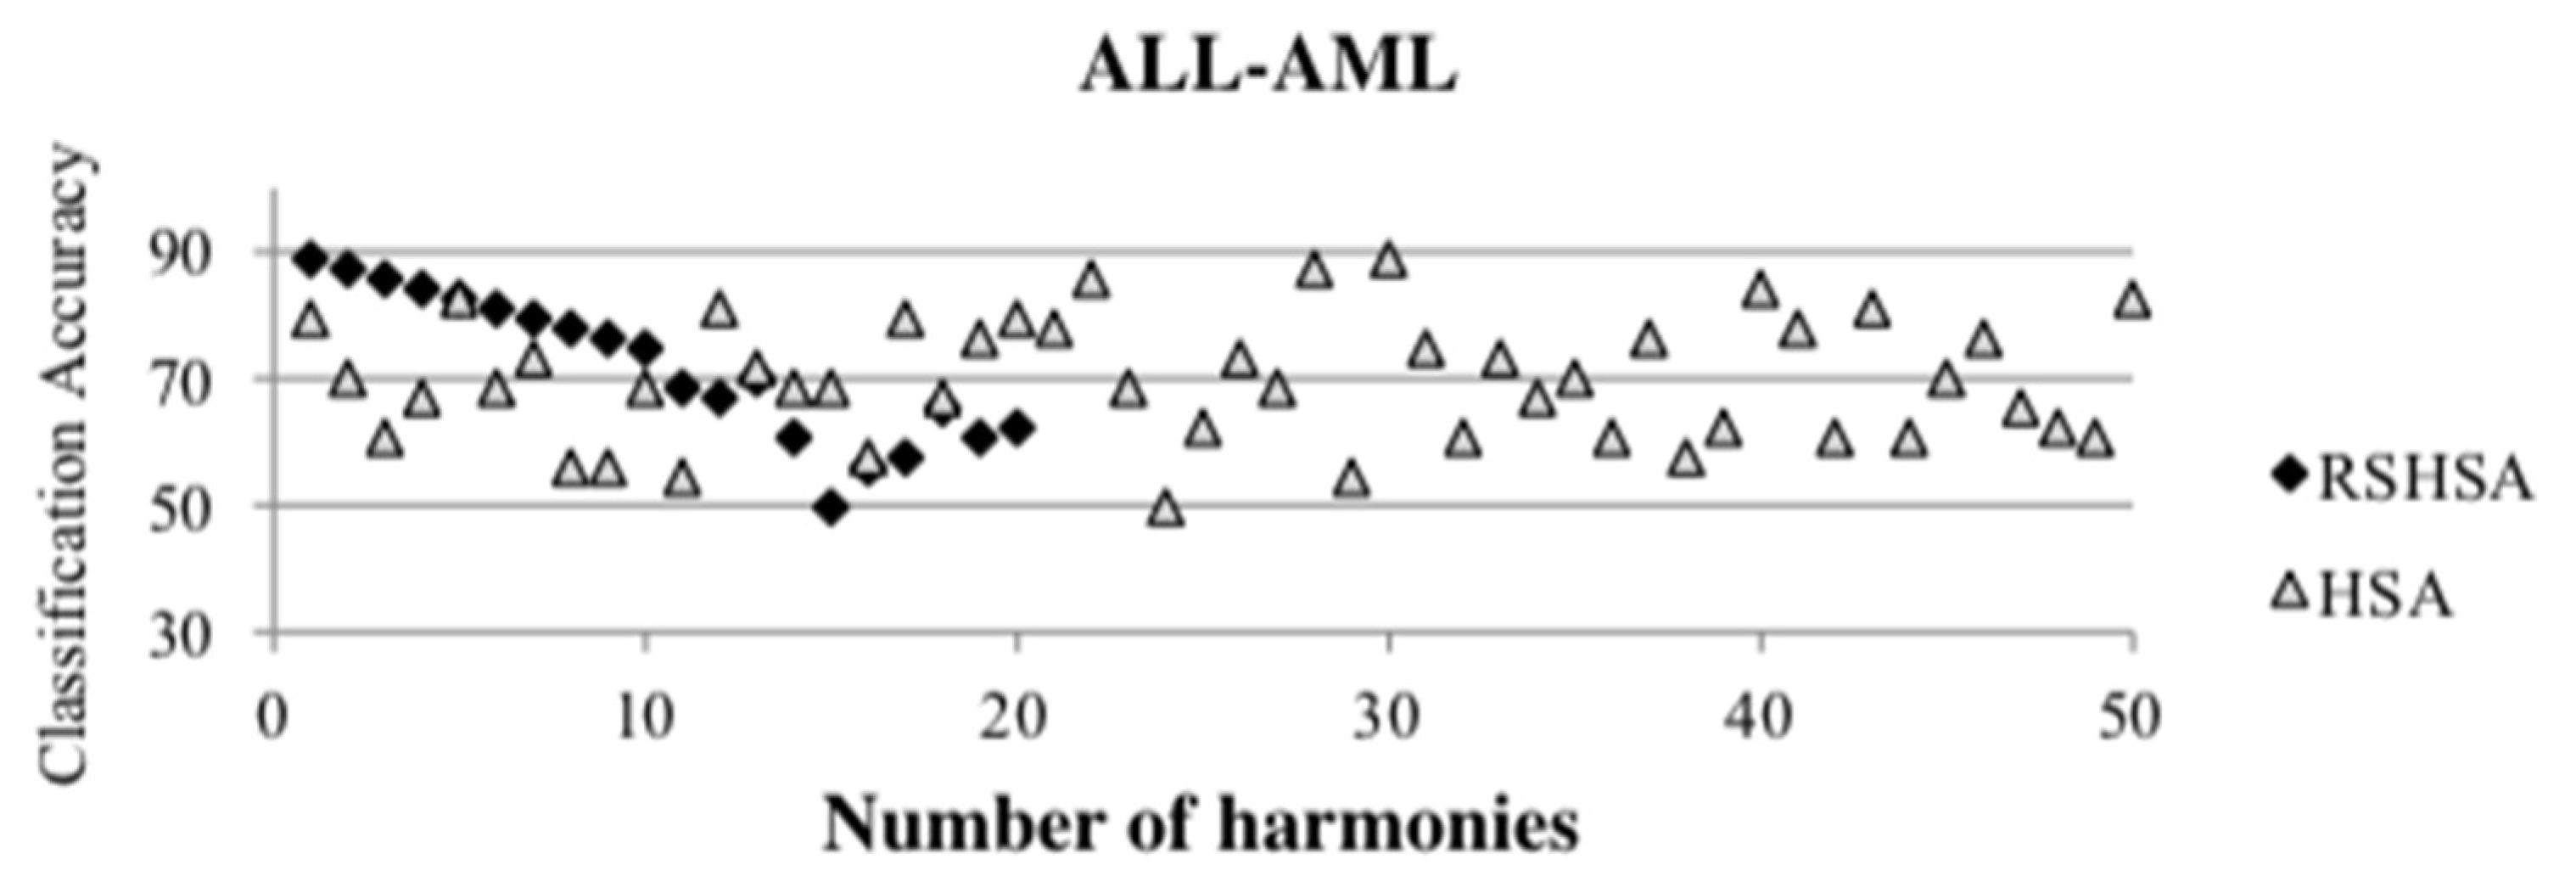
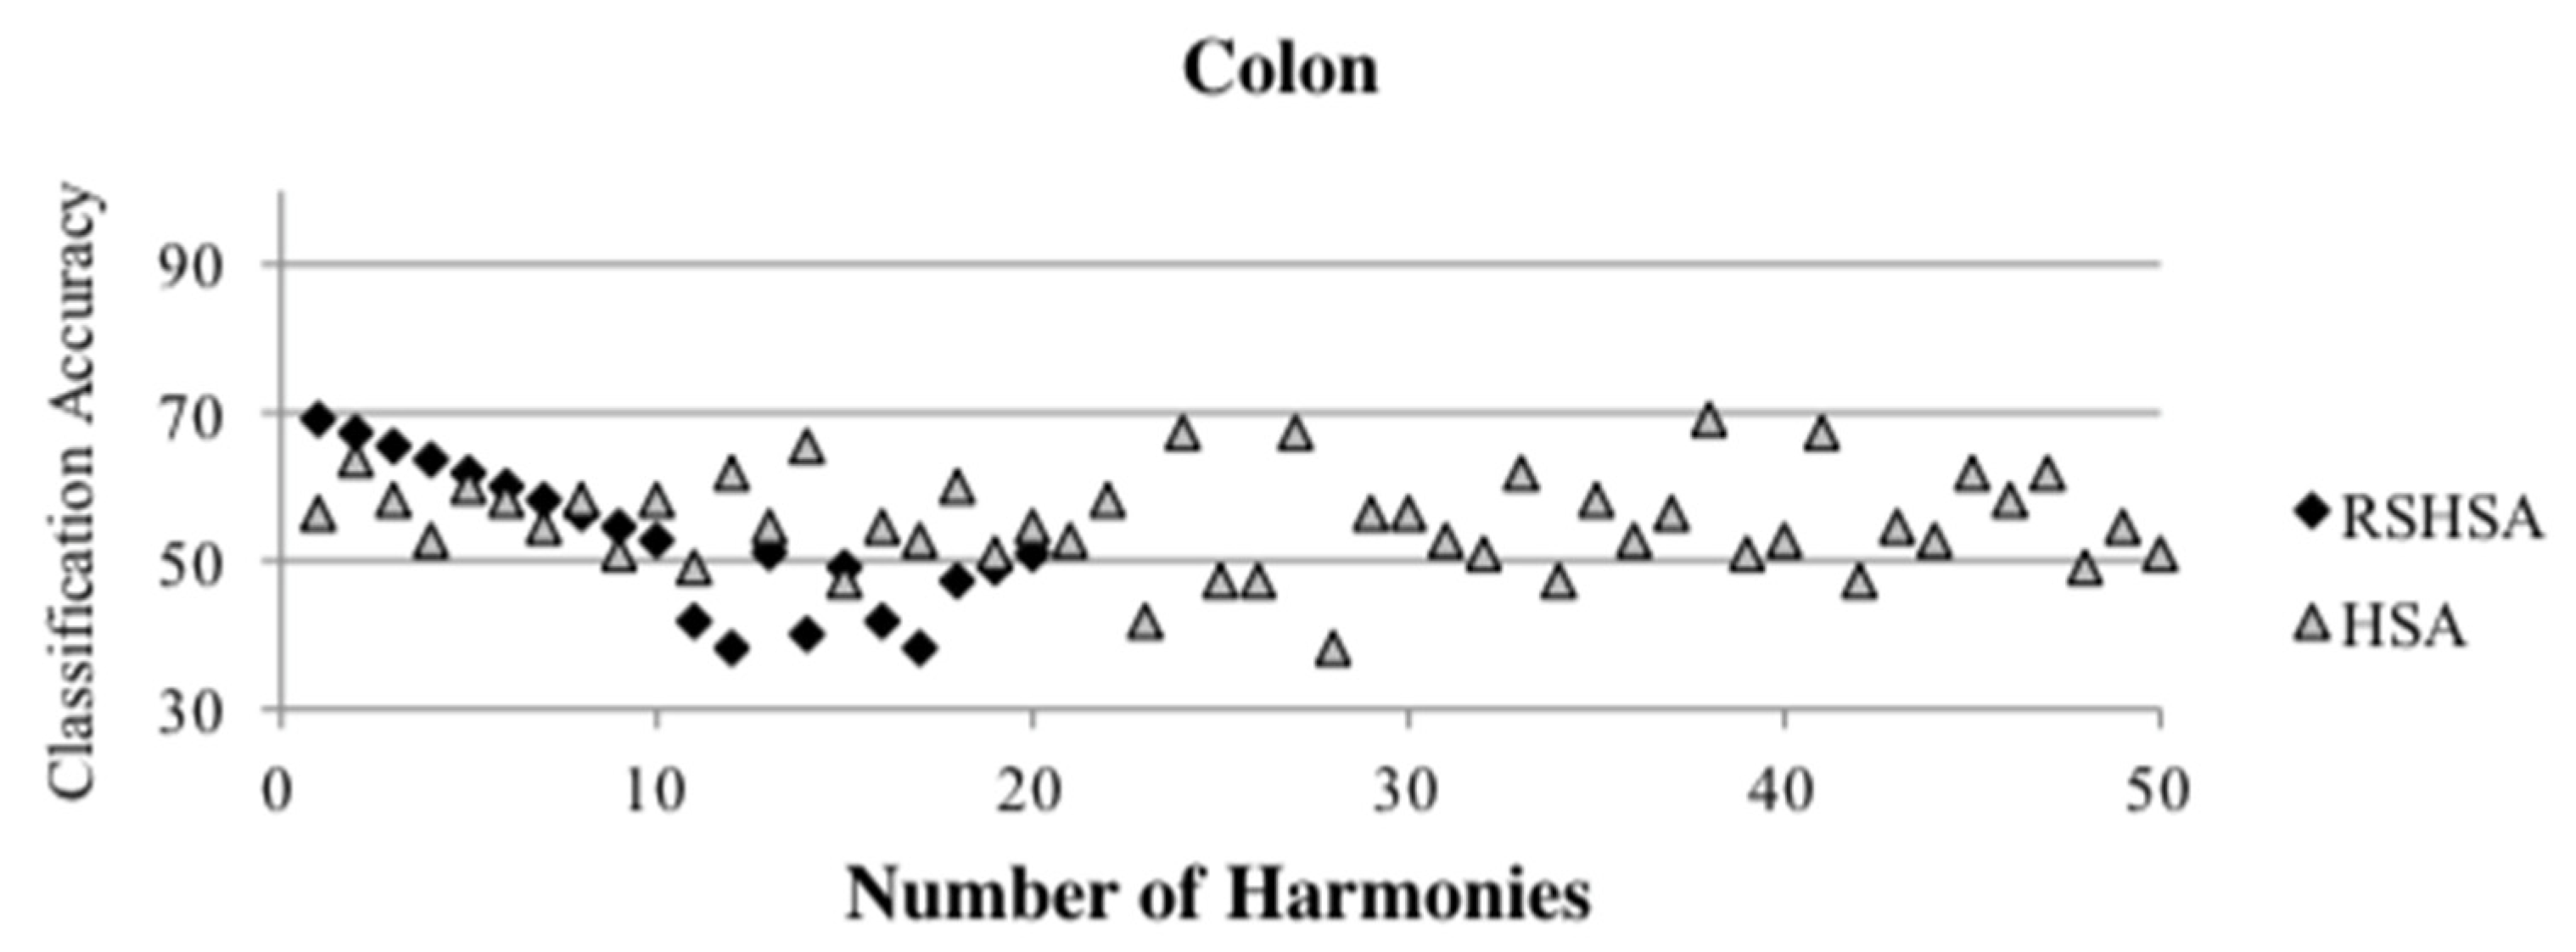
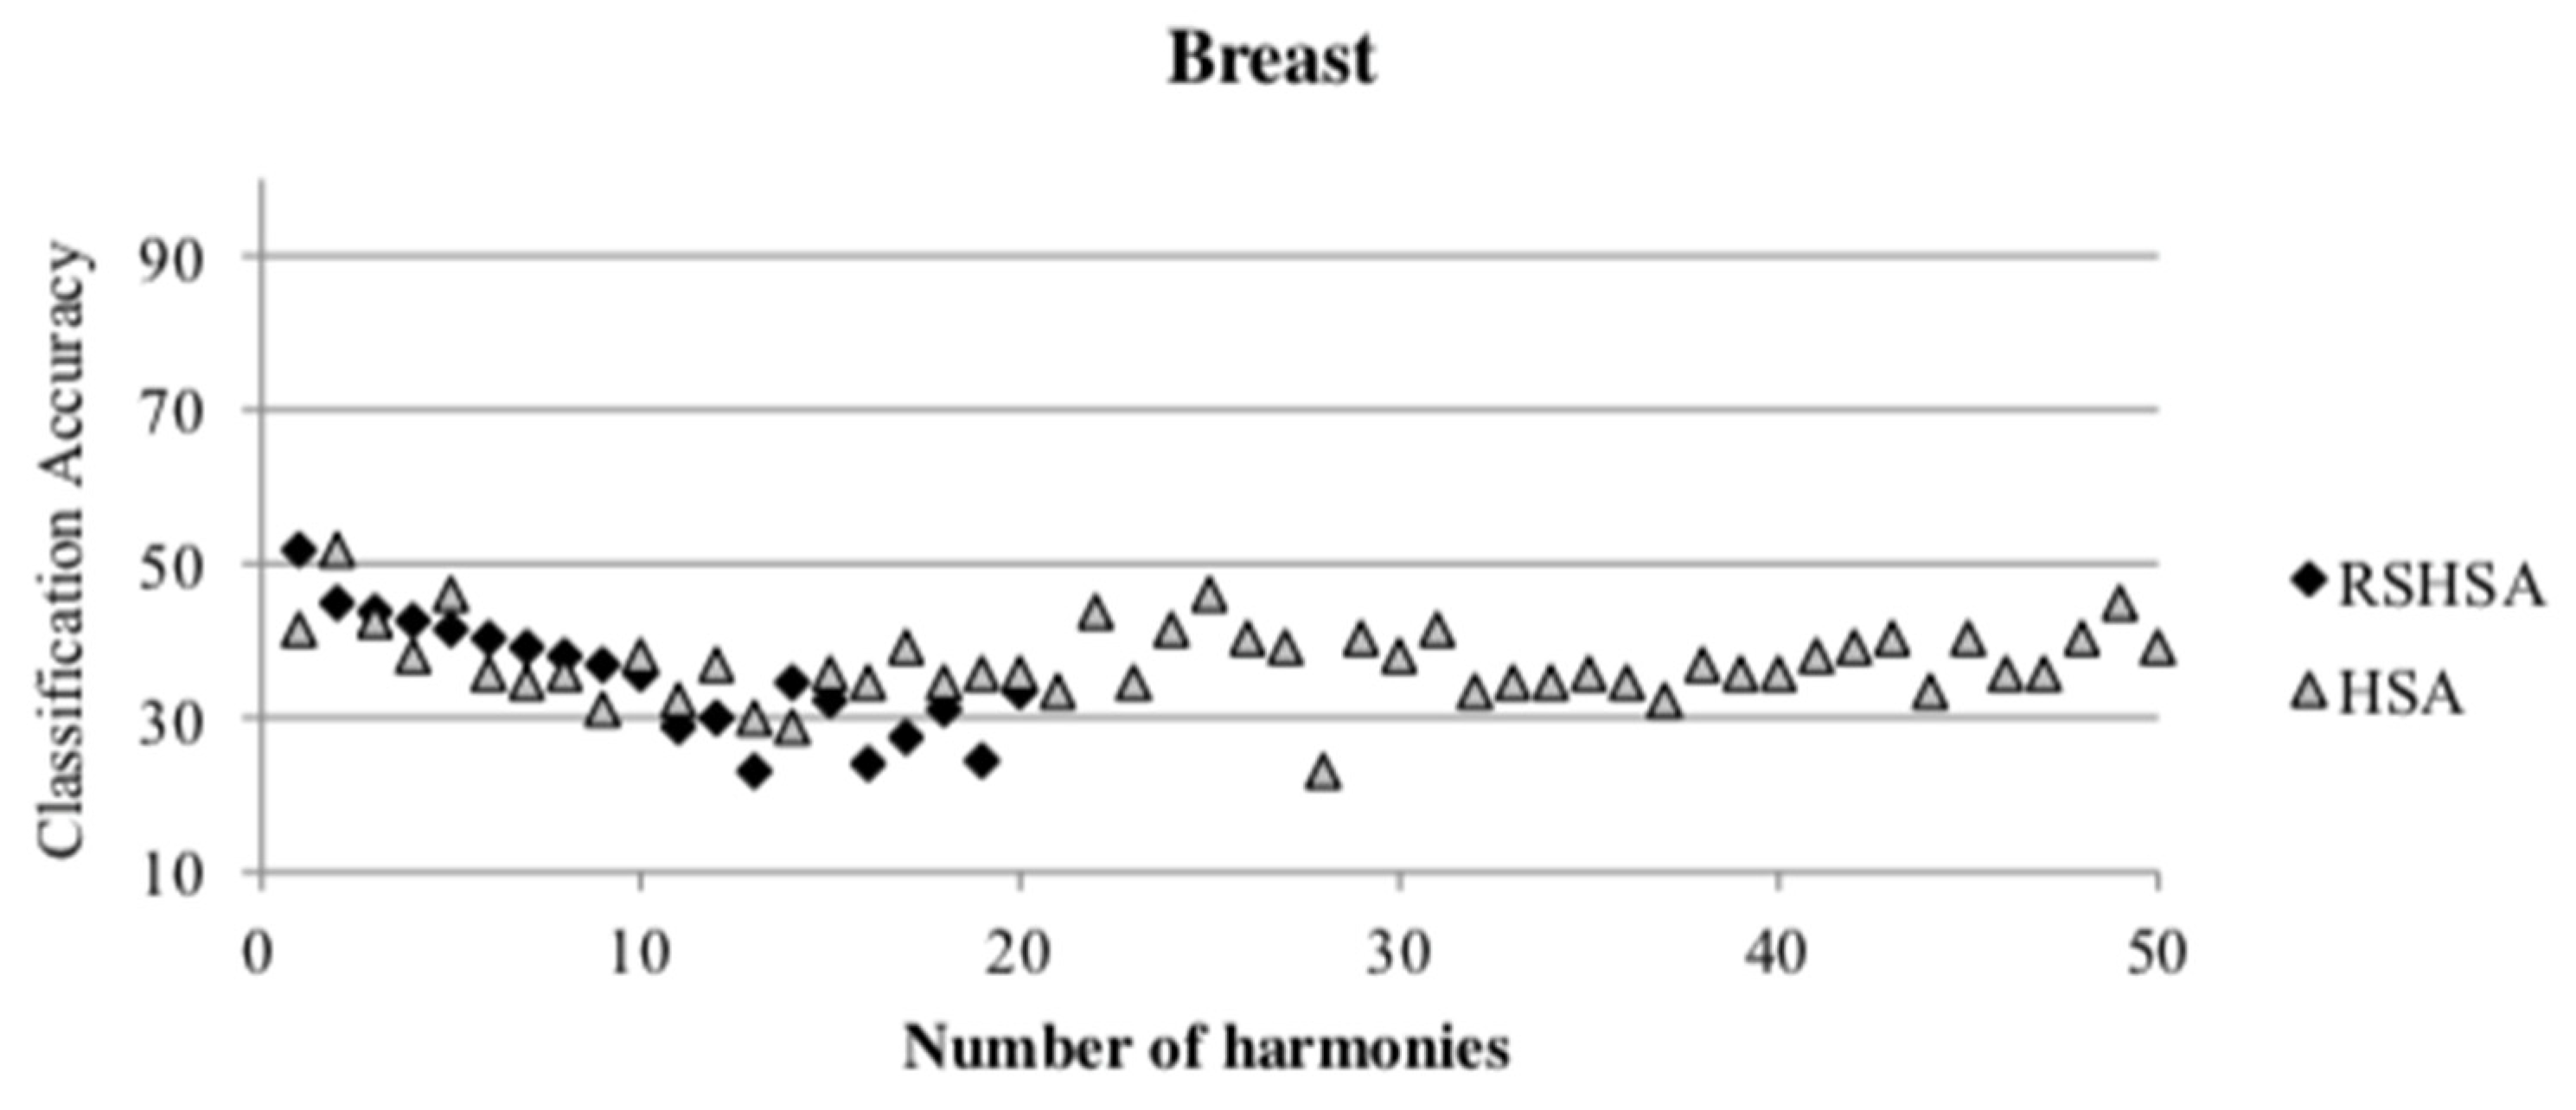
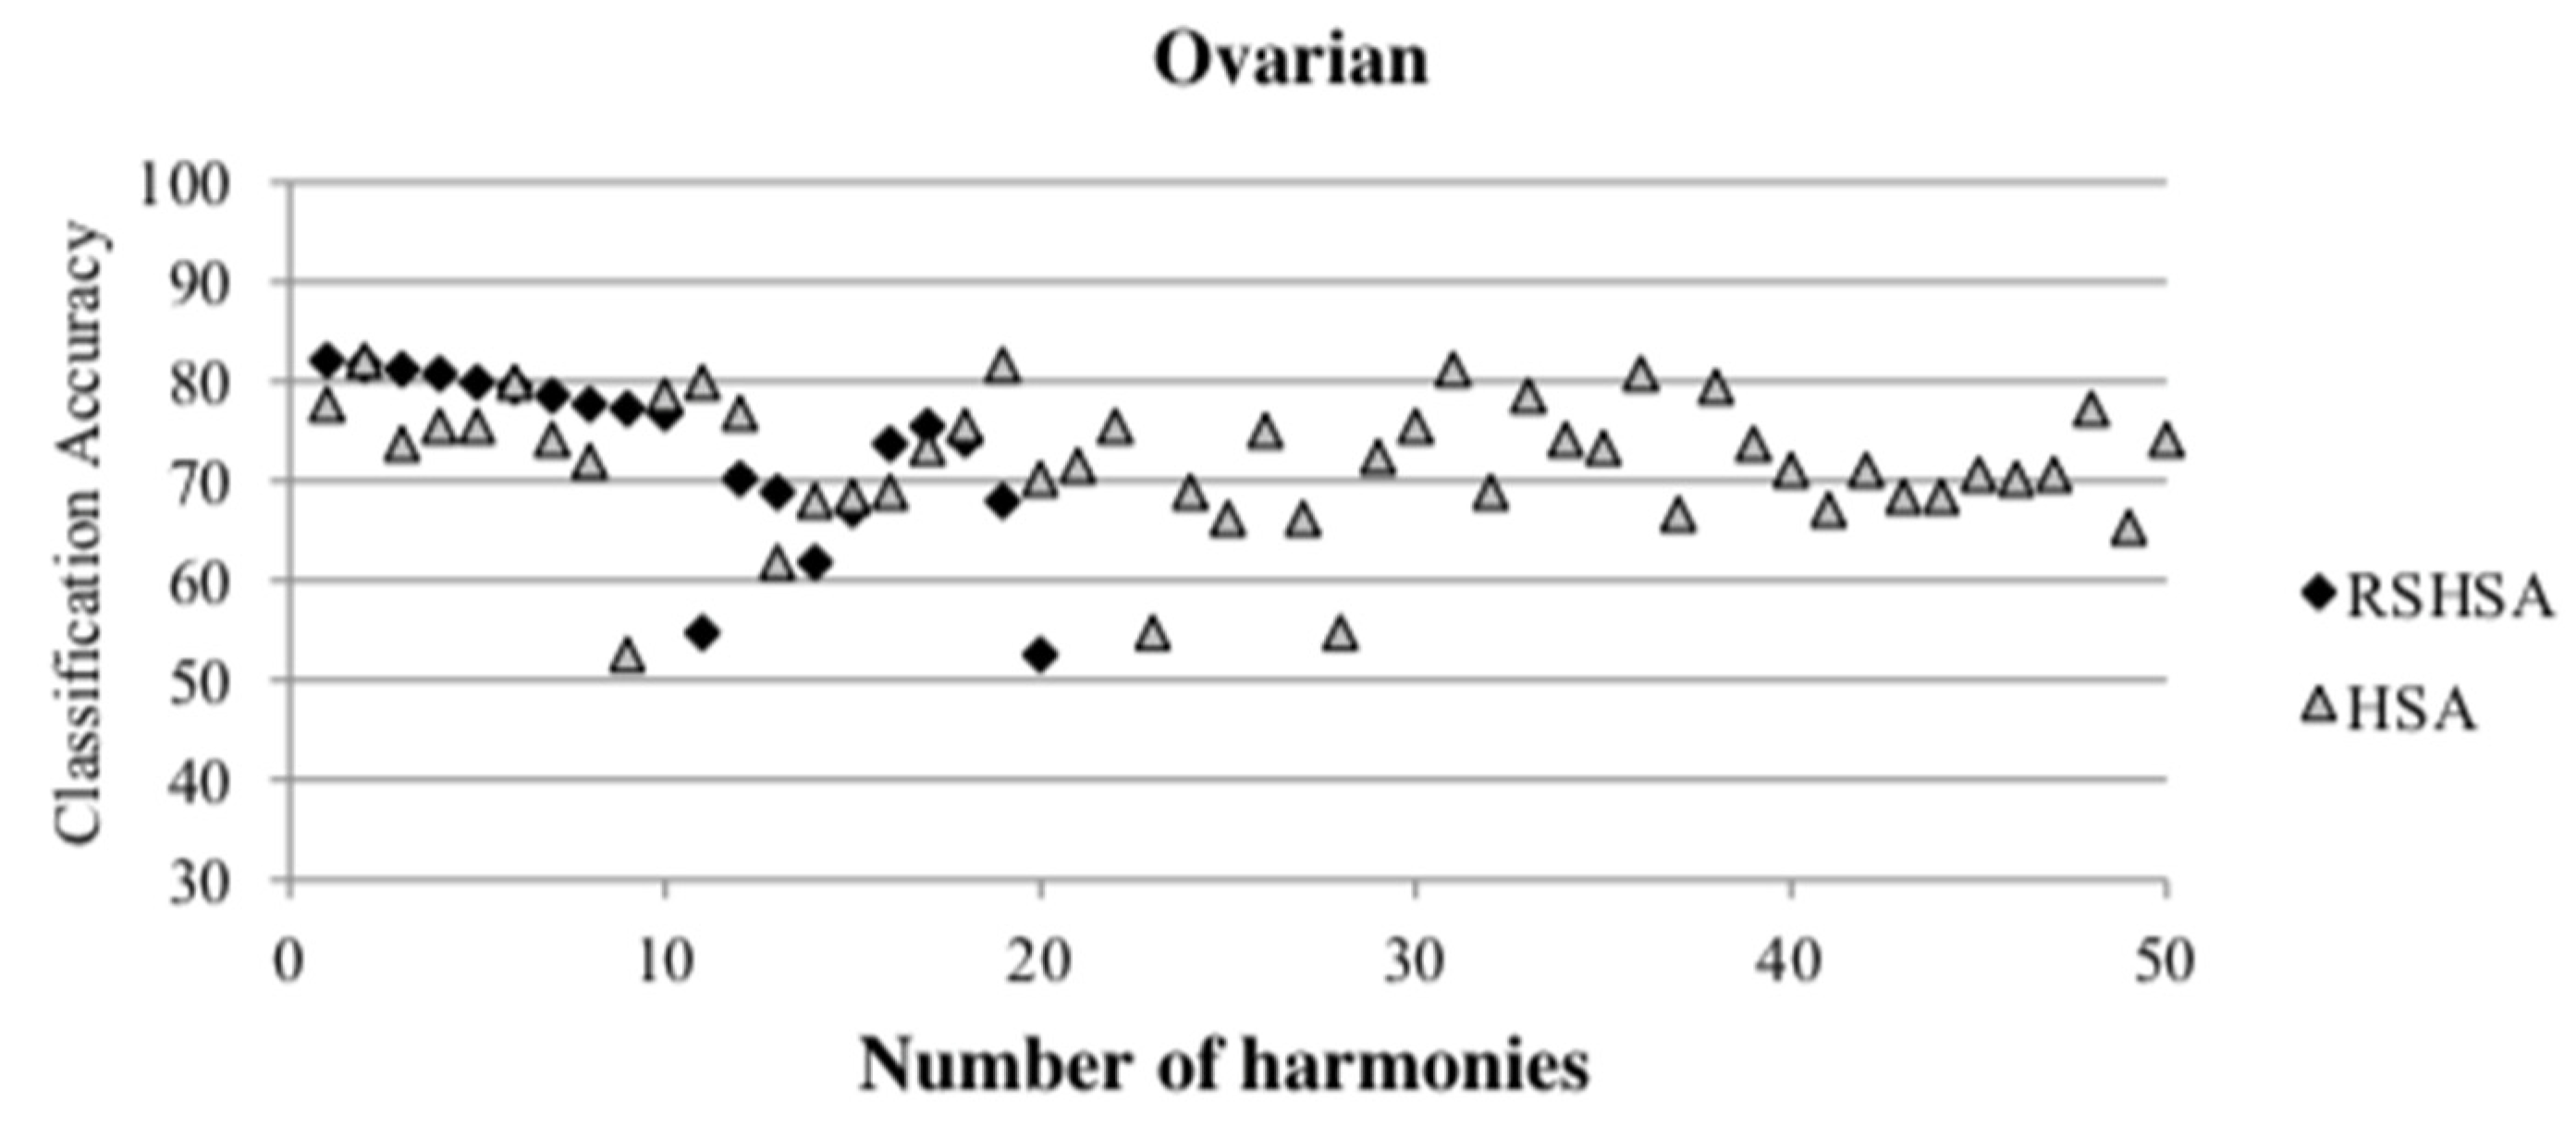
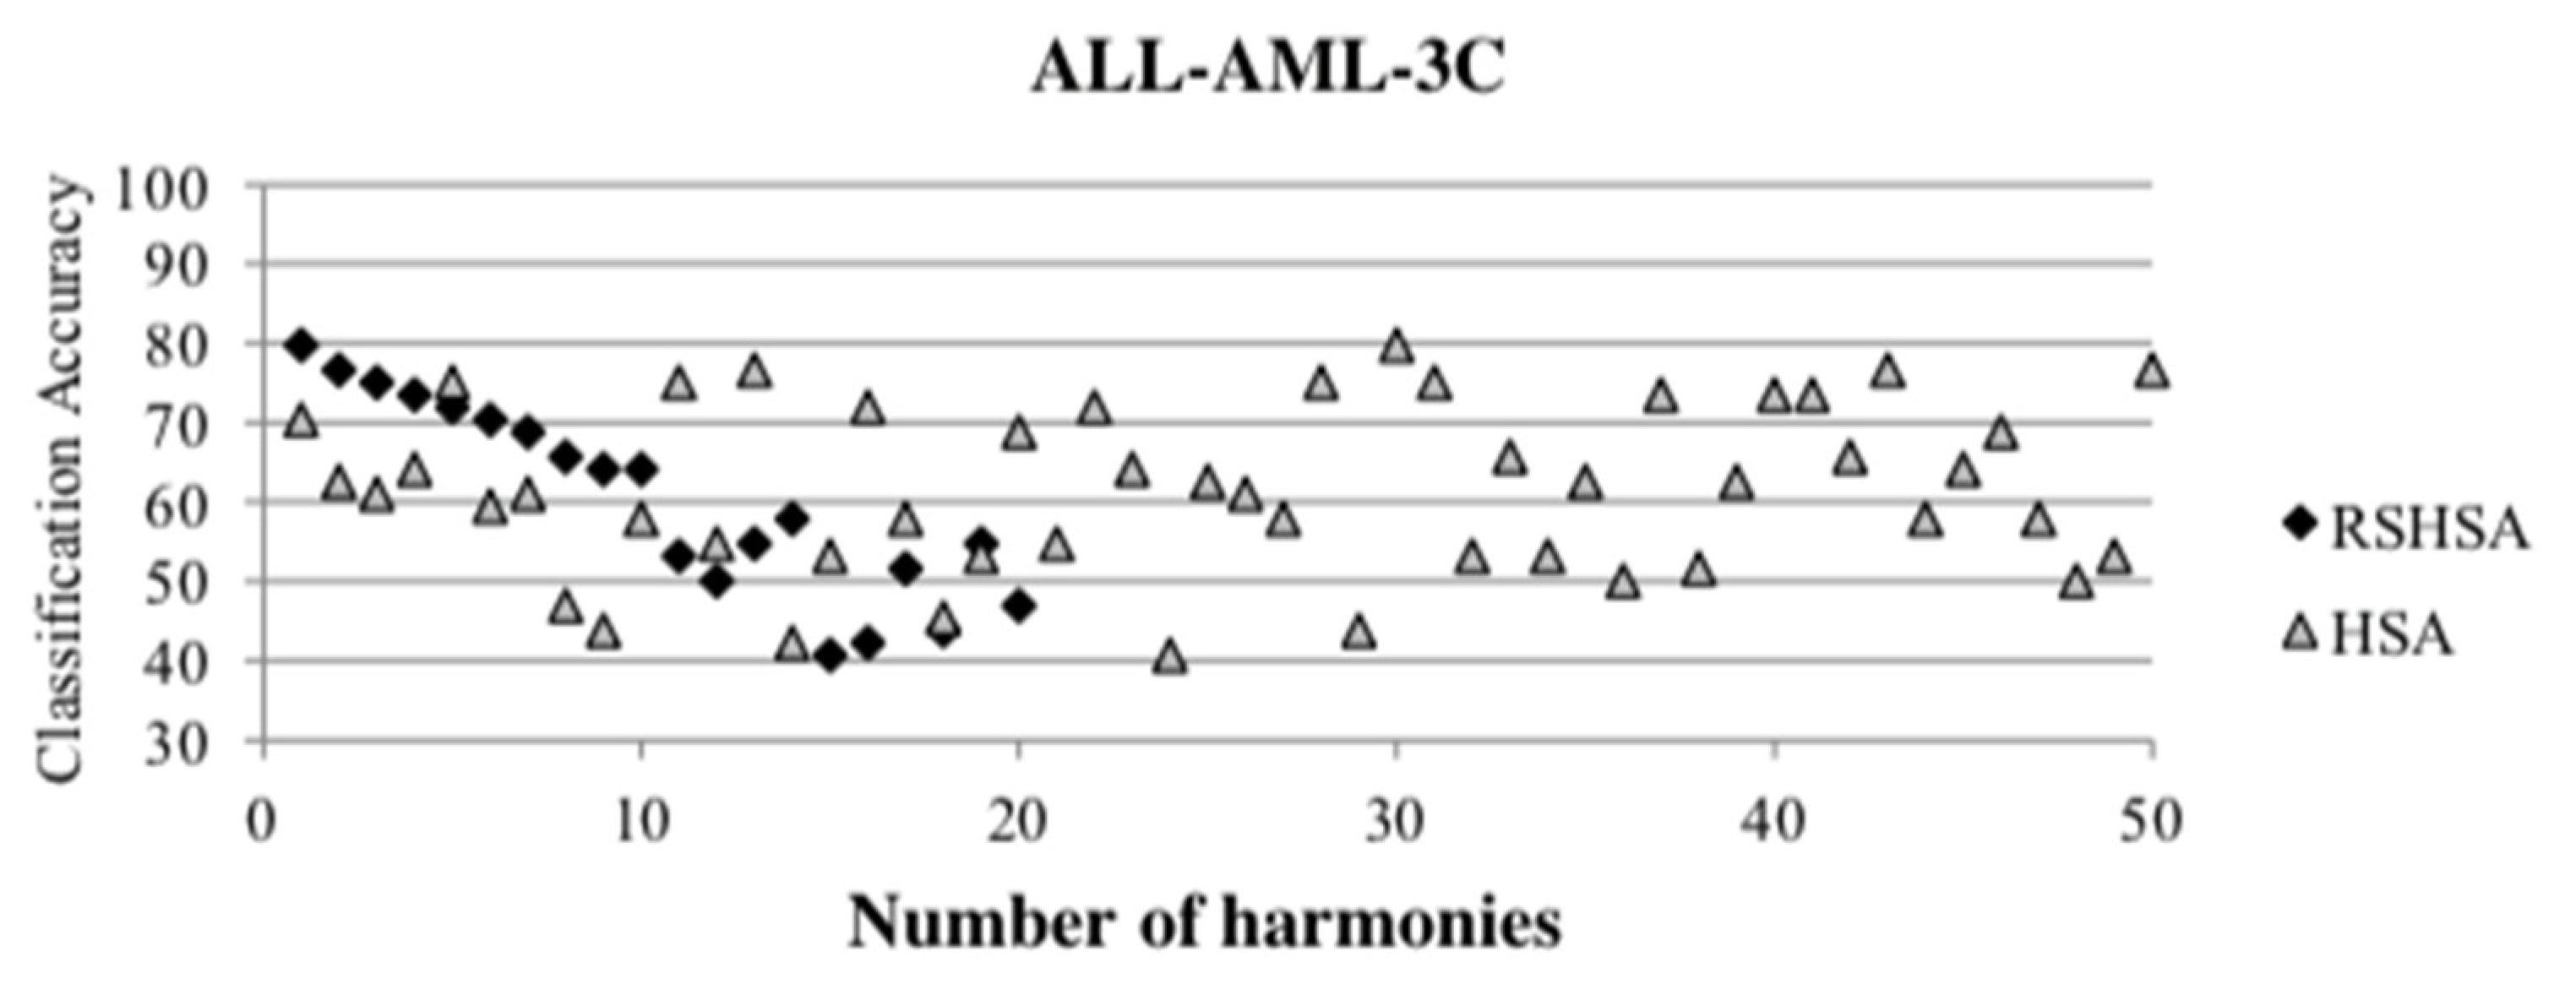
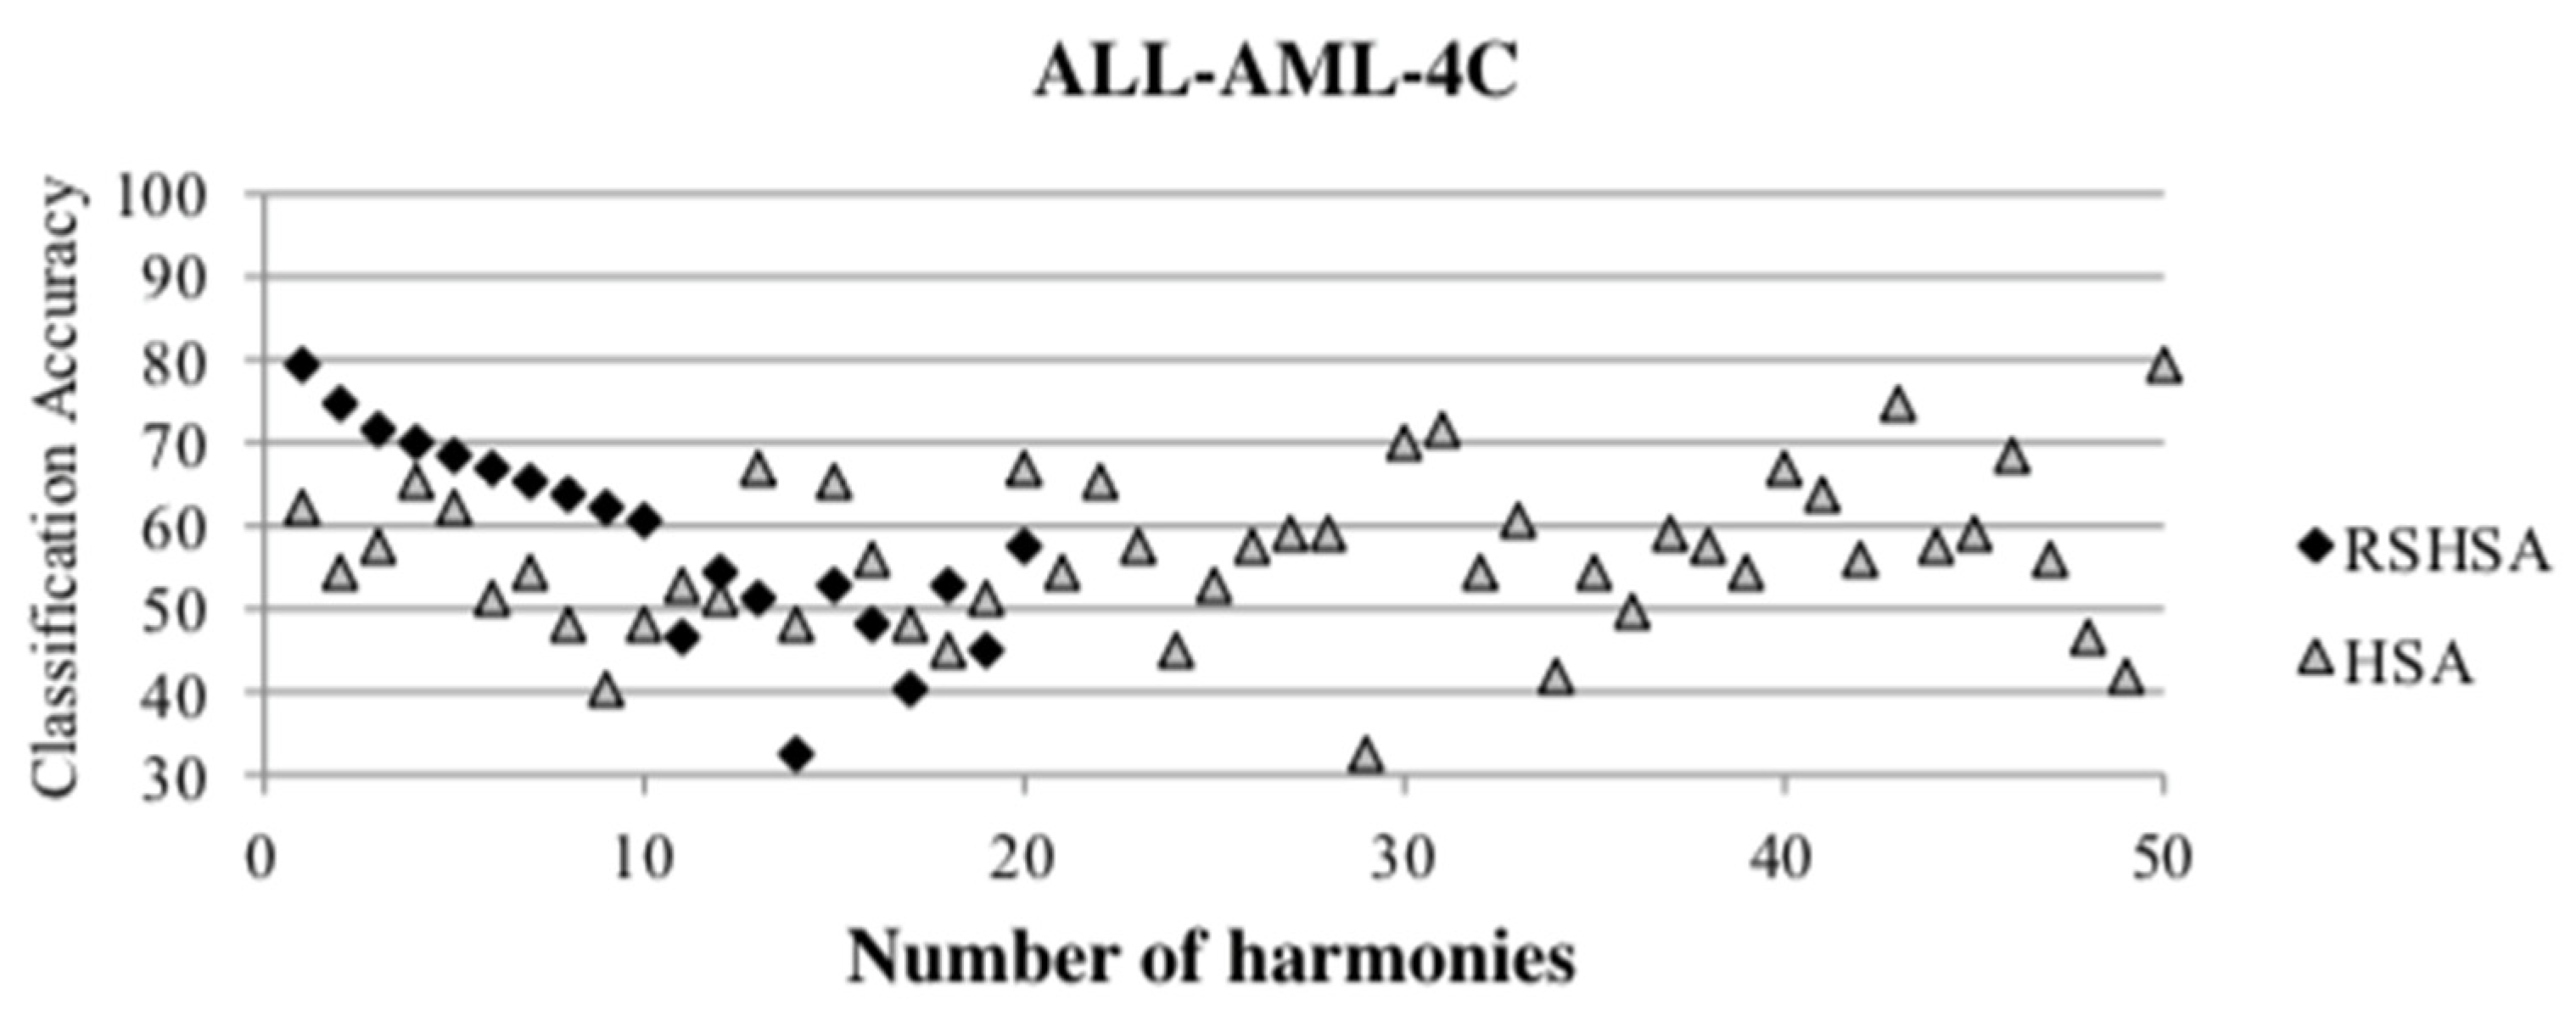
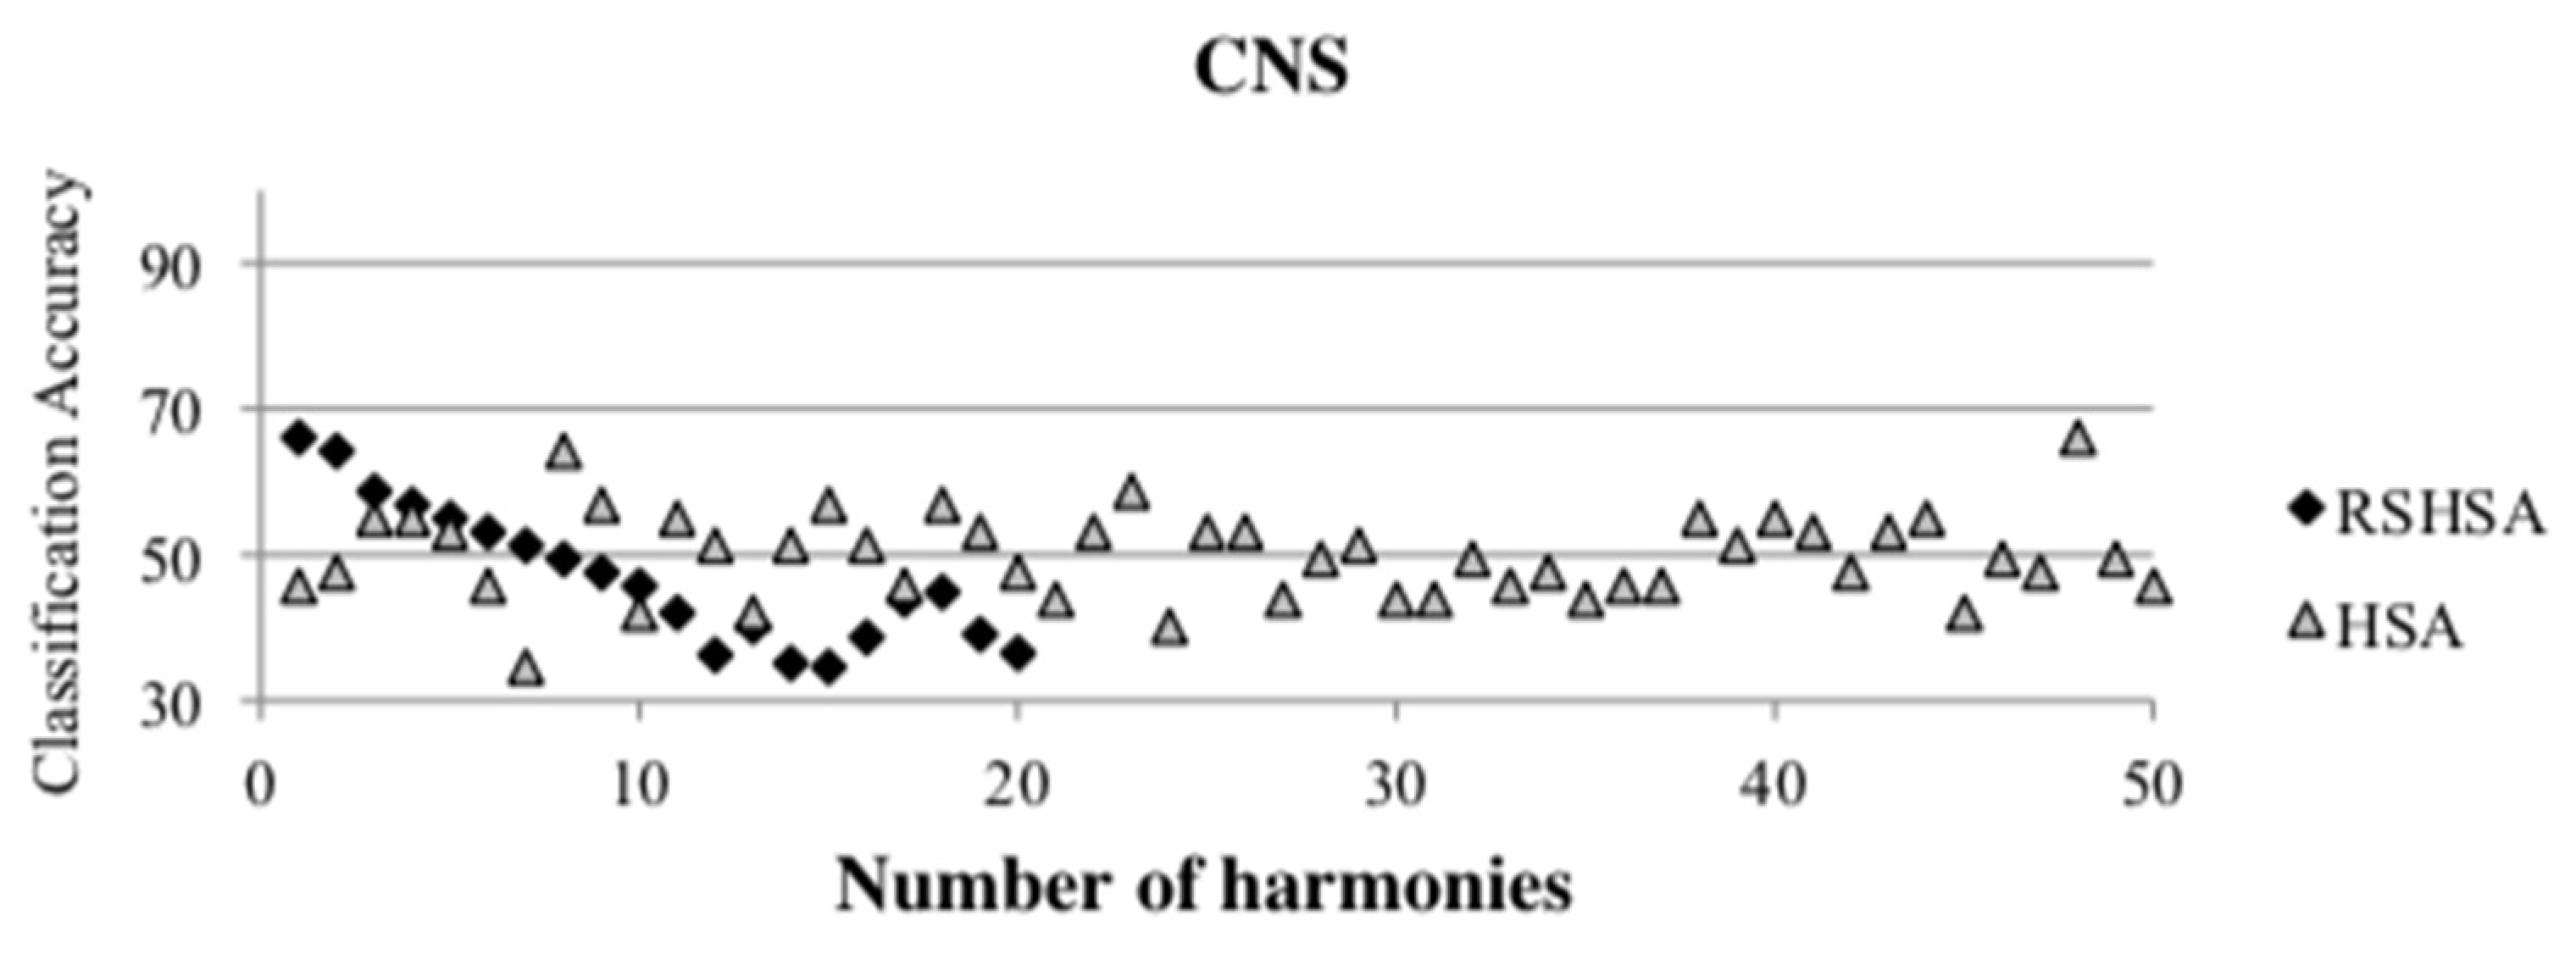
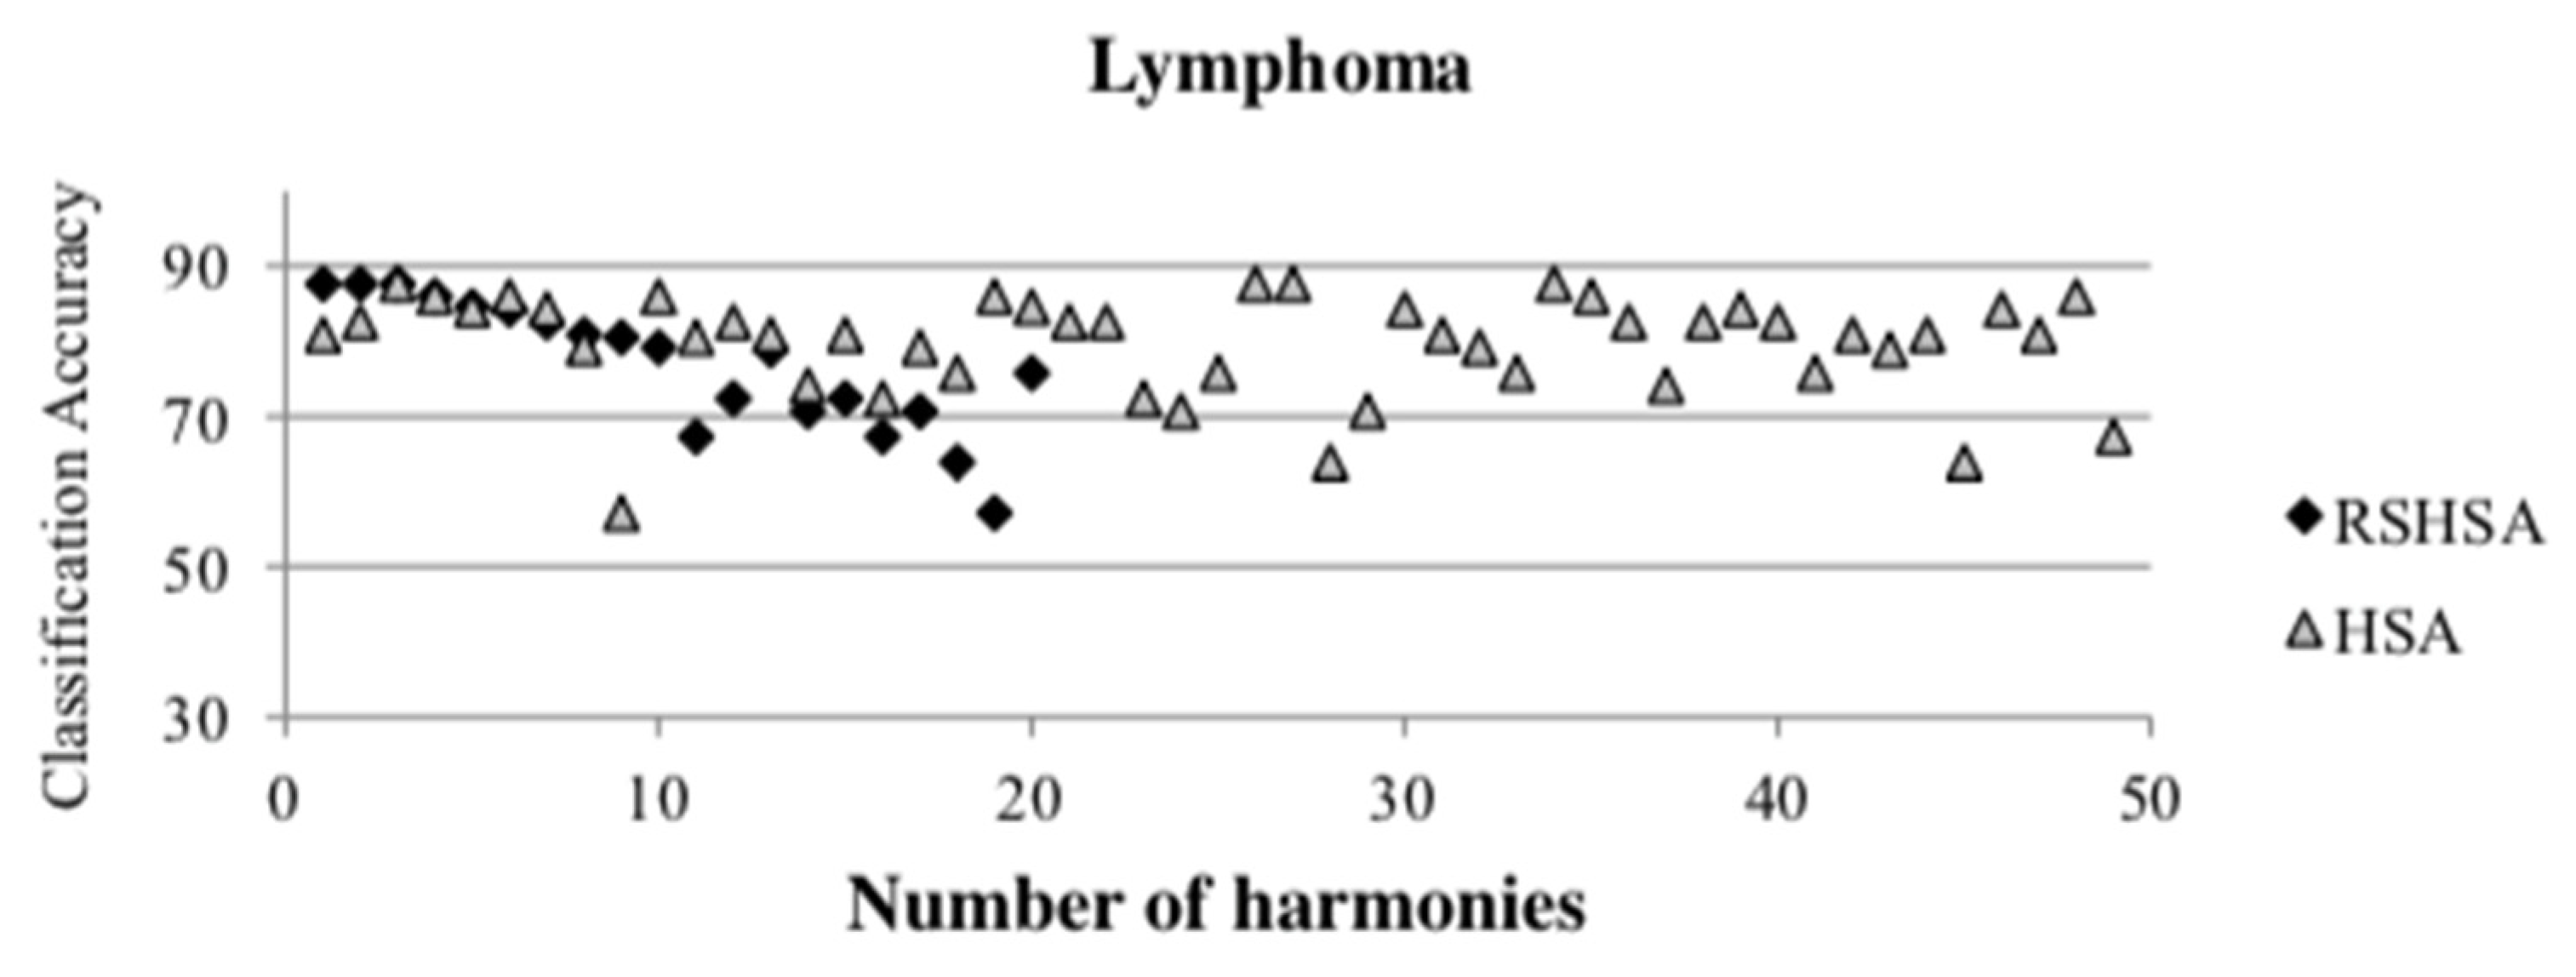
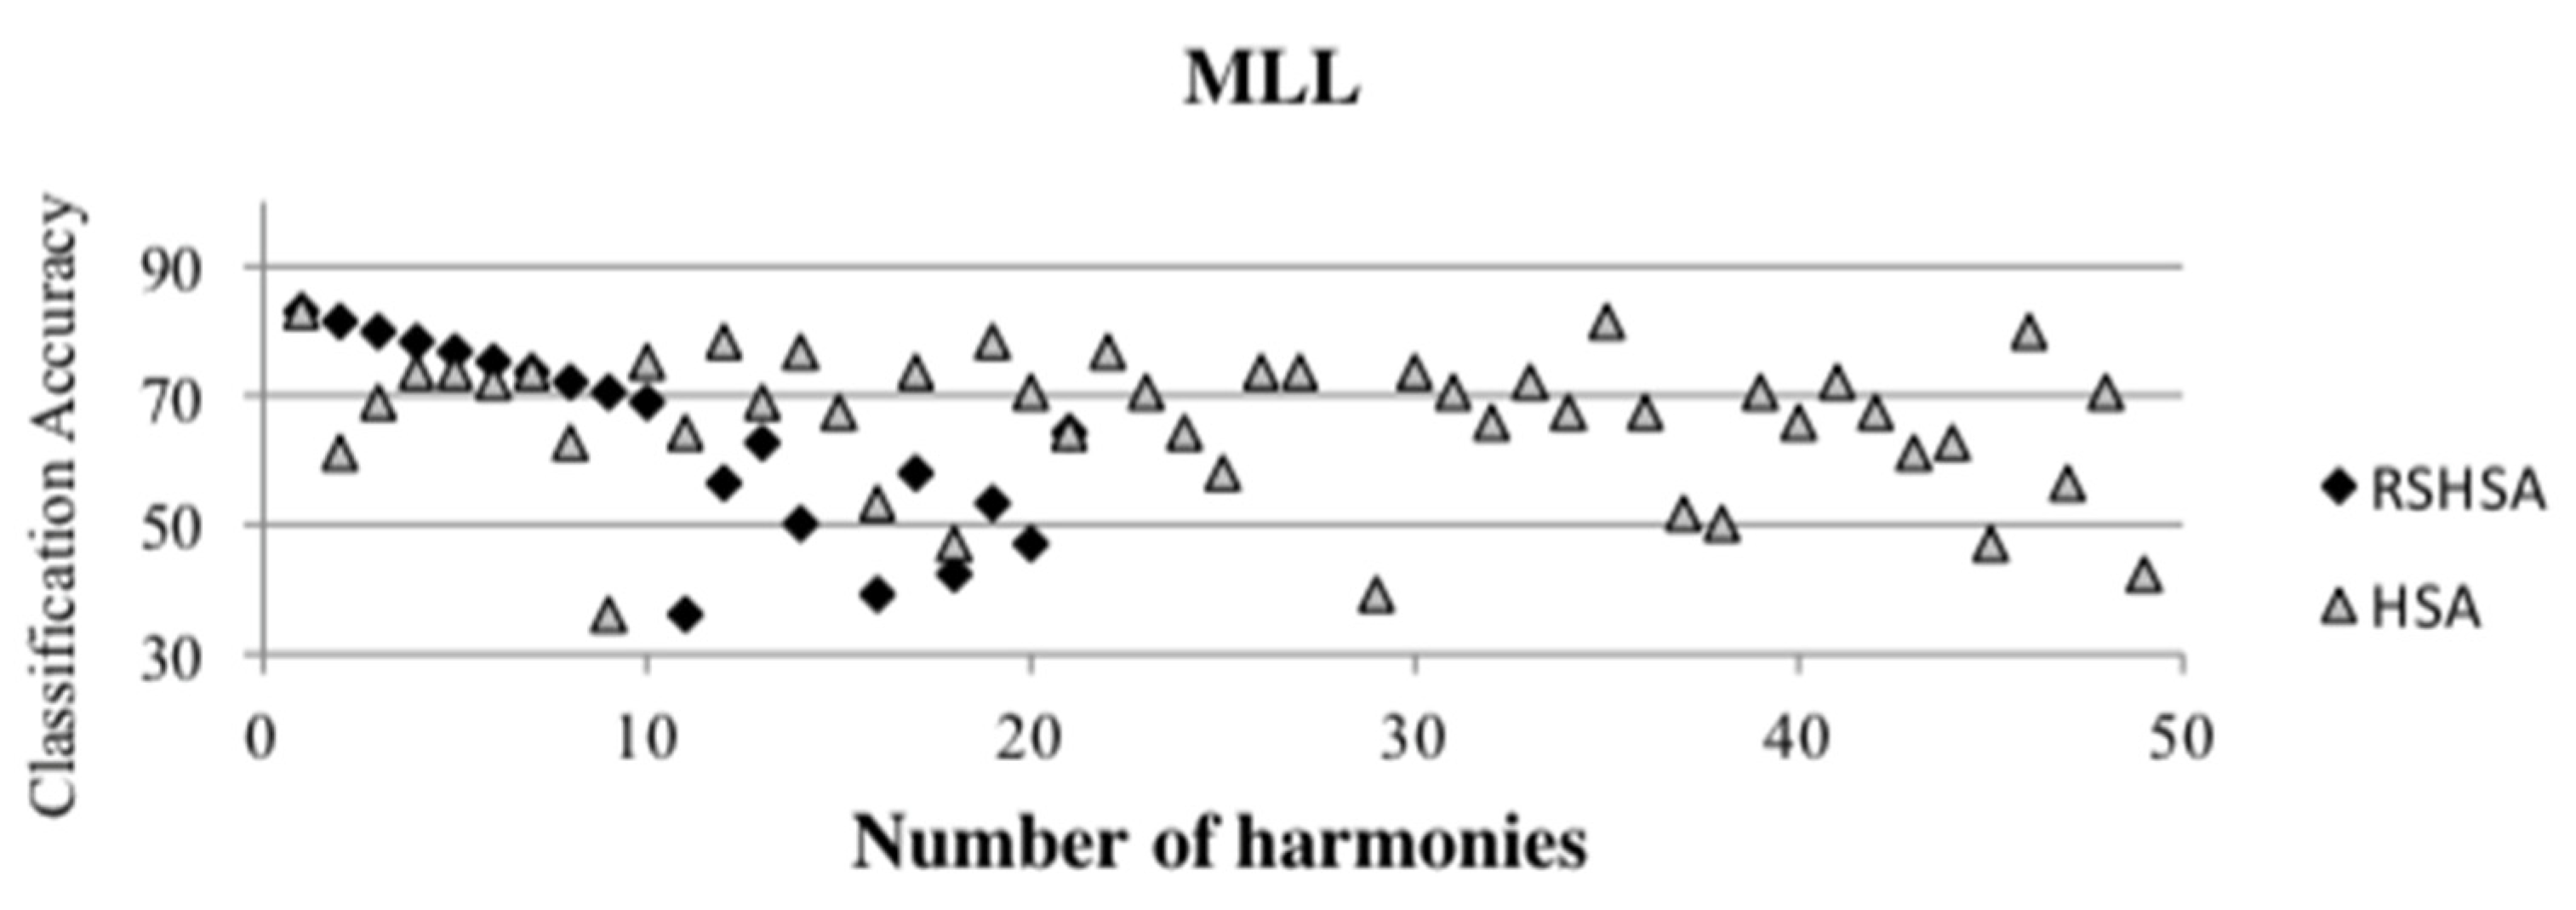
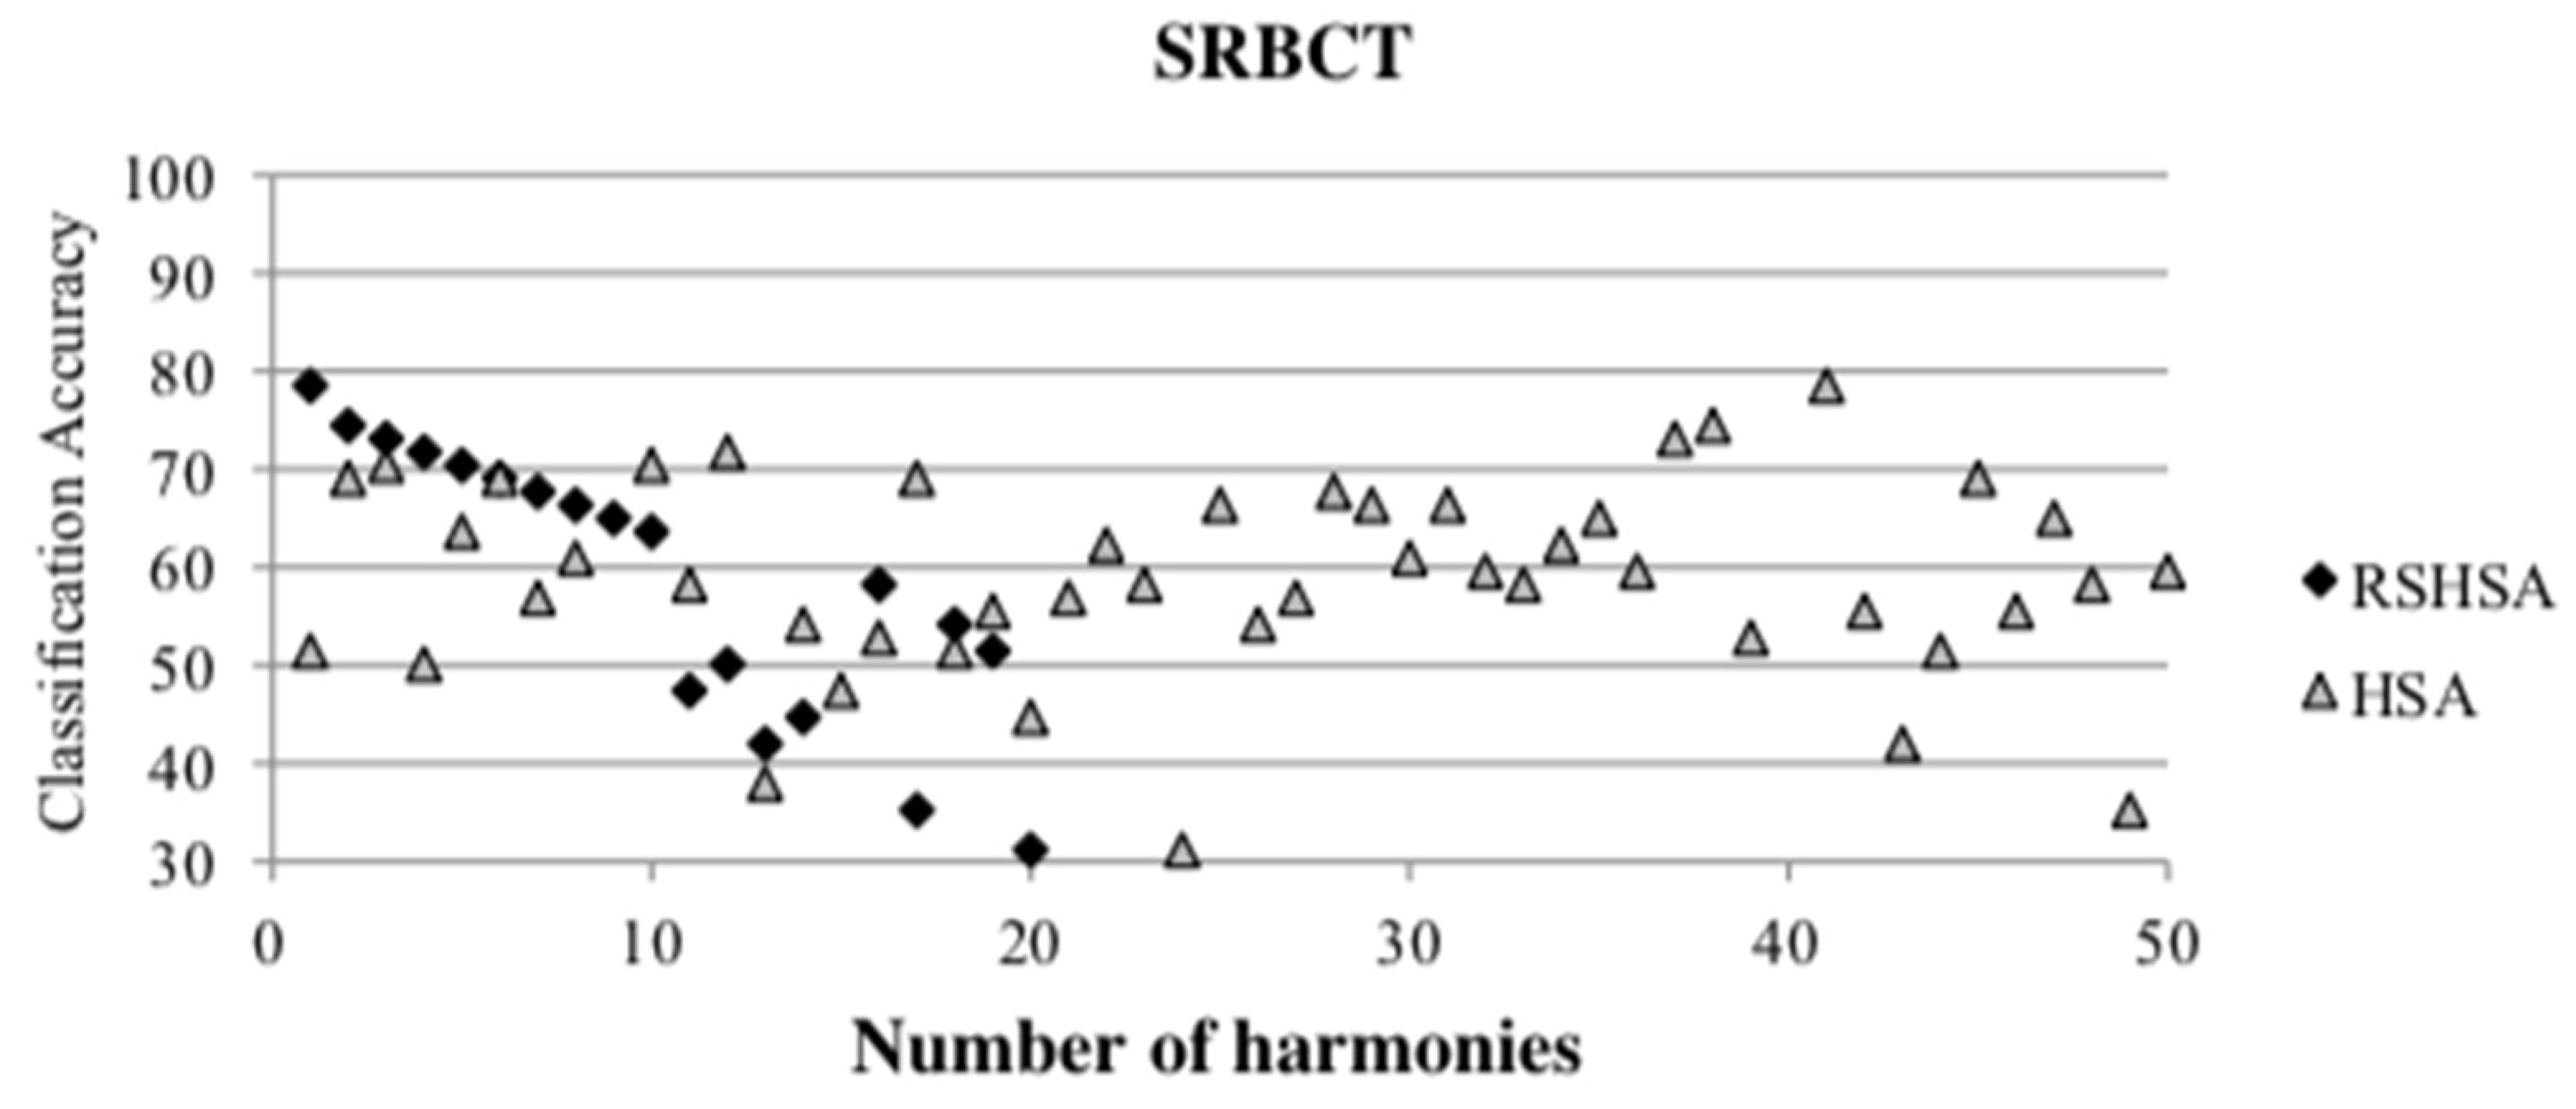
Figure 13 represent the distribution of the solutions for the 10 datasets based on the RSHSA and the HSA. The
x-axis represents the number of harmonies (1–50), and the
y-axis represents the classification accuracy. The quality of the solutions in the initial HM of the HSA is represented by the triangle symbol, while the quality of the RSHM of the RSHSA is represented by the rhombus symbol.
From the above figures, it can be observed that the generated initial HMs (as represented by the triangle symbol) are scattered apart from each other, which represents the diversification of the solutions. This occurs because the initial harmonies are randomly generated. It can be observed that the distribution of the solutions (represented by the rhombus symbol) is less scattered compared to the fully random HM. This means that the RS mechanism has managed to improve the quality of the improvised solutions better than the fully random initialization for the initial HM. In addition, the RS mechanism has provided a chance for the high-quality solution to survive during the improvisation process.
3.2.3. Statistical Test
A statistical analysis (Wilcoxon rank test) that has a 95% confidence level is conducted to further validate if there are significant disparities between the SU-RSHSA and the HSA. The
p-values gained are illustrated in
Table 8 for the accuracy of the classification and the number of genes.
Table 8 reveals the outcome as follows:
- (a)
The SU-RSHSA is found to be significantly better as compared to HSA on all tested datasets with regards to the accuracy of classification.
- (b)
The number of genes for the SU-RSHSA is significantly higher as compared to the HSA on all datasets.
Table 8 shows significant disparities between the algorithms compared, which concludes that the hybridization of SU filter with HSA wrapper (SU-RSHSA) yields a superior performance as compared to the use of the HSA wrapper method alone.
3.3. Comparison between RSHSA and SU-RSHSA
The purpose of this comparison is to evaluate the effectiveness of initializing the HM before the improvisation process and to investigate the impact of using an RS mechanism and SU filter with an HSA wrapper to obtain high accuracy of classification with a minimum number of genes. In this section, the discussion is divided into three parts: accuracy of the classification and computational time, number of genes chosen, and statistical test. The best outcomes are presented in bold in all tables in this section.
Classification Accuracy and Computational Time
The outcomes presented in
Table 9 reveal that the SU-RSHSA yields a performance that is better than the RSHSA in terms of accuracy of classification in all datasets, whereas RSHSA is unable to obtain better computational time (as shown in
Table 9) than SU-RSHSA in any dataset.
With reference to the outcome in
Table 10, it is evident that the SU-RSHSA outperforms the RSHSA in terms of accuracy of classification in all datasets. The SU-RSHSA also outperforms the RSHSA on seven datasets with regards to the number of selected genes. It again appears that the significant improvement achieved by the SU-RSHSA compared with the RSHSA, i.e., finding small subsets of genes with high accuracy of classification, is due to the utilization of SU for choosing the most effective gene (based on the evaluation of SU) when initializing the HM. This finding shows that the method that combines the filter with the wrapper in one method can achieve very good outcomes compared to the wrapper approach alone.
Table 10 depicts the number of genes chosen using the RSHSA and SU-RSHSA methods. The results show that the SU-RSHSA outperforms RSHSA on seven datasets, whereas the RSHSA performs better than SU-RSHSA on three datasets (i.e., ALL-AML, CNS, and Ovarian).
3.4. Limitation of the Study
The enhanced HSA-based approach called SU-RSHSA has been proposed in this paper for the gene selection problem in microarray datasets. This research is focused on improving the HSA algorithm by enhancing its mechanisms with a new reference set harmony memory and a filter. This study has made promising progress in relation to understanding and solving the gene selection problem in microarray datasets. However, there remain limitations in this study but leaves open research questions for future research work. This study is accomplished by developing the algorithm and evaluated using 10 microarray datasets. The main research limitation that influences the interpretation of the findings in this research is the dataset used in this work. The proposed approaches have been tested on 10 microarray datasets. Therefore, the algorithm’s nature, behavior and performance are limited to the 10 microarray datasets. To generalize the performance of the proposed algorithm, the performance of the algorithm could be further studied if it is tested and validated with respect to different domains such as web and text mining, speech recognition, and UCI datasets to study its behavior under a different type of data, format, and conditions. Therefore, the results and conclusion of this study could not be generalized across different domains and other real-world problems.
One of the most important aspects of this study on the HAS-based algorithm is how efficient it can be compared to the basic HSA and other states of the art methods. The runtime is relative to the size of the input (dataset). However, the execution time of the algorithms can vary due to factors other than the size of the microarray dataset. For example, the speed of the proposed algorithm depends on where (i.e., machine) the algorithm is run, how it was programmed (implementation), and how the data is processed. The algorithm may run much faster when given a set of pre-processed (e.g., sorted real numbers/integers, discretized dataset, etc.) than it would when given the same dataset with the original format or random order.
4. Discussion
This study proposed SU-RSHSA, a gene selection method that combined an SU filter and an RSHSA wrapper. The SU filter selects gene subsets with the highest SU score for initializing the HM in the first stage of this method. The findings, however, show that while the HSA can produce good results, they are not as impressive as those reported in the literature. As a result, in the second experiment, an RSHSA is proposed to select the gene subset and to improve the HSA’s performance in solving the gene selection problem. Furthermore, an SU filter is hybridized with the RSHSA as a wrapper (SU-RSHSA) to capitalize on potential synergies between the filter and wrapper approaches. In terms of classification accuracy, the number of selected genes, and computational time, the SU-RSHSA outperformed the HSA on most datasets. This is due to the HM’s random initialization flaw, which has been addressed by the improvisation process in the HSA. Furthermore, the experiments revealed that the RS mechanism can allow high-quality and diverse solutions in the HM to converge together. Besides that, SU was able to use fewer genes because only genes with a high top score are chosen to initialize the HM of the HSA without compromising classification accuracy. However, because the HSA is a population-based algorithm that focuses on diversification rather than intensification, the performance of the SU-RSHSA could be improved further [
31]. Many researchers such as Talbi [
35] and Blum et al. [
36] strongly recommend that the hybridization of population-based and local search-based algorithms be investigated. A research question arises at this point: “How can the intensification in HSA be improved?” As a result, in future work, we hope to combine the SU-RSHSA with a Markov Blanket filter (MB) filter as a local search algorithm to improve the quality of the improvised harmonies by utilizing the MB local search’s exploitation capability.
The results in
Table 11 show that the proposed approaches outperform and are comparable with other available approaches in the literature review because they obtained better results with regards to the accuracy of the classification and minimal genes selected. Moreover, the SU-RSHSA outperforms most of the other available approaches in terms of computational time because it requires less computational time as compared with the other methods described in the literature review.
The outcomes in
Table 11 demonstrate that the HSA and RSHSA outperform the MBEGA, MA-C, BPSO-CGA, on six, eight, and four datasets, respectively, with respect to the number of selected genes. In terms of classification accuracy, the HSA outperforms the MBEGA on one dataset (CNS) and has a competitive result in the case of the Lymphoma dataset, whereas the RSHSA outperforms the MBEGA on two datasets (CNS and Lymphoma). Overall, the HSA and RSHSA produce competitive, if not better (on a few datasets), results compared to the state-of-the-art approaches. Additionally, it is noteworthy that the methods compared are designed specifically to yield the best outcomes for one or a few instances only.
The SU-RSHSA obtains better results on one, seven, and eight datasets with regards to the number of chosen genes compared to the HSA-MB, MBEGA, and the MA-C algorithm, respectively. When compared to the MA-C, the SU-RSHSA yields better accuracy of classification on two of the eight datasets (and tied for ALL-AML-4C, MLL, and Ovarian). Moreover, when compared with the HSA-MB, the SU-RSHSA yields better classification accuracy on all datasets except Ovarian and SRBCT, and the SU-RSHSA obtain better results with respect to computational time on all the datasets.
Theoretically, it is believed that the higher number of genes employed for classification, the higher the classification accuracy that could be achieved. However, in our observations, the usage of a higher number of genes would only make the learning process slower. Furthermore, the chances of having irrelevant genes might produce incorrect results. This finding can be observed from the SU-RSHSA results. The results show that the SU-RSHSA does not perform better than the MA-C on all the datasets because the MA-C uses a greater number of genes compared to SU-RSHSA. However, the classification accuracy achieved by both algorithms is comparable due to the small differences. The difference (in %) between SU-RSHSA and MA-C with regards to a chosen number of genes is 91.75%, but in terms of the accuracy of classification, it is only 3.29%. Therefore, we can conclude that the performance of the SU-RSHSA is better than that of the MA-C algorithm by basing on the eight datasets employed in the comparison in terms of computing cost as SU-RSHSA uses smaller genes number for classification. Again, it is believed that this result arises because of the filter and wrapper approach combination.
The results presented in
Table 11 show that the SU-RSHSA performs better than the MRMR-GA, BPSO-CG, and BIRSW in two, four, and one datasets, respectively, with regards to the number of genes, selected. In terms of accuracy of classification, the SU-RSHSA obtains equal classification accuracy with the MRMR-GA in one dataset (ALL-AML with 100% accuracy), and the SU-RSHSA outperforms the MRMR-GA and the GPSO in one and two datasets, respectively. Moreover, the SU-RSHSA outperforms the BIRSW in three datasets (ALL-AML, Colon, and Lymphoma). Furthermore, the SU-RSHSA obtains the same accuracy of classification on two of the four datasets (ALL-AML and Lymphoma) when compared to the BPSO-CGA. The SU-RSHSA does not perform better than the GPSO in terms of the number of generated genes. However, it achieves a greater classification rate for two datasets (ALL-AML and Ovarian).
5. Conclusions
This study proposed SU-RSHSA, a combination of an SU filter and an RSHSA wrap-per for gene selection. This study has two primary objectives (i) to propose a gene selection method based on the HSA and to improve the initial harmony memory construction process by incorporating a reference set mechanism within the HSA (RSHSA); and (ii) to propose a hybrid SU filter with RSHSA wrapper (SU-RSHSA) approach to improve gene selection accuracy while consuming less computational time. This first objective was accomplished by developing an HSA for the gene selection problem and determining the optimal HSA parameter values. This included configuring the Harmony Memory Size (HMS), the Harmony Memory Consideration Rate (HMCR), the Pitch Adjustment Rate (PAR), and the Iteration Count (NI). To improve the quality of the HSA’s improvised har-monies, the Reference Set Harmony Search Algorithm (RSHSA) was proposed as a method to boost the HSA’s performance in solving the gene selection problem. In the RSHSA, the Harmony Memory (HM) mechanism’s initialization was improved by using the RS mechanism to construct a new HM, dubbed the Reference Set Harmony Memory (RSHM), rather than the fully random HM. Additionally, the HMCR and PAR procedures’ fully random selection mechanisms were modified and guided based on the quality and diversity of RSHM solutions. The RSHM’s update strategy was modified and found to be more effective in updating the RSHM whenever a higher-quality or more diverse solution is obtained. The obtained results indicated that the RSHSA outperformed the HAS. Moreover, the second objective was accomplished through the hybridization of SU and RSHSA (SU-RSHSA) to leverage the complementary benefits of both gene selection approaches (filter and wrapper). On most datasets, the SU-RSHSA outperformed the HSA in terms of classification accuracy, the number of selected genes, and computational time. This is due to the HM’s flaw in random initialization, which was addressed by the HSA’s improvisation process. Additionally, the experiments demonstrated that the RS mechanism can allow for the convergence of high-quality and diverse solutions in the HM. Additionally, SU was able to use fewer genes because only genes with a high top score are used to initialize the HSA’s HM without sacrificing classification accuracy.
The SU-RSHSA has made significant progress toward understanding and resolving the problem of gene selection in microarray datasets. However, there is still considerable room for future research. The following are some intriguing extensions to this work: (i) ten microarray datasets were used to validate the proposed approaches. The proposed approach could be evaluated and validated on a variety of domains, including web and text mining, speech recognition, and UCI datasets, to understand their behavior under various conditions better; (ii) the performance of the proposed approaches could be improved by dynamically changing the HSA parameters based on the objective function value during the search, which could yield interesting results; (iii) a novel approach based on HSA could be proposed to simultaneously address the gene selection problem and manage the classifier’s parameters. The goal is to evolve classifier parameter values in conjunction with a subset of genes. This eliminates the need for the user to pre-set classifier parameter values, as they are not dependent on the characteristics of the tested datasets; and (iv) because the HSA is a population-based algorithm that prioritizes diversification over intensification [
35], the SU-RSHSA performance could be improved further. Many researchers such as Talbi [
35] and Blum & Roli [
36] strongly recommend that the hybridization of population-based and local search-based algorithms be investigated. A research question arises at this point: “How can the intensification in HSA be improved?” As a result, in future work, we hope to combine the SU-RSHSA with a Markov Blanket filter (MB) filter as a local search algorithm to improve the quality of the improvised harmonies by utilizing the MB local search’s exploitation capability.


