Abstract
In this paper, we study two mathematical models, involving delay differential equations, which describe the processes of erythropoiesis and leukopoiesis in the case of maintenance therapy for acute lymphoblastic leukemia. All types of possible equilibrium points were determined, and their stability was analyzed. For some of the equilibrium points, conditions for parameters that imply stability were obtained. When this was not feasible, due to the complexity of the characteristic equation, we discuss the stability through numerical simulations. An important part of the stability study for each model is the examination of the critical case of a zero root of the characteristic equation. The mathematical results are accompanied by biological interpretations.
1. Introduction
1.1. Mathematical Background
The primary goal of this paper is to present the stability analysis of two different mathematical models for the processes of erythropoiesis and leukopoiesis in the case of maintenance therapy in acute lymphoblastic leukemia (for more details, see [1,2,3,4,5,6]).
The models represent the original work of some of the authors and were first introduced in [7]. They consist of systems of delay differential equations (often used to capture cell dynamics). In [7], the authors presented the models and demonstrated the positivity of solutions and the existence of equilibria. The novelty of this paper is the thorough stability study of all of the equilibrium points.
A challenging situation was the presence of critical cases for stability analysis. For these, we used an original theorem proven in [8] by some of the authors of this paper.
1.2. Biological Background
The models presented in this paper depict the erythropoiesis and leukopoiesis processes. These are part of a bigger process called hematopoiesis: the process through which all blood cells are created. Hematopoietic stem cells become red blood cells (which transport oxygen), white blood cells (which fight infections), or platelets (which stop bleeding). There is a complex network of cytokines and growth factors that regulate the production of blood cells.
Hematopoietic stem cells generate two major progenitors cell lineages: myeloid and lymphoid. The myeloid line contains cells such as granulocytes, monocytes, erythrocytes, or platelets, while the lymphoid line contains cells associated with the immune system (i.e., natural killer cells, T-cells, and B-cells).
Erythropoiesisis the process through which red blood cells (also called erythrocytes) are produced. Erythropoietic stem cells mature to red blood cells when a decrease in oxygen levels is detected by the kidneys. The kidneys secrete a hormone called erythropoietin, which stimulates the production of erythrocytes. It is the action of this hormone (also considered in [2,9]), together with the effects of therapy, that complicates the stability study of equilibria. Since mortality rates are no longer constant, a new variable is introduced. This variable is the source of a zero root of the characteristic equation.
White blood cells are generated through the process of leukopoiesis. Depending on which progenitor line they come from, there are two groups of white blood cells: myelocytes and lymphocytes.
For more information about hematopoiesis and its underlying processes, please see [2,3,10,11], pp. 1–18.
Acute lymphoblastic leukemia (ALL) is a type of cancer that affects white blood cells [4]. In the case of ALL, blood cell production is disrupted, due to the presence of a large number of immature lymphocytes (called lymphoblasts) in the circulatory system. These immature cells do not function properly and overcrowd the healthy cells. Lymphoblasts eventually invade the liver, spleen, and lymph nodes. For more information, statistics, diagnoses, and prognoses, see [12], pp. 1556–1576, 1616–1636, and [10], pp. 173–192.
Maintenance therapy is conducted after an initial treatment is administered [6]. In patients with ALL, we consider that this therapy consists of oral administration of mercaptopurine (6-MP). The biologically inactive substance 6-MP metabolizes into the active 6-thioguanine nucleotide (6-TGN).
Studies have shown that maintenance therapy contributes greatly to the overall evolution and life expectancy of the patient ([12], p. 1566, [13]). The need to mathematically study the effects of this treatment is very important, as it may help to fill the existing gaps in knowledge [13].
The models studied in this paper capture the effects of this medication on the creation of red and white blood cells.
It is worth mentioning that, although we concentrated on patients with ALL, the same maintenance therapy is administrated for some autoimmune diseases. Thus, the models, computations, and discussions could also be suitable for those cases.
2. The Modeling of Erythropoiesis
2.1. The Mathematical Model
The mathematical model for erythropoiesis consists of seven delay differential equations (DDEs) with two delays. We considered the dynamics of the stem-like short-term erythroid cells (), the mature erythrocytes (), the concentration of erythropoietin (), the amount of 6-MP in the gut (), the amount of 6-MP in plasma (), and the concentration of thioguanine nucleotide (6-TGN) in red blood cells () (see [7,9,14,15]). The variable represents the loss suffered during the cell cycle.
Each stem-like cell is considered to go through either asymmetric division (a fraction of the stem-like population), which means that one of the daughter cells re-enters the stem-like population, while the other goes on to differentiate, symmetric differentiation (a fraction of the stem-like population)—both daughter cells proceed to differentiate—or self-renewal (a fraction of the stem-like population)—both daughter cells re-enter the stem-like pool. We used two feedback functions for the rates of self-renewal and differentiation:
The time necessary for a stem-like cell to go through self-renewal or differentiation and re-enter the stem-like population is considered to be the same and is represented by the delay .
These aspects are included in the first equation of the model, which describes the evolution of stem-like short-term erythroid cells. As can be seen in this equation, both the erythropoietin and the medication have an impact on cell death. The drug concentration in the blood stream has a toxicity that increases the apoptosis rate of the stem-like cells (the second term). The erythropoietin regulates the process of erythropoiesis, either repressing (the first term) or stimulating (by influencing the rate of self-renewal and differentiation) the production of stem-like cells.
The constant represents the maximum drug effect on erythrocytes, and represents the drug saturation.
The healthy erythrocytes, illustrated by the second equation, have a constant mortality rate (the first term) and a supply controlled by the erythropoietin (the second term). We introduce the notation , where is an amplification factor. The time necessary for the cells to mature is given by the delay .
The third equation captures the changes in the concentration of erythropoietin. This protein has a constant rate of clearance, and its production is influenced by the number of existing erythrocytes in the blood stream.
The fourth equation represents the cell loss sustained during the cell cycle. For more information regarding this equation, please consult [7].
The last three equations describe the dynamics of the drug after administration.
The model, which depicts the process of erythropoiesis under maintenance therapy, is:
2.2. The Equilibrium Points and Linearization
Using some elementary, but tedious calculations, the following types of equilibrium points corresponding to the model of erythropoiesis in ALL under treatment were obtained (see also [7]): , which corresponds to the “death of the patient”, and , which corresponds to a “chronic phase of the disease”.
In order to study the stability of these equilibrium points, we performed a linearization of the nonlinear system (1). We denote the matrix of partial derivatives for the undelayed variables by and the matrices of the partial derivatives with respect to the delayed variables by: and . For a complete list of the matrix elements, please consult [7].
2.3. Stability Analysis of the Equilibrium Point
Using the matrices defined above, the characteristic equation corresponding to is:
We notice that is a root, and so, we are in a critical case for the stability of the nonlinear system (1).
2.3.1. The Real Solutions of the Characteristic Equation
The real solutions of the characteristic equation are given by:
The existence of a zero eigenvalue implies a critical case for stability by the first approximation.
2.3.2. Analysis of the Critical Case
The following theorem, developed and proven by some of the authors in [8], gives stability criteria in the critical case of a zero eigenvalue.
Theorem 1.
([8], Theorem 2.1). Consider the following nonlinear system with time delays:
where , for all , , F takes values in , and G is scalar. F and G contain only powers of the variables with the sum greater than or equal to two. Then, for every , there exist and with so that, whenever ,
Now, consider the following system with time delays. Suppose that the linear system:
is asymptotically stable, that is, if λ is a root of the characteristic equation, then . Then, the zero solution of (2) is simple stable, and if φ is the initial data of (2) in C with , there exist so that, if , then:
In what follows, we transform our system so that Theorem 1 can be applied. We first perform a translation to zero: for
The new system becomes:
where we consider , with .
The matrices of partial derivatives into zero are, as before, , , .
The characteristic equation for the zero solution of the new system (5) has exactly the same form as the one for . The terms that are different are:
Notice that Theorem 1 is not directly applicable since the linear part is not equal to zero. In order to apply Theorem 1, we need to rewrite the system (5).
Take where . This means that:
so,
We have .
Then,
Next, by forcing , it follows that:
from which we obtain:
Thus, we have , , , and .
We remark that:
with and containing terms of order higher than or equal to two.
We introduce:
Then, we have:
We replace the fourth equation in (5) with the equation of from above, so that the equation has a zero linear part.
Next, we consider:
and we substitute in the equations of (5). The new system becomes:
Consider:
and remark that the linear part of does not contain
Since the other equations, except that of , do not contain at all, we conclude that Theorem 1 can be applied. Therefore, the stability of depends on the study of the transcendental terms in its characteristic equation.
2.3.3. The Transcendental Part of the Characteristic Equation
Consider the equation:
The stability analysis of Equation (6) is classical (see, for example, [16]).
Proposition 1.
Let . Assume that the following condition is true:
Then, Equation (6) is stable for and remains stable for .
Proof.
For the equilibrium point , we have:
If , Equation (6) becomes:
Equation (6) is stable for if:
Since , the following conditions from [16,17] must hold for stability when
1. ;
2.
Since , the first condition holds true.
For the second condition we must have:
Remark 1.
The equilibrium point is stable if Condition (7) holds.
2.4. Stability Analysis of the Equilibrium Point
The characteristic equation corresponding to becomes:
where:
and:
Remark 2.
Since the characteristic equation corresponding to is complicated, the stability of is investigated using numerical procedures.
2.5. Numerical Simulations
For the numerical simulations, we considered the time scale as days and consulted the available literature in order to set the values of the parameters. Table 1 shows the numerical values of the parameters presented in the erythropoiesis model (1).

Table 1.
Parameter values for the erythropoiesis model.
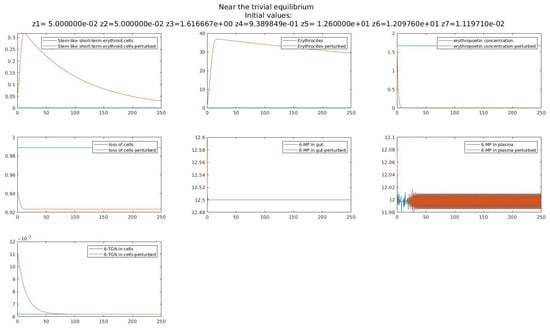
Figure 1 depicts the equilibrium point in blue and a small perturbation from this equilibrium point in red. We obtained parameter conditions for the stability of this equilibrium point, but it would be preferable that it be unstable; remember that corresponds to the death of the patient.

Figure 1.
Stability of equilibrium point .
We proved that the equilibrium point is stable if Condition (7) holds. For the parameter values in the table above, it is easy to verify that (7) does not hold. This can also be seen in Figure 1, where the evolution seems to be a favorable one for the patient.
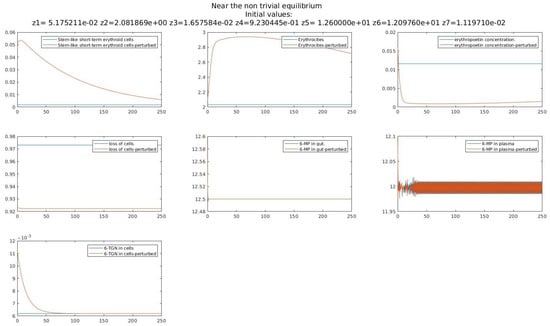
Figure 2 depicts the equilibrium point in blue and a small perturbation from this equilibrium point in red. Although we could not obtain any parameter conditions for stability, it is easy to notice that the equilibrium point is unstable for the considered set of parameters. As corresponds to the chronic phase of the disease, the evolution obtained in Figure 2 is a desired one. The healthy cells grow in number, and the leukemic cells die out; this basically means that the patient recovers.

Figure 2.
Stability of equilibrium point .
3. The Leukopoiesis Model
3.1. The Mathematical Model
In this model, represents the concentration of short-term stem-like white blood cells’ precursors and the adult leukocytes. The treatment is presented through the function (see [15]):
The equations that describe these variables mirror those in the erythropoiesis model, as the evolution of the leukocytes has many points in common. The difference between the two is the influence erythropoietin has on the production of the cells.
A non-constant rate of the elimination of stem cells due to treatment is encountered, and this leads to the consideration of a new, auxiliary variable .
Again, the last three equations depict the progress of the drug after administration.
The following model describes a compartment of leukopoiesis coupled with the dynamics of 6-MP used in the maintenance therapy:
3.2. The Equilibrium Points and Linearization
Following [7], we concluded that there are two types of equilibrium points corresponding to the model of leukopoiesis:
When linearizing System (9), the matrix of partial derivatives with respect to undelayed variables is denoted as and the matrices of the partial derivatives with respect to the delayed variables are denoted as and . For a complete list of the coefficients, please consult [7].
3.3. Stability Analysis for Equilibrium Point
The characteristic equation corresponding to is:
The real solutions of the characteristic equation corresponding to are given by:
The analysis of the critical case follows the same steps as in the previous case. As before, we can rewrite the system in a way that Theorem 1 can be applied. In order to avoid redundancy, we skip the computations. We concluded that the stability of relies on the zeros of the transcendental equation:
Proposition 2.
Assume that the following condition is true:
Then, Equation (10) is stable for , and it remains stable for all .
The proof of Proposition 2 is similar to that of Proposition 1.
Remark 3.
The equilibrium point is stable if Condition (11) holds.
3.4. Stability Analysis of the Equilibrium Point
The characteristic equation corresponding to is:
3.4.1. The Real Solutions of the Characteristic Equation
The nonzero real solutions of the characteristic equation corresponding to are given by:
and
3.4.2. The Transcendental Part of the Characteristic Equation
The stability of the characteristic equation corresponding to depends on the stability of the following equation:
The stability analysis of Equation (12) follows the approach in [19], Theorem (1).
Proposition 3.
Proof.
For , Equation (12) becomes:
Suppose that and are two roots for Equation (14), then in order to have , the following conditions must hold:
□
Now, let:
Proposition 4.
Consider the following conditions:
Proof.
Suppose and . Equation (12) becomes:
The study of this equation follows the approach of Theorem 1 in [19]. Define:
Note that Conditions (i), (iv), and (v) of Theorem 1 in [19] are most likely to hold and Conditions (ii) and (iii) of Theorem 1 in [19] hold.
Then, the stability of Equation (17) depends on the zeros of the equation:
If Equation (18) has no positive roots () and if (17) is stable with , it will be stable for all . If Equation (18) has a least one as a root and all the roots are simple, as increases, there might be stability switches. Therefore, if Equation (17) is stable at , it might become unstable when
Now, consider and where , and are real-valued functions.
We obtain the following polynomial:
By setting , we have:
□
Now, we consider (fixed) and
Equation (12) becomes:
Remark 4.
Suppose that the equation:
has no positive real roots. Then, if Equation (23) is stable for , it will remain stable for and all
Since and are analytic functions, we can apply the result of Theorem 1 in [19]. Set . We are interested in the roots of the equation:
We have:
3.5. Numerical Simulations
Again, we considered the time scale as days and consulted the available literature in order to set the values of the parameters. Table 2 shows the numerical values of the parameters presented in the leukopoiesis model (9).

Table 2.
Parameter values for the leukopoiesis model.
Due to the fact that the drug dynamics after administration is similar to the one obtained in the erythropoiesis model, we only focus on the representation of the white blood cells’ precursors, , and the adult leukocytes, .
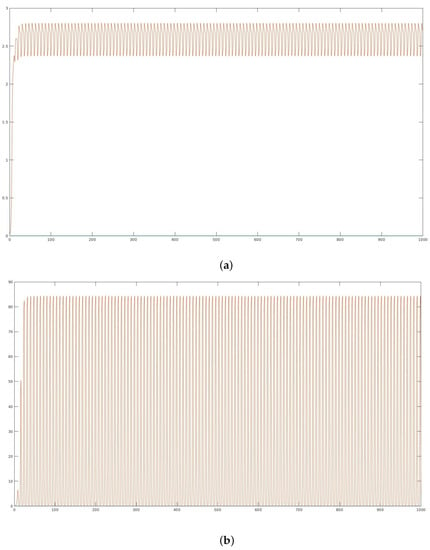
We would prefer that the equilibrium point be unstable and perhaps attracted to a healthy state. Figure 3 depicts the equilibrium point in blue and a small perturbation from this equilibrium point in red. The evolution of both the white blood cells’ precursors and adult leukocytes is a favorable one for the patient.

Figure 3.
Stability of equilibrium point : (a) Evolution of the white blood cells’ precursors; (b) Evolution of the adult leukocytes.
In Figure 3, the equilibrium point is clearly unstable. By checking Condition (11), we obtain the same result: the condition does not hold, and the equilibrium point is unstable.
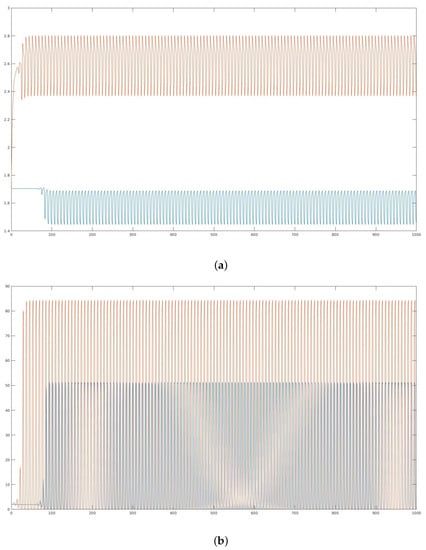
The equilibrium point corresponds to a healthy state of the patient. Figure 4 shows the equilibrium point in blue and a small perturbation from this equilibrium point in red. The equilibrium point is clearly unstable, but the evolution of the patient is still promising. The white blood cells’ precursors and adult leukocytes both show an increase in number.

Figure 4.
Stability of equilibrium point : (a) Evolution of the white blood cells’ precursors; (b) Evolution of the adult leukocytes.
Oscillatory trajectories are common in blood cell evolution, as there is a natural inner oscillatory dynamics.
4. Conclusions
The objective of this article was to present the stability study of two mathematical models that describe the processes of erythropoiesis and leukopoiesis (which are responsible for the production of red and white blood cells) in the case of maintenance therapy for acute lymphoblastic leukemia. The models were developed by some of the authors and introduced in [7].
The stability of all the equilibrium points was thoroughly investigated. When possible, parameter conditions for stability were determined. Some provocative and interesting conclusions resulted from the study of critical cases. For this purpose, a theorem designed by some of the authors and introduced in [8] was used. Numerical simulations were also used to validate and extend the study in some cases where the characteristic equation was too complicated.
From a biological and medical point of view, these models were validated first by the fact that the equilibrium points make sense biologically, as they correspond to existing states in which a patient may be found. Secondly, the numerical simulations, which were obtained using parameter values from the relevant literature (thus as close to reality as we could manage), depicted genuine developments of a potential patient’s health.
In the case of the erythropoiesis model, the steady-states correspond to either the death of the patient or a chronic phase of the disease. As neither is the desired state of a patient, it would be preferable that these equilibrium points be unstable. The numerical analysis yielded this favorable result.
In the leukopoiesis model, the equilibrium points depicted either the death of the patient or a healthy state of the patient. For the considered configuration of the parameters, both these steady-states were unstable, but presented a positive evolution of the patient’s condition.
Mathematical models that capture complicated situations in some diseases can aid in designing an adequate treatment. After a comprehensive mathematical study, these models can help to determine the correct dose of drug that needs to be administered for each individual patient.
Author Contributions
Conceptualization, I.B.; formal analysis, R.M.; methodology, I.B. and R.M.; resources, R.M.; software, A.-D.H.; validation, A.-D.H.; visualization, A.-D.H.; writing—original draft, I.B. and R.M.; writing—review and editing, I.B. and A.-D.H. All authors have read and agreed to the published version of the manuscript.
Funding
This research received no external funding.
Institutional Review Board Statement
Not applicable.
Informed Consent Statement
Not applicable.
Data Availability Statement
Not applicable.
Conflicts of Interest
The authors declare no conflict of interest.
References
- Abass, A.K.; Lichtman, A.H.; Pillai, S. Cellular and Molecular Immunolgy, 7th ed.; Elsevier: Amsterdam, The Netherlands, 2012. [Google Scholar]
- Adimy, M.; Crauste, F.; Ruan, S. A mathematical study of the hematopoiesis process with application to chronic myelogenous leukemia. SIAM J. Appl. Math. 2005, 65, 1328–1352. [Google Scholar] [CrossRef]
- Akushevich, I.; Veremeyeva, G.; Dimov, G.; Ukraintseva, S.; Arbeev, K.; Akleyev, A.; Yashin, A. Modeling hematopoietic system response caused by chronic exposure to ionizing radiation. Radiat. Environ. Biophys. 2011, 50, 299–311. [Google Scholar] [CrossRef] [PubMed][Green Version]
- Childhood, A.; Collaborative Group. Duration and intensity of maintenance chemotherapy in acute lymphoblastic leukemia: Overview of 42 trials involving 12,000 randomized children. Lancet 1996, 347, 1783–1788. [Google Scholar]
- Pui, C.H.; Evans, W.E. Treatment of acute lymphoblastic leukemia. N. Engl. J. Med. 2006, 354, 166–178. [Google Scholar] [CrossRef] [PubMed]
- Lin, T.L.; Vala, M.S.; Barber, J.P.; Karp, J.E.; Smith, B.D.; Matsui, W.; Jones, R.J. Induction of acute lymphocytic leukemia differentiation by maintenance therapy. Leukemia 2007, 21, 1915–1920. [Google Scholar] [CrossRef] [PubMed][Green Version]
- Badralexi, I.; Halanay, A.; Mghames, R. A Delay Differential Equations model for maintenance therapy in acute lymphoblastic leukemia. UPB Sci. Bull. Ser. A 2020, 82, 13–24. [Google Scholar]
- Amin, K.; Badralexi, I.; Halanay, A.; Mghames, R. A stability theorem for equilibria of delay differential equations in a critical case and some models of cell evolution. Math. Model. Nat. Phenom. 2021, 16, 36. [Google Scholar] [CrossRef]
- Adimy, M.; Bourfia, Y.; Hbid, M.L.; Marquet, C. Age-structured model of hematopoiesis dynamics with growth factor-dependent coefficients. Electr. J. Diff. Equ. 2016, 2016, 1–20. [Google Scholar]
- Munker, R.; Hiller, E.; Glass, J.; Paquette, R. Modern Hematology. Biology and Clinical Management, 2nd ed.; Humana Press: Berlin/Heidelberg, Germany, 2007. [Google Scholar]
- Parajdi, L.G.; Precup, R.; Bonci, E.; Tomuleasa, C. A Mathematical Model of the Transition from Normal Hematopoiesis to the Chronic and Accelerated-Acute Stages in Myeloid Leukemia. Mathematics 2020, 8, 376. [Google Scholar] [CrossRef]
- Greer, J.; Arber, D.; Glader, B.; List, A.; Means, R., Jr.; Paraskevas, F.; Rodgers, G. Wintrobe’s Clinical Hematology, 13th ed.; LWW: Philadelphia, PA, USA, 2013. [Google Scholar]
- Schmiegelow, K.; Nielsen, S.; Frandsen, T.; Nersting, J. Mercaptopurine/Methotrexate Maintenance Therapy of Childhood Acute Lymphoblastic Leukemia. Clinical Facts and Fiction. J. Pediatr. 2014, 36, 503–517. [Google Scholar]
- Colijn, C.; Mackey, M.C. A Mathematical Model for Hematopoiesis: I. Periodic Chronic Myelogenous Leukemia. J. Theor. Biol. 2005, 237, 117–132. [Google Scholar] [CrossRef] [PubMed]
- Jayachandran, D.; Rundell, A.E.; Hannemann, R.; Vik, T.A.; Ramkrishna, D. Optimal Chemotherapy for Leukemia: A model-Based Strategy for Individualized Treatment. PLoS ONE 2014, 9, e109623. [Google Scholar] [CrossRef]
- Bellman, R.; Cooke, K.L. Differential-Difference Equations; Academic Press: New York, NY, USA, 1963. [Google Scholar]
- Cooke, K.; Grossman, Z. Discrete Delay, Distribution Delay and Stability Switches. J. Math. Anal. Appl. 1982, 86, 592–627. [Google Scholar] [CrossRef]
- Balea, S.; Halanay, A.; Neamtu, M. A feedback model for leukemia including, cell competition and the action of the immune system. In Proceedings of the ICNPAA World Congress, Narvik, Norway, 15–18 July 2014; Volume 1637, pp. 1316–1324. [Google Scholar]
- Cooke, K.; van den Driessche, P. On Zeroes of Some Transcendental Equations. Funkcialaj Ekvacioj 1986, 29, 7790. [Google Scholar]
Publisher’s Note: MDPI stays neutral with regard to jurisdictional claims in published maps and institutional affiliations. |
© 2022 by the authors. Licensee MDPI, Basel, Switzerland. This article is an open access article distributed under the terms and conditions of the Creative Commons Attribution (CC BY) license (https://creativecommons.org/licenses/by/4.0/).