Abstract
Public goods games have been extensively studied to determine the mechanism behind cooperation in social dilemmas. Previous public goods games based on particle swarm algorithms enabled individuals to integrate their past best strategies with the current best strategies of their neighbors, which can effectively promote cooperation. In this paper, we introduce the concept of memory stability and explore the effects of different memory stability coefficients on strategy distribution, strategy update rate, and average cooperation level. Our simulation results showed that, in the case of a very high propensity coefficient, infinite memory stability coefficients cannot reach a high level of cooperation, while reducing memory stability can reach a very high level of cooperation. At a low enhancement factor, weakening memory stability decreased the average cooperation level, while at a higher enhancement factor, a weakening memory stability greatly increased the average group cooperation level. Our study provides new insights into the application of particle swarm algorithms to public goods games.
MSC:
91B18; 91A22
1. Introduction
According to Darwin’s theory of natural selection [1,2], individuals tend to be selfish and will use strategies that maximize the benefit they obtain as much as possible. However, cooperation is ubiquitous in both natural and social systems in real life [3,4,5]. Therefore, it is a challenging problem to understand the generation, maintenance and evolution of cooperative behavior among selfish individuals [6,7]. The Prisoner’s Dilemma Game (PDG) is a typical paradigm for studying the evolution of cooperation between two selfish individuals, and the public goods game (PGG) extends it to the evolution of cooperation between multiple selfish individuals and has received extensive attention in the study of cooperation problems [8,9,10]. In the simplest PGG [11,12], N participants are asked to decide whether they wish to contribute to the common pool (i.e., cooperate) or not (i.e., defect), and subsequently, the total contribution value multiplied by an enhancement factor is equally distributed among all participants, regardless of whether they contributed or not. Obviously, the overall payoff is maximized when all participants choose to cooperate. However, participants face the temptation of free-riding and selfishly choosing to defect in order to obtain the maximum individual payoff, because no matter what other participants choose, individuals who choose to defect always obtain a higher payoff, which leads to the Tragedy of the Commons [13].
Based on years of research on social dilemmas, Nowak summarized five main mechanisms of cooperative evolution [14], namely, direct reciprocity, indirect reciprocity, kin selection, group selection, and network reciprocity. Due to the rapid development of complex networks, considerable effort has been invested in the cooperative evolution of structured populations and their network reciprocity in the last decade [15,16,17,18,19,20,21,22,23]. Scholars in economics, biology, and social sciences have tried to explain social dilemmas from different perspectives and proposed many important mechanisms, such as rewarding cooperators [24,25,26,27], punishing defectors [28,29,30,31,32,33], taxation [34,35], noise [36,37,38], social diversity [39,40,41,42], reputation [43,44,45], and so on.
In addition to mechanisms regarding cooperation, the influence of strategy renewal rules on cooperation cannot be ignored. Theoretical scholars from various disciplines have proposed various updating rules of the strategy, including desire-driven [46,47], Fermi [48], Moran processes [49,50], and so on. Some scholars have introduced the idea of group intelligence into the strategy update rules. However, the strategy update rule mentioned above only applies to the case of discrete strategies, namely to either purely cooperate or to purely defect. In real life, people’s strategy choices are unlikely to be simply black or white.
Scholars then tried to introduce the particle swarm optimization (PSO) intelligence algorithm to study the effect of PSO learning rules on the cooperative evolution of successive strategies. With the PSO learning rule, participants adjust their own strategies by considering the payoffs of their opponents and their own historical experiences. Chen et al. introduced PSO into the PGG in [51]. Their simulation experiments showed that cooperative behavior in the PGG can be effectively generated and maintained using group intelligence algorithms. Quan et al. [52] proposed two punishment mechanisms for the public goods game, which are self-punishment due to personal guilt and peer punishment due to peer dissatisfaction. The parameters of individual tolerance and social tolerance are adjusted to determine whether individuals are punished or not or whether they punish others. Through simulation experiments, both punishment mechanisms were found to significantly promote cooperation. Quan et al. [53] investigated the effect of PSO on the evolution of cooperation for two structured populations of square networks and nearest neighbor coupled networks, respectively. They found that the nearest neighbor coupled network structure promoted cooperation in the SPGG more effectively. Lv et al. [54] proposed a public goods model in which each participant could adjust the proportion of the amount he or she spent on investment versus that spent on punishment based on PSO. The effect of PSO learning rules on cooperation and punishment evolution was investigated, and the effect of propensity coefficients on the cooperation evolution and cooperation punishment inputs was found to vary with punishment intensity. The propensity coefficient determines whether players prefer to stick to their best historical investments or mimic the best performing investments in their current neighborhood. Its higher value indicates that the participant prefers to learn from his own history. For lower punishment intensities, lower propensity coefficient values facilitate cooperative evolution. However, as punishment intensity increases, higher propensity coefficients facilitate cooperation. The PSO-based PGG studies described above were concerned with learning from the neighbors’ performance versus their own historical best memories. However, in real life, people’s memory mechanisms are complex, and the memory scale is not infinite. Moreover, as the external environment changes, learning memories that are too obsolete may not be applicable for the new environment.
In this paper, we introduce the concept of memory stability [55], using a combination of two aspects, the amount of the payoff and the difference between the current time step and the time step where the memory is located, to decide which historical strategy to learn. The effects of the continuous public goods game and memory stability on the evolution of cooperation are considered on a square lattice network. Participants continuously adjust the amount of investment in the public pool according to the PSO strategy update rule. We focused on the effect of the update rule based on PSO strategy on the cooperative evolution of public goods investments in different memory stability scenarios, including the effect of the average level of cooperation, the distribution of strategies, and the magnitude of strategy changes. The innovations in this paper are as follows: (1) Previous PSO solving PGG ignored the fact that human memory is not infinite and is subject to forgetting, and we supplemented and improved in this regard. (2) Previous PSO algorithms, in almost only learning their own memory and not imitating their neighbors, always learn the initial memory, resulting in the average investment value being maintained at the initial level and being unable to produce a higher average investment value, and our introduction of a memory stability PSO algorithm solved this problem.
2. Models and Methods
The participants are located on an square lattice with periodic boundary conditions. Each participant is connected to their neighbors and participates in an game organized by the participant and their neighbors. At first, with uniform probability on the interval [0, 1], each participant is assigned a strategy, which represents the willingness to cooperate. Referring to the payoff model in [52], the payoff of participant in the game centered on participant is:
where denotes the set of neighbors of participant , including the participant, and is the total amount each participant can invest in a game. We set ; denotes the investment of participant in the public pool at moment t, representing their willingness to cooperate, and () denotes the enhancement factor. At moment , the cumulative payoff of participant by participating in the self-centered vs. neighbor-centered game is:
After accumulating payoffs for each game, each participant updates their strategy simultaneously, guided by the update rules based on the PSO strategy. Because individuals investing in the common pool face the risk of being free-riding by their neighbors, rational individuals tend to choose not to invest, which leads to the worst-case scenario where the overall payoff is minimized. How to make the overall investment maximize becomes a problem.
Each participant has strategy. The magnitude of the strategy changes, and so do all of the previous memories. Depending on the magnitude of strategy changes, each participant decides to increase or decrease their investment in the common pool. The investment of participant in the common pool at time step is:
In the investment update process, participant investments are subject to the following boundary conditions: if , let ; if , then . Each participant adjusts their magnitude of change in the direction of the most profitable strategy based on their past behavior and the neighbor’s current best strategy. The magnitude of change of adjustment of the public goods investment is calculated as follows:
The propensity coefficient is a predetermined value that determines whether players tend to learn their own historical maximum-intensity memories or imitate their current highest payoff neighbors, with a smaller indicating that participants are more inclined to imitate their neighbor and a larger indicating that participants are more inclined to learn their own historical maximum-intensity memory [56]. To prevent participants from adjusting their magnitude of investment change excessively in a step, the magnitude of the participant strategy change is subject to the following boundary conditions: if , let ; if , let . Initially, given the same investment amount magnitude of the strategy change for each participant, . denotes the amount of investment in the public good with the best return among its neighboring participants at moment , defined as follows:
where denotes the amount of investment with the highest memory strength among all memories of participant , calculated as follows:
The memory strength at the moment is determined by two aspects, the first is the payoff and the second is the memory extractability ; the payoff is proportional to the memory strength, and denotes the memory extractability of moment at moment and is calculated as follows:
where is determined by the time difference and the memory stability coefficient. is the time difference, i.e., the difference between the current time step and the time step where the memory is located. is the memory stability coefficient, and when tends to infinity, participant ’s learning of historical memory is influenced only by payoff, independent of memory extractability, and the maximum-intensity memory learned each time is the memory with the best payoff in the literature [51,52,53,54]. When is not infinite, the memory intensity gradually decreases as the time difference increases. In this paper, the memory stability coefficient was divided into a total of six levels, namely 1, 2, 3, 4, 5, and infinite. When infinite, the above PSO algorithm is the same as in the literature [53]; therefore, the following simulations use infinite as a comparison. Obviously, the lower the memory stability coefficient is for the same time-difference case, the more easily the memory is forgotten. For the same stability factor, the larger the time difference, the more likely it is to be forgotten. We explored the effect of the strength of memory on the evolution of cooperation by adjusting the level of the memory stability coefficient .
The models and formulas mentioned above are the problem descriptions and constraints for the PSO optimization problem. For an individual, the PSO algorithm’s goal for adjusting his or her strategy is to maximize his or her payoff, whether the participant tends to learn from memory or tends to imitate his or her neighbors. For the whole, to maximize the overall payoff is to maximize the overall investment in the common pool, because all payoffs are obtained by multiplying the funds in the common pool by the gain coefficient; thus, the optimization goal of the PSO algorithm is to maximize the average investment.
We introduce the conceptual graph of the model under study. As shown in Figure 1, PSO integrates three factors to adjust the strategy, which are the magnitude of strategy change, the maximum strength memory, and the neighbor best strategy. Figure 2 shows a schematic diagram of the PSO algorithm guiding the strategy adjustment.
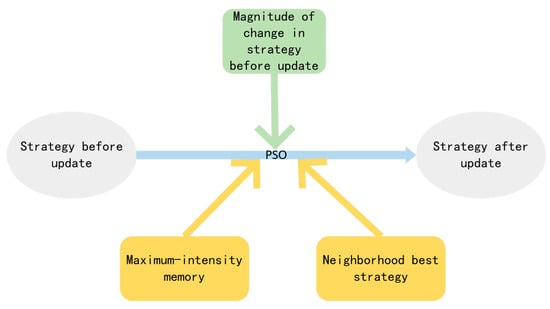
Figure 1.
The conceptual graph of the model under study.
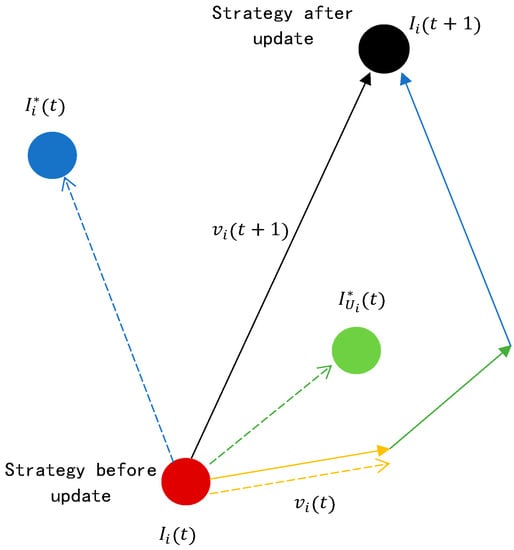
Figure 2.
Schematic diagram of the PSO algorithm guiding the strategy adjustment.
The algorithm pseudo-code and flowchart regarding the above model are given by Algorithm 1 and Figure 3, respectively.
| Algorithm 1: PGG Based on PSO with Memory Stability |
|
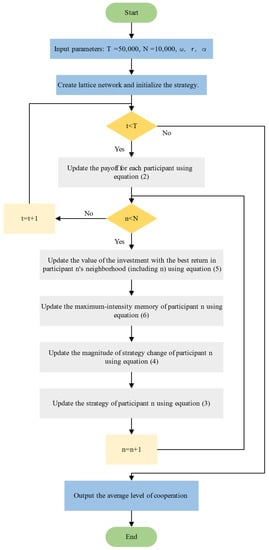
Figure 3.
Algorithm flow chart.
3. Results
We conducted simulation experiments on a square lattice network with periodic boundary conditions. Each node is connected to its top, bottom, left, and right four neighbors. There are participants located at the vertices of the network. The key metric used to characterize the cooperative behavior of the system is the average level of cooperation , defined as , where denotes the strategy of participant when the system reaches dynamic equilibrium, i.e., the value of in the system no longer varies or fluctuates within a small range. The optimization objective mentioned in the model section maximizes the average investment, i.e., the average level of cooperation. In the following simulations, is obtained by averaging the last 500 generations of over 50,000 generations when the system reaches stability. Each entry is the average of 10 individual runs. The above model was simulated with the simultaneous update rule. All simulation results were generated by a code developed in C++. The experimental hardware is an Intel(R) Xeon(R) CPU E5-2680 v4 @ 2.40 GHz server was manufactured by GenuineIntel in California, USA, and with 128 G RAM.
We first investigated the impact of the changes in on the evolution of cooperation in the high and low cases. As in Figure 4, first, cooperation was greatly enhanced in all regions of where the strategy updates were guided by group intelligence compared to the case where all participants adjusted their strategies using the Fermi rule (i.e., the original curve). In addition, in the low case, infinite kept the cooperation level at a lower value, and decreasing led to a decrease in the level of cooperation to 0. In the high case, decreasing effectively promoted cooperation. Overall, decreasing led to a larger range of values for reaching a high level of cooperation compared to infinite, as shown in Table 1. Comparing the left and right plots, the change in cooperation level due to a change in for different trends was roughly the same, but a higher increased the gap in cooperation levels for a change in compared to a lower .
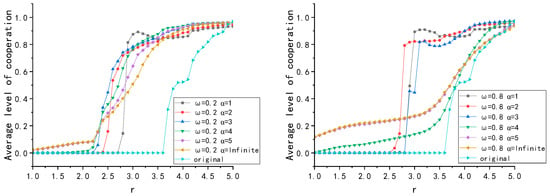
Figure 4.
Variation of the average cooperation level with the for six different values of , where is fixed to 0.2 (left) and to 0.8 (right), respectively. In addition, the “original” curve represents the case of the Fermi update rule.

Table 1.
Performance of different .
Figure 4 also shows that the curve of the high memory stability coefficient was smoother, while the curve of low memory stability coefficient was more undulating. Counter-intuitively, the curve of the low memory stability coefficient even appeared to decrease as increased. As shown in Figure 5, in the case of and , the evolutionary process = 3.8 generated more clusters of high investors compared to because the was larger, but the average level of cooperation that finally reached stability was lower. This is because there is such a situation in the evolutionary process, wherein complete investors expand outward due to network reciprocity forming clusters, and eventually there will be a small number of low investors where these clusters intersect that remain difficult to eliminate due to the high returns of low investment. In the lower case of , the entire population has fewer clusters of high investors due to network reciprocity; thus, they end up with fewer hard-to-eliminate low investors at their intersections, while in the higher case, there is many clusters and their intersection areas are larger, resulting in more hard-to-eliminate low investors and leading to a decrease in the average level of cooperation.
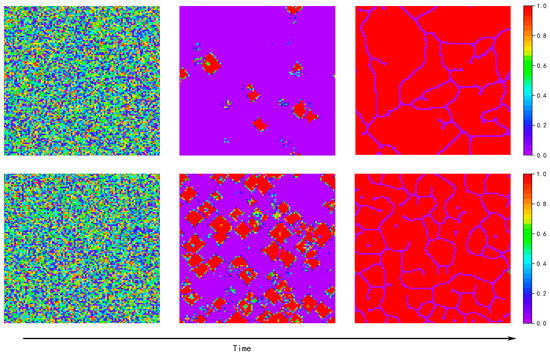
Figure 5.
Snapshots of the evolution of (top) and (bottom) for and , with progressively increasing time steps from left to right. The color encoding, as depicted at the right of each chart, indicates the values of for each individual.
We next explored the effect of changes in on the evolution of cooperation in the extreme case. At the extremely small , participants tended to imitate their neighbors almost exclusively, the effect of memory can be ignored, and the change in had no effect on the evolution of cooperation; thus, we did not include images of the extremely small in the article. At the extremely large , participants almost exclusively learned their own memories, and the effect of the change in on the evolution of cooperation was significant. As in Figure 6, in the extreme case of with infinite, even with a high , higher cooperation levels could not be reached because each participant learned almost only their initial memory and not their surrounding neighbors. In contrast, in this case, decreasing the memory stability coefficient allowed high cooperation rates to be reached even if almost no surrounding neighbors learned. Therefore, in the extremely large case, infinite could not achieve a high level of cooperation and cooperation could only be reached by decreasing .
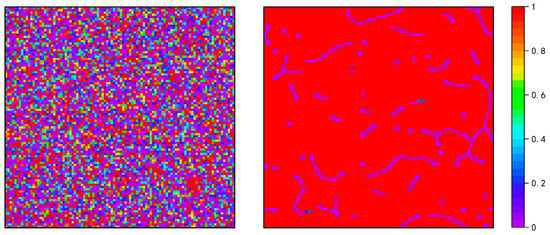
Figure 6.
Public goods game at and with infinite (left) and 3 (right), respectively. Snapshots were obtained at time step 50,000. The color encoding, as depicted at the right of each chart, indicates the values of for each individual.
To investigate the combined effect of the memory stability coefficient on the level of population cooperation, we took 100 points in each of the two parameter intervals and as parameters in our experiments. We conducted simulation experiments for each pair of parameter combinations. Figure 7 shows a plot of the population cooperation level versus the parameter for different memory stability coefficients . Each data point was obtained by averaging the average cooperation level over the last 500 time-steps of a total of 50,000 time-steps, and each data point was calculated from the average of 10 independent realizations.
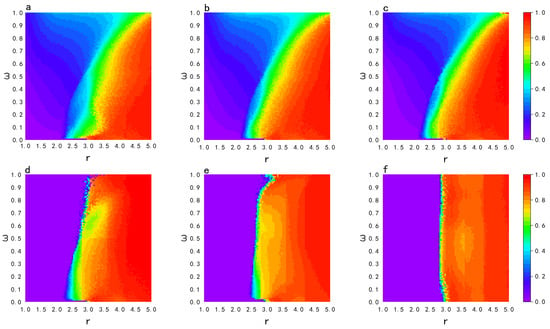
Figure 7.
Relationships between population cooperation levels and the parameter for different memory stability coefficients . (a–f) represent infinite, 5, 4, 3, 2, 1, respectively. Color coding indicates the average cooperation level , as shown on the right side of each graph.
As can be seen from Figure 7, a decrease in at a higher promoted cooperation, whereas a lower value of at lower reduced the overall cooperation level. Changes in affect only the part of learning from one’s own history and not from one’s neighbors; thus, the effect of on cooperative evolution is greater at the case of higher values. Therefore, we next chose as a prerequisite to explore the effect of different memory stability coefficients on cooperative evolution in detail.
To explore the effect of the change in on the distribution of group strategies for different cases, we simulated three values of for and , respectively. Figure 8 gives snapshots after the evolution of different combinations of and reach stability. At , infinite could maintain a certain level of cooperation, and a smaller led to unsustainable cooperation; at , it can be seen that high investors formed clusters through network reciprocity and participants on the periphery of the cluster defended themselves against completely non-investors through lower investments. However, after a certain level of expansion, high made participants on the periphery of the cluster retain the memory of investing less and earning more, which led to a decrease in investment. Thus, the effect of on the level of cooperation of the group was bidirectional. When was relatively small, lowering made cooperation unsustainable, while when was large, lowering significantly promoted cooperation.
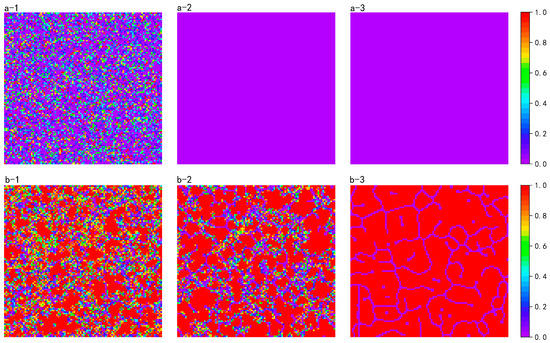
Figure 8.
Comparisons of strategy space distributions for different combinations of and : (a) at ; (b) at . (1) , infinite; (2) , ; (3) , . Snapshots were obtained at time-step 50,000. The color encoding, as depicted at the right of each chart, indicates the values of for each individual.
To explore the effect of the change in on the distribution of the magnitude of strategy change, as in Figure 9, at low , with infinite, participants learned the initial investment memory, and most participants updated their strategies slowly, allowing the system to maintain a low level of cooperation rather than a completely uncooperative one. At a high value of , the strategy update rate increased in the positive direction as decreased, and at , the positive increase in the magnitude of strategy change was obvious for participants forming clusters. Only a very small number of participants at the intersection of clusters and clustering increased their strategy update rate in the negative direction. Thus, at a low , the magnitude of strategy change increased in the negative direction as decreased; at a high , it increased in the positive direction as decreased.
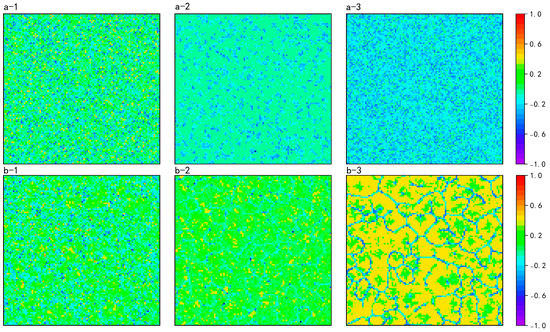
Figure 9.
Comparisons of the spatial distribution of the magnitude of strategy change for different combinations of and : (a) at ; (b) at . (1) , infinite; (2) , ; (3) , . The color encoding, as depicted at the right of each chart, indicates the values of for each individual.
To understand more intuitively the effect of on the diversity of public good investment, Figure 10 gives the distribution of public good investments for different values of . At , as the level decreased, the average individual strategy update rate increased in the negative direction, and participants’ investment in the common pool decreased to 0. At , as decreased, most of participant strategy update rates increased in the positive direction, and a small number of participant strategy update rates increased in the negative direction, resulting in a decrease in the median value of investment, which ended up with only two strategy values of 0 and 1. Thus, as the memory stability coefficient decreased, the diversity of investment also decreased.
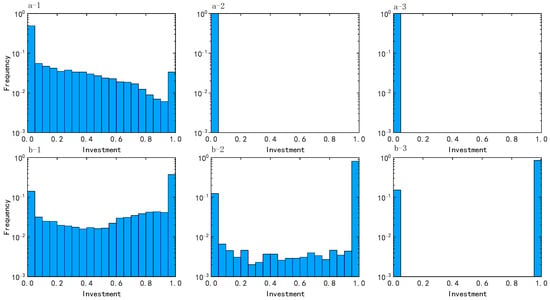
Figure 10.
Comparisons of the distribution of strategy values for different combinations of and : (a) at ; (b) at . (1) , infinite; (2) , ; (3) , . Data were obtained at time-step 50,000.
Figure 11 shows the mean of the difference between the participants’ current time-step and the time-step where the learned memory was located for different combinations of and . Because the system reached stability at time step 5000, we only plotted the images for the first 5000 time-steps. Larger values indicate that the overall average learned memory is older. In the low case, when infinite, most participants learned the initial strategy and could maintain a certain rate of cooperation, which can be maintained. A lower cannot promote cooperation, and the investment environment gradually becomes worse after participants forget the initial strategy memory and cannot maintain cooperation. In the higher case of , when infinite, most participants were still learning the initial memory, leading to a stagnant rise in the level of cooperation. When , a higher can promote higher-investment participants to form clusters through network reciprocity, the environment gradually becomes better, and participants forget the initial memories and can reach higher levels of cooperation. As shown in Figure 12, at a lower , lowering the memory stability coefficient causes participants to forget their initial memories and new memories to invest less than one at a time, thus causing the average cooperation level to fall rapidly, while at a higher , lowering the memory stability coefficient causes lower investors around the clusters formed by high-investing participants to forget the memories of previous low investments with high returns and learn from the high-investing participants, thus causing the average cooperation level to rise. Therefore, in the case of infinite, participants learn a very old memory, and for low , this memory enables cooperation to be maintained at a low level. For a high , this memory leads to a stagnant level of cooperation; lowering causes participants to learn new memories, which is not conducive to the maintenance of cooperation at low , but can facilitate the generation of cooperation at high .
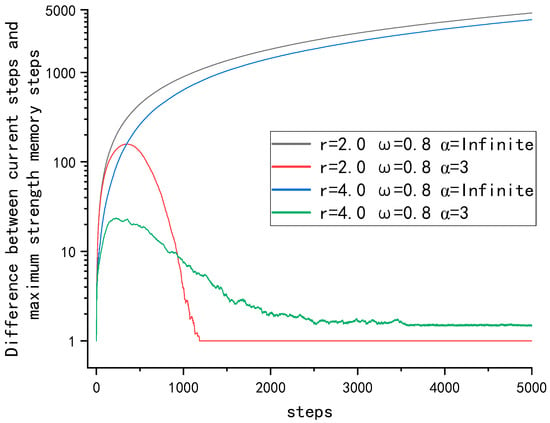
Figure 11.
Variation over time of the difference between the current time-step and the timestep where the maximum-intensity memory is located for different combinations of and .
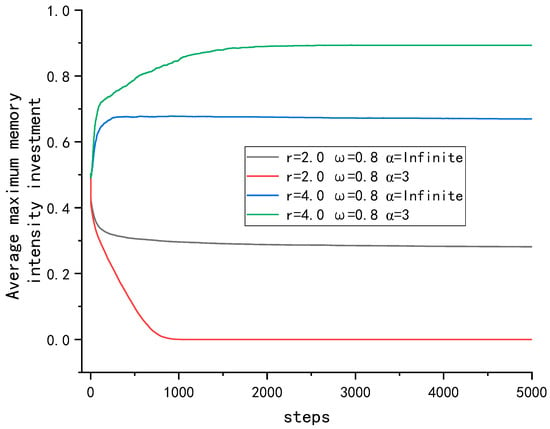
Figure 12.
Evolution of the mean value of investment in maximum-intensity memory over time for different combinations of and at .
To explore the effect of the change in on the change in cooperation level during evolution for different cases, as shown in Figure 13, all six curves reach stability within 5000 time-steps; thus, we only plotted the evolution up to 5000 time-steps. When , a lower memory stability coefficient causes its average cooperation level to fall faster, while when , a lower memory stability coefficient causes the average cooperation level to rise faster, but the faster rise does not mean that the average cooperation level is higher when the system reaches stability. The effect of the memory stability coefficient on the average cooperation level at a higher and a lower is diametrically opposed because the average cooperation level changes differently at a higher and a lower . At a lower , those who invest high are exploited by those who invest low, and overall, this is unfavorable to those who invest high; thus, their average cooperation level decreases. A high memory stability coefficient makes participants learn their initial investment strategy, which can maintain the average cooperation level at a lower level and no longer decline. When is relatively high, participants with a high investment tend to converge into clusters and make their payoffs greater than those of the surrounding participants with a low investment through network reciprocity, and at this time, the ω parameter is larger, and participants are more inclined to learn their own history. Those with a low investment continue to learn from the memory with a low investment and a higher payoff in the past, which leads to an average investment level. After a certain level, it does not continue to rise. Thus, as decreases, the average cooperation level changes faster, but in a different direction, decreasing at a low and increasing at a high .
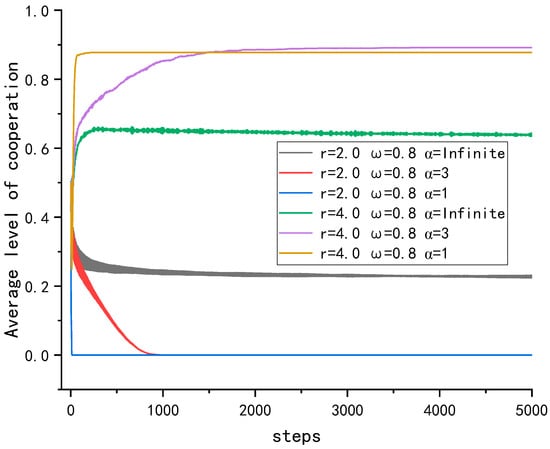
Figure 13.
Evolution of mean cooperation level over time for different combinations of and at .
As shown in Figure 14, because the average strategy update rate reaches stability within 5000 time-steps, we only plotted the change in the average policy update rate within 5000 time-steps. It can be seen that at a higher , decreasing the memory stability coefficient leads to a decrease in the average magnitude of strategy change, and the smaller the memory stability coefficient, the faster the average magnitude of strategy change decreases. At a lower , decreasing the memory stability coefficient leads to a rise in the average magnitude of strategy change, and the smaller the memory stability coefficient, the faster the average magnitude of strategy change rises.
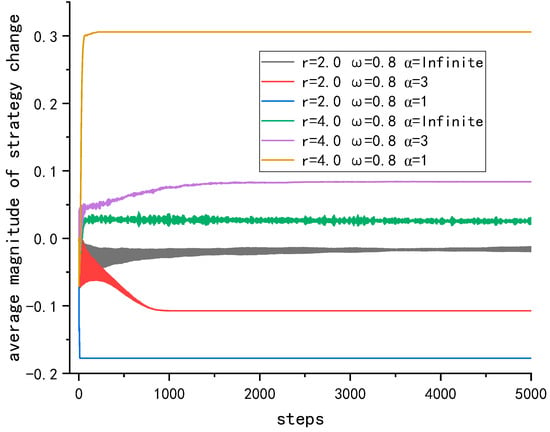
Figure 14.
Evolution of the average magnitude of strategy change with time for different combinations of and at .
Combined with the results in Figure 13 and Figure 14, it can be seen that a high rate of strategy updates does not necessarily mean a high average level of final cooperation; this is because an excessive magnitude of strategy change of the strategy update leads to rapid changes in the investment of some participants, causing some low investors to be surrounded by these high investors before they can learn from the high investors, resulting in gaining high returns, and these low investors become exploiters. A slower rising magnitude of strategy change gives low investors time to learn from their high investor neighbors, making the average level of cooperation higher.
4. Conclusions
In this study, we investigated the application of the particle swarm algorithm with memory stability to the public goods game with reference to the human forgetting curve and analyzed its effect on the cooperation level, the maximum memory strength, and the magnitude of the strategy change under each parameter., and the following conclusions are obtained. affects the cooperation level of the group in both directions, and at a low , infinite (i.e., the original PSO algorithm) allows participants to learn the initial memory, which keeps the cooperation level at a low value without going to 0. Decreasing leads to a decrease in the cooperation level. In contrast, in the high case, infinite allows participants to inhibit cooperation by not forgetting previous low-investment memories, and decreasing effectively promotes cooperation. Decreasing results in a larger range of parameters that produce high levels of cooperation compared to infinite. In the extremely large case, where participants learn only their own histories, the original PSO algorithm cannot achieve high cooperation levels, while our PSO algorithm, introducing memory stability, achieved high cooperation levels by reducing the memory stability coefficient. In summary, in the unfavorable case of low , increasing the memory stability and preserving the long-standing memories can maintain a good cooperation rate, while with a high , the memory stability coefficient needs to be reduced to forget the low-investment memories to produce a higher average cooperation level. In the case where one does not imitate one’s neighbors and only learns one’s own history, one needs to lower to achieve high levels of cooperation. We hope our work has provided additional help in understanding the impact of particle swarm algorithms in the evolution of cooperation in public goods games.
Author Contributions
Conceptualization, S.W. and H.J.; methodology, S.W. and H.J.; software, S.W. and Z.L.; formal analysis, S.W.; investigation, S.W.; resources, S.W.; data curation, S.W. and Z.L.; writing—original draft preparation, S.W.; writing—review and editing, S.W., H.J. and W.L.; visualization, S.W.; supervision, H.J. and W.L.; project administration, H.J.; funding acquisition, H.J. All authors have read and agreed to the published version of the manuscript.
Funding
This research was funded by the National Natural Science Foundation of China, grant number 62162066.
Data Availability Statement
Not applicable.
Conflicts of Interest
The authors declare no conflict of interest.
References
- Hofbauer, J.; Sigmund, K. Evolutionary Games and Population Dynamics; Cambridge University Press: Cambridge, UK, 1998. [Google Scholar]
- Smith, J.M. Evolution and the Theory of Games; Cambridge University Press: Cambridge, UK, 1982. [Google Scholar]
- Lahkar, R.; Mukherjee, S. Evolutionary implementation in a public goods game. J. Econ. Theory 2019, 181, 423–460. [Google Scholar] [CrossRef]
- Axelrod, R.; Hamilton, W.D. The evolution of cooperation. Science 1981, 211, 1390–1396. [Google Scholar] [CrossRef]
- Von Neumann, J.; Morgenstern, O. Theory of Games and Economic Behavior; Princeton University Press: Princeton, NJ, USA, 2007. [Google Scholar]
- Johnson, D.D.; Stopka, P.; Knights, S. The puzzle of human cooperation. Nature 2003, 421, 911–912. [Google Scholar] [CrossRef] [PubMed]
- Nowak, M.; Highfield, R. Supercooperators: Altruism, Evolution, and Why We Need Each Other to Succeed; Simon and Schuster: Manhattan, NY, USA, 2011. [Google Scholar]
- Ito, H.; Tanimoto, J. Scaling the phase-planes of social dilemma strengths shows game-class changes in the five rules governing the evolution of cooperation. R. Soc. Open Sci. 2018, 5, 181085. [Google Scholar] [CrossRef] [PubMed]
- Tanimoto, J.; Sagara, H. Relationship between dilemma occurrence and the existence of a weakly dominant strategy in a two-player symmetric game. BioSystems 2007, 90, 105–114. [Google Scholar] [CrossRef] [PubMed]
- Tanimoto, J. Difference of reciprocity effect in two coevolutionary models of presumed two-player and multiplayer games. Phys. Rev. E 2013, 87, 062136. [Google Scholar] [CrossRef]
- Perc, M.; Jordan, J.J.; Rand, D.G.; Wang, Z.; Boccaletti, S.; Szolnoki, A. Statistical physics of human cooperation. Phys. Rep. 2017, 687, 1–51. [Google Scholar] [CrossRef]
- Perc, M. Phase transitions in models of human cooperation. Phys. Lett. A 2016, 380, 2803–2808. [Google Scholar] [CrossRef]
- Macy, M.W.; Flache, A. Learning dynamics in social dilemmas. Proc. Natl. Acad. Sci. USA 2002, 99, 7229–7236. [Google Scholar] [CrossRef]
- Nowak, M.A. Five rules for the evolution of cooperation. Science 2006, 314, 1560–1563. [Google Scholar] [CrossRef]
- Assenza, S.; Gómez-Gardeñes, J.; Latora, V. Enhancement of cooperation in highly clustered scale-free networks. Phys. Rev. E 2008, 78, 017101. [Google Scholar] [CrossRef] [PubMed]
- Lv, S.; Li, J.; Mi, J.; Zhao, C. The roles of heterogeneous investment mechanism in the public goods game on scale-free networks. Phys. Lett. A 2020, 384, 126343. [Google Scholar] [CrossRef]
- Nowak, M.A.; May, R.M. Evolutionary games and spatial chaos. Nature 1992, 359, 826–829. [Google Scholar] [CrossRef]
- Perc, M. Success-driven distribution of public goods promotes cooperation but preserves defection. Phys. Rev. E 2011, 84, 037102. [Google Scholar] [CrossRef] [PubMed]
- Chen, X.; Szolnoki, A. Individual wealth-based selection supports cooperation in spatial public goods games. Sci. Rep. 2016, 6, 32802. [Google Scholar] [CrossRef]
- Wu, Z.-X.; Yang, H.-X. Social dilemma alleviated by sharing the gains with immediate neighbors. Phys. Rev. E 2014, 89, 012109. [Google Scholar] [CrossRef]
- Yang, H.-X.; Rong, Z.; Wang, W.-X. Cooperation percolation in spatial prisoner’s dilemma game. New J. Phys. 2014, 16, 013010. [Google Scholar] [CrossRef]
- Wang, Z.; Szolnoki, A.; Perc, M. Different perceptions of social dilemmas: Evolutionary multigames in structured populations. Phys. Rev. E 2014, 90, 032813. [Google Scholar] [CrossRef]
- Perc, M.; Szolnoki, A. Coevolutionary games—A mini review. BioSystems 2010, 99, 109–125. [Google Scholar] [CrossRef]
- Zhang, C.; Chen, Z. The public goods game with a new form of shared reward. J. Stat. Mech. Theory Exp. 2016, 2016, 103201. [Google Scholar] [CrossRef]
- Hauert, C. Replicator dynamics of reward & reputation in public goods games. J. Theor. Biol. 2010, 267, 22–28. [Google Scholar] [CrossRef] [PubMed]
- Wang, Z.; Szolnoki, A.; Perc, M. Rewarding evolutionary fitness with links between populations promotes cooperation. J. Theor. Biol. 2014, 349, 50–56. [Google Scholar] [CrossRef] [PubMed]
- Dragicevic, A.Z. Conditional rehabilitation of cooperation under strategic uncertainty. J. Math. Biol. 2019, 79, 1973–2003. [Google Scholar] [CrossRef] [PubMed]
- Boyd, R.; Gintis, H.; Bowles, S. Coordinated punishment of defectors sustains cooperation and can proliferate when rare. Science 2010, 328, 617–620. [Google Scholar] [CrossRef] [PubMed]
- Helbing, D.; Szolnoki, A.; Perc, M.; Szabó, G. Evolutionary establishment of moral and double moral standards through spatial interactions. PLoS Comput. Biol. 2010, 6, e1000758. [Google Scholar] [CrossRef] [PubMed]
- Oya, G.; Ohtsuki, H. Stable polymorphism of cooperators and punishers in a public goods game. J. Theor. Biol. 2017, 419, 243–253. [Google Scholar] [CrossRef]
- Szolnoki, A.; Perc, M. Correlation of positive and negative reciprocity fails to confer an evolutionary advantage: Phase transitions to elementary strategies. Phys. Rev. X 2013, 3, 041021. [Google Scholar] [CrossRef]
- Szolnoki, A.; Perc, M. Second-order free-riding on antisocial punishment restores the effectiveness of prosocial punishment. Phys. Rev. X 2017, 7, 041027. [Google Scholar] [CrossRef]
- Kaiping, G.; Cox, S.; Sluckin, T. Cooperation and punishment in community-structured populations with migration. J. Theor. Biol. 2016, 405, 116–126. [Google Scholar] [CrossRef]
- Lee, H.-W.; Cleveland, C.; Szolnoki, A. Mercenary punishment in structured populations. Appl. Math. Comput. 2022, 417, 126797. [Google Scholar] [CrossRef]
- Li, M.; Kang, H.; Sun, X.; Shen, Y.; Chen, Q. Replicator dynamics of public goods game with tax-based punishment. Chaos Solitons Fractals 2022, 164, 112747. [Google Scholar] [CrossRef]
- Perc, M.; Marhl, M. Evolutionary and dynamical coherence resonances in the pair approximated prisoner’s dilemma game. New J. Phys. 2006, 8, 142. [Google Scholar] [CrossRef]
- Perc, M. Transition from gaussian to levy distributions of stochastic payoff variations in the spatial prisoner’s dilemma game. Phys. Rev. E 2007, 75, 022101. [Google Scholar] [CrossRef] [PubMed]
- Franović, I.; Todorović, K.; Perc, M.; Vasović, N.; Burić, N. Activation process in excitable systems with multiple noise sources: One and two interacting units. Phys. Rev. E 2015, 92, 062911. [Google Scholar] [CrossRef] [PubMed]
- Rong, Z.; Wu, Z.-X.; Hao, D.; Chen, M.Z.; Zhou, T. Diversity of timescale promotes the maintenance of extortioners in a spatial prisoner’s dilemma game. New J. Phys. 2015, 17, 033032. [Google Scholar] [CrossRef]
- Wu, Z.-X.; Rong, Z.; Yang, H.-X. Impact of heterogeneous activity and community structure on the evolutionary success of cooperators in social networks. Phys. Rev. E 2015, 91, 012802. [Google Scholar] [CrossRef]
- Huang, K.; Zheng, X.; Su, Y. Effect of heterogeneous sub-populations on the evolution of cooperation. Appl. Math. Comput. 2015, 270, 681–687. [Google Scholar] [CrossRef]
- Zhu, C.-J.; Sun, S.-W.; Wang, L.; Ding, S.; Wang, J.; Xia, C.-Y. Promotion of cooperation due to diversity of players in the spatial public goods game with increasing neighborhood size. Phys. A Stat. Mech. Appl. 2014, 406, 145–154. [Google Scholar] [CrossRef]
- Han, W.; Zhang, Z.; Sun, J.; Xia, C. Emergence of cooperation with reputation-updating timescale in spatial public goods game. Phys. Lett. A 2021, 393, 127173. [Google Scholar] [CrossRef]
- Yang, W.; Wang, J.; Xia, C. Evolution of cooperation in the spatial public goods game with the third-order reputation evaluation. Phys. Lett. A 2019, 383, 125826. [Google Scholar] [CrossRef]
- Shen, Y.; Yin, W.; Kang, H.; Zhang, H.; Wang, M. High-reputation individuals exert greater influence on cooperation in spatial public goods game. Phys. Lett. A 2022, 428, 127935. [Google Scholar] [CrossRef]
- Du, J.; Wu, B.; Wang, L. Aspiration dynamics in structured population acts as if in a well-mixed one. Sci. Rep. 2015, 5, 8014. [Google Scholar] [CrossRef] [PubMed]
- Du, J.; Wu, B.; Wang, L. Aspiration dynamics and the sustainability of resources in the public goods dilemma. Phys. Lett. A 2016, 380, 1432–1436. [Google Scholar] [CrossRef]
- Szabó, G.; Tőke, C. Evolutionary prisoner’s dilemma game on a square lattice. Phys. Rev. E 1998, 58, 69. [Google Scholar] [CrossRef]
- Lieberman, E.; Hauert, C.; Nowak, M.A. Evolutionary dynamics on graphs. Nature 2005, 433, 312–316. [Google Scholar] [CrossRef]
- Sarkar, B. Moran-evolution of cooperation: From well-mixed to heterogeneous complex networks. Phys. A Stat. Mech. Appl. 2018, 497, 319–334. [Google Scholar] [CrossRef]
- Chen, Y.-S.; Yang, H.-X.; Guo, W.-Z.; Liu, G.-G. Promotion of cooperation based on swarm intelligence in spatial public goods games. Appl. Math. Comput. 2018, 320, 614–620. [Google Scholar] [CrossRef]
- Quan, J.; Yang, X.; Wang, X. Continuous spatial public goods game with self and peer punishment based on particle swarm optimization. Phys. Lett. A 2018, 382, 1721–1730. [Google Scholar] [CrossRef]
- Quan, J.; Yang, X.; Wang, X. Spatial public goods game with continuous contributions based on particle swarm optimization learning and the evolution of cooperation. Phys. A Stat. Mech. Appl. 2018, 505, 973–983. [Google Scholar] [CrossRef]
- Lv, S.; Song, F. Particle swarm intelligence and the evolution of cooperation in the spatial public goods game with punishment. Appl. Math. Comput. 2022, 412, 126–586. [Google Scholar] [CrossRef]
- Woźniak, P.A.; Gorzelańczyk, E.J.; Murakowski, J.A. Two components of long-term memory. Acta Neurobiol. Exp. 1995, 55, 301–305. [Google Scholar]
- Dragicevic, A.Z.; Shogren, J.F. Preservation value in socio-ecological systems. Ecol. Model. 2021, 443, 109451. [Google Scholar] [CrossRef]
Publisher’s Note: MDPI stays neutral with regard to jurisdictional claims in published maps and institutional affiliations. |
© 2022 by the authors. Licensee MDPI, Basel, Switzerland. This article is an open access article distributed under the terms and conditions of the Creative Commons Attribution (CC BY) license (https://creativecommons.org/licenses/by/4.0/).