1. Introduction
The node in the attributed graph has not only topological characteristics but also features. Attributed graphs are widely used in various fields, such as protein networks, chemical molecular composition networks, and recommendation systems [
1,
2,
3]. The analysis of the attribute graph is of great significance for understanding the topology and dynamic characteristics, modules, functions and evolution of the entire network. Graph embedding, also known as graph representation learning, is a method of mapping nodes in a graph to corresponding low-dimensional vectors, which can significantly reduce the difficulty of analyzing attributed graphs. The difficulty of embedding in the attributed graph is how to make the learned low-dimensional vectors perfectly integrate and represent the topology information and feature information of nodes.
In recent years, thanks to the excellent performance of graph neural networks in fusing topological information and feature information, GNN-based methods [
2] have greatly improved the accuracy of graph embedding. At present, most graph-embedding methods based on graph neural networks use graph autoencoders [
4]. The focus of this paper is to learn better low-dimensional vector representations of attributed graph based on graph autoencoders. The graph autoencoder structure uses graph convolutional network (GCN) as the encoder, the inner product of the vectors as the decoder, and the cross-entropy between the reconstructed graph and the original graph as the loss function.
Among the existing methods, the improvement of the graph autoencoder is also the improvement of the encoder, the decoder, and loss function, respectively. After analyzing the existing methods, we find that most of the methods mentioned so far do not take into consideration the cluster. In real life, groups have an obvious influence on individual decision making; a persuasive example is herd mentality. In the same way, embeddings will be clustered spontaneously and automatically during generation, and these clusters will have a non-ignorable impact on the subsequent generation of each embedding.
Accordingly, we assume that clusters play an important role in the process of learning low-dimensional vectors of nodes. Based on this assumption, in this paper, we design and propose a new model that takes into account the influence of clusters. We name our method Graph Autoencoder based on Attention with Cluster (GAE-AC). In our method, for the first two layers, we use the GCN layer to generate node representations, except that we add a new layer in which we first divide nodes into different clusters, then perform the pooling operation, and finally, we use the attention mechanism to pass the message of pooling nodes and generate the embedding of the graph. To validate our model and assumption, we can perform a link prediction task and node clustering task. Experiments on different datasets show that our model achieves remarkable improvement on graph downstream tasks compared with baseline methods, which verifies rationality of our assumption and excellence of our model. Our main contributions are as follows.
We propose a novel spatial convolution layer based on attention with cluster. We use attention mechanisms to integrate different information from clusters, which effectively aggregates and distinguishes the information of different clusters for nodes in a graph.
We propose a new attributed graph-embedding method named GAE-AC. We use GCN layers to integrate local information of neighbors and use an attention-with-cluster layer to integrate global information of different clusters.
We use different datasets and apply the learned low-dimensional of GAE-AC to node clustering and link prediction tasks. The experimental results show that our model has achieved excellent performance in the corresponding tasks.
The remaining sections of this paper are arranged as follows. In
Section 2, we review related studies about graph embedding and graph autoencoders. In
Section 3, we present the proposed model. In
Section 4, we introduce our design of experiments and detail the results. In
Section 5, we conduct a comprehensive analysis of our model based on experimental results. Finally, in
Section 6, we conclude this paper.
2. Related Works
2.1. Graph Embedding
Graph embedding is also called graph representation learning. The difficulty of graph embedding is how to convert nodes in the original graph to low-dimensional space. At the same time, since the node also has its own features, how to integrate the topological information and the feature information is a key point of the research. Traditional methods are inspired by Laplacian eigenmaps [
5] and matrix factorization [
6]. For the embedding only for the graph with no features, the existing research mainly includes methods based on graph topology. DeepWalk [
7] first samples the node sequence from the graph by random walk, and we apply the SkipGram model to obtain the final vector representation. Methods such as DeepWalk include node2vec [
8], LINE [
9], and SDNE [
10]. The methods mentioned above have an obvious disadvantage in that the algorithms only learn the embedding for the topology structure of the graph. If you want to consider the features of the node, you need to define another separate module and then perform extra aggregation [
11].
Another more reasonable way is to effectively combine the feature information and topology information of nodes during the training process. The proposition of the graph neural network solves this problem effectively. The graph neural network represented by GCN [
2] or GAT [
12] defines the convolution on the typical non-European data such as graphs, so that when generating vectors in low-dimensional space, the topological information and feature information of the nodes are perfectly and directly integrated together.
2.2. Graph Autoencoder
Graph autoencoder applies the graph neural network into the autoencoder framework, making it applicable to unsupervised learning tasks. The purpose of the graph autoencoder is to learn the low-dimensional representation of the graph so that it can reconstruct the original graph structure or node features through decoding.
The typical models of the graph autoencoder are GAE and VGAE [
4]. GAE/VGAE uses GCN as the encoder, the inner product of the embedding vector as the decoder, and the cross-entropy between the reconstructed adjacency matrix and the original adjacency matrix as the loss function. We also divide methods based on the graph autoencoder into three corresponding categories: DAEGC [
13], GEC-CSD [
14] and MRFasGCN [
15] are representative methods of improving the encoder, TGA/TVGA [
16] using triadic decoder is the typical method of improving the decoder; in addition to the loss function, improvements include clustering loss optimizer [
17], modularity optimizer [
18], and difference maximizer between the real dataset and corresponding random model [
19].
For the improvement of the encoder, except for when using GCN, DAEGC and GEC-CSD apply GAT as the encoder; GUCD [
20] uses MRFasGCN as the encoder. MRFasGCN is an encoder designed based on the idea of a Markov random field, which designs a new convolution layer to focus on community detection tasks. In addition, we find that the current encoder does not fully consider the impact of clusters aggregated in the process of learning embeddings. So, we take the impact of clusters into account, and our research also focuses on the encoder. We also find that GAT uses the attention to pass the features of neighbors. GAT is more efficient compared with GCN, which improves the performance of DAEGC and GEC-CSD in the experiments. Inspired by these methods, we also use the attention mechanism to fuse the cluster information.
3. Method
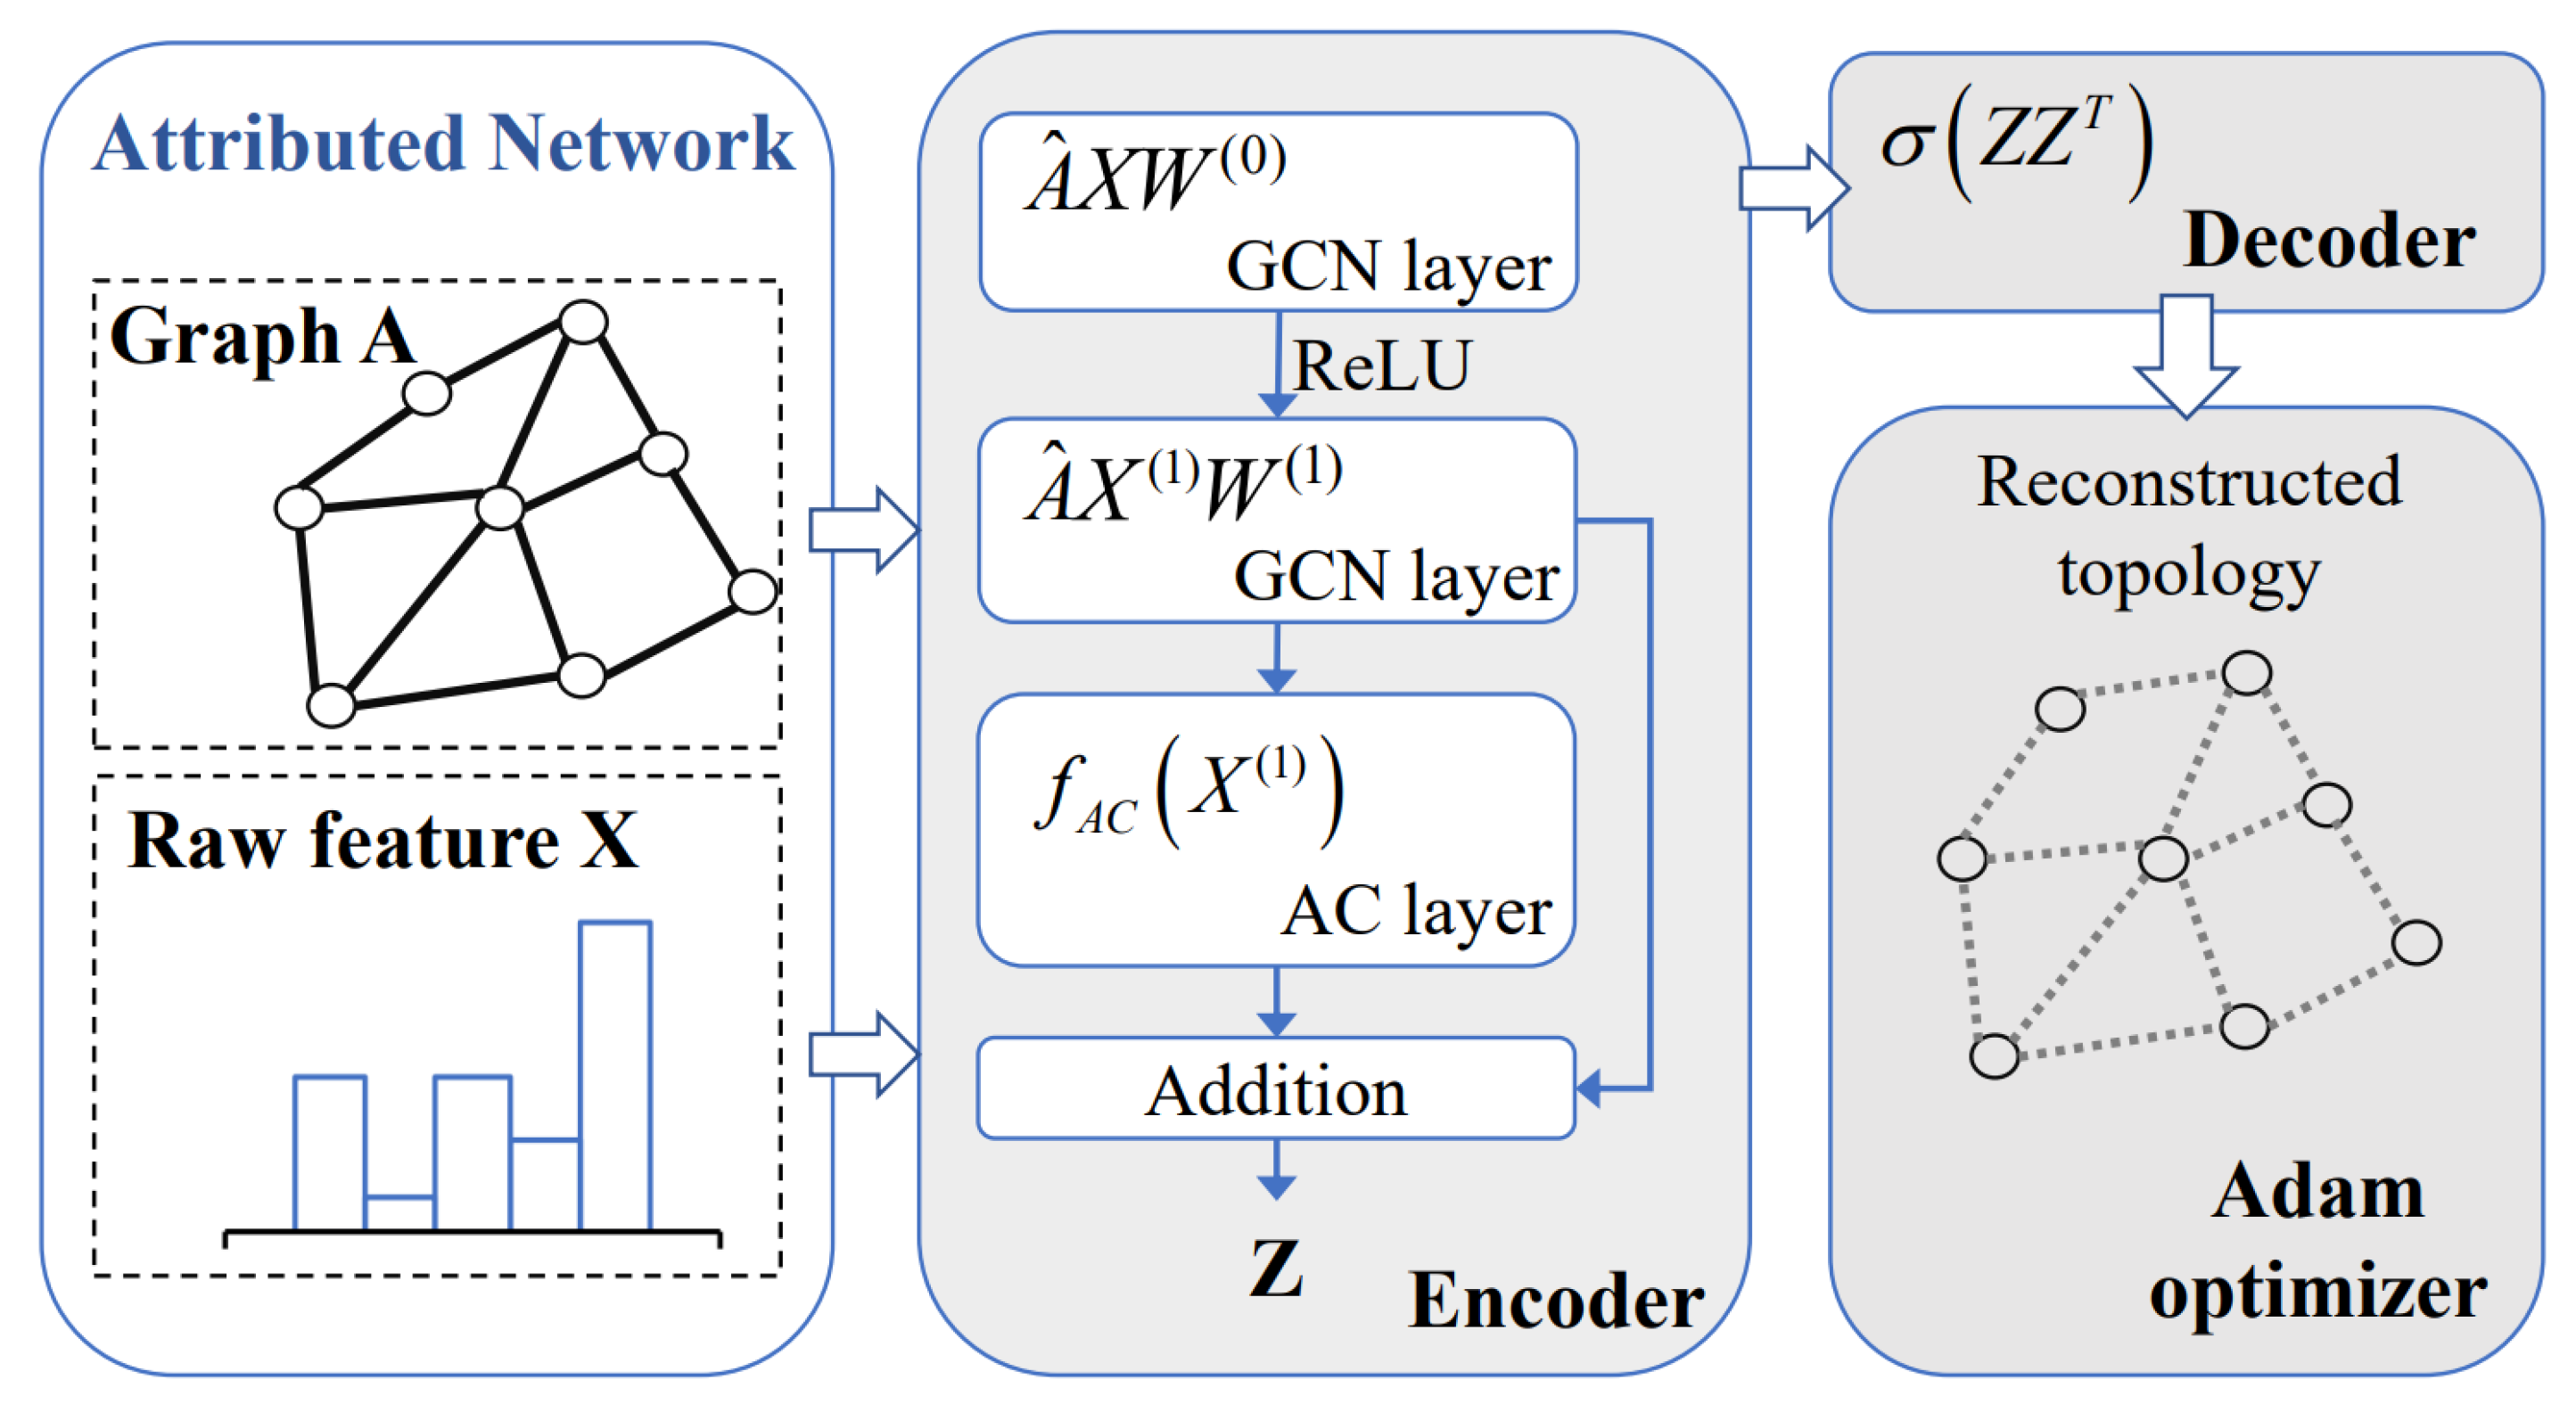
In this section, we mainly introduce the design of GAE-AC for graph embedding. In GAE-AC, we use traditional GCN layers into the first two layers of the encoder to fully integrate the information from neighbors. We also add an attention layer to pass the message of clusters. The overall structure of GAE-AC is shown in
Figure 1.
3.1. Problem Description
In this section, we formulate the attributed graph-embedding problem. We define the nodes in graph as V, expressed as , edges in graph as E, expressed as , where represent the edge between node i and node j; we define features of the node as X, expressed as , among this, indicates the feature of node i. So, the attributed graph can be expressed as . The topology of the graph is represented by an adjacency matrix A, which is defined as , if then ; otherwise, .
The main purpose of attributed graph embedding is to map nodes of the graph to lowdimensional space Z, while preserving the topological information and feature information of the original attributed graph. Then, we apply vectors to the downstream tasks to evaluate expressiveness.
In this paper, the graph downstream tasks involved include node clustering and link prediction. Node clustering aims to divide the nodes in the graph into clusters without intersection , according to the topology information and feature information of nodes. The link prediction task aims to measure the potential of two unconnected nodes in the graph to establish a new edge based on the existing edges.
3.2. Encoder
For the first two layers in the encoder, we use traditional GCN. The vectors generated by the first two layers are represented by
:
where
,
is an identity matrix with the same dimensions as
A, and
is the diagonal matrix of
, which is expressed as
.
GAE uses GCN as the encoder. Because of the hardcode convolution kernel, GCN can fully consider the influence of the node’s neighbors when learning the embeddings of nodes. However, the GCN layer has certain defects. For example, in traditional unsupervised clustering algorithm K-means [
21], in each iteration process, clusters are redivided according to the Euclidean distance from the node to the center of each class; from this aspect, K-means focuses on the influence of the cluster. Instead, the vector generated by GCN only fuses the information of the neighbors but does not consider the message of the cluster.
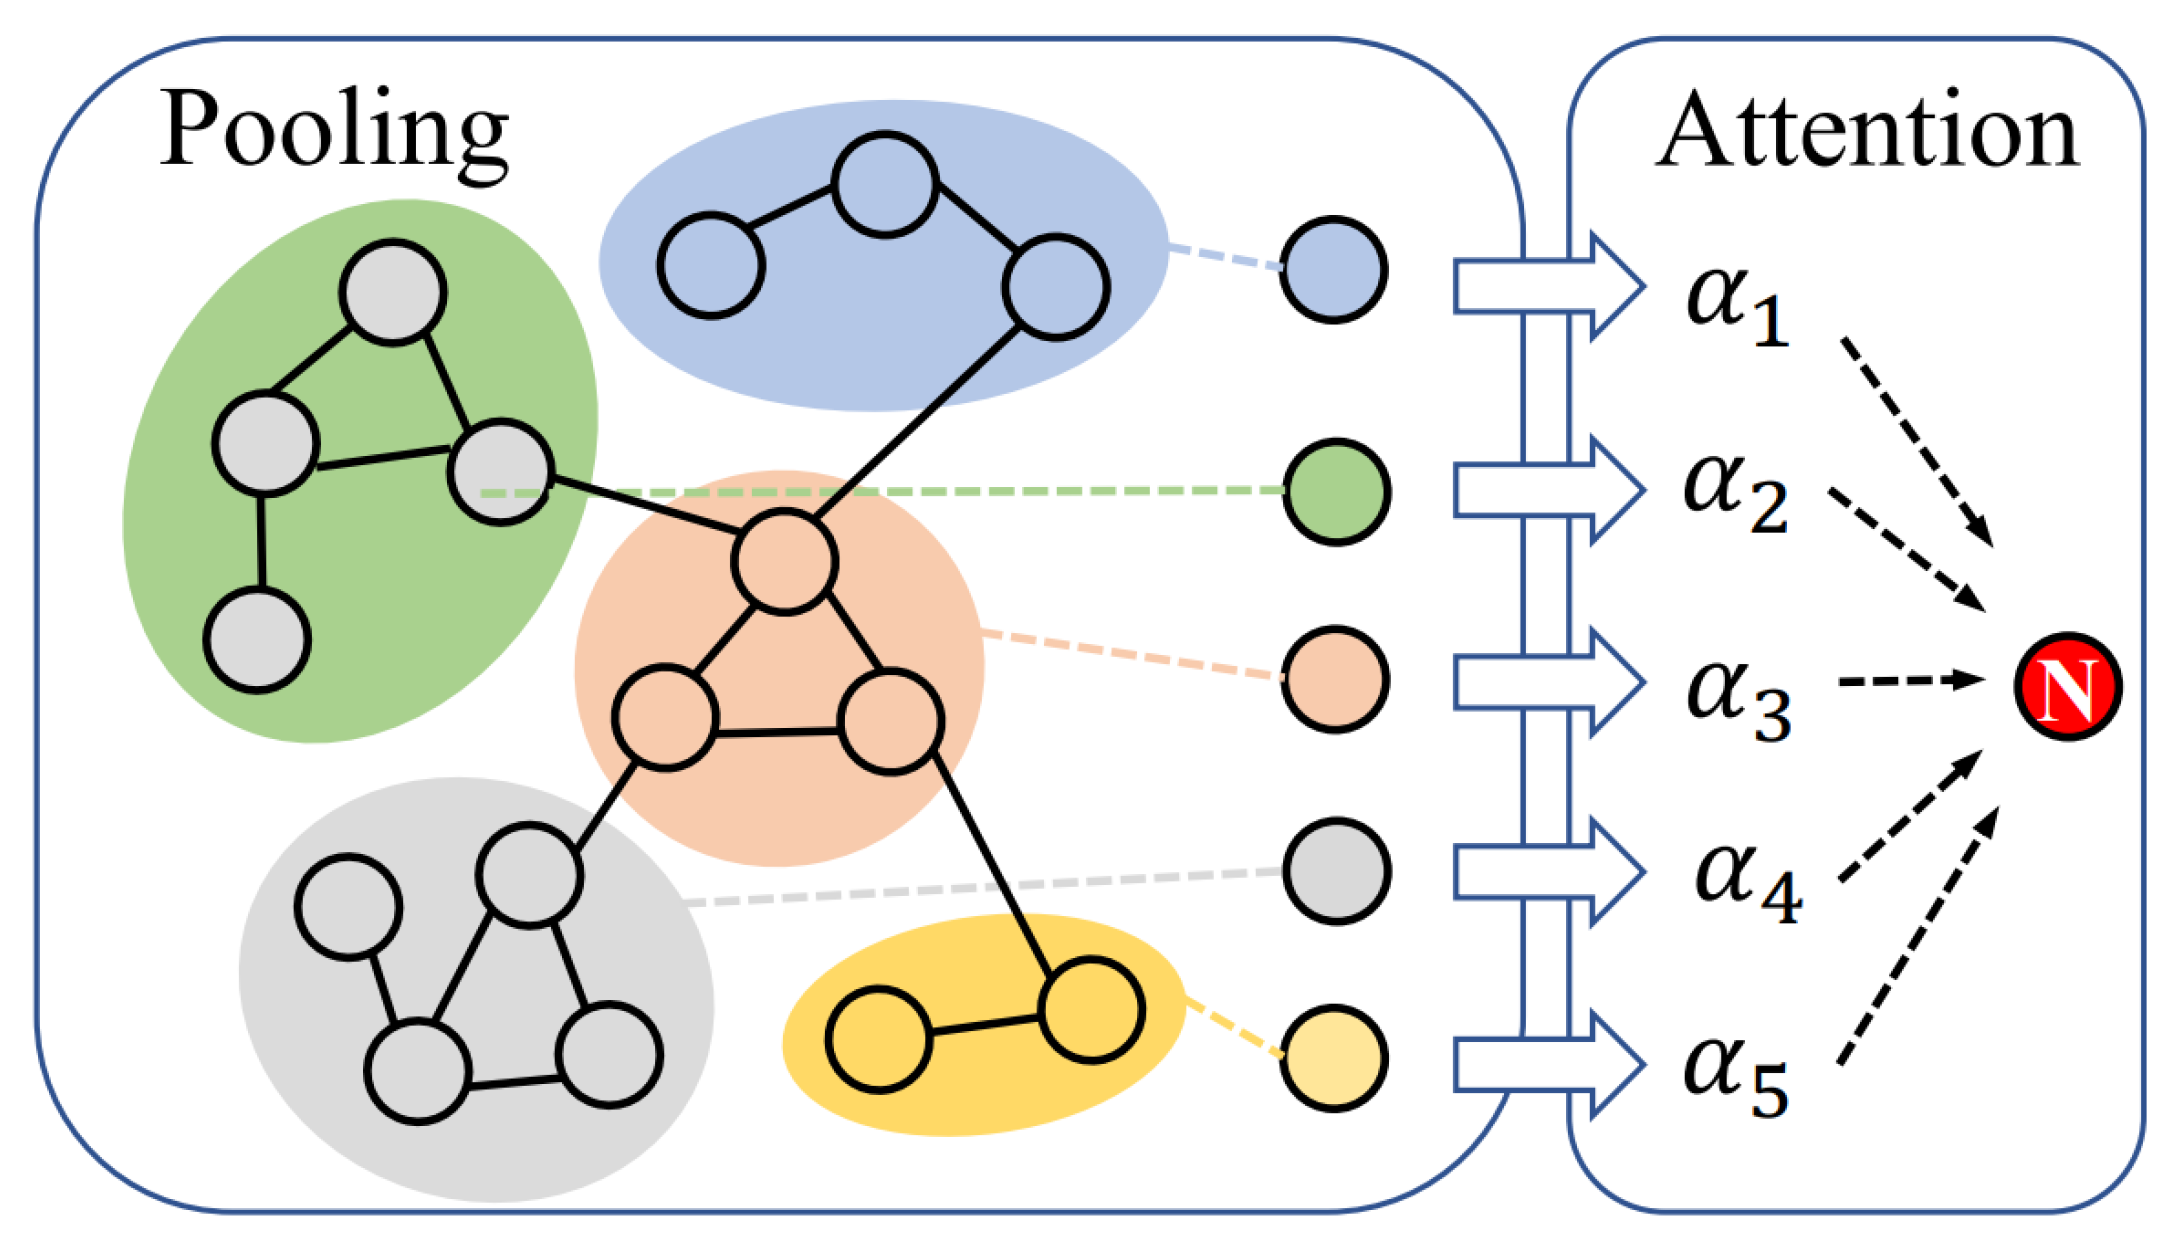
Extending from the idea mentioned above, we design a new layer to integrate the information of clusters. The design of the new layer includes the following three parts. The first part is designed to divide the nodes into different clusters according to
; the second part is designed to take pooling operations on clusters; the third part is designed to fuse the pooled result of clusters to every node with the attention mechanism. The overall structure is shown in
Figure 2.
3.2.1. Cluster Generation
In this part, we mainly learn the cluster distribution of nodes according to vectors
generated after two layers of GCN. We define this process as
g. We predefine the cluster distribution as
, while the number of clusters is
k, which need to be input into the model in advance. The formulated description is as follows:
where
is the number of nodes in the cluster
, and
m is the size of
.
g is used to learn the cluster distribution, and we chose to use the K-means algorithm.
3.2.2. Cluster Pooling
After learning cluster distribution, we carry on the pooling operation on each cluster and finally obtain the representative nodes. The formulated description is as follows:
the pooling operation can use either maximum pooling or average pooling. We used the average pooling operation to obtain the representative nodes of each cluster.
3.2.3. Attention with Cluster
Inspired by the GAT, in the third layer, for each node, we use different coefficients to measure the impact of each cluster on it and learn the influence vector
of clusters on it, which is defined as follows:
where
represents the cluster information vector learned by the node.
In order to retain the pooled vector information as much as possible, we set the weight matrix
W to the identity matrix whose size is 1 × 1.
is the attention coefficient between the pooled vectors of node
i and cluster
j, which is formulated as follows:
our attention mechanism uses a forward neural network same as mentioned in GAT, which is expressed as the parameter
,
F has the same size as
,
is the activation function, we generally use LeakyReLU (
), and the whole part is defined as
.
3.2.4. Fusing Information of Cluster
Finally, we use a residual block to fuse the vectors of the nodes
and the vectors of pooling results of clusters
to obtain the final embedding vectors
Z:
3.3. Decoder
The existing decoder can be mainly divided into two parts: reconstruct graph and reconstruct features. In this paper, to make the model more efficient, we use the simplest inner product decoder to reconstruct the graph, as shown below:
where
represents the reconstructed adjacency matrix.
3.4. Loss Function
The training of our model is mainly to minimize the cross-entropy between the reconstructed adjacency matrix and the original adjacency matrix, as shown below:
3.5. Summay
GAE-AC is summarized in Algorithm 1, which has the following advantages:
The GCN-based encoder can effectively integrate the topology information and feature information of nodes in the graph.
By learning the cluster distribution of nodes, the information of clusters are fused into the process of generating embeddings, which improves the accuracy of embeddings.
The influence of different clusters is fused into embeddings through an attention mechanism, making embeddings more similar in the same class and more distinguishable in different classes.
| Algorithm 1: Summary of GAE-AC. |
Input: Adjacency matrix ; Feature matrix ; Number of iterations ; Embedding size ; Cluster update epoch . Output: Node embedding matrix . 1: Compute the initial cluster distribution C based on X; 2: For i = 0 to − 1 do: 3: Calculate node embedding Z with Equations ( 1), ( 2) and ( 7); 4: If i % T == 0 then: 5: Update cluster distribution C; 6: Update best node embedding Z; 7: End if 8: Calculate the reconstructed matrix with Equation ( 8); 9: Calculate loss L with Equation ( 9); 10: Update the whole model by minimizing loss L; 11: End for |
4. Experiments
In this section, we evaluated the performance of the embeddings generated by GAEAC in different graph downstream tasks through experiments. We introduce the experimental details in this section, including the dataset we used, the baseline methods we compared, the setting of experimental parameters, and the metrics we used in the evaluation.
4.2. Baseline Methods
In downstream tasks, we compared GAE-AC with the following baseline methods. We divide these methods into three categories.
- (1)
Methods using graph structure only (G).
DeepWalk [
7] uses random walks and SkipGram models to learn node embeddings.
Spectral clustering [
23] regards the adjacency matrix of a graph as the similarity matrix and only uses the graph structure information.
- (2)
Methods using features only (F).
K-means [
21] directly generates clusters according to features of nodes.
Spectral clustering [
23] also generates clusters according to features of nodes.
- (3)
Methods using both features and graph (F&G).
TADW [
22] interprets DeepWalk [
7] as an equivalent matrix factorization model, enabling it to support the embedding of features.
GAE and VGAE [
4] incorporate GCN into autoencoder architecture and variational autoencoder architecture to generate node embeddings.
ARGA and ARVGA [
24] improve the GAE and VGAE by adding a discriminator to train adversarial.
AGC [
25] uses high-order graph convolution to fuse node features, and the number of orders can be adjusted according to different datasets.
DAEGC [
13] uses graph attention network to integrate features of neighbors of different orders and finally apply reconstruction loss and clustering loss to jointly optimize the model.
4.3. Evaluation Metrics
We use three widely used metrics ACC (Accuracy), NMI (Normalized Mutual Information) and ARI (Adjusted Rand Index) [
26] to measure the quality of node clustering tasks. The ACC measures the accuracy of node clustering, which is defined as follows:
where
is a mapping function between the labels and assignments. We used a traditional Kuhn–Munkres algorithm to find the best matching between the ground truth label and cluster assignments. The NMI is a normalized measure of similarity between two labels of the same data, which is defined as follows:
where
is the mutual information between the predicted cluster assignment
V and the ground truth label
U, and
H is the entropy. The ARI measures the quality of overlap between the ground truth label and cluster assignments, which is defined as follows:
where
is the Rand Index, which can be calculated as in [
27].
We use two widely used metrics AUC score (the area under a receiver operating characteristic curve) and AP score (average precision) to measure the quality of our model in the link prediction task. The AUC measures the probability of predicting the positive sample rather than the negative sample, which is defined as follows:
where
is the probability of predicting positive samples, and
is the probability of predicting negative samples.
N is the numbers of positive samples X, and
M is the number of negative samples Y. The AP can be calculated as follows:
where
N is the number of positive samples,
k is an index of class k,
is the true positive samples and
is the false positive samples.
4.4. Parameter Settings
In the node clustering task, on all datasets, the dimension of the hidden layer in GAE-AC in the encoder was set at 256, and the dimension of the embedding size was set at 32; we trained GAE-AC for 100 epochs and used Adam optimizer [
28] to optimize the whole model while learning rates were set at 0.005, 0.005, and 0.001 on Cora, Citeseer and Wiki, respectively. We clustered the low-dimensional vectors by K-means algorithm [
29,
30]. For the baseline methods, we used the parameter settings and the best results mentioned in their original papers for comparison.
In the link prediction task, for the partition of the dataset, we adopted the same settings as GAE/VGAE, randomly removing 15% of the edges in the graph, of which 10% is the verification set and 5% is the test set, for all algorithms. For experimental setting, the hidden layer dimension was set at 256, and the embedding size was set at 32. We mainly conducted experiments on Cora and Citeseer; for both datasets, we trained our model for 200 epochs and used Adam optimizer to optimize the whole model while learning rates were set at 0.005 on Cora and 0.004 on Citeseer. For the baseline method, we used the parameter settings and the best results mentioned in their original papers for comparison.
4.5. Results
We mainly measured the performance of GAE-AC in the node clustering and link prediction tasks, which correspond to
Section 4.5.1 and
Section 4.5.2, respectively. In
Section 4.5.3, in order to measure the impact of the setting of the embedding size on the performance of GAE-AC, we used the results of attributed graph clustering under different embedding sizes as a measure. In
Section 4.5.4, we used the t-SNE [
31] to map embeddings generated into the two-dimensional space to observe more intuitively.
4.5.1. Node Clustering
The experimental results of node clustering on three datasets corresponded to
Table 2,
Table 3 and
Table 4, respectively. We find that the method using both topology information and feature information can often achieve higher performance. Because some models do not design specifically for graph clustering tasks, topology information and feature information are not well fused. The optimized methods including AGC and DAEGC have obviously achieved better performance, which also proves the need to improve the original model to adapt to different tasks.
We highlighted the best-performing methods in bold, and the best-performing baseline methods are underlined. The performance of GAE-AC exceeds all baseline methods on the three datasets. For ACC, GAE-AC is 1.84% higher than the best baseline method in Cora, 1.93% in Citeseer, and 11.4% in Wiki; for NMI, GAE-AC is 0.745% higher than the best baseline method in Cora, 7.06% in Citeseer, and 5.13% in Wiki; for NRI, GAE-AC is 5.24% higher than the best baseline method in Cora, 8.11% in Citeseer, and 6.71% in Wiki.
4.5.2. Link Prediction
The experimental results are shown in
Table 5. We used bold to mark the best results and underline to mark the best baseline methods.
The experimental results show that GAE-AC also performed well in link prediction tasks and achieved better performance. For the AUC, GAE-AC is 0.866% higher than the best baseline method in Cora and 0.858% higher in Citeseer. For the AP, GAE-AC is 1.30% higher than the best baseline method in Cora and 1.72% higher in Citeseer.
4.5.3. Influence of Embedding Size
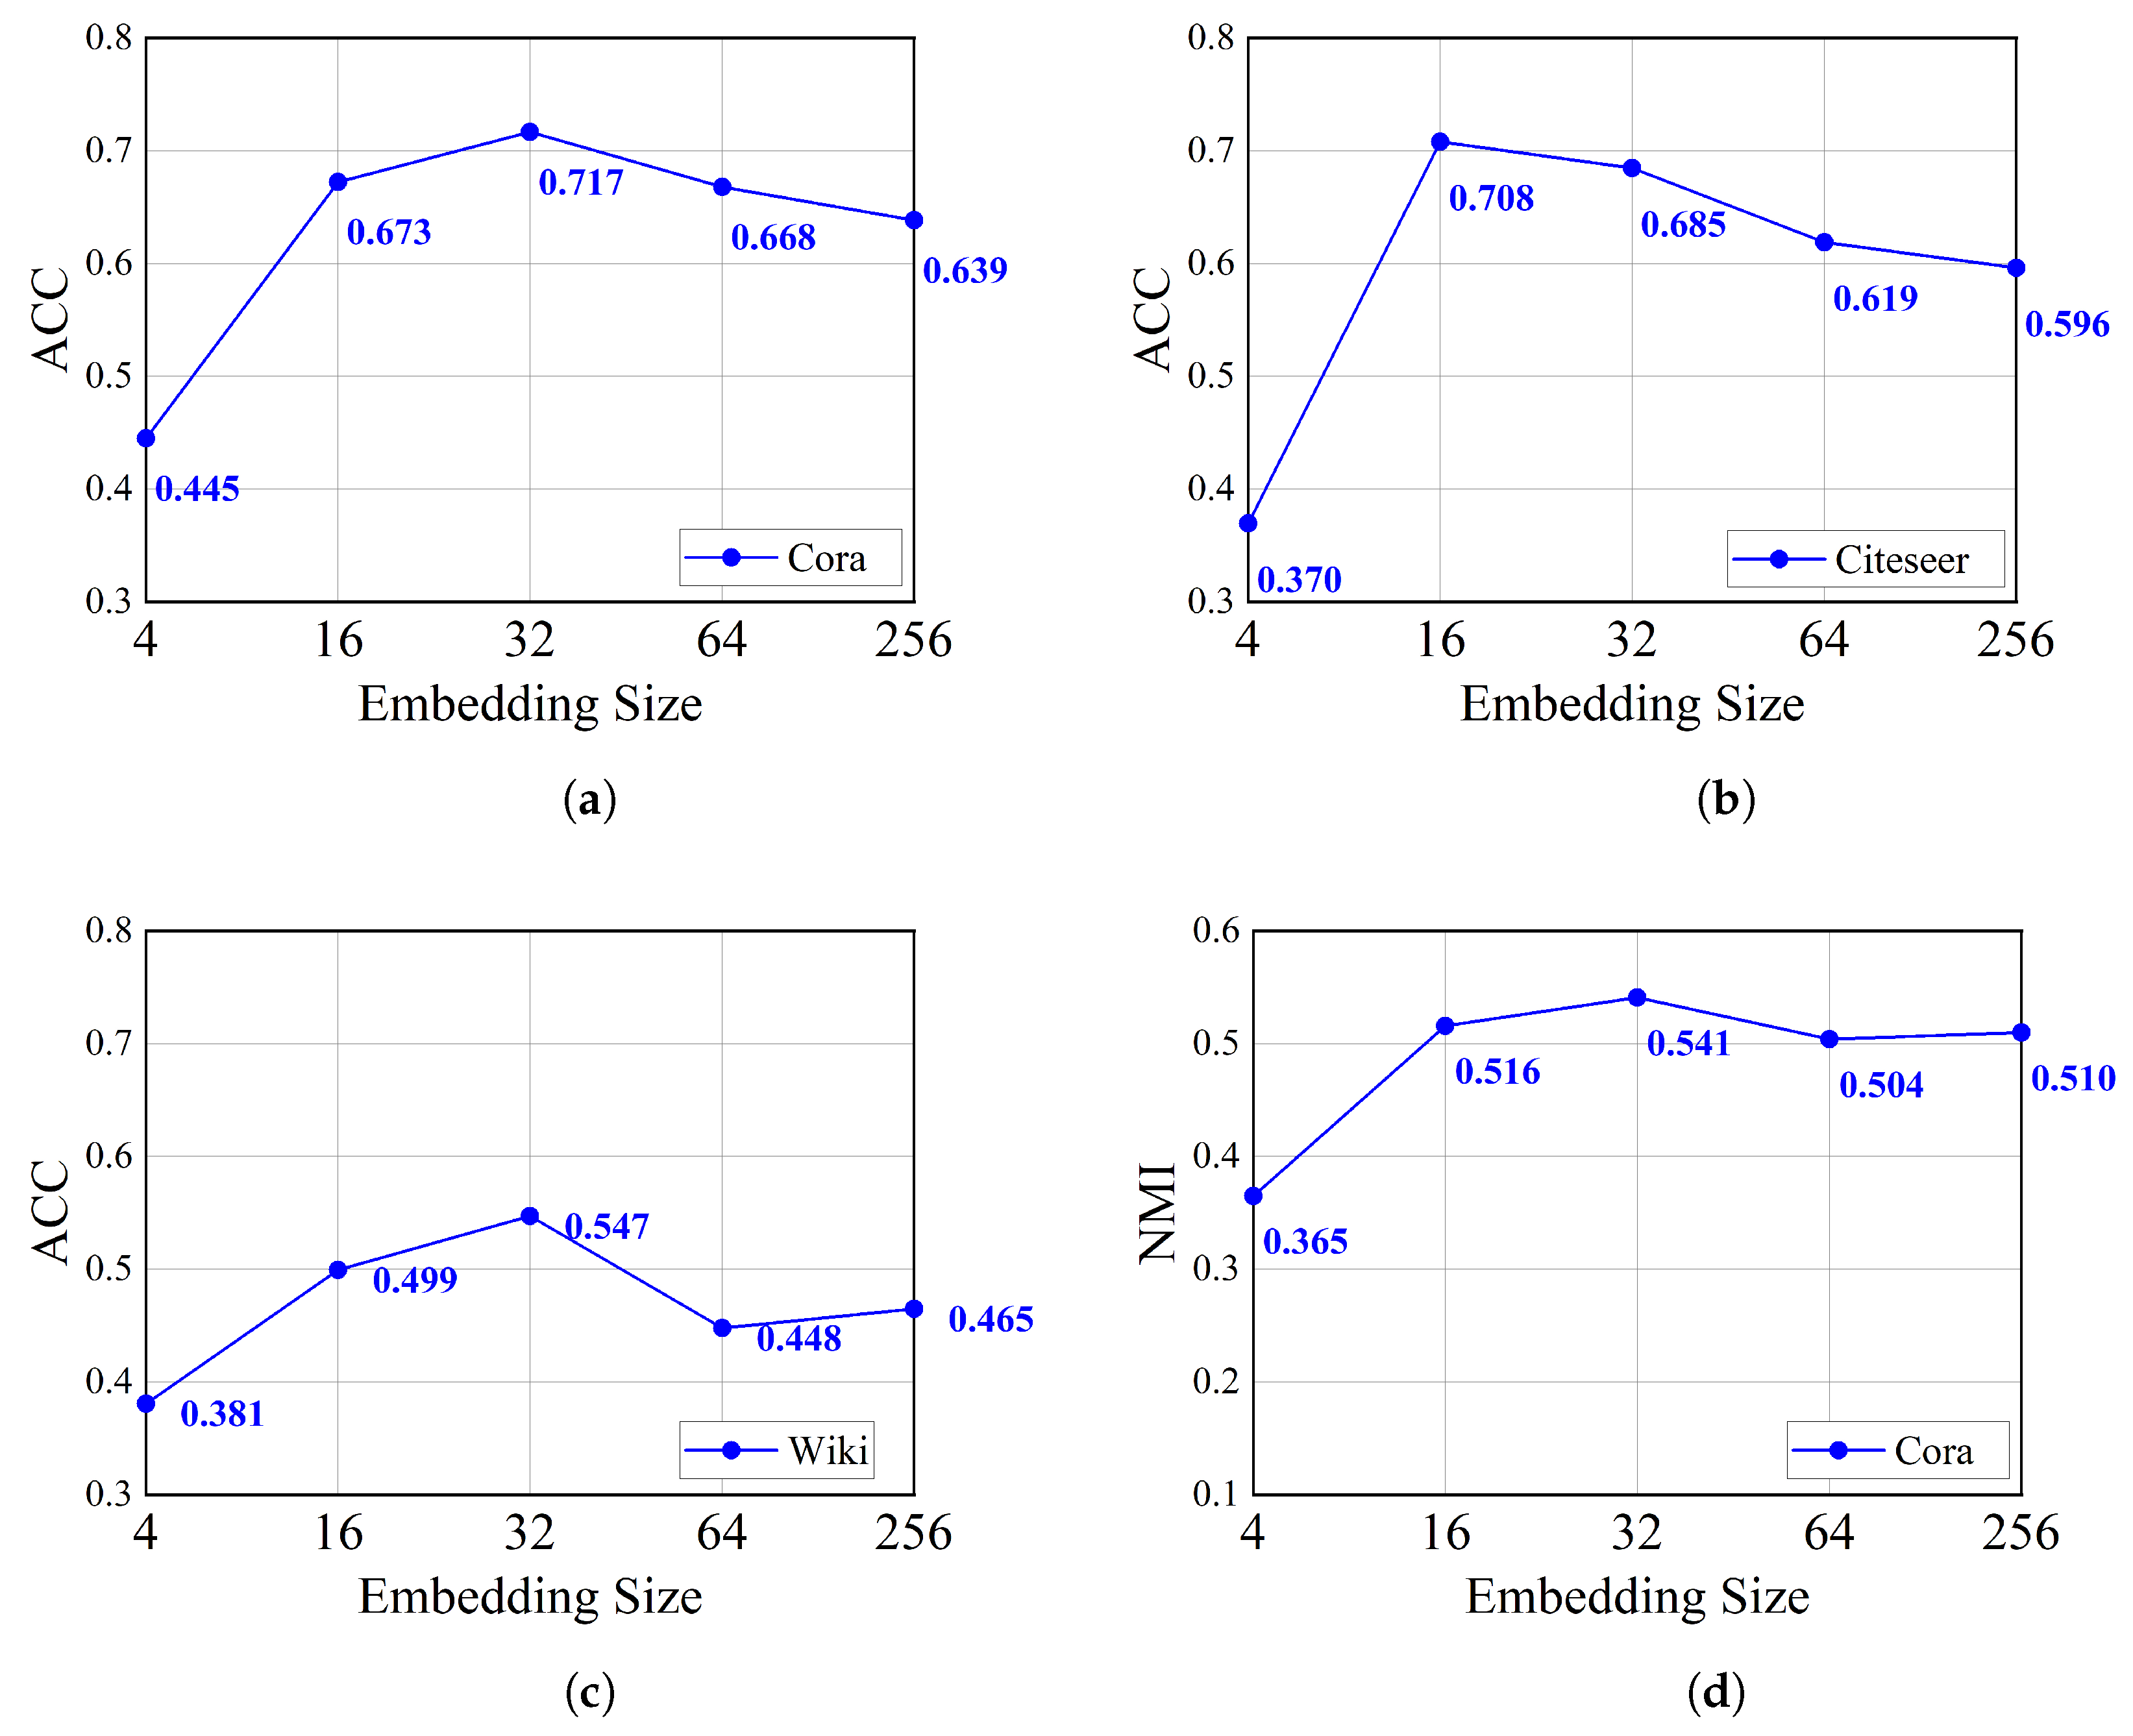
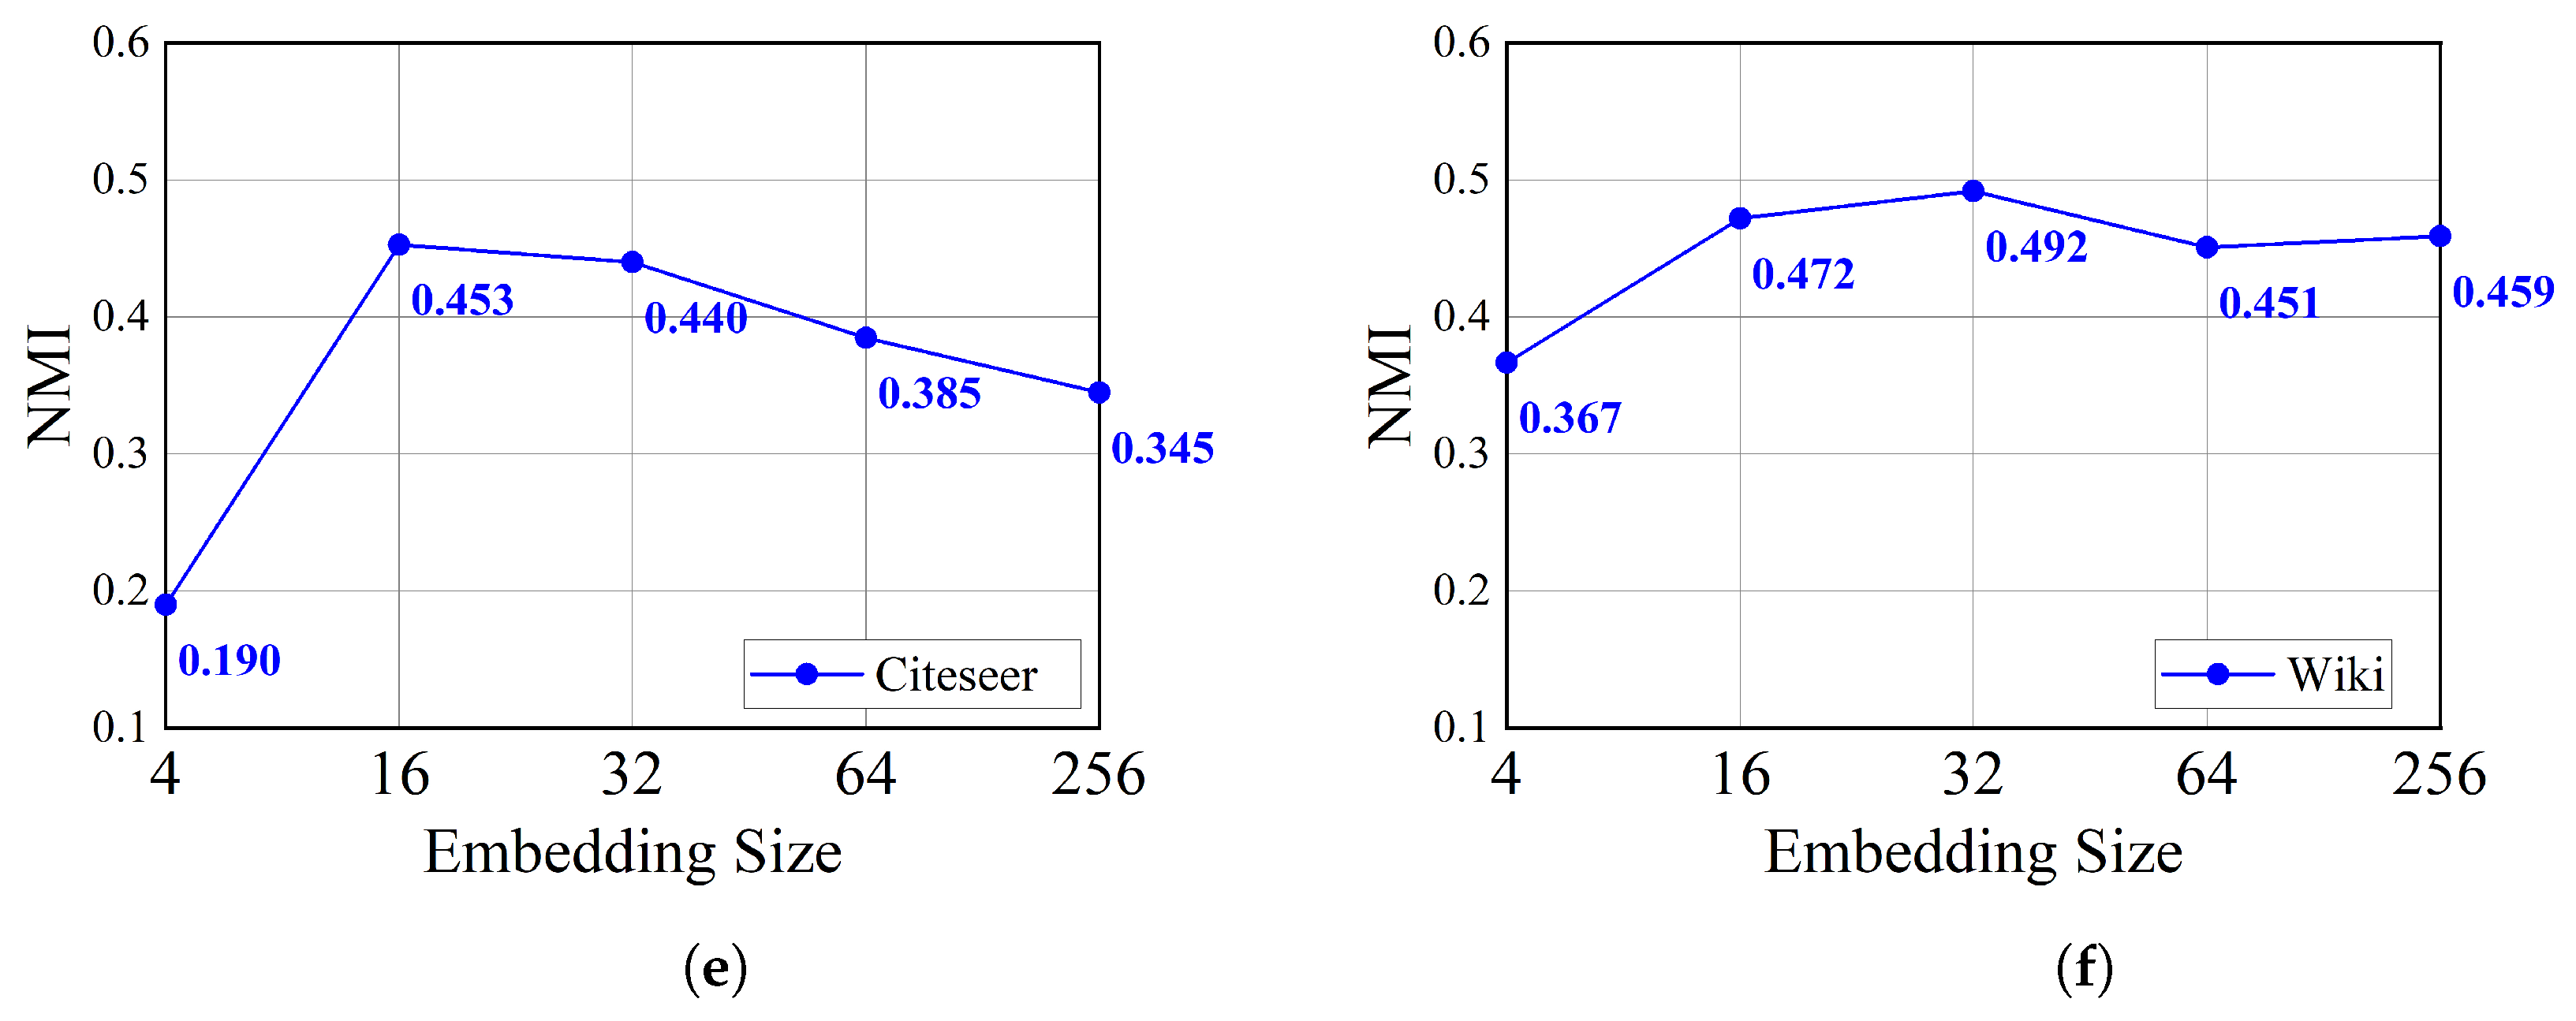
We discuss the effect of the dimension of the embedding size through the node clustering task in this section. We conducted experiments on attributed graph clustering with dimensions of 4, 16, 32, 64, and 256, respectively, and measured the impact of embedding size on the clustering task using ACC and NMI. The experimental results are shown in
Figure 3.
Through the results, we find that GAE-AC achieved best performance when the embedding dimension was 32. However, the embedding size of 16 performed better on the ACC indicator than the embedding dimension of 32 on Citeseer, which can reach 0.708. It is 3.36% higher than the case where the embedding size is 32.
4.5.4. Visualization
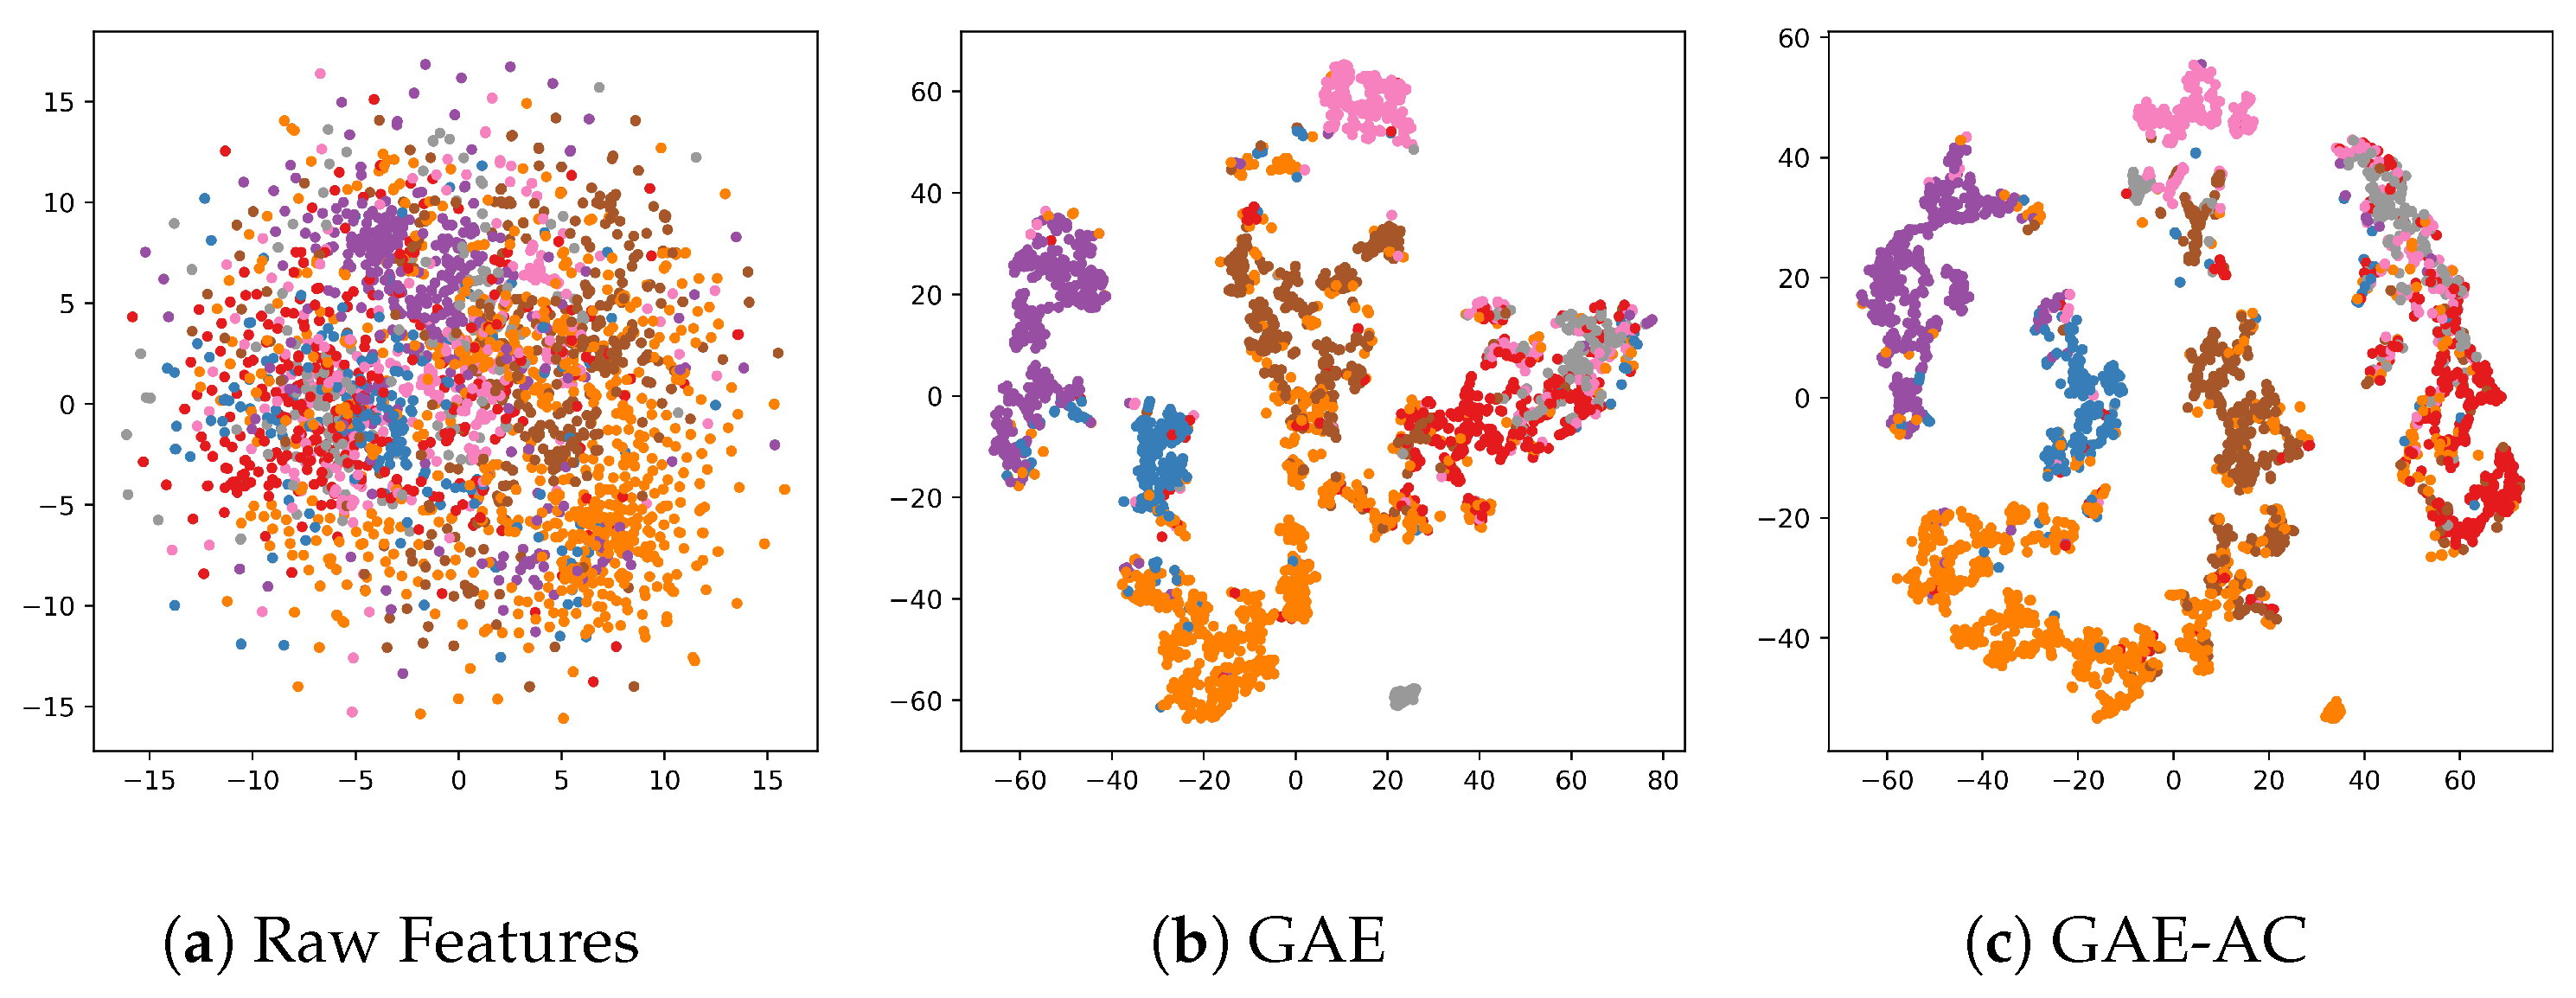
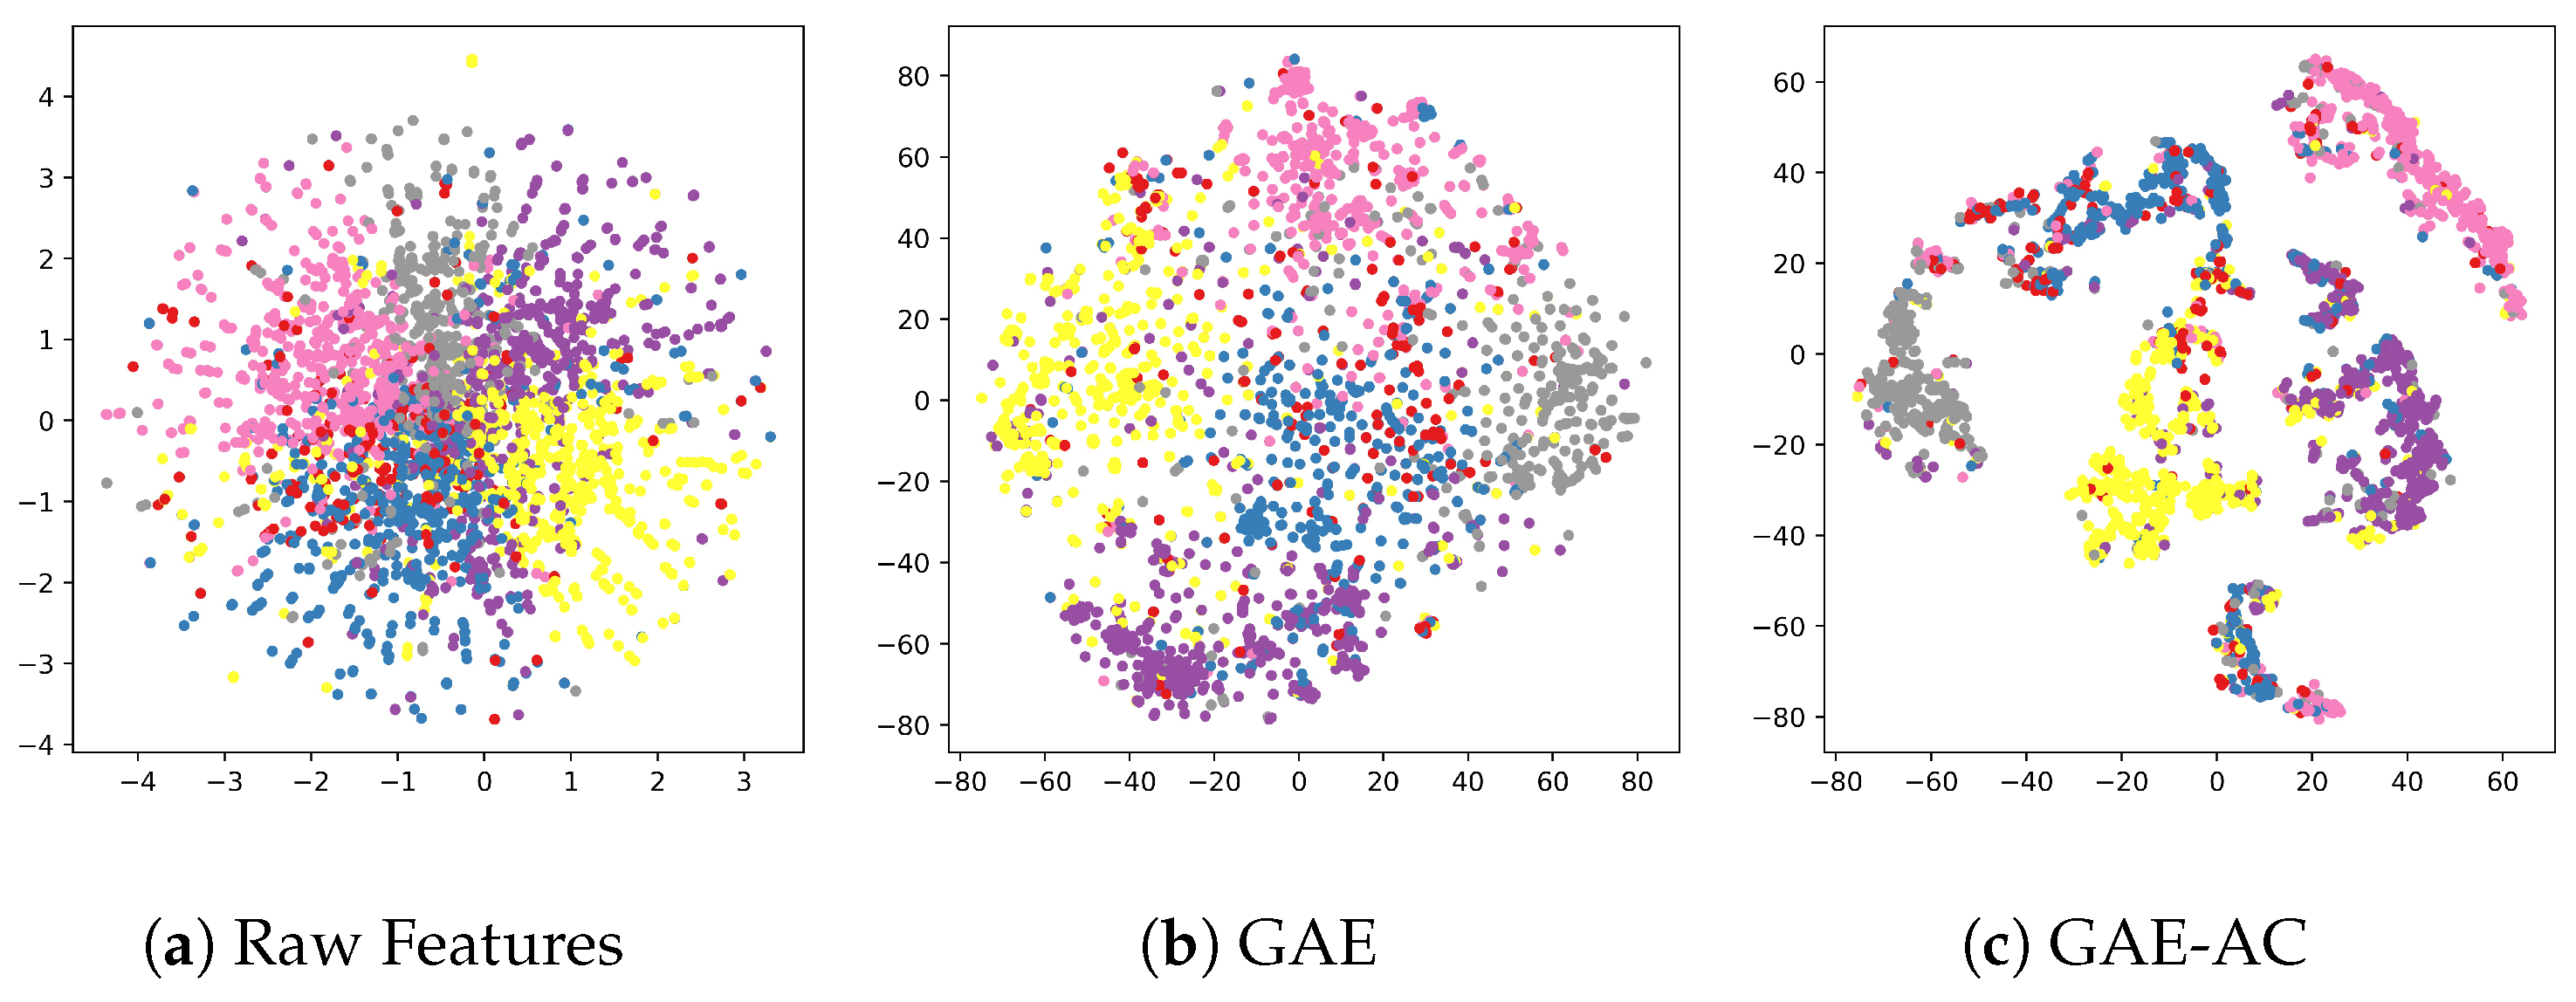
In order to intuitively validate the expressiveness of learned embeddings, we mapped each embedding of a node to two-dimensional space on the Cora dataset and the Citeseer dataset using t-SNE [
31]. To demonstrate the effectiveness of our attention-with-cluster layer, we mainly compared visualization with GAE.
The results on Cora and Citeseer are shown in
Figure 4 and
Figure 5, respectively. We find out that GAE-AC distinguished better than GAE for red, orange, and brown classes on Cora and GAE-AC learned more discriminative and denser embeddings compared to GAE on Citesseer, which shows the effectiveness of our attention-with-cluster layer.
5. Discussion
In this paper, we proposed the hypothesis that clusters will spontaneously formed in the process of learning embeddings, and these clusters will affect subsequent learning process. Based on this assumption, we designed and implemented a new spatial convolution layer to learn the impact of clusters, and apply it to GAE-AC. We carried on link prediction and node clustering experiments to verify the performance of GAE-AC on different datasets. In this section, we fully discuss the results of the experiment in detail for proving the correctness and rationality of our assumption and model. We discuss from the following three aspects.
GAE-AC outperforms the methods only using either topology information or node features by a very large margin. In the baseline method, K-means, Spectral-F, Spectral-G, and DeepWalk only use one type of information (topology or feature). Our model improves significantly in the link prediction task and node clustering task compared with these methods, which shows the necessity of fusing topology information and feature information.
GAE-AC has more excellent ability in aggregating topology information and feature information. In the process of fusing topology information and feature information, most baseline methods use a typical approach that fuses t-order neighbor information. GAE, VGA, ARGA and ARVGA consider the one-order neighbors, whereas DAEGC uses GAT and considers the information of two-order neighbors in their experiment. AGC uses k-order graph evolution with an automatically selected k to aggregate information within k-hop neighbor. Different from the integrating-t-order type methods, GAE-AC first fuses the information of one-order neighbors through two-layer GCN and then fuses the information of higher-order information through the attention-with-cluster layer. This mechanism enables GAE-AC to integrate both the local information of neighbors and global information of different clusters, thus improving the expressiveness of the embedding generated, making GAE-AC outperform the baseline methods in link prediction and node clustering tasks.
GAE-AC has a novel spatial convolution layer that can significantly improve the expressiveness of embeddings. Compared with GAE, the only difference of GAE-AC is the attention-with-cluster layer. In the link prediction experiment, compared with GAE, on the Cora dataset, GAE-AC improved the AUC and AP indicators by 2.42% and 2.17%, respectively. On the Citeseer dataset, the AUC and AP indicators of GAE-AC have increased by 4.58% and 5.23%, respectively. In node clustering tasks, compared with GAE, ACC is 17.3% higher in Cora, 50.2% higher in Citeseer, and 44.3% higher in Wiki, which shows that our attention-with-cluster layer can significantly improve the performance in the link prediction task and node clustering task. Finally, in visualization, we can intuitively find out that the distinction between classes is more obvious than GAE after using t-SNE. From the above perspectives, we can find out that the introduction of our attention-with-cluster layer improves the performance of the model obviously, which also proves the rationality of our assumption.
Finally, we discuss the shortcomings of GAE-AC. In the node clustering task, DAEGC can directly learn the class of nodes end-to-end by introducing the self-supervised clustering module, without extra steps. However, in GAE-AC, after learning the embedding, additional clustering algorithms are needed. Additionally, DAEGC can dynamically adjust the dimensions of embeddings according to the number of classes of the dataset, while the embedding dimensions of GAE-AC can only be fixed at 32 if we want GAE-AC perform better, indicating that GAE-AC is less flexible than DAEGC.
In practice, we can apply GAE-AC to link prediction-related tasks due to their excellent performance. For example, we can use GAE-AC to improve the accuracy in the recommendation system. At the same time, we can also apply GAE-AC to tasks related to node clustering. For example, node clustering on citation networks can reveal the importance of each research field, find the relationship between publications in the research field, analyze the relationship and difference between each research field, and discover the future direction of research; node clustering in social networks can directly find out the social circle formed by users.
6. Conclusions
In this paper, we propose GAE-AC based on the graph autoencoder and apply it to graph representation learning. We first make the hypothesis that clusters have an impact on the embedding of each node; then, we design a novel spatial convolution layer that fuses the information of a cluster through the attention mechanism. Then, we add it based on two-layers GCN to learn the embedding of nodes. Experimental results on the dataset show that our method is more expressive and performs well in two downstream graph tasks including attributed graph clustering and link prediction.
In future work, due to the independence of our attention-with-cluster layer, we plan to apply it to other models directly, such as GAT, and we will perform other types of experiments to verify the effectiveness of our model such as semi-supervised classification.
