Abstract
Project-oriented manufacturing companies aim to produce high-quality products according to customer requirements and a minimum rate of complaints. In order to achieve this, performance indicators, especially those related to product quality, must be measured and monitored by managers. This research proposes a fuzzy multi-criteria model for the selection of key performance indicators that are critical to product quality. The uncertainties in the relative importance of decision-makers, performance indicators, and their values are described by sets of natural language words that are modeled by the interval-valued intuitionistic fuzzy numbers. The assessment of the relative importance of the decision-makers and the determination of their weights are based on the inclusion comparison probability between the closeness intuitionistic fuzzy sets. The determination of the weights vector of performance indicators is based on the integration of an interval-value fuzzy weighted geometric operator and the inclusion comparison probability between the closeness intuitionistic fuzzy sets. TOPSIS expanded with interval-valued intuitionistic fuzzy numbers for ranking performance indicators is proposed. The developed model was tested on the real data collected from three manufacturing companies in the Republic of Serbia. Based on the obtained results, the top-ranked performance indicators were marked as critical for product quality and selected as quality key performance indicators.
Keywords:
product quality; key performance indicators; TOPSIS; interval-valued intuitionistic fuzzy numbers MSC:
90B50; 90C70
1. Introduction
It can be noticed that technology is the key to a successful business in companies operating in the process industry. To be competitive, companies use advanced technology that will allow them to increase productivity, reduce costs, and increase product quality [1]. These days, advanced technology is mainly defined in Industry 4.0. Specifically, there are several promising technologies related to digitalization (Augmented Reality, Big Data, and Analytics, the Industrial Internet of Things, Digital Twin, Cloud Computing, Cobots, etc.) [2,3]. Product quality and quality systems improvement might be seen as support systems for the efficient deployment of advanced technology. Those improvements can be achieved through mathematical modeling whose solutions represent a foundation for the development of methods that can be used for automated quality control and artificial intelligence-based quality control [4]. For instance, the application of a robust fuzzy system can lead to an improvement in the performance of the path-following control autonomous vehicles problem [5]. For customers of manufacturing companies, the term quality refers to the quality of the final product that should follow their requirements. Previously, the management of companies did not consider the amount of money lost on non-compliant parts and product complaints. Today, management is increasingly aware of the importance of quality and solving problems related to product quality. Companies in the process industries with no quality management systems established in their process are rare.
However, solely establishing a quality management system is not enough to achieve a quality product. Companies need to manage the performance, such as cost, time, quality, productivity, flexibility, safety, etc. [6,7], of the various business processes involved in creating the final product. Therefore, management is to measure, monitor, and analyze quality performance using key performance indicators (KPIs) [8,9]. KPIs are measurable values that show the achievement level of business process performance [10]. The usage of the KPI quality control should ensure the best possible quality of the product. Obtaining information about the values of KPIs in real-time allows management to understand how quality influences the production process and which activities they can undertake to increase the quality.
A number of KPIs are associated with quality that management can employ, depending on the specific needs to improve product quality [11,12,13]. The publications offer too many KPIs, while in practice, quality management usually focuses on monitoring and measuring several critical performance indicators (PIs). Everything stated above supports the motivation for this research: how to select KPIs that are critical to a product’s quality.
Relevant sources [14,15,16] suggest that there is no optimal model for the selection of appropriate KPIs for a specific company. Many techniques and methods for selecting and ranking KPIs are available in the literature and applied in manufacturing companies.
The framework based on Analytical Hierarchy Process (AHP) and according to the SMART criteria (Simple, Measurable, Attainable, Realistic, and Time-related) was developed to select and rank KPIs that are more relevant for the realization of organizational goals [14]. The authors suggested the most relevant KPIs within each of the four BSC perspectives. Kaganski et al. [15] selected the three most relevant KPIs (actual production time, product quality/quality ratio, and on-time delivery) by using the fuzzy AHP and SMARTER criteria (Specific, Measurable, Achievable, Relevant, Time-bound, Evaluated on a regular basis, and Recognized). The integrated fuzzy AHP technique and benchmarking model were used to identify KPIs for internal supply chain management in manufacturing industries [17]. Also, based on the AHP methodology, the model for assessing KPIs was developed, and 32 KPIs were grouped into six activity areas (production, quality, financial, customer contentment, employee satisfaction, and environmental protection) for the flexible packaging industry [16]. Amaladhasan et al. [18] developed an evaluation model to prioritize the green supply chain KPIs by using the eco-balanced scorecard framework. They employed two methods, fuzzy VIseKriterijumska Optimizacija I Kompromisno Resenje (VIKOR) and gray relational analysis. Torbacki and Kijewska [19] identified KPIs for the logistics and manufacturing process by respecting concepts of Logistics 4.0, Industry 4.0, and sustainable development and applying the Decision-Making Trial and Evaluation Laboratory (DEMATEL) methodology. The model for assessing and prioritizing 27 sub-KPIs segregated into six categories (management, quality, operations, economics, environmental, and social) was developed using the best-worst method [20]. Brint et al. [21] reduced 28 KPIs to eight by using Principal Component Analysis for selecting KPIs and the TOPSIS method for validating the selection process. Some authors developed the Analytic Network Process (ANP) based methodology to guide managers in selecting and ranking relevant KPIs [22,23]. According to the authors, the application of the ANP model in the process of KPIs selection and ranking should help managers to identify areas for improvement and ensure more transparent manager decisions.
The selected KPIs that are employed in this research are suitable to be acquired by the concept of the Internet of Things. This means that the existing manufacturing company needs to implement equipment that supports the appropriate Internet and communication standards to support the acquisition, transfer analysis, and decision-making within the Internet of Things [24,25].
For KPI selection, all PIs need to be assessed in terms of their relative importance and values. Assessments of the relative importance and value of PIs are difficult to perform by using measurement scales with precise numbers for two reasons. First, decision-makers (DMs) can express their assessments using natural language words better than using numerical values. Other reasons are the rapid and continuous changes in the environment, so in many companies, it is difficult to describe the values of PIs with precise numbers. In the literature, many papers describe the procedures of transforming the linguistic variables into intuitionistic fuzzy sets, which is a sufficiently good manner to quantitatively describe the uncertain variables [26,27].
In this research, TOPSIS (Technique for Order Performance by Similarity to Ideal Solution) [28] expanded with IVIFNs (interval-valued intuitionistic fuzzy numbers) (IV-TOPSIS) for ranking PIs is proposed. The literature analysis reveals that many papers where TOPSIS has been modified with IVIFNs [29,30,31,32,33,34]. Determination of DMs importance can be given by using different approaches. There, the interval-valued intuitionistic Fuzzy Positive Ideal Solution (IV-FPIS) and the interval-valued intuitionistic Fuzzy Negative Ideal Solution (IV-FNIS) are defined by the analogy to the procedure proposed by Eraslan [35]. Different distance measures can be employed to determine the distance between IV-FPIS and IV-FNIS. The normalized Euclidean distance is mostly used. The rank of considered alternatives concerning all criteria and their weights is usually based on distance measures and the procedure proposed in conventional TOPSIS [29,31,32,33,34], as in this research.
In the literature, there are no papers in which the selection of KPIs from the set of considered PIs is based on the application of multi-attribute decision-making with IVIFNs. This paper solves the named research gap.
The main objective of this research may be interpreted as the selection of KPIs among a finite set of PIs through the DMs’ assessment and the determined rank of PIs by using the proposed IV-TOPSIS. To deliver the main objective, a set of activities needs to be met: (a) modeling existing uncertainties by the IVIFNs; (b) assessment of the relative importance of the DMs in a direct way, and the determination of the weights vector of DMs based on the inclusion comparison probability between the closeness intuitionistic fuzzy sets [36,37]; (c) determination of weights vector of PIs based on the integration of an interval-value fuzzy weighted geometric operator (IVIFWG) [38] and the inclusion comparison probability between the closeness intuitionistic fuzzy sets [36,37]. By achieving the main objective of the research, project-oriented manufacturing companies can measure appropriate KPIs and enhance their value, so consequently, the cost of poor quality should be reduced.
2. Materials and Methods
2.1. Comparative Analysis of IV-TOPSIS
One of the classical multi-attribute decision-making methods, which has a wide application in solving ranking problems is TOPSIS, which was developed by Hwang and Yoon [28]. According to Nijkamp, Rietveld, and Voogd [39], TOPSIS belongs to ragging methods. It embraces different criteria with different units considered [40]. Many authors have extended the TOPSIS method with IVIFNs as presented in Table 1.

Table 1.
Comparative analysis of IV-TOPSIS models from literature sources and the proposed model.
The differences between the proposed models and the model developed in this research are analyzed in detail in the following table. Differences that, in the author’s opinion, can be regarded as contributions to this research are marked.
2.1.1. Determination of Weights Criteria
Analysis of the papers, presented in Table 1, clearly shows that many proposed procedures were used to determine the weights of the criteria. All proposed procedures for determining criteria weights are based on the assumption that it is adequate to use a direct method of assessment. Chen [41] believes that all considered criteria have equal weight so that it does not affect the final ranking of considered alternatives.
Determination of the weights vector is stated as a single decision-making problem [29,30,42]. Kumar and Garg [42] and Onat et al. [29] considered that the weights of criteria are described as precise numbers. Wang and Chen [30] introduced the assumption that weights of criteria are described by pre-defined linguistic expressions, which are modeled by IVIFNs.
The assumption that the problem of determining criteria weights should be stated as a fuzzy group decision-making problem, was introduced in all other analyzed papers [31,32,33,34,45], as well as in our research. Some authors have assumed that DMs have equal importance [34,45]. Within this assumption, the aggregation of DM assessment into a single assessment was performed using advantage scores and disadvantage scores [45]. Abdullah et al. [34] used the mean value method for aggregating assessments of DMs.
In other papers [31,32,33], authors believe DMs have different importance. Boran et al. [46] have developed a procedure for determining the weights of DMs that were applied in those papers. In this way, the weights of DMs are described by precise numbers. In this research, weights of DMs are given by using the inclusion comparison probability between the closeness intuitionistic fuzzy sets [36]. Also, the weights of DMs are described by precise numbers. The method of determining the weights vector of DMs represents the main difference between our research and the rest analyzed papers.
The aggregated criteria are given by using the different aggregation operators:
- An interval-valued intuitionistic fuzzy weighted averaging operator (IVIFWA) [31,32,33]; in this way, criteria weights are described by IVIFNs.
- Combining an intuitionistic fuzzy weighted fuzzy geometric operator (IVIFWG) and the inclusion comparison probability between the closeness of intuitionistic fuzzy sets [36]; in this way, the criteria weights are crisp, and the complexity of calculations is reduced when forming the weighted fuzzy decision matrix.
2.1.2. IV-TOPSIS
Differences between various TOPSIS with IVIFNs and the IV-TOPSIS were analyzed in further detail. The largest number of authors use:
- Five linguistic expressions to describe the relative importance of considered items [32,33,41],
- Seven linguistic expressions [29] as in this research,
- Ten linguistic expressions [31],
- Some authors did not specify pre-defined linguistic expressions [30].
It should be emphasized that there is no recommendation on how to determine the number of pre-defined linguistic terms used to describe existing uncertainties. Many researchers believe that the number of linguistic expressions depends on the size and complexity of the ranking problem.
Based on the analysis of the papers in Table 1, it can be concluded that used IVIFNs are defined at different intervals. In other words, the determination of the interval of IVIFNs is significantly burdened by the subjective views of DMs.
Many authors considered that the value of the alternatives should be set as a fuzzy group decision-making problem [29,31,32,33,41,42,45]. Aggregation of different opinions of DMs into the unique mark is performed by using various aggregation operators:
- An interval-valued intuitionistic fuzzy weighted averaging operator (IVIFWA) [29,31,32,33,45],
- An n interval-valued intuitionistic fuzzy ordered weighted averaging operator (IIOWA) [41],
- The proposed procedure [42].
Some authors have assumed that the assessment of the criteria for each alternative could be stated as a single problem [30,34] as in this research. Respecting the treated problem, the authors of this research believed that the assessment of the value of PIs should be made by consensus.
In almost all the analyzed papers, the authors assumed the criteria are of the same type or that DMs must take care of the type of criteria during the assessment. In practice, it is almost impossible for the criteria, according to which the alternatives are evaluated, to be of the same type. On the other hand, it is difficult to collect accurate data if it is assumed that DMs should take care of the type of criteria. Respecting these facts, the authors of the paper believe that it is necessary to transform the fuzzy decision matrix into the normalized fuzzy decision matrix, similar to [42].
IV-FPIS and IV-FNIS are determined by using operators and , respectively, as suggested by Eraslan [35].
The closeness coefficient is calculated according to the proposed procedure in conventional TOPSIS [28] by using the normalized Euclidean distance [43] in papers by [29,31]. In our research, the normalized Euclidean distance [47] is used, as well as in papers by [32,33].
In some papers, the determination of the value of the closeness coefficient is based on a combination of conventional TOPSIS [28] and:
- The inclusion comparison probability between the closeness intuitionistic fuzzy sets [36] in [41],
- The aggregated connection numbers [42],
- A degree of similarity [44] and linear programming model [30,45].
The various proposed IV-TOPSIS are applied to solve ranking problems in different management domains, (see Table 1).
2.2. The Proposed Model
The TOPSIS with the interval value intuitionistic fuzzy sets (IV-TOPSIS) for ranking quality PIs is presented in Figure 1.
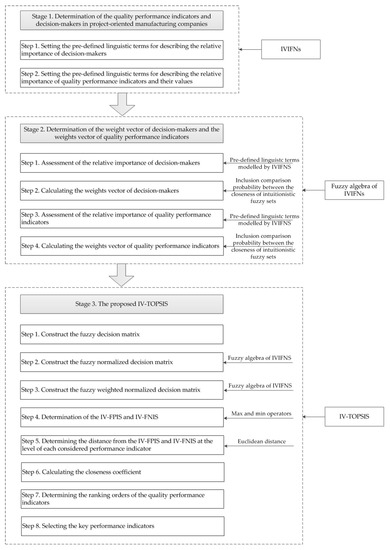
Figure 1.
The proposed model.
Further clarification is needed for mathematical operations on intuitionistic fuzzy sets. The calculations provided in this research are based on the fuzzy algebra rules on IVIFNs, which are presented in the Appendix A.
2.2.1. Definition of a Finite Set of Quality Performance Indicators
According to the best industrial practice insights, monitoring and measurement of PIs can lead to improved product quality. Many papers, in which quality PIs in manufacturing companies are defined, selected, and/or ranked, can be found in the literature [38]. In this research, the list of PIs is generated in compliance with the voice of DMs from analyzed manufacturing companies as they track the real-life field circumstances, so it might be considered comprehensive. Generally, PIs may be presented by the set of indices where presents the total number of PIs, and the index of each PI is denoted as .
2.2.2. Definition of a Finite Set of Decision-Makers
In manufacturing companies that operate in a real environment, it is common for several DMs to participate in the decision-making process. They can be presented by the set of indices where presents the total number of DMs, and the is the index of DM. In this research, DMs should be chosen among quality managers, production managers, and sales managers from manufacturing companies.
2.2.3. Choice of Appropriate Linguistic Variables for Describing the Existing Uncertainties
In this paper, uncertainties about the relative importance of DMs, the relative importance of PIs, and the PI values are described by pre-defined sets of natural language words. Respecting the type of uncertainty, the number of linguistic terms is defined. These linguistic expressions are modeled by IVIFNs.
The membership function and non-membership function are set in intervals, and the values in the intervals are determined based on the author’s estimates, respecting the relevant literature (see Table 1).
It is assumed that the relative importance of DMs, the relative importance of PIs, and the values of PIs are adequately described by using a three-point scale, nine-point scale, and seven-point scale, respectively, as shown in Table 2, Table 3 and Table 4 below.
Table 2.
The relative importance of decision-makers.
Table 3.
The relative importance of performance indicators.
Table 4.
The performance indicators’ values.
2.2.4. Determination of Weights Vector of Decision-Makers
Respecting the aim of the considered problem as well as best practice experiences conclusion is that DMs do not have equal relative importance. The relative importance of DMs is assessed by top managers of analyzed companies.
2.2.5. Determination of Weights Vector of Performance Indicators
The determination of the weights vector of PIs is based on the knowledge and experience of DMs from different companies in the same sector of the economy. It is assumed that DMs assess the relative importance of PIs by using pre-defined linguistic expressions (see Table 2). The relative importance of PI should be assessed by DM and modeled by IVIFNs, . The aggregated relative importance of PI is calculated using a standard interval-valued intuitionistic fuzzy geometric operator (IVIFWG) [38]:
Determination of the normalized weights vector of PIs is given in a similar way to the normalized weights vector of DMs, which can be formally presented:
2.2.6. The Proposed IV-TOPSIS
A proposed extension of TOPSIS with IVIFNs is presented.
Step 1. Set fuzzy decision matrix:
where:
Elements of the fuzzy decision matrix represent PI values at the level of company . These values are assessed by the quality manager using pre-defined linguistic terms and corresponding IVIFs, :
Step 2. Determine the normalized fuzzy decision matrix:
where:
Normalized values are obtained by using the procedure [42]:
- benefit type
- cost type
Step 3. Construct the weighted normalized fuzzy decision matrix:
where:
and
Step 4. At the level of each company , is determined IV-FPIS, and IV-FNIS, by using and operators [35].
Step 5. The closeness coefficient, , so that:
where: is Euclidean distance [47].
Step 6. Values are sorted in non-increasing order. The rank of PIs is determined according to the obtained values
Step 7. Based on obtained rank, DMs determine which PIs will be monitored and measured as KPIs, to improve product quality.
3. Results
The aim of the case study is the determination the rank of PIs, which should help quality managers to simplify the selection of relevant KPIs based on obtained rank. The proposed procedure is tested on real-life data obtained from manufacturing companies in the process industry. In this study, three project-oriented manufacturing companies are selected to investigate the KPIs, because of their significant contribution to the growth of the economy in the Republic of Serbia, as well as their need to improve product quality. These companies operate in the Central Serbia region, and they belong to a group of small and medium-sized companies. These companies belong to different global supply chains. The business policy of these companies dictates that data on business performance should not be publicly available. The proposed model was tested on data obtained by using the interview method.
3.1. An Application of the Proposed Procedure for the Determination of Weights of Decision-Makers
In this research, DMs form a group consisting of three members, which are the quality manager, the production manager, and the sales manager from each of the three selected manufacturing companies. This group is formed in each of the three selected manufacturing companies to provide input data on PI importance for the company. Assessment of the relative importance of DMs is performed by top managers of analyzed companies. Since, in this research, small and medium-sized companies that operate in the same environment are considered, top managers make decisions by consensus. During the panel discussion, the top managers decided that the quality manager should have the highest importance since quality PIs are considered. In that case, the relative importance of the quality manager can be described with linguistic expressions D5. The relative importance of the production manager and sales manager is adequately described by linguistic expressions D4 and D2, respectively.
It can be determined that the relative importance of a quality manager is greater than or equal to the relative importance of a production manager, according to the procedure developed by [36,37]. The obtained results are presented:
Applying the procedure, the probability is determined:
Other probabilities are determined similarly, so the weight vector of DMs is:
3.2. An Application of the Proposed Procedure for the Determination of Weights of Performance Indicators
DMs from analyzed manufacturing companies selected eight quality PIs by consensus during the panel discussion. PIs are Customer complaints (), The costs of complaints in the total income (), Implemented internal quality audits (), Realized calibration of measuring equipment (), Share of bad parts (), Complaints on performed services (), Timely closure of non-conformities (), and the costs of poor quality (). All three companies monitor and measure these quality PIs.
DMs at the level of each company assessed the relative importance and value of PI by using pre-defined linguistic terms. They based their assessments on the data from the records by using consensus during the session of the panel discussion. These assessments are presented in Table 5 and Figure 2.
Table 5.
Assessment of the relative importance of performance indicators.

Figure 2.
Assessment of the relative importance of performance indicators.
The aggregation of DMs opinions into the unique mark is given by IVIFWG. The normalized weights of PIs are given by using the proposed procedure [36,37]. The calculated values are presented in Table 6.
Table 6.
The aggregated relative importance of performance indicators.
3.3. An Application of the Proposed IV-TOPSIS
In this subsection, the proposed IV-TOPSIS is illustrated by an example of the assessment and ranking of quality PIs. The fuzzy decision matrix (Step 1) is presented in Table 7.
Table 7.
The fuzzy decision matrix.
As PIs are benefit type and cost type, further the normalization procedure [42] is applied. Normalized values of treated PIs (Step 2) are presented in Table 8.
Table 8.
The normalized fuzzy decision matrix.
The weighted normalized fuzzy decision matrix, IV-FPIS, and IV-FNIS are constructed and presented in Table 9 according to the proposed model (Step 3 to Step 4).
Table 9.
The weighted normalized fuzzy decision matrix.
According to the proposed procedure (Step 5 to Step 6), the rank of PIs is calculated and presented in Table 10.
Table 10.
The rank of performance indicators.
According to the obtained results of the proposed procedure, the top three ranked PIs are () Customer complaints, () Share of bad parts, and () Realized calibration of measuring equipment. PI (), Implemented internal quality audits, is also significant for the companies and can be monitored and measured. PIs () Complaints on performed services, () Timely closure of non-conformities, and () The costs of poor quality, are equally important for company management, but according to the results of this study, do not have to be managed. Also, PI () The costs of complaints in the total income, has no significance for the product quality improvement and in that context, it should not be monitored and measured.
By reducing customer complaints (), the costs of poor quality can be reduced, and customer satisfaction and trust will be increased. Increasing customer satisfaction, in terms of product quality, is one of the strategic goals of the analyzed manufacturing companies, which is one of the reasons for the highest rank of PI (). By reducing the share of bad parts (), the cost of non-conformity can be reduced and the on-time delivery to the customer can be increased. Reducing product non-conformity is also one of the company’s strategic goals. Calibration of measuring equipment () confirms the accuracy of the measurements with that equipment and reduces the possibility of poor-quality products being delivered to the customers.
In this study, the PIs () and () are marked as critical for product quality and must be adequately managed. They should be monitored and measured daily. PI () and () should be monitored and measured monthly.
The top-ranked PIs have the biggest impact on product quality, regarding the treated values and corresponding weights. These PIs can be selected as KPIs for analyzed manufacturing companies, but DMs must make the final decision on the choice of KPIs.
The KPIs should be constantly reviewed and changed according to environmental changes because the goal of performance management is the adequate implementation of the company’s strategy to achieve satisfactory financial results.
For the purposes of data collection and further processing, the PIs () Share of bad parts and () Realized calibration of measuring equipment can be closely related to the IoT.
The problem that is being solved in the scope of the research is obtaining KPIs from the finite set of PIs, so a lot of uncertainty is involved in the decision-making process and traditional methods are not suitable enough to provide precise output as a solution.
The assessment of DMs’ relative importance is obtained in a similar manner as in previous research. The novelty of the proposed research is that the calculation of the weights vector is based on the inclusion comparison probability between the closeness intuitionistic fuzzy sets method.
Also, the previous research supports the same type of criteria, so the normalization procedure has not been employed. In the proposed research, there is an assumption that all criteria are not of the same type, so the normalization procedure is applied. This fact is more realistic since different types of criteria exist in most management problems.
The problem is solved by employing IVIFNs to perform calculations introduced by existing MADM methods, so it represents the novelty of this paper in a methodological manner.
4. Conclusions
Operating in contemporary business conditions, a company’s business largely depends on customer satisfaction. Product quality, along with the price and on-time delivery, affects customer satisfaction. This research proposes a model for quality PIs ranking. Based on the obtained rank of PIs, DMs should determine the KPIs that are critical to a product’s quality. So, selected KPIs should be measured and monitored daily.
The proposed model is tested and verified on real-life data from three project-oriented manufacturing companies in the process industry. The relative importance of DMs is assessed by the top managers of the considered companies. The relative importance of IPs and their values is assessed by DMs at the level of each company. Their assessments are based on their experience, knowledge, and evidence data.
The main contribution of the presented research from the methodological perspective may be summarized as follows: (1) modeling of existing uncertainties is based on IVIFNs; (2) the weights vectors are given by using the inclusion comparison probability between the closeness intuitionistic fuzzy sets; (3) the decision-making matrix is constructed as the fuzzy weighted normalized decision matrix; (4) the PIs are ranked by using the proposed IV-TOPSIS; in this way, relevant KPIs can be selected.
In practice, it is known that it is unusual to measure many PIs every day. According to the experience of best practice, it can be said that in the domain of quality, a maximum of three PIs, which are marked as KPIs, can be measured and monitored at a daily level. Since there is no defined strict methodology for determining the KPIs for certain types of companies in the industry, this research provides a significant practical contribution. The practical implication of the proposed model is the selection of KPIs in an exact way. The selected KPIs are significantly less burdened by DMs’ subjective opinions, which enables the more effective and efficient achievement of strategic goals. The practical implication of the proposed model is the selection of KPIs in an exact way. The selected KPIs are significantly less burdened by DMs’ subjective opinions, which enables the more effective and efficient achievement of strategic goals.
The model is flexible in terms of changes in the environment and external disturbances such as the importance of PIs, changes in national legislation, changes in economic trends, or the manifest of other unpredicted events. Specifically, flexibility is achieved in terms of (i) changes in the number of PIs, (ii) changes in the relative importance of PIs and DMs and their weights, and (iii) changes in PIs. All these changes can be easily incorporated into the model. This can be marked as the main advantage of the proposed model. The main constraint of the proposed model is subjectivity in assessments of the input data for the model. The process of validation is still ongoing as the companies that participate in the research have adopted the selected KPIs for monitoring and managing. After a certain period, those results will be compared with the previously established system for monitoring and managing quality performance. Future research should include applying the proposed model to companies that exist in different economic sectors.
Author Contributions
Conceptualization, S.N., R.G., and D.T.; methodology, S.N. and D.T.; validation, S.N., and D.T.; formal analysis, S.N. and R.G.; investigation, S.N. and T.P.; resources, T.P.; data curation, R.G. and T.P; writing—original draft preparation, S.N., R.G., and D.T., visualization, P.M. and T.P. All authors have read and agreed to the published version of the manuscript.
Funding
This research was funded by the EIT’s HEI Initiative SMART-2M project, supported by EIT RawMaterials, and funded by the European Union.
Data Availability Statement
Not applicable.
Conflicts of Interest
The authors declare no conflict of interest.
Appendix A. Basic Considerations of Intuitionistic Fuzzy Sets
Definition A1.
An intuitionistic fuzzy setin the universe of discourse X is defined by the form [49]:
where:
The numbersanddenote the membership degree and non-membership degree.
With the condition
For each intuitionistic fuzzy setfrom set X, the following holds:
The value ofis called the degree of indeterminacy (or hesitation). The smaller, more certain.
Definition A2.
Let a setbe auniverse of discourse, an IVIFSin X is an object having the form:
where:
Are intervals denoting the membership and the non-membership degrees of the elementtowith the condition:
Similarly, the hesitancy degree of x tocan be calculated as:
An interval-valued intuitionistic fuzzy IVIFS can be simply denoted as:
where:andand.
Definition A3.
Letandbe two positive IVIFSs. And λ is a real positive number. The operations of these IVIFSs are [48]:
Definition A4.
Euclidean distance between two IVIFSs,and
, can be defined as [47]
Definition A5.
Letand
be two IVIFNs. A comparison of two IVIFNs is based on the procedure by Chen [37] which is presented further.
The lower,and upper,inclusion comparison possibilities:
Expressions above must satisfy the following conditions:
The inclusion comparison possibility,is given:
If, then.
Definition A6.
Let there bedifferent IVIFNs:
The probability that IVIFNgreater than or equal to all other IVIFNs is determined according to the procedure [36]:
References
- Braccini, A.M.; Margherita, E.G. Exploring Organizational Sustainability of Industry 4.0 under the Triple Bottom Line: The Case of a Manufacturing Company. Sustainability 2019, 11, 36. [Google Scholar] [CrossRef]
- Rüßmann, M.; Lorenz, M.; Gerbert, P.; Waldner, M.; Justus, J.; Engel, P.; Harnisch, M.J. Industry 4.0: The Future of Productivity and Growth in Manufacturing Industries. Boston Consult. Group 2015, 9, 54–89. [Google Scholar]
- Moeuf, A.; Pellerin, R.; Lamouri, S.; Tamayo-Giraldo, S.; Barbaray, R. The Industrial Management of SMEs in the Era of Industry 4.0. Int. J. Prod. Res. 2018, 56, 1118–1136. [Google Scholar] [CrossRef]
- Fettermann, D.C.; Cavalcante, C.G.S.; de Almeida, T.D.; Tortorella, G.L. How Does Industry 4.0 Contribute to Operations Management? J. Ind. Prod. Eng. 2018, 35, 255–268. [Google Scholar] [CrossRef]
- Mohammadzadeh, A.; Taghavifar, H. A Robust Fuzzy Control Approach for Path-Following Control of Autonomous Vehicles. Soft Comput. 2020, 24, 3223–3235. [Google Scholar] [CrossRef]
- Neely, A. Business Performance Measurement: Unifying Theory and Integrating Practice, 2nd ed.; Cambridge University Press: Cambridge, UK, 2007; ISBN 978-0-521-85511-2. [Google Scholar]
- Bhatti, M.I.; Awan, H.M.; Razaq, Z. The Key Performance Indicators (KPIs) and Their Impact on Overall Organizational Performance. Qual. Quant. 2014, 48, 3127–3143. [Google Scholar] [CrossRef]
- Závadský, J.; Korenková, V.; Závadská, Z.; Kadárová, J.; Tuček, D. Competences in the Quality Management System Evaluation Based on the Most Worldwide Used Key Performance Indicators. Calitatea 2019, 20, 29–41. [Google Scholar]
- Wohlers, B.; Dziwok, S.; Pasic, F.; Lipsmeier, A.; Becker, M. Monitoring and Control of Production Processes Based on Key Performance Indicators for Mechatronic Systems. Int. J. Prod. Econ. 2020, 220, 107452. [Google Scholar] [CrossRef]
- Parmenter, D. Key Performance Indicators: Developing, Implementing, and Using Winning KPIs, 4th ed.; Wiley: Hoboken, NJ, USA, 2019; ISBN 978-1-119-62077-8. [Google Scholar]
- Kang, N.; Zhao, C.; Li, J.; Horst, J.A. A Hierarchical Structure of Key Performance Indicators for Operation Management and Continuous Improvement in Production Systems. Int. J. Prod. Res. 2016, 54, 6333–6350. [Google Scholar] [CrossRef]
- Nestic, S.; Lampón, J.F.; Aleksic, A.; Cabanelas, P.; Tadic, D. Ranking Manufacturing Processes from the Quality Management Perspective in the Automotive Industry. Expert Syst. 2019, 36, e12451. [Google Scholar] [CrossRef]
- ISO 22400-2:2014; Automation Systems and Integration—Key Performance Indicators (KPIs) for Manufacturing Operations Management—Part 2: Definitions and Descriptions. ISO: Geneva, Switzerland, 2014.
- Chorfi, Z.; Berrado, A.; Benabbou, L. Selection of Key Performance Indicators for Supply Chain Monitoring Using MCDA. In Proceedings of the 2015 10th International Conference on Intelligent Systems: Theories and Applications (SITA), Rabat, Morocco, 20–21 October 2015; pp. 1–6. [Google Scholar]
- Kaganski, S.; Majak, J.; Karjust, K. Fuzzy AHP as a Tool for Prioritization of Key Performance Indicators. Procedia CIRP 2018, 72, 1227–1232. [Google Scholar] [CrossRef]
- Cristea, C.; Cristea, M. KPIs for Operational Performance Assessment in Flexible Packaging Industry. Sustainability 2021, 13, 3498. [Google Scholar] [CrossRef]
- Kailash; Saha, R.K.; Goyal, S. Benchmarking Model to Analyse ISCM Performance of Selected Indian Manufacturing Industries Using Fuzzy AHP Technique. Int. J. Ind. Syst. Eng. 2019, 33, 1–16. [Google Scholar] [CrossRef]
- Amaladhasan, S.; Parthiban, P.; Dhanalakshmi, R. Green Supply Chain Performance Evaluation Model for Automotive Manufacturing Industries by Using Eco-Balanced Scorecard. Int. J. Serv. Oper. Manag. 2019, 33, 442–467. [Google Scholar] [CrossRef]
- Torbacki, W.; Kijewska, K. Identifying Key Performance Indicators to Be Used in Logistics 4.0 and Industry 4.0 for the Needs of Sustainable Municipal Logistics by Means of the DEMATEL Method. Transp. Res. Procedia 2019, 39, 534–543. [Google Scholar] [CrossRef]
- Moktadir, M.A.; Dwivedi, A.; Rahman, A.; Chiappetta Jabbour, C.J.; Paul, S.K.; Sultana, R.; Madaan, J. An Investigation of Key Performance Indicators for Operational Excellence towards Sustainability in the Leather Products Industry. Bus. Strategy Environ. 2020, 29, 3331–3351. [Google Scholar] [CrossRef]
- Brint, A.; Genovese, A.; Piccolo, C.; Taboada-Perez, G.J. Reducing Data Requirements When Selecting Key Performance Indicators for Supply Chain Management: The Case of a Multinational Automotive Component Manufacturer. Int. J. Prod. Econ. 2021, 233, 107967. [Google Scholar] [CrossRef]
- Moons, K.; Waeyenbergh, G.; Pintelon, L.; Timmermans, P.; De Ridder, D. Performance Indicator Selection for Operating Room Supply Chains: An Application of ANP. Oper. Res. Health Care 2019, 23, 100229. [Google Scholar] [CrossRef]
- Rodrigues, D.; Godina, R.; da Cruz, P.E. Key Performance Indicators Selection through an Analytic Network Process Model for Tooling and Die Industry. Sustainability 2021, 13, 13777. [Google Scholar] [CrossRef]
- Ante, G.; Facchini, F.; Mossa, G.; Digiesi, S. Developing a Key Performance Indicators Tree for Lean and Smart Production Systems. IFAC Pap. 2018, 51, 13–18. [Google Scholar] [CrossRef]
- Sousa, J.; Mendonça, J.P.; Machado, J. A Generic Interface and a Framework Designed for Industrial Metrology Integration for the Internet of Things. Comput. Ind. 2022, 138, 103632. [Google Scholar] [CrossRef]
- Li, D.-F. Multiattribute Decision Making Method Based on Generalized OWA Operators with Intuitionistic Fuzzy Sets. Expert Syst. Appl. 2010, 37, 8673–8678. [Google Scholar] [CrossRef]
- Li, D.-F. The GOWA Operator Based Approach to Multiattribute Decision Making Using Intuitionistic Fuzzy Sets. Math. Comput. Model. 2011, 53, 1182–1196. [Google Scholar] [CrossRef]
- Hwang, C.-L.; Yoon, K. Methods for Multiple Attribute Decision Making. In Multiple Attribute Decision Making: Methods and Applications A State-of-the-Art Survey; Lecture Notes in Economics and Mathematical Systems; Hwang, C.-L., Yoon, K., Eds.; Springer: Berlin/Heidelberg, Germany, 1981; pp. 58–191. ISBN 978-3-642-48318-9. [Google Scholar]
- Onat, N.C.; Gumus, S.; Kucukvar, M.; Tatari, O. Application of the TOPSIS and Intuitionistic Fuzzy Set Approaches for Ranking the Life Cycle Sustainability Performance of Alternative Vehicle Technologies. Sustain. Prod. Consum. 2016, 6, 12–25. [Google Scholar] [CrossRef]
- Wang, C.-Y.; Chen, S.-M. Multiple Attribute Decision Making Based on Interval-Valued Intuitionistic Fuzzy Sets, Linear Programming Methodology, and the Extended TOPSIS Method. Inf. Sci. 2017, 397–398, 155–167. [Google Scholar] [CrossRef]
- Memari, A.; Dargi, A.; Jokar, M.R.A.; Ahmad, R.; Rahim, A.R.A. Sustainable Supplier Selection: A Multi-Criteria Intuitionistic Fuzzy TOPSIS Method. J. Manuf. Syst. 2019, 50, 9–24. [Google Scholar] [CrossRef]
- Hajek, P.; Froelich, W. Integrating TOPSIS with Interval-Valued Intuitionistic Fuzzy Cognitive Maps for Effective Group Decision Making. Inf. Sci. 2019, 485, 394–412. [Google Scholar] [CrossRef]
- Tiwari, A.; Lohani, Q.M.D.; Muhuri, P.K. Interval-Valued Intuitionistic Fuzzy TOPSIS Method for Supplier Selection Problem. In Proceedings of the 2020 IEEE International Conference on Fuzzy Systems (FUZZ-IEEE), Glasgow, UK, 19–24 July 2020; pp. 1–8. [Google Scholar]
- Abdullah, L.; Goh, C.; Zamri, N.; Othman, M. Application of Interval Valued Intuitionistic Fuzzy TOPSIS for Flood Management. J. Intell. Fuzzy Syst. 2020, 38, 873–881. [Google Scholar] [CrossRef]
- Eraslan, S. A Decision Making Method via TOPSIS on Soft Sets. J. New Results Sci. 2015, 4, 57–70. [Google Scholar]
- Li, D.-F. Closeness Coefficient Based Nonlinear Programming Method for Interval-Valued Intuitionistic Fuzzy Multiattribute Decision Making with Incomplete Preference Information. Appl. Soft Comput. 2011, 11, 3402–3418. [Google Scholar] [CrossRef]
- Chen, T.-Y. An Inclusion Comparison Approach for Multiple Criteria Decision Analysis Based on Interval-Valued Intuitionistic Fuzzy Sets. Technol. Econ. Dev. Econ. 2016, 22, 357–392. [Google Scholar] [CrossRef]
- Xu, Z. Methods for Aggregating Interval-Valued Intuitionistic Fuzzy Information and Their Application to Decision Making. Control Decis. 2007, 22, 215–219. [Google Scholar]
- Nijkamp, P.; Rietveld, P.; Voogd, H. Multicriteria Evaluation in Physical Planning; Elsevier: Amsterdam, The Netherlands, 2013; ISBN 978-1-4832-9082-9. [Google Scholar]
- Ekmekçioğlu, M.; Kaya, T.; Kahraman, C. Fuzzy Multicriteria Disposal Method and Site Selection for Municipal Solid Waste. Waste Manag. 2010, 30, 1729–1736. [Google Scholar] [CrossRef]
- Chen, T.-Y. The Inclusion-Based TOPSIS Method with Interval-Valued Intuitionistic Fuzzy Sets for Multiple Criteria Group Decision Making. Appl. Soft Comput. 2015, 26, 57–73. [Google Scholar] [CrossRef]
- Kumar, K.; Garg, H. TOPSIS Method Based on the Connection Number of Set Pair Analysis under Interval-Valued Intuitionistic Fuzzy Set Environment. Comput. Appl. Math. 2018, 37, 1319–1329. [Google Scholar] [CrossRef]
- Szmidt, E.; Kacprzyk, J. Distances between Intuitionistic Fuzzy Sets. Fuzzy Sets Syst. 2000, 114, 505–518. [Google Scholar] [CrossRef]
- Xu, Z.; Cai, X. Intuitionistic Fuzzy Information Aggregation. In Intuitionistic Fuzzy Information Aggregation: Theory and Applications; Xu, Z., Cai, X., Eds.; Springer: Berlin/Heidelberg, Germany, 2012; pp. 1–102. ISBN 978-3-642-29584-3. [Google Scholar]
- Gupta, P.; Mehlawat, M.K.; Grover, N.; Pedrycz, W. Multi-Attribute Group Decision Making Based on Extended TOPSIS Method under Interval-Valued Intuitionistic Fuzzy Environment. Appl. Soft Comput. 2018, 69, 554–567. [Google Scholar] [CrossRef]
- Boran, F.E.; Genç, S.; Kurt, M.; Akay, D. A Multi-Criteria Intuitionistic Fuzzy Group Decision Making for Supplier Selection with TOPSIS Method. Expert Syst. Appl. 2009, 36, 11363–11368. [Google Scholar] [CrossRef]
- Park, J.H.; Park, I.Y.; Kwun, Y.C.; Tan, X. Extension of the TOPSIS Method for Decision Making Problems under Interval-Valued Intuitionistic Fuzzy Environment. Appl. Math. Model. 2011, 35, 2544–2556. [Google Scholar] [CrossRef]
- Chen, T.-Y.; Wang, H.-P.; Lu, Y.-Y. A Multicriteria Group Decision-Making Approach Based on Interval-Valued Intuitionistic Fuzzy Sets: A Comparative Perspective. Expert Syst. Appl. 2011, 38, 7647–7658. [Google Scholar] [CrossRef]
- Atanassov, K.T. Intuitionistic Fuzzy Sets. Fuzzy Sets Syst. 1986, 20, 87–96. [Google Scholar] [CrossRef]
Publisher’s Note: MDPI stays neutral with regard to jurisdictional claims in published maps and institutional affiliations. |
© 2022 by the authors. Licensee MDPI, Basel, Switzerland. This article is an open access article distributed under the terms and conditions of the Creative Commons Attribution (CC BY) license (https://creativecommons.org/licenses/by/4.0/).