Article

Atherosclerotic Plaque Segmentation Based on Strain Gradients: A Theoretical Framework

by
Álvaro T. Latorre
1,*,
Miguel A. Martínez
1,2,
Myriam Cilla
1,2,
Jacques Ohayon
3,4 and
Estefanía Peña
1,2,*
1
Aragón Institute for Engineering Research (I3A), University of Zaragoza, 50018 Zaragoza, Spain
2
CIBER de Bioingeniería, Biomateriales y Nanomedicina (CIBER-BBN), 50018 Zaragoza, Spain
3
Laboratory TIMC-IMAG, CNRS UMR 5525, Grenoble-Alpes University, 38400 Grenoble, France
4
Mechanics and Material Department, Savoie Mont-Blanc University, Polytech Annecy, Le Bourget du Lac, 73000 Chambéry, France
*
Authors to whom correspondence should be addressed.
Mathematics 2022, 10(21), 4020; https://doi.org/10.3390/math10214020
Submission received: 26 September 2022 / Revised: 18 October 2022 / Accepted: 25 October 2022 / Published: 29 October 2022
(This article belongs to the Special Issue Numerical Simulation in Biomechanics and Biomedical Engineering-II)

Abstract

:
Background: Atherosclerotic plaque detection is a clinical and technological problem that has been approached by different studies. Nowadays, intravascular ultrasound (IVUS) is the standard used to capture images of the coronary walls and to detect plaques. However, IVUS images are difficult to segment, which complicates obtaining geometric measurements of the plaque. Objective: IVUS, in combination with new techniques, allows estimation of strains in the coronary section. In this study, we have proposed the use of estimated strains to develop a methodology for plaque segmentation. Methods: The process is based on the representation of strain gradients and the combination of the Watershed and Gradient Vector Flow algorithms. Since it is a theoretical framework, the methodology was tested with idealized and real IVUS geometries. Results: We achieved measurements of the lipid area and fibrous cap thickness, which are essential clinical information, with promising results. The success of the segmentation depends on the plaque geometry and the strain gradient variable (SGV) that was selected. However, there are some SGV combinations that yield good results regardless of plaque geometry such as ε v M i s e s + ε r θ , ε y y + ε r r or ε m i n + ε T r e s c a . These combinations of SGVs achieve good segmentations, with an accuracy between 97.10% and 94.39% in the best pairs. Conclusions: The new methodology provides fast segmentation from different strain variables, without an optimization step.

1. Introduction

Cardiovascular diseases are the leading cause of death worldwide, with 17.9 million deaths per year, which represent 31% of the demises [1]. The majority of the coronary events are related to heart attack or cerebral strokes, which are commonly trigged by atherosclerotic plaque rupture [2]. The atherosclerotic plaque is the result of lipid deposition in the artery wall, which creates a lipid core surrounded by fibrotic tissue. The fibrotic tissue that separates the lipid core from the lumen is called the fibrous cap [3]. The rupture of the fibrous cap induces a thrombus in the artery that obstructs the blood flow, leading to an acute coronary event [4]. The vulnerability of the plaque is related to the risk of fibrous cap rupture and the thrombus formation. There are some geometrical parameters that are important for the vulnerability characterization. Some studies have suggested that atherosclerotic plaques with fibrous cap thicknesses (FCT) thinner than 65 μ m and lipid cores with a large area are vulnerable and prone to rupture [3,5]. On the other hand, a large FCT usually indicates that the plaque is stable. However, the prediction of the plaque rupture is not only based on geometrical features, but also on the mechanical properties of the tissues [6,7]. Nowadays, intravascular ultrasound (IVUS) images are the gold standard for clinical diagnosis of atherosclerotic plaques in coronary arteries. IVUS images show a cross section of the artery wall in greyscale, and the segmentation usually depends on the cardiologist’s experience. Each plaque tissue has different echo reflectivity characteristics, so its appearance within an IVUS image can be distinguished [8]. The segmentation can be performed manually; nevertheless, it requires clinical expertise, a high amount of time and, therefore, cost, and it depends on the image quality [9]. In order to solve this problem, new clinical techniques such as virtual histology intravascular ultrasound (VH-IVUS) have emerged. VH-IVUS is a clinical method for visualizing color-coded tissue maps, which provides an automated plaque characterization [10]. However, there are some limitations to this technique: first, it has a poor recognition of the FCT due to false detection of lipid core tissue and limitations in the plaque type classification (thin FCT, calcified plaque, or stable plaque) [11]. Second, only one computation can be performed per cardiac cycle, which reduces the number of IVUS frames used to characterize the plaque [12]. Third, the clinics have to be equipped with VH software.
That is why new techniques, mostly based on machine learning, have been developed to segment or characterize the atherosclerotic plaque tissues from IVUS images [9]. Methods based on Random Forest were used to classify IVUS image pixels into different tissues (dense calcium, necrotic, fibrotic tissue, and fibrofatty tissue) [12,13]. Although these strategies have achieved high classification accuracy (70–85%), the validation was performed with VH-IVUS and the results were unstable [13]. Other techniques, such as the the Neuro Fuzzy classifier, showed potential results in detecting fibrotic, lipidic and calcified tissues by classifying different pixels of the IVUS image [14]. Supporting vector machines have been used with IVUS and VH-IVUS images to classify the vulnerability of the plaques depending on the FCT (thin FCT vs. normal/stable FCT) [11,15] or to detect calcifications [16,17]. Recently, convolutional neural networks (CNN) have emerged strongly as a good classifier. CNN has also been used to classify plaque into thin or stable FCT [18], to detect calcifications in the IVUS frames [19,20], or to segment the lumen and outer contours [21,22]. Newer studies presented CNNs that detect different tissues of the atherosclerotic plaque with high accuracy [8,23]. However, the accuracy of the majority of the machine learning methods does not include the actual measure of the FCT, which plays a key role in the plaque vulnerability. Although some studies analyzed the FCT, they only used it as a classifier to characterize the plaque as thin or normal FCT [11,15,18]. The main limitation of these machine learning techniques arises from on the lack of a large public database to train and test the models [9]. This entails that, usually, each study proved the efficiency of their technique with less than 12 patients [8,11,12,13,15,20] and human plaque geometries vary greatly in each patient.
These machine learning methodologies give morphological information of the composition of the atherosclerotic plaque; however, the vulnerability also depends on the mechanical properties of the tissues. For this reason, another line of research focuses on segmentation by using mechanical properties such as strain or elasticity maps. For vulnerability characterizations, elastography is commonly used to obtain the elasticity map of the arterial wall [24,25,26,27]. Therefore, the main objective of many studies was to segment and characterize the mechanical properties of the different plaque tissues at the same time [25,28,29]. Different speckle estimators or optical flow methods can be used to track the pixels’ motion or estimate the strains in IVUS images [27,30]. Then, the segmentation and mechanical property estimation procedures are linked and usually consist of an iterative optimization problem. Segmentation results depend on the number of inclusions evaluated at each iteration [28,29,31]. With this optimization process it is possible to estimate the mechanical properties of the arterial wall and, furthermore, the segmentation of the plaque geometry. This methodology allows to take measurements of the FCT, lipid area, and the stiffness of the tissues. These types of processes have been tested in silico with finite element (FE) models [25,28,32], in vitro with polyvinyl acetate (PVA) phantoms [24], and in vivo with IVUS images from patients. The main disadvantages of these techniques are the high computational cost and the fact that the result depends on the number of inclusions evaluated.
Our work continues the study of the state-of-the-art of atherosclerotic plaque vulnerability by separating the segmentation procedure from the estimation of the mechanical properties. The main contribution of this paper is the definition of a new intuitive segmentation tool to segment the atherosclerotic plaque tissues without iterative or optimization steps, thus reducing computational costs. In addition, the method allows segmentation based on the representation of a large number of variables. By knowing the exact number of tissues, this technique opens the opportunity to obtain mechanical properties in future studies. This is a theoretical framework to lay the groundwork for future research; therefore, the methodology was developed and validated with in silico data. We have simulated the estimated strains that could be obtained from IVUS images with speckle estimators, with FE models, and adding some noise to the strain fields. We have defined this process as simulated IVUS data, as we are recreating the type of data that could be extracted from IVUS images. Our segmentation process is based on the representation of the modulus of the strain gradients and Watershed and Gradient Vector Flow (W-GVF) algorithms. The results are mainly focused on the lipid core segmentation, because of the importance of measuring the FCT and the lipid area for plaque vulnerability. This methodology was studied by using different strain variables in the segmentation process with different geometries. We have modeled three idealized geometries to analyze the FCT influence on the segmentation and three real IVUS patient geometries. In all of the analyzed cases, the proposed method was able to segment the lipid core and to measure the lipid area and FCT with enough accuracy.

2. Materials and Methods

The structure of the methodology was divided into five steps and it is schematized in Figure 1. The first step was to simulate IVUS data by computing different FE models, and then the FE results were analyzed mimicking two consecutive pictures taken by an IVUS. In the second step, some noise was added to the FE strains to mimic the intrinsic noise of the IVUS images. After that, the different strain gradient variables (SGVs) were computed in order to use them for the lipid segmentation process. Finally, after the segmentation we analyzed the performance of the results.

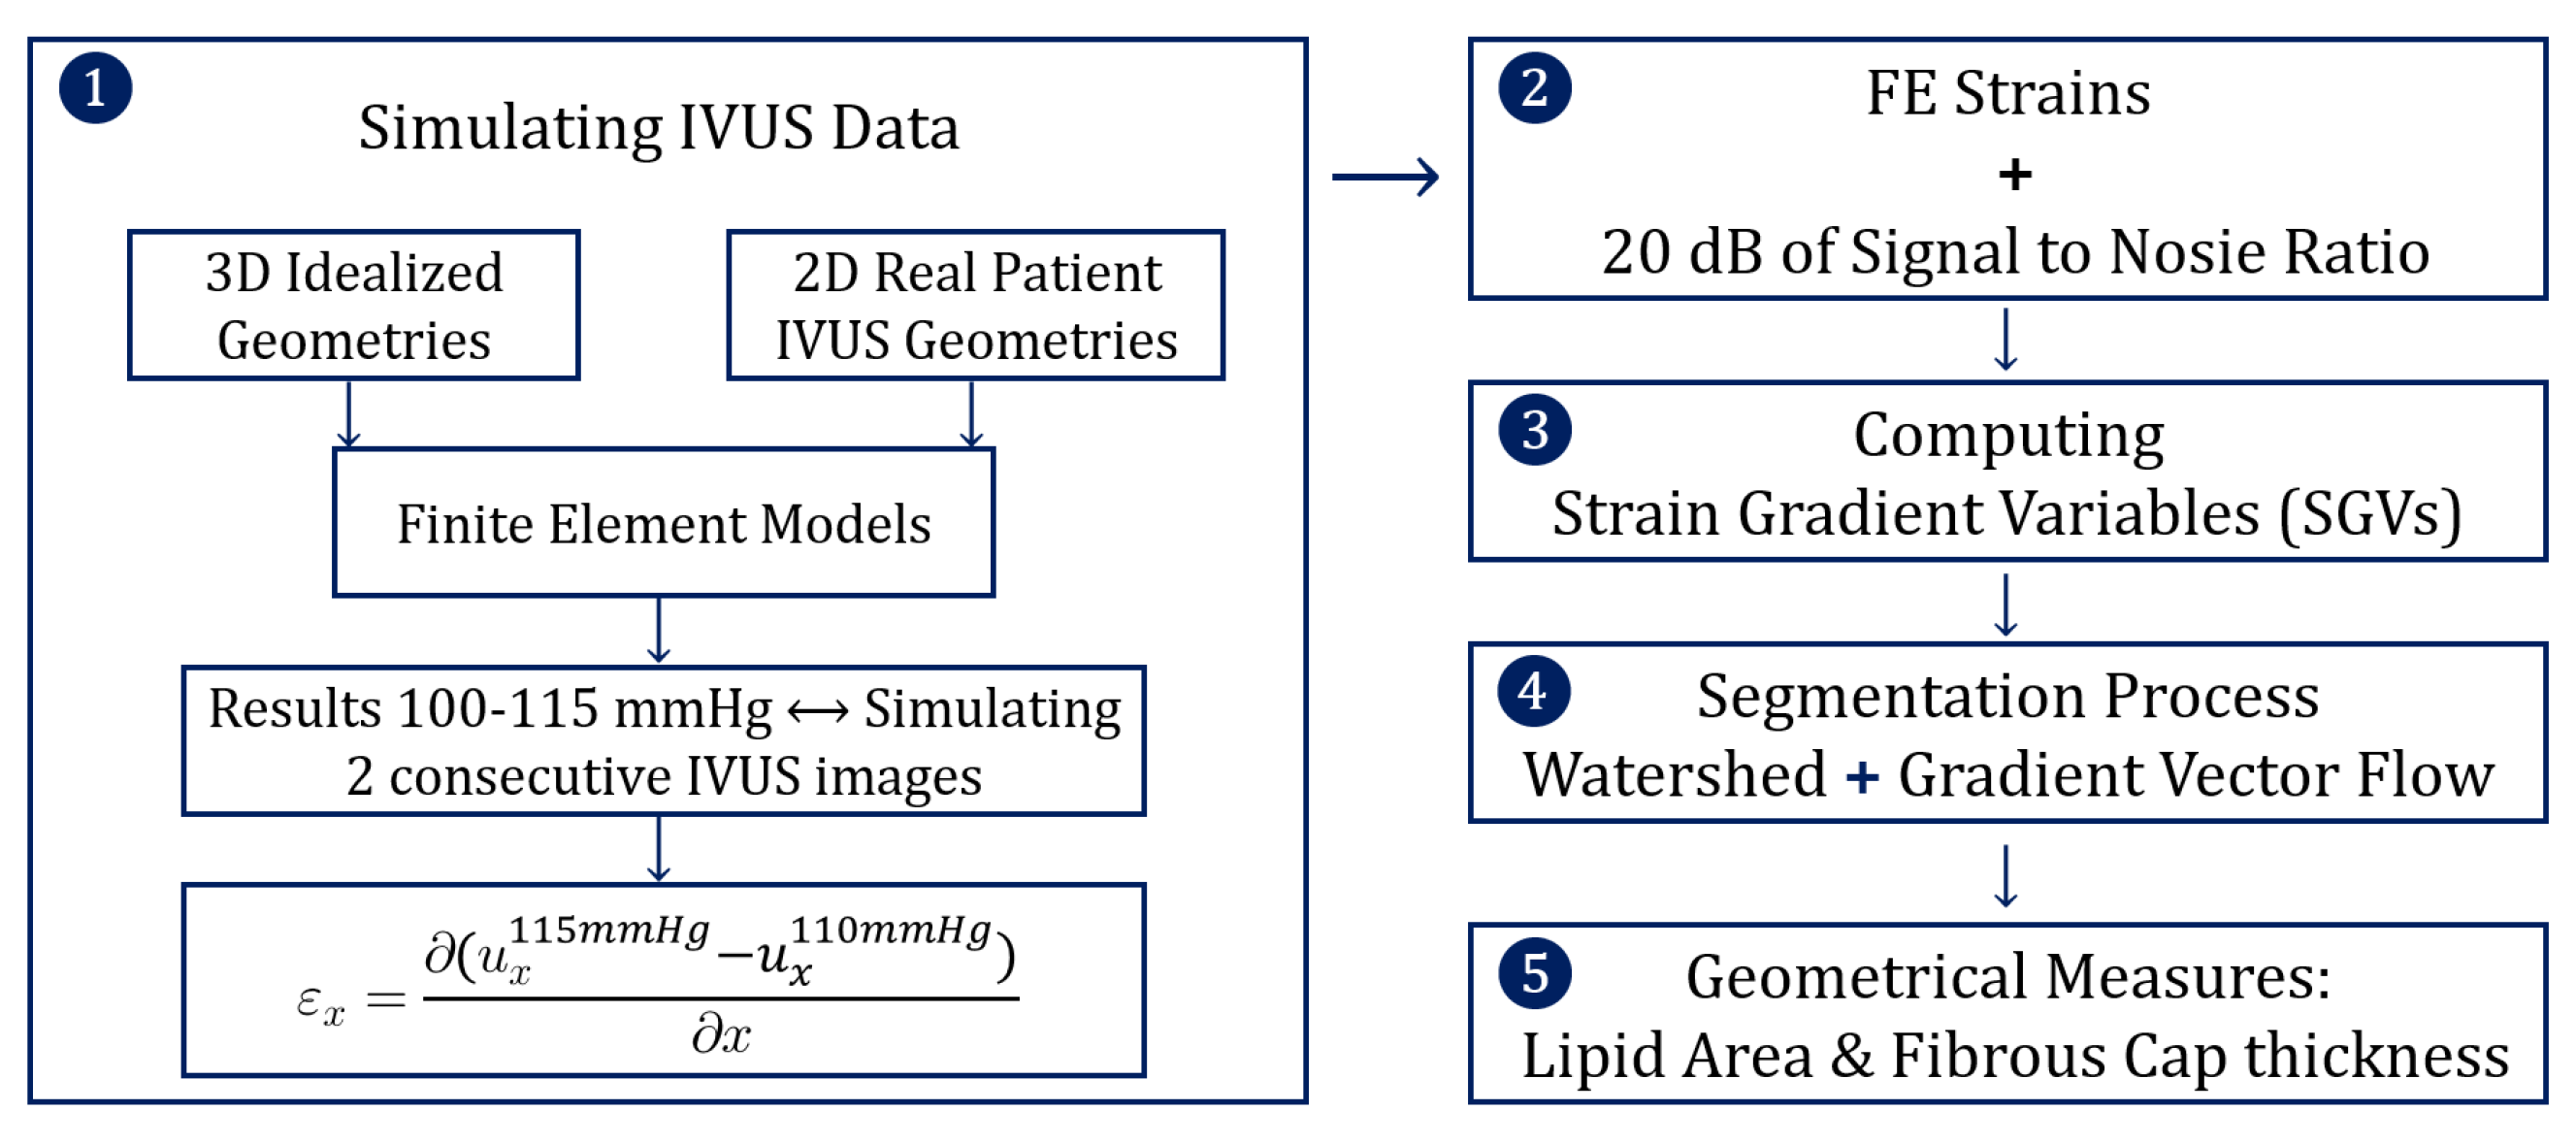
2.1. Simulating IVUS Data
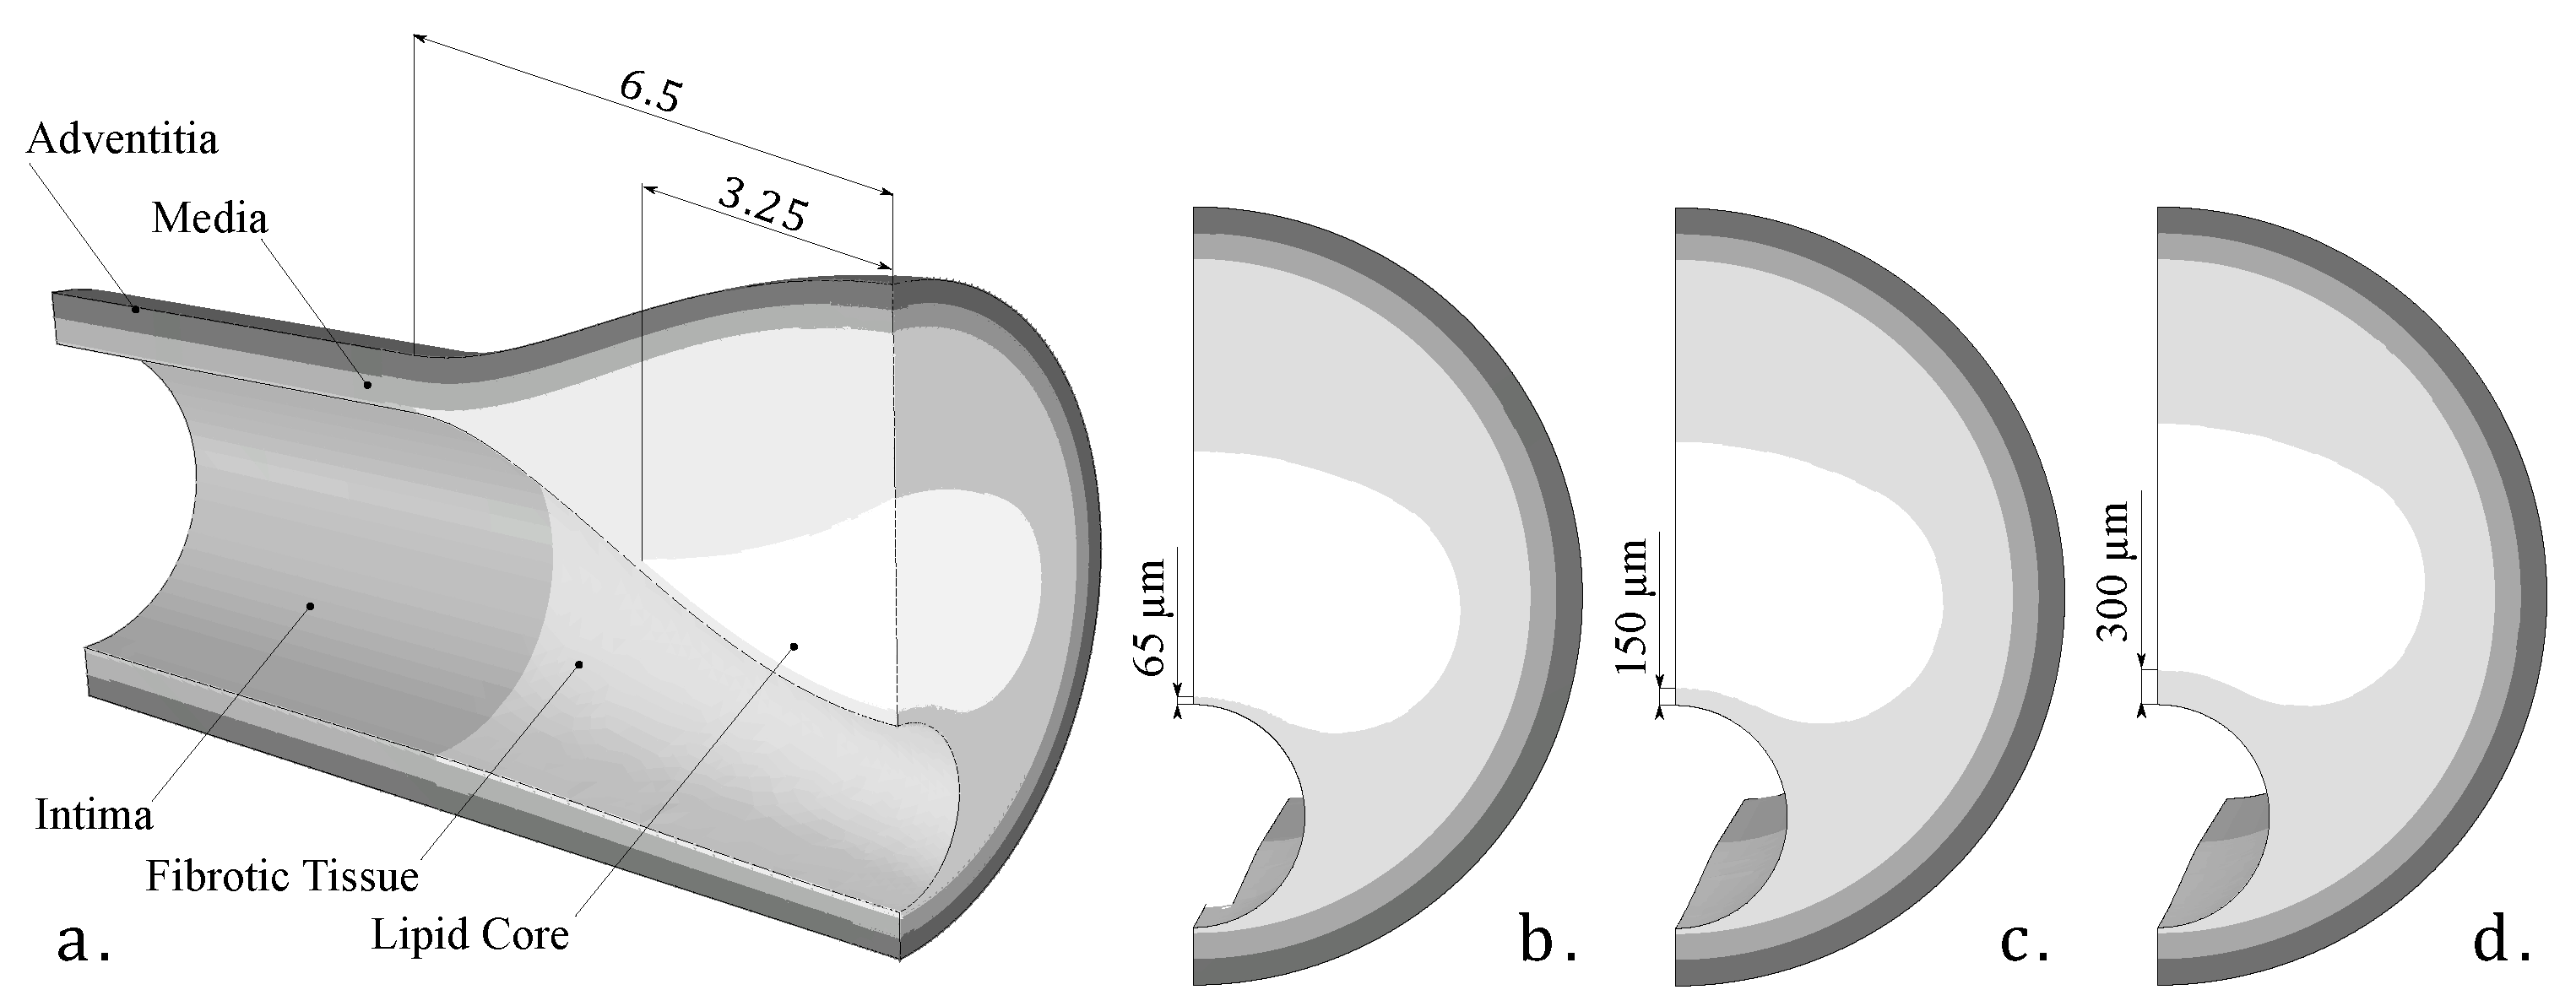
2.1.1. Geometries

As this was a theoretical study, the IVUS data were simulated by using FE models with idealized and real patient geometries. The idealized geometries consisted of a 3D geometry with a 13 mm long atheroma plaque and with a lipid core length of 6.5 mm and different FCTs [33]. We analyzed three different FCTs, trying to cover the different geometric possibilities. A FCT of 65 μ m was considered to represent a vulnerable case [5], 300 μ m represented a stable plaque, and finally, 150 μ m was an intermediate value between the two extremes. The geometry was reconstructed following the Glagov results [34] and the Finet law [6]. The model was constructed with symmetric conditions, so only a quarter of the geometry is shown in Figure 2a. The model had different tissues: adventitia, healthy media and intima, fibrotic tissue, and lipid core. As one of the aims of this study was to check the influence of the FCT on the segmentation process, three thicknesses, 65, 150, and 300 μ m, were considered, and they are represented in Figure 2b–d. Despite the use of a 3D model, we only analyzed the section of maximum stenosis with the plane strain assumption in order to reproduce the IVUS technique. On the other hand, the real patient geometries were obtained from three IVUS images of human coronary plaques that were manually segmented by an expert cardiologist in a previous study [35]. Both IVUS images and the cardiologist segmentation of the three plaques are shown in Figure 3. When there was lack of information in the axial direction, in these cases the FE models were 2D. In two IVUS geometries, only the fibrotic tissue and the lipid core were considered, and on the third plaque a calcification was also included.

2.1.2. Modeling of Tissue Behavior

All tissues were modeled as hyperelastic, non-lineal, and incompressible with the constitutive model proposed by Gasser et al. [36]. The healthy tissues (adventitia, media, and intima) were modeled as anisotropic with two families of fibers. Conversely, the unhealthy tissues (fibrotic tissue and lipid core) were considered as an isotropic behavior model by the use of parameter κ = 1 / 3 in the Gasser model. All tissue was assumed to be fully incompressible (D = 0) in the idealized geometries and quasi-incompressible (D = 0.49) in the real IVUS geometries. The material parameters of the equation in (1) were fitted from experimental curves obtained from the bibliography [37,38] using the software Hyperfit [39]. All the parameters of (1) are reflected in Table 1, where α is the angle of the fibers with respect to the circumferential direction. The calcification of the third IVUS plaque was modeled with an isotropic neo-Hookean material model [35].
Ψ = 1 D · J 1 2 + μ I 1 3 + k 1 2 k 2 i = 4 , 6 e x p k 2 κ I 1 3 + 1 3 κ I i 1 2 1 ,

2.1.3. FE Models

The FE models were created in the commercial software Abaqus [40], where the boundary conditions and loads were imposed. In the 3D idealized FE models, not only were the symmetrical conditions imposed, but also the contact with the heart was mimicked by avoiding displacement in a contour line on the outside of the adventitia [33]. The blood pressure imposed inside the artery was 115 mmHg, which is the average pressure in patients with high normal pressure and grade 1 hypertension [41]. On the other hand, the FE models of real IVUS geometries were 2D, so they were solved following the plain strain assumption and the rigid body motion was constrained by two contour points with zero displacements. Furthermore, the IVUS geometry was previously reconstructed from pressurized images (third column in Figure 3). Therefore, it was necessary to obtain the zero-pressure geometry to be used as the initial geometry. For this purpose, we assumed that IVUS images were taken with an internal blood pressure of 110 mmHg, and the zero-pressure geometry was recovered using the pull back algorithm defined by Raghavan et al. [42]. After applying the pull back method, the resulted geometry was extracted as the initial geometry (fourth column in Figure 3). Finally, it was possible to impose the pressure of 115 mmHg in the lumen and achieve the final pressurized geometry (fifth column in Figure 3). In all of the FE models (idealized and real IVUS geometries), the origin of the coordinate system was located in the center of the lumen in order to simulate the position of the IVUS catheter.
A sensitivity mesh analysis was performed to assure good precision and low computational cost. In the 3D idealized geometries, the maximum stenosis section, which was the most important part of the study, was meshed with small-sized elements. The fibrous cap between the lipid and the lumen had a smaller size depending on the thickness (e.g., 0.02 mm in the thickness of 65 microns that is on the order of IVUS technique precision). The rest of the 3D model had larger-sized elements, because of the lack of importance in the segmentation process. The element type selected for 3D was the hybrid quadratic tetrahedral elements with hybrid formulation to avoid numerical problems due to incompressibility (C3D10H), with at least three elements in the FCT in each case. In the 2D IVUS models, the element type was the plain strain hybrid three-node linear element (CPE3H) with additionaly, at least, three elements between the lumen and the lipid core.

2.1.4. Strain Variables
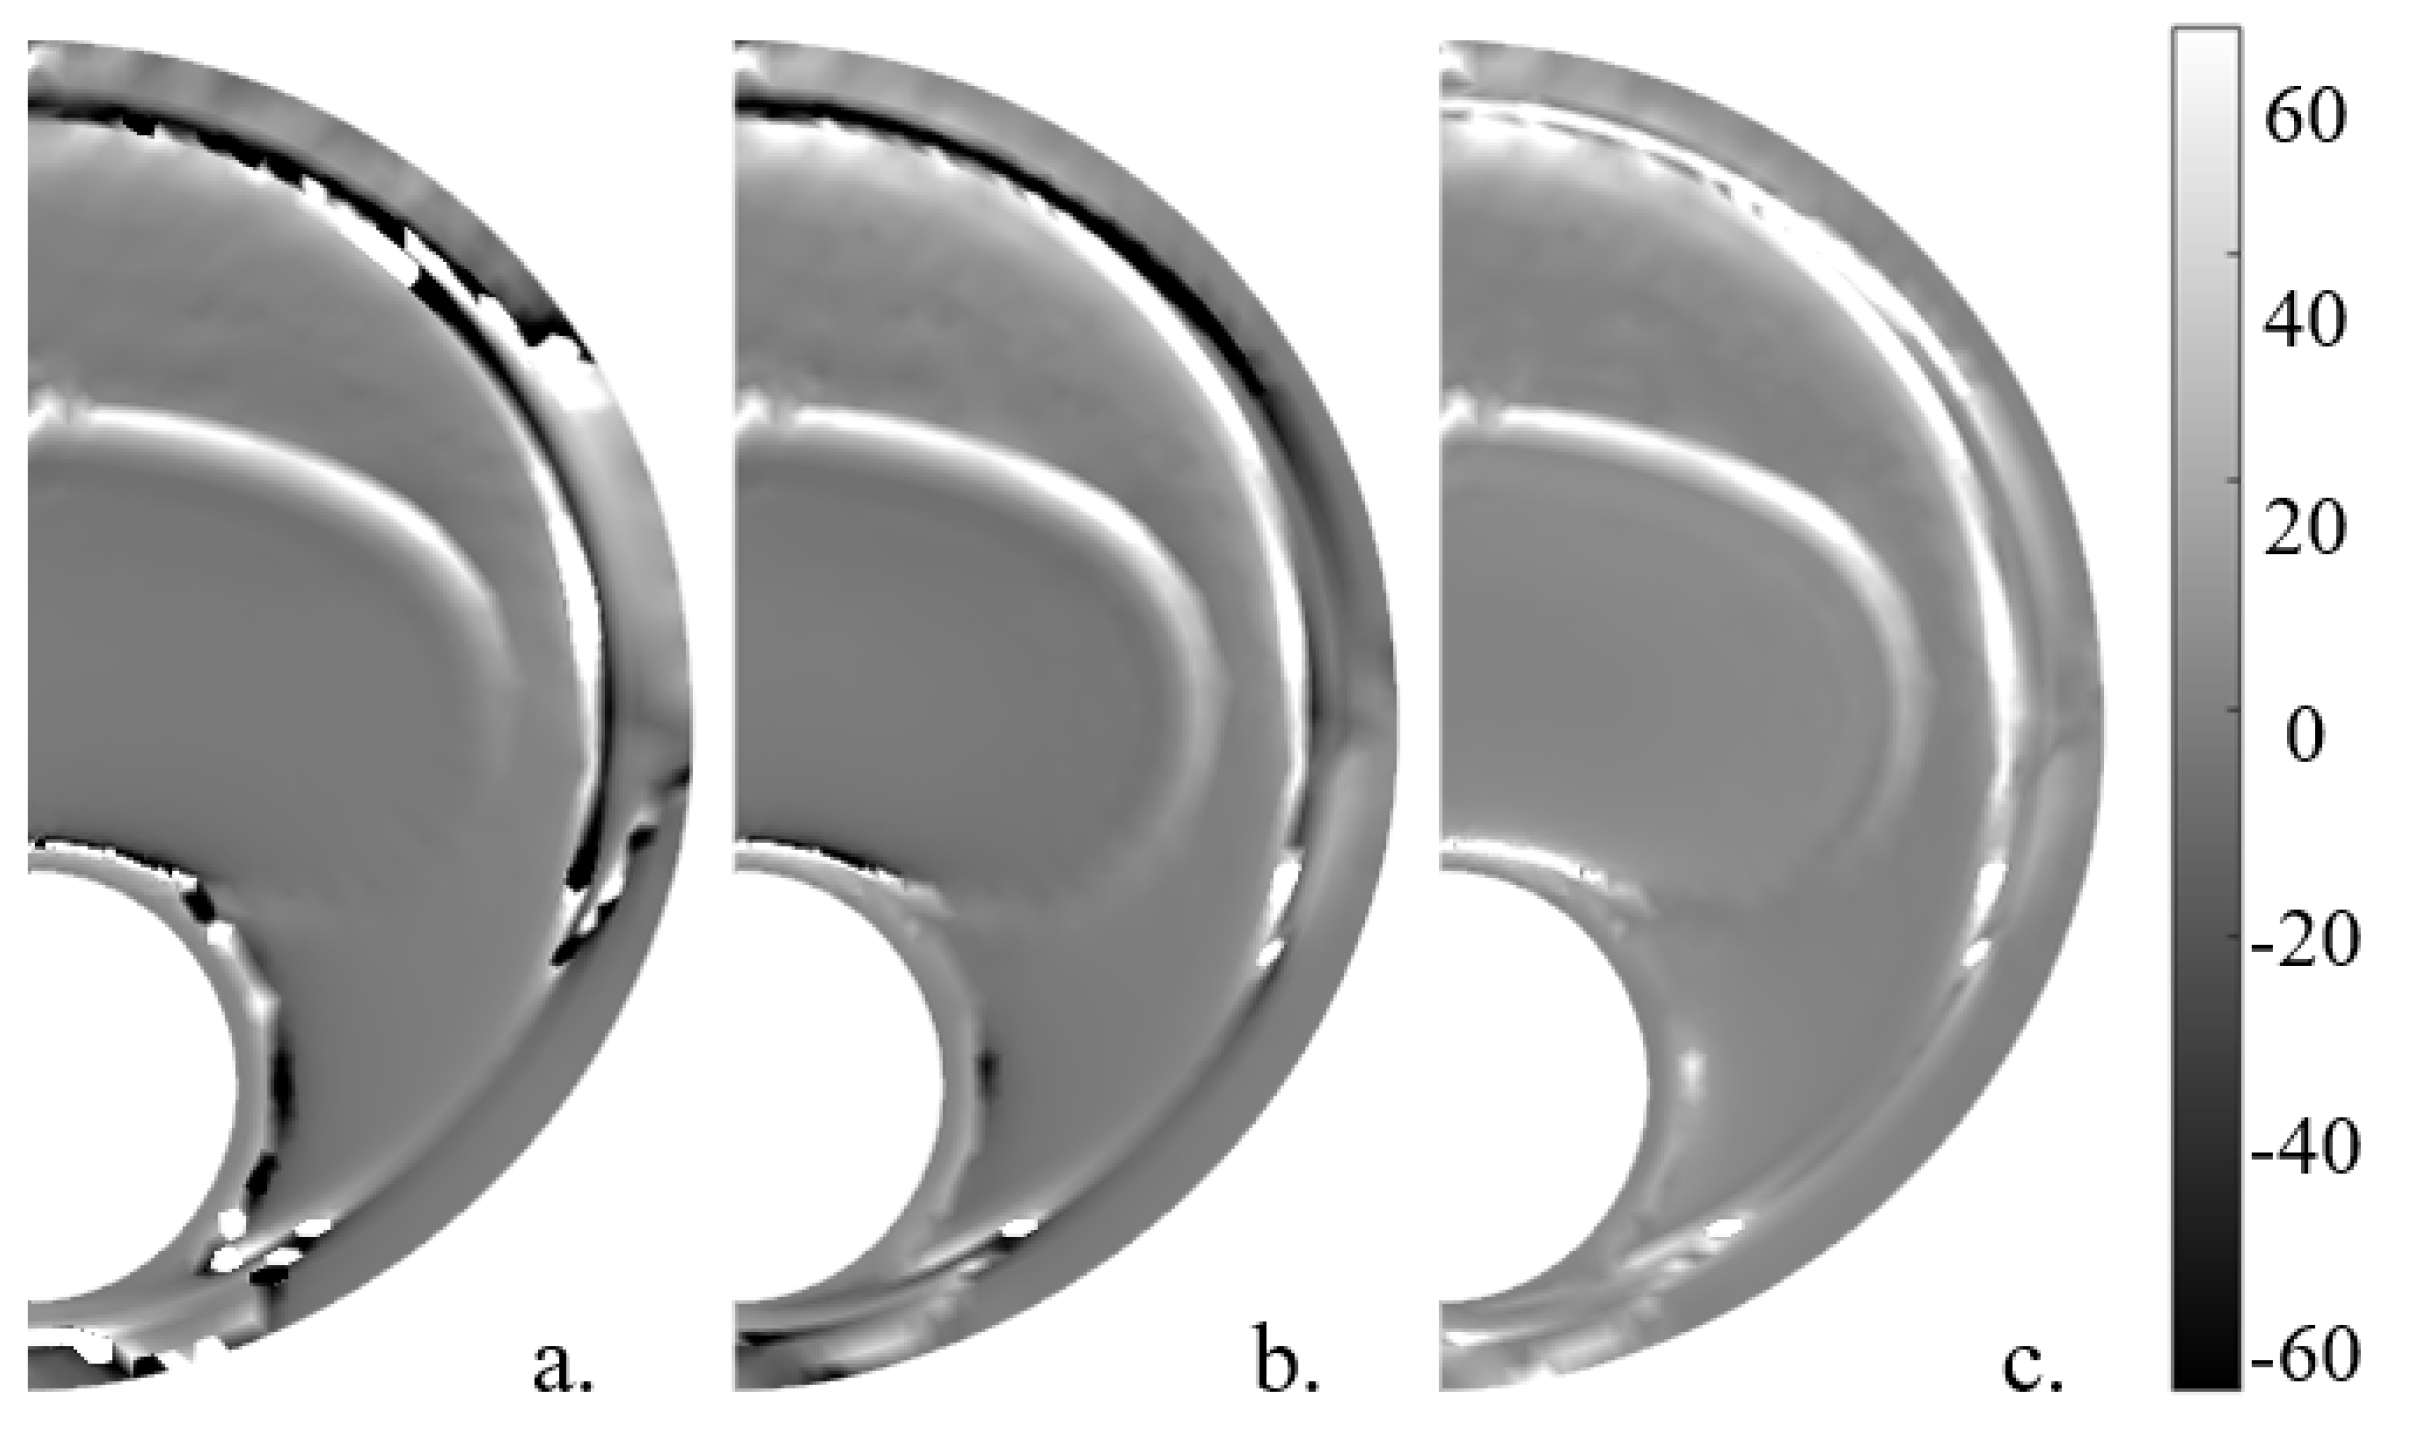
After simulating all of the FE models, the post-processing of the data was performed in Matlab 2021b [43]. The nodal coordinates (X and Y) and displacements ( u x and u y ) of the steps at 110 mmHg and 115 mmHg were collected. Then, the relative node displacements between both pressure steps were computed, as we can see in the example of Equation (2). This data processing attempted to simulate the data obtained by speckle estimators on two consecutive pictures taken by an IVUS in a 5 mmHg pressure increment [24,25,28,31]. Afterwards, the strains were calculated under the infinitesimal strain theory. Despite having the displacement field through the entire idealized 3D FE models, we analyzed the maximum stenosis section with the hypothesis of plane strain to obtain results that are closer to what happens in the IVUS. Different strain variables were computed: strains referring to Cartesian coordinates ( ε x x , ε y y and ε x y ); strains in cylindrical coordinates ( ε r r , ε θ θ and ε r θ ); principal strains ( ε m a x and ε m i n ), and equivalent strains of the von Mises, Tresca, and Anisotropic index (FA) [44], defined in Equation (3). Some variables, such as principal strains [45] or equivalent strains, do not depend on the coordinate system. Thus, their value will be the same regardless of the positions of the IVUS catheter.
u x = u x 115 m m H g u x 110 m m H g ,
F A = 3 2 · λ 1 λ 2 + λ 2 λ 2 + λ 3 λ 2 λ 1 2 + λ 2 2 + λ 3 2 , λ = λ 1 + λ 2 + λ 3 3 , λ i = ( ε m a x o r ε m e d o r ε m i n ) + 1 ,
Sumi et al. [46] developed a method to obtain a relationship between the vector gradient of the Young modulus and the strain tensor components for the plane stress approach. This criterion was adapted by Le Floc’h et al. [28] under the plane strain assumption, and they developed the elastic gradient of the material ( d W s i m p l i f i e d ) by neglecting the shear strains and computing only with the radial strains; Equation (4). This variable was selected due to the good results when marking the lipid core contour shown in different studies [28,29].
d W s i m p l i f i e d = 1 ε r r ε r r r + 2 ε r r r d r 1 ε r r ε r r θ d θ ,
In this work, the parameter d W was also calculated without any type of simplification, and it is developed in Equations (5)–(7). Furthermore, the absolute value of this parameter was computed for segmentation purposes, and it was represented as d W .
H r = 1 ε r r 2 + ε r θ 2 · ε r r · ε r r r + 1 r · ε r θ θ + 2 · ε r r r + ε r θ · ε r θ r 1 r · ε r θ + 2 · ε r θ r ,
H θ = 1 ε r r 2 + ε r θ 2 · ε r θ · ε r r r + 1 r · ε r θ θ + 2 · ε r r r ε r r · ε r θ r r 1 r · ε r r θ + 2 · ε r θ r ,
d W = H · d x = H r H θ · d r r · d θ ,

2.2. Adding Noise

The strain information was obtained from the FE models (clean strains). Nevertheless, the in vivo IVUS images have some noise and the speckle estimated strains will also contain that noise. Therefore, to reproduce more realistic strains we added white Gaussian noise to the different FE strain fields. We used an SNR of 20 dB in the FE strains [24]. However, the segmentation procedure was studied in all geometries with and without noise so as to analyze the robustness of the process.

2.3. Computing SGVs

Once all of the strain variables were obtained (with and without noise), the next step was to obtain the modulus of their gradient. For instance, ε r r represents the modulus of the gradient of the radial strains. These SGVs allowed to highlight the contours of the different tissues of the plaque. Each SGV marked different parts of the tissue contours; this is why the segmentation procedure could use one or two combined SGVs to extract the entire lipid contour. We computed the modulus of the gradient of all strain variables, except for d W . By definition, d W showed the contours of the areas with different stiffness. The use of this single variable marked the tissue contours. At the end, there were 14 single SGVs and 91 possible combinations of two SGVs.

2.4. Segmentation Process

The methodology was based on the representation of two combined SGVs or a single SGV and image segmentation algorithms. The W-GVF processes were imposed on the SGVs representation to extract the lipid core. The watershed process used the contour and the grayscale representation to treat a set of pixels as a topography separating the lipid core. The W-GVF algorithm allowed to segment different tissues as the lipid core or the calcifications. In this work, only the results of the lipid core are presented due to their relevance to FCT measurements and plaque vulnerability. After the segmentation, the lipid was smoothed in order to reduce the sharp areas of the segmentation. The method was tested in all geometries (three idealized and three real geometries) with all of the 105 SGVs. A sensitivity analysis of different relevant variables in the segmentation process was performed. For this analysis only the idealized geometry with 150 μ m of FCT was considered. These variables were related to the plaque morphology or related to the IVUS technology:
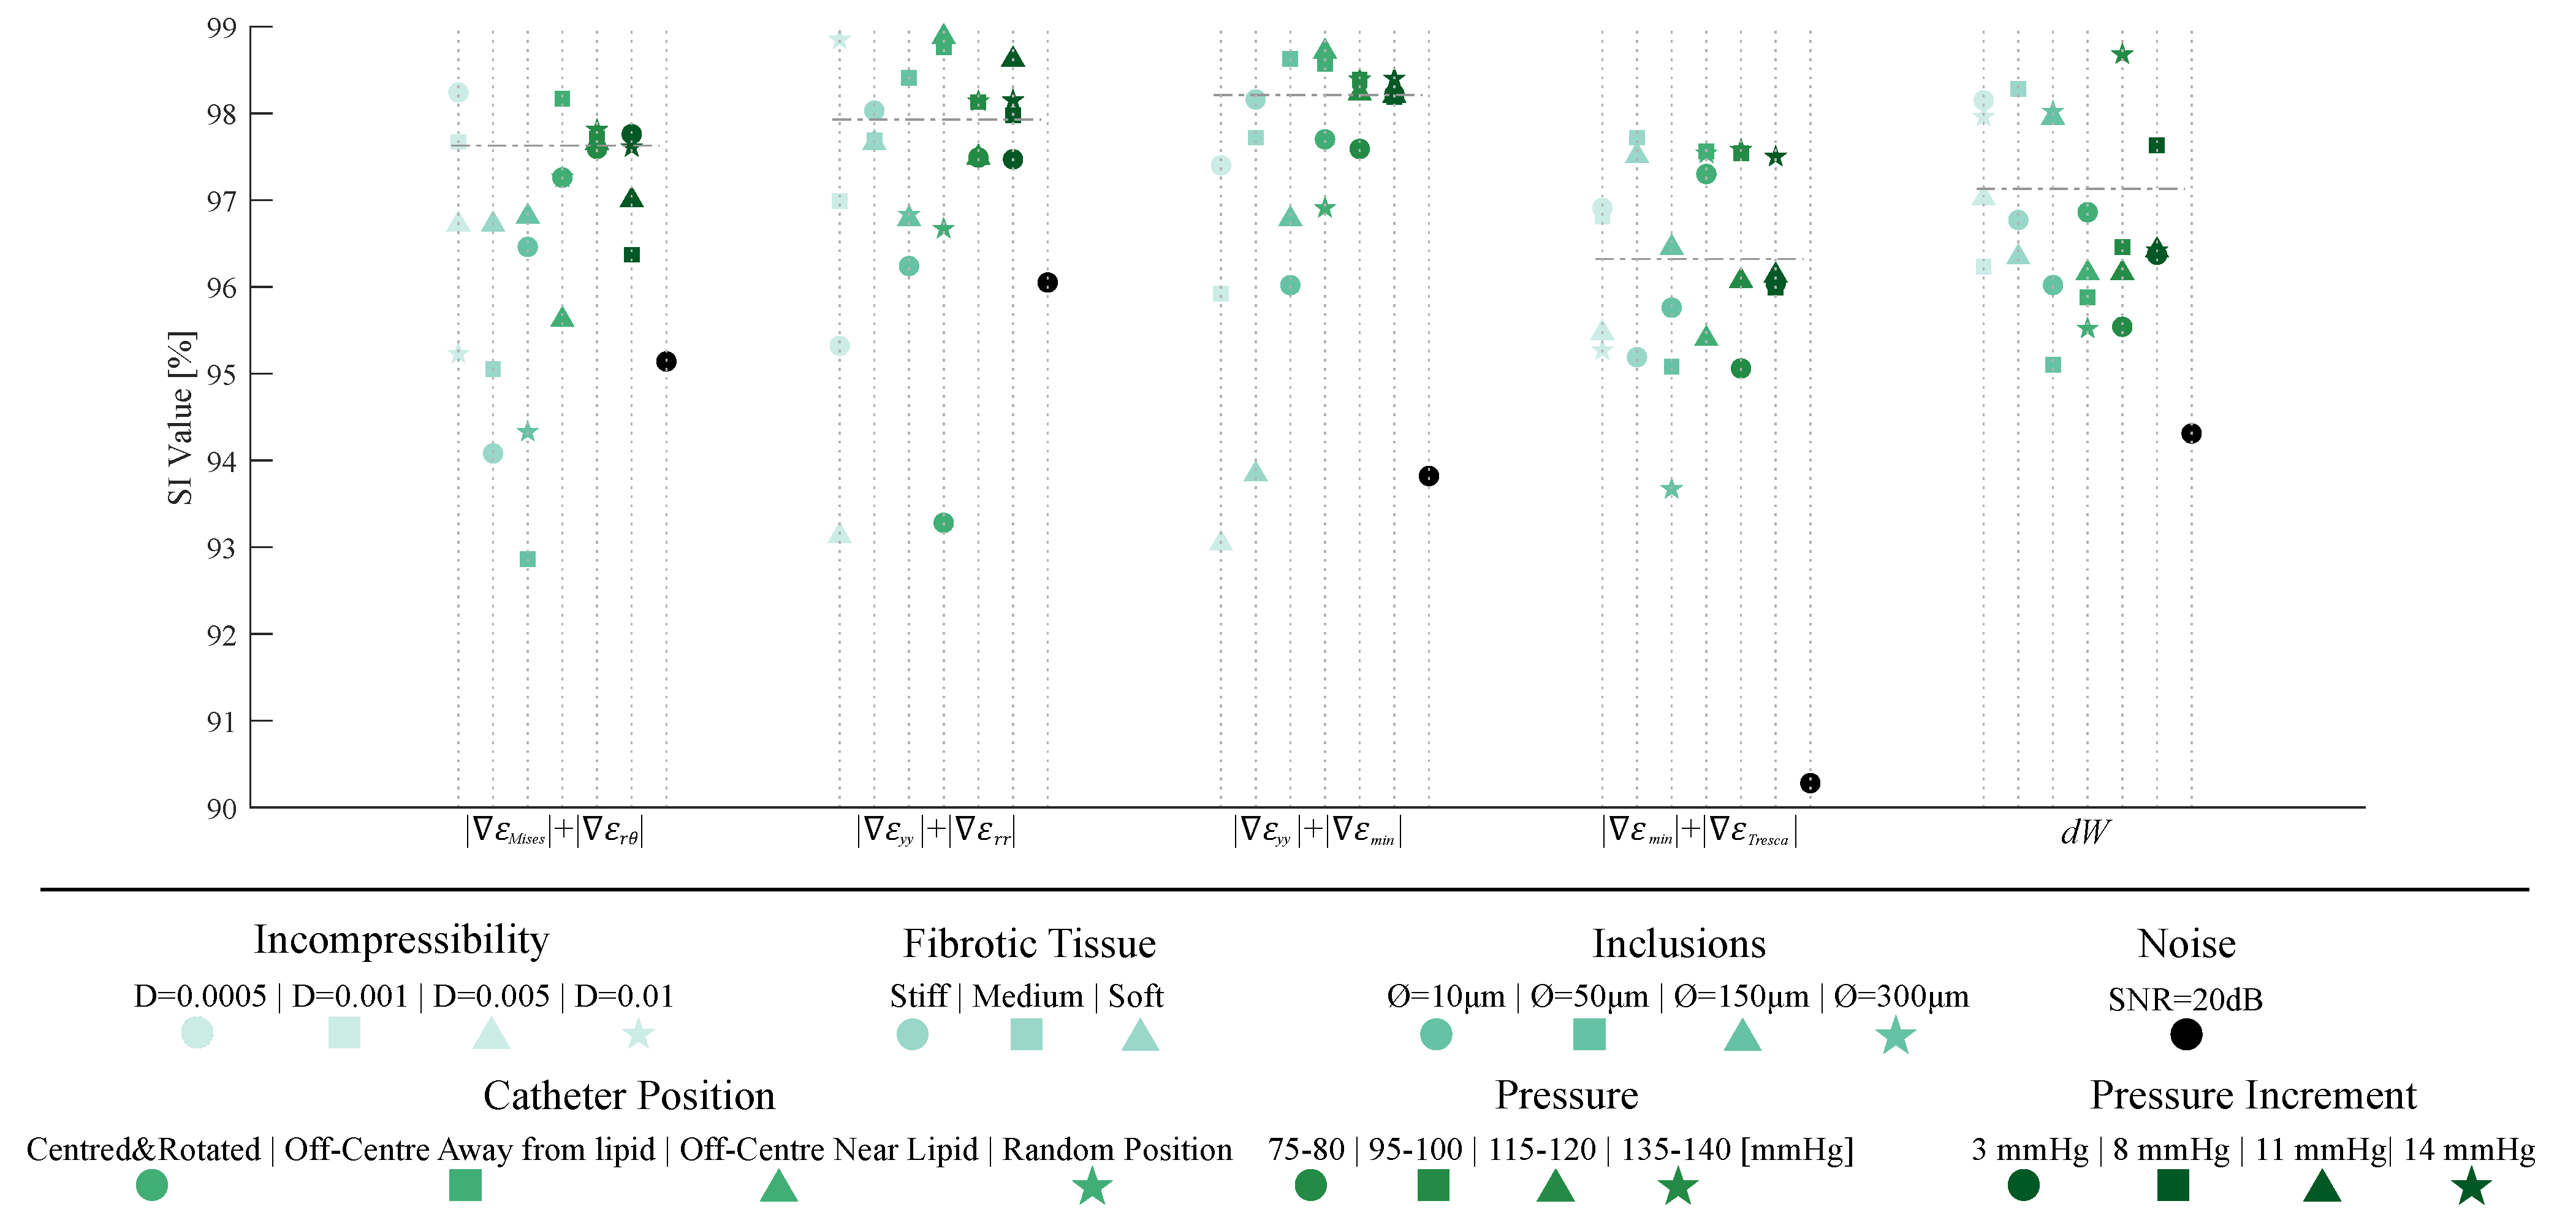
  • Plaque-related variables: We analyzed the influence of considering the fibrotic tissue as fully incompressible or with different degrees of quasi-incompressibility. We have also considered four different fibrotic tissues (default, stiff, medium, and soft tissues). Furthermore, some inclusions were added to the FE model, mimicking the presence of micro calcifications. These inclusions were simplified as spheres with calcification properties presented in Table 1, and four diameters were studied (10, 50, 150, and 300 μ m).
  • IVUS-related variables: The influence of the catheter position was studied by changing the origin and orientation of the coordinate system in the FE models. It was also important to check if the segmentation methodology was affected by the blood pressure. In addition, the pressure increment between both steps was also studied.
Although the methodology was mainly focused on the lipid core segmentation, different areas were segmented as well. Lumen was segmented using the W-GVF technique in each geometry in order to measure the FCT. Large calcifications, such as the one in the third real IVUS geometry, were segmented by using the same segmentation process. On the other hand, fibrotic tissue could be easily segmented as the difference of the whole plaque minus the segmented lipid and lumen. Finally, adventitia and media could be segmented with the W-GVF technique; however, this segmentation has no clinical application due to the fact that IVUS images provide little information on the outermost tissues.

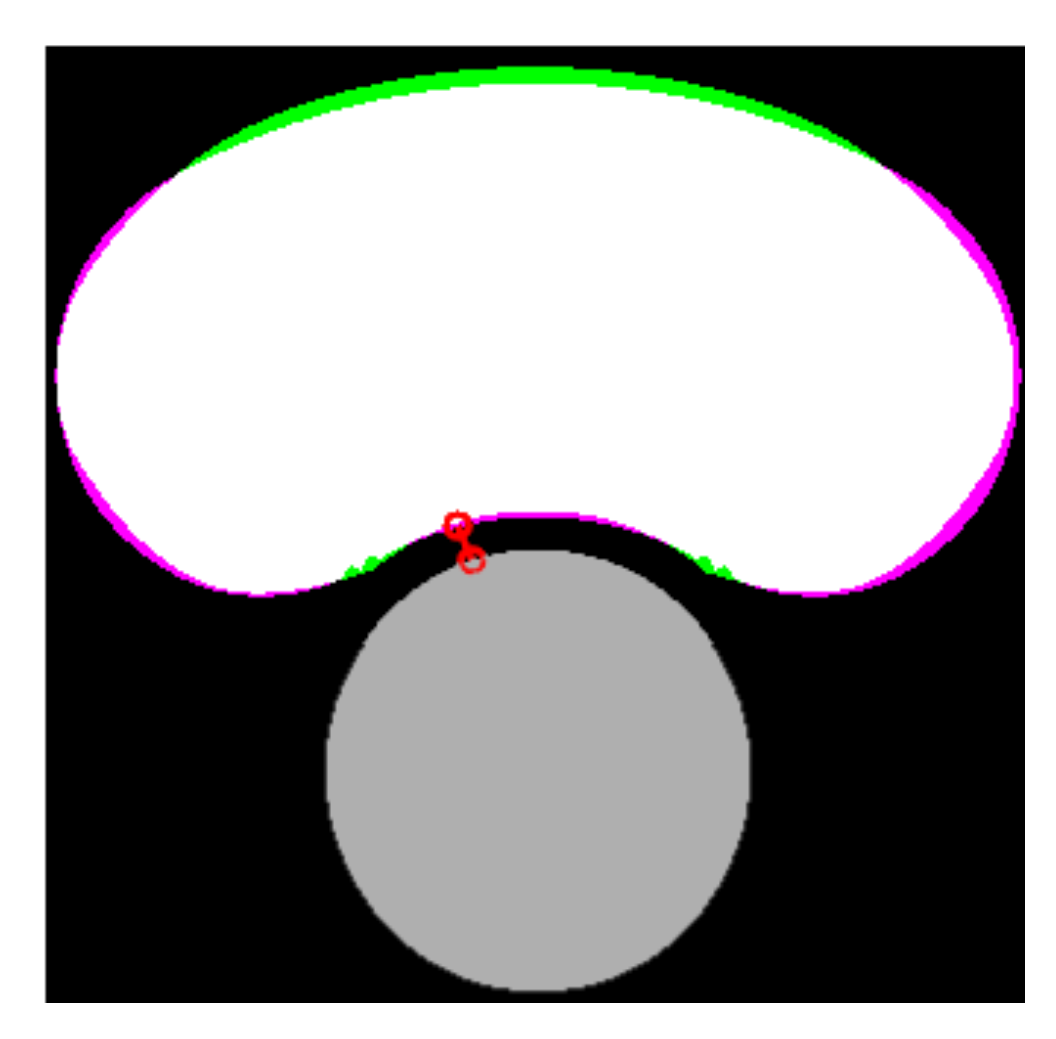
2.5. Geometrical Measures

After the lipid and the lumen were segmented, it was possible to assess the FCT as the minimum distance between them. The area of the lipid core was also computed. Both measurements are closely related to the risk of plaque rupture [5]. The indices I 1 , I 2 , and I 3 were defined in order to quantify the accuracy of the segmentation for each SGV or combination of two SGVs. The first index ( I 1 ) in Equation (8) is the relative error between the real and the measured FCT ( t r e a l and t m e a s u r e ). The second index ( I 2 ) in Equation (9) defines the percentage of the lipid area that was correctly segmented (true positive area). This index could be represented as the white area in Figure 4. The third index ( I 3 ) in Equation (10) corresponds to the extra lipid area that was segmented (false positive area). It could be represented as the green area in Figure 4. The second and third indices were defined to quantify not only the lipid area value, but also the correct segmentation of its shape. In order to quantify the segmentation using only one index, we defined the Segmentation Index (SI) as a linear combination of the previous indices. The final SI parameter was defined in Equation (11) and its value was directly related to the performance of the segmentation. SGV combinations with an S I 90 % provided measurements of the lipid area and the fibrous cap thickness with high precision. An SI between 90–85% meant that the segmentation had trouble with one measure, normally the fibrous cap thickness. SI values in the range of 85–75% indicated a poor lipid segmentation. Finally, values of S I 75 % were for those SGVs with a high measurement error or those that could not segment the lipid.
I 1 = t m e a s u r e t r e a l t r e a l · 100 ,
I 2 = A r e a R e a l S e g m e n t e d A r e a R e a l · 100 ,
I 3 = A r e a F a l s e S e g m e n t e d A r e a R e a l · 100 ,
S I = 100 I 1 + I 2 + 100 I 3 3 ,

3. Results

This section presents the results of the lipid segmentation. It is divided into the results in idealized geometries, results in real IVUS geometries, and an analysis of the best SGVs after considering all of the geometries.The results were analyzed with the FE strains and the strains with 20 dB of SNR.

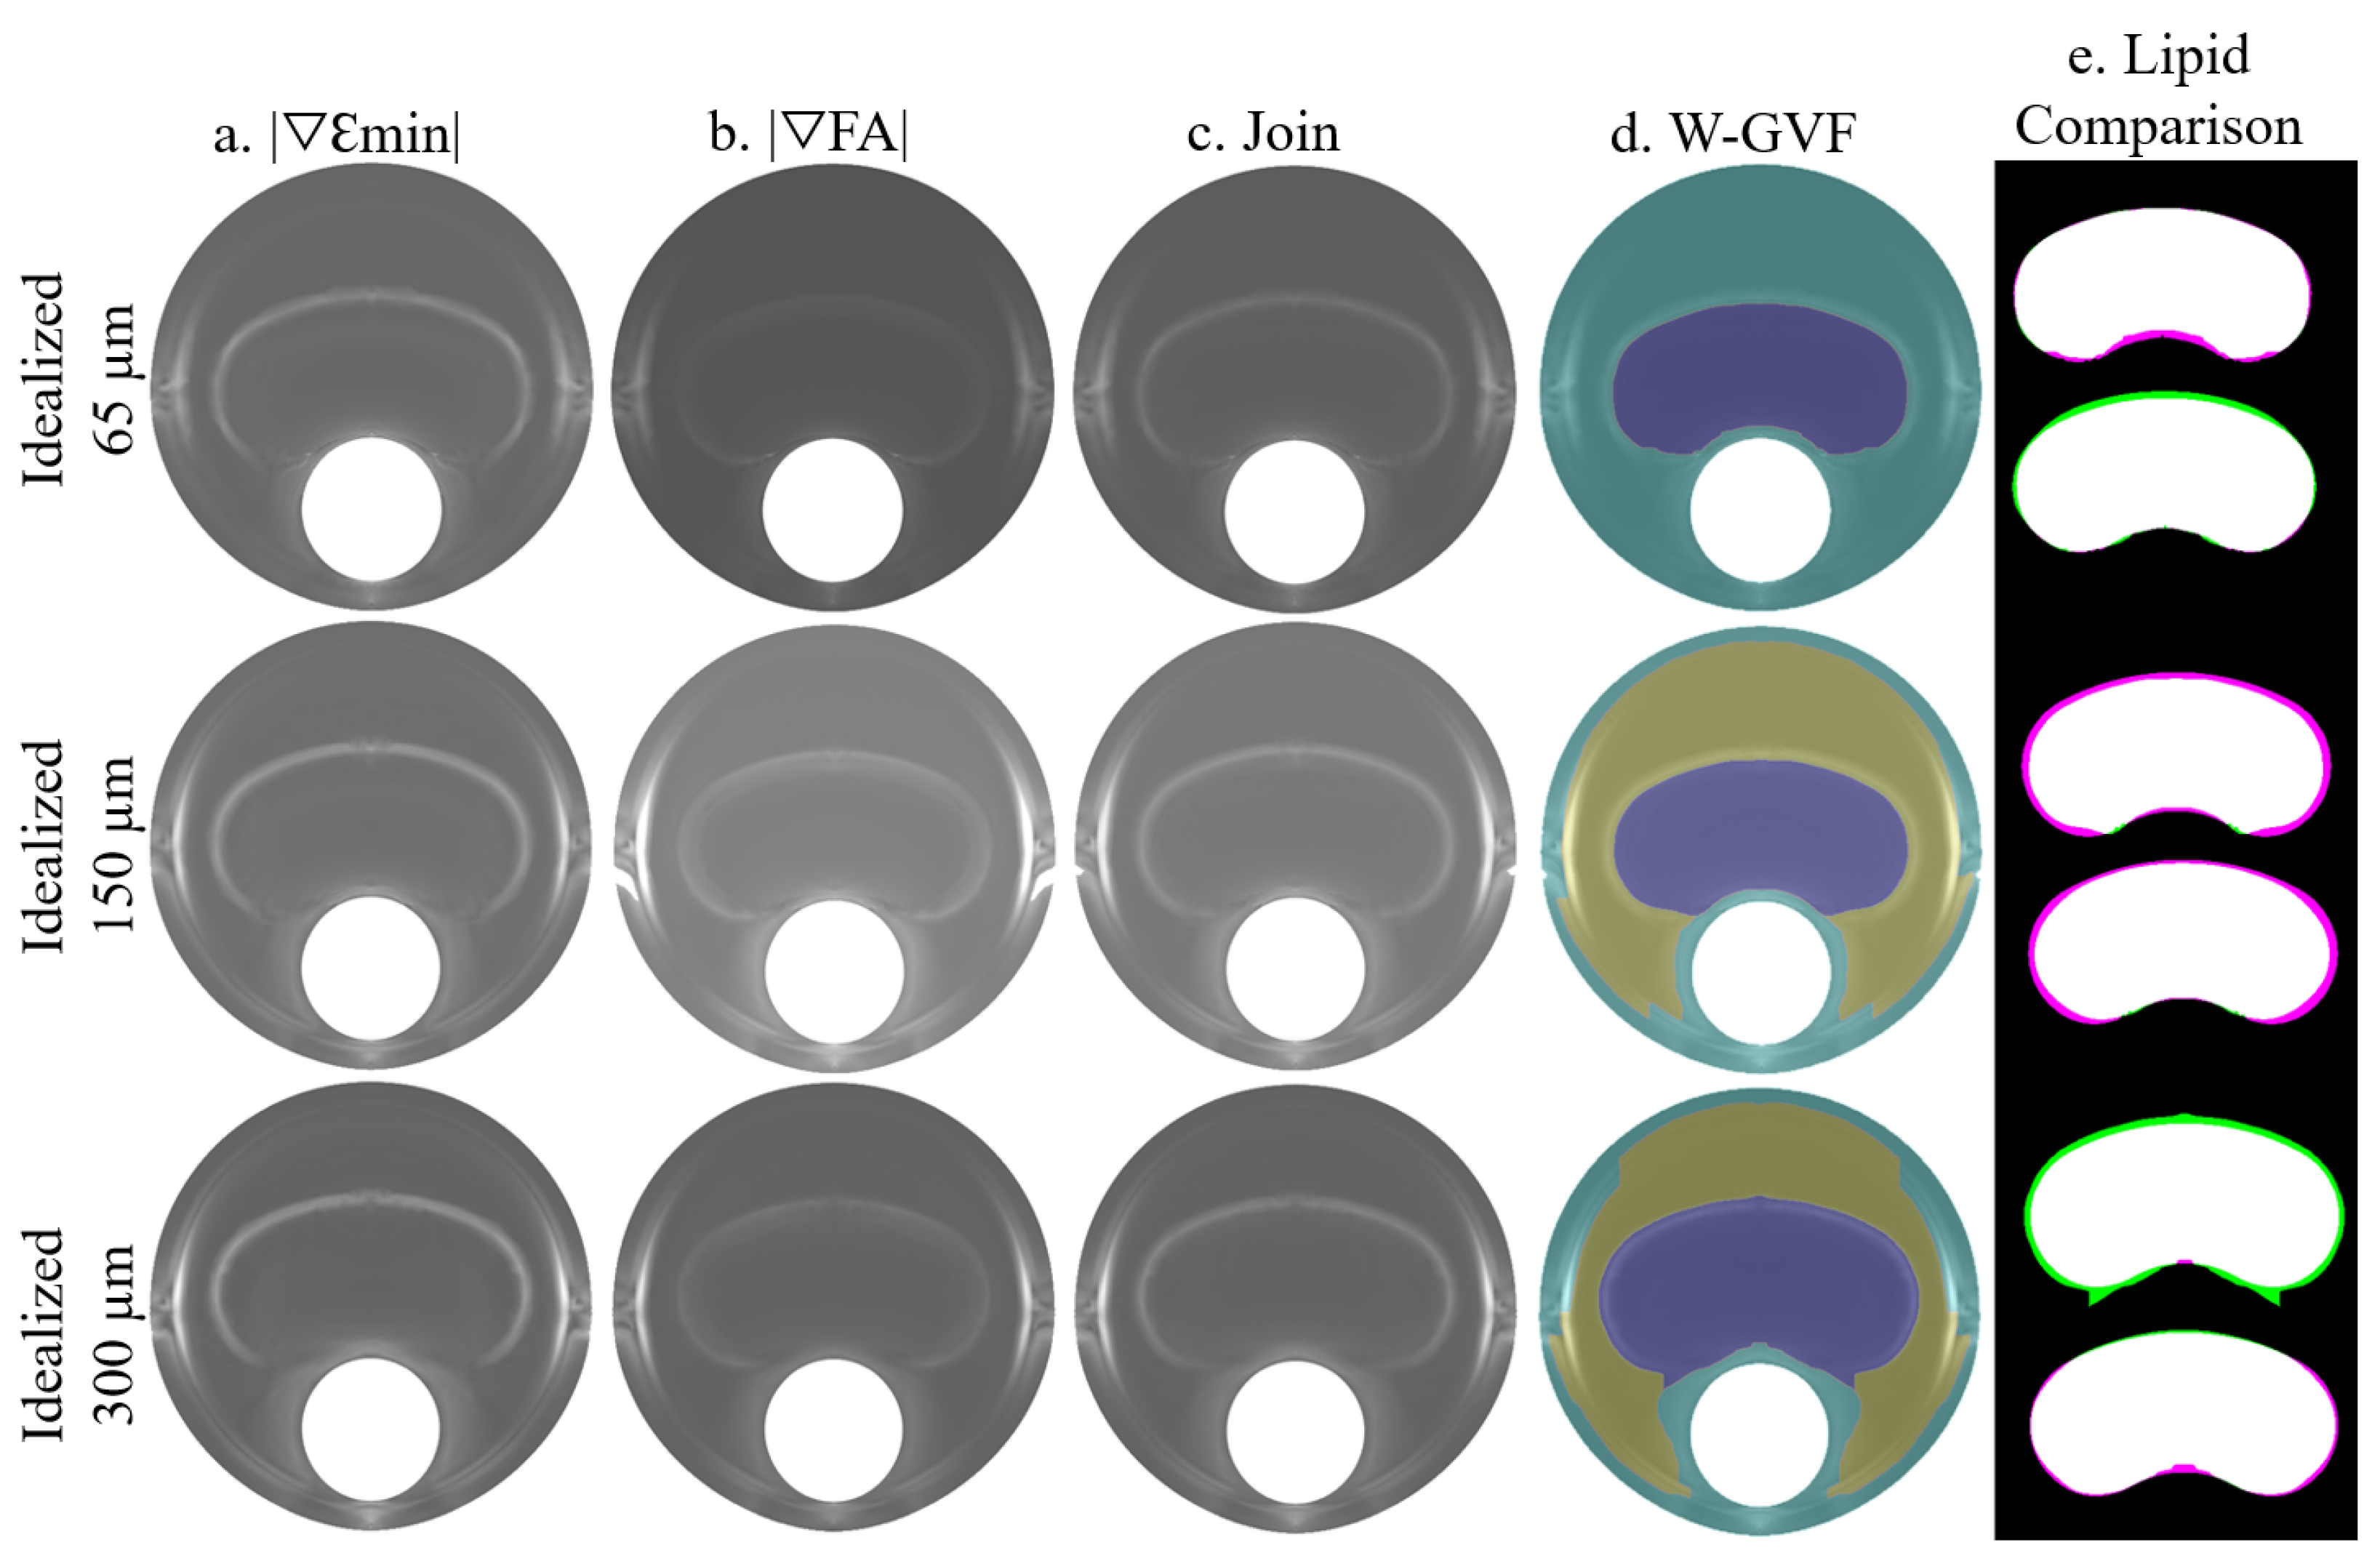
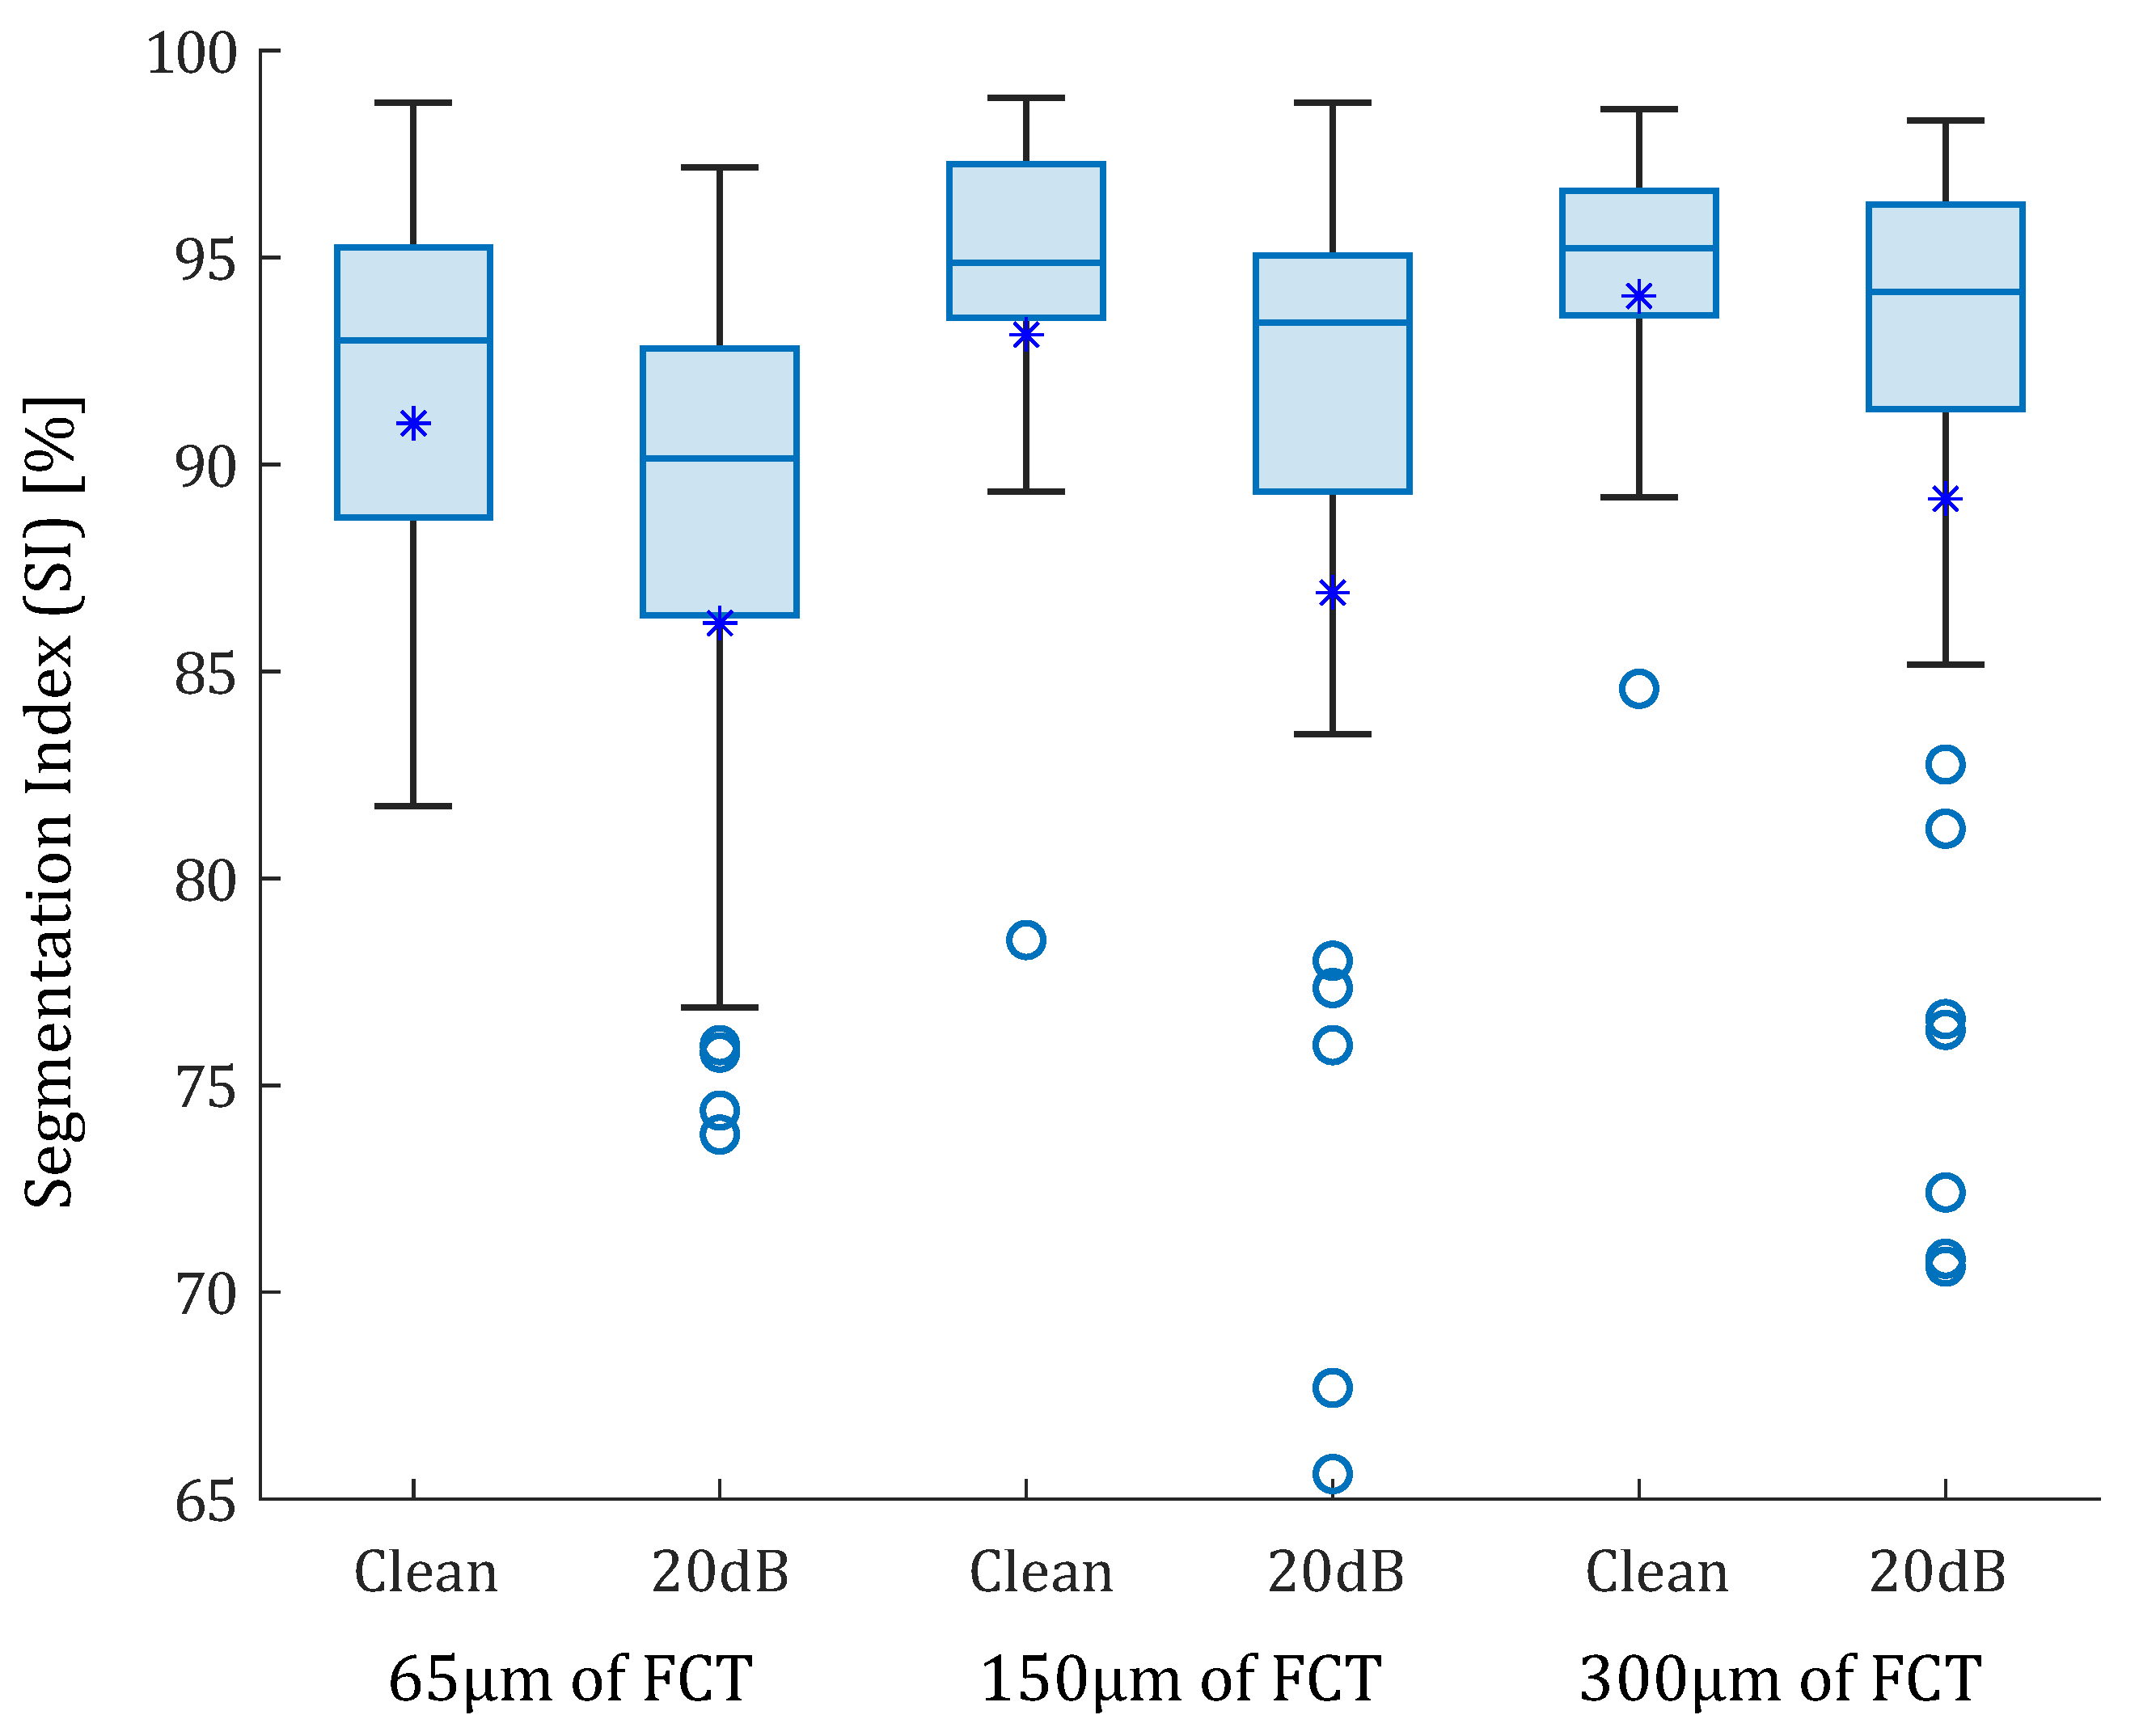
3.1. Idealized Geometries

The process is summarized in Figure 5, where the idealized geometries with 65, 150, and 300 μ m of fibrous cap thickness are represented. A combination of the SGVs ε m i n and F A was chosen due to its high segmentation performance. Both SGV variables are shown in each idealized geometry in Figure 5a,b, respectively. The combination of both is represented in Figure 5c and it was used as an input for the W-GVF process. The final result is shown in Figure 5d, where every segmented part has a different color. The segmented lipid core is represented before and after the smooth treatment in Figure 5e, and it is shown as an overlap between the actual and segmented lipid core. In this representation, the white area displays the well-segmented area, the purple one is the actual lipid that is not segmented, and inversely, the green area is the extra area wrongly segmented by the procedure.
In the idealized geometries, the lipid area was similar in all scenarios, so the number of successful SGV combinations depended only on the fibrous cap thickness. The box-plot in Figure 6 represents the SI distribution of the 105 SGV combinations in each geometry. The geometries were segmented using the FE strains (clean strains) and the strains with 20 dB of noise. By analyzing only the influence of the FCT, the results show that the mean (represented by an asterisk) and the median of the SI value increased with the FCT. In addition, the interquartile range decreased with greater thicknesses. This fact can be observed in Figure 6 for the segmentation with or without noise. On the other hand, the noise addition led to an increase of the outliers and the interquartile range. The mean and median decreased after considering the noise. Despite having different SI results in each geometry, there were some combinations of SGVs with proper results for all thicknesses. This was the case of ε y y + ε θ θ , ε v M i s e s + ε r θ , F A + ε θ θ or ε m a x + ε r r . It was also possible to yield good results with only one variable such as ε y y , F A , d W , ε T r e s c a and ε x y . However, there were variables with low SI values for all cases, such as d W s i m p l i f i e d , ε r θ , so they were discarded.

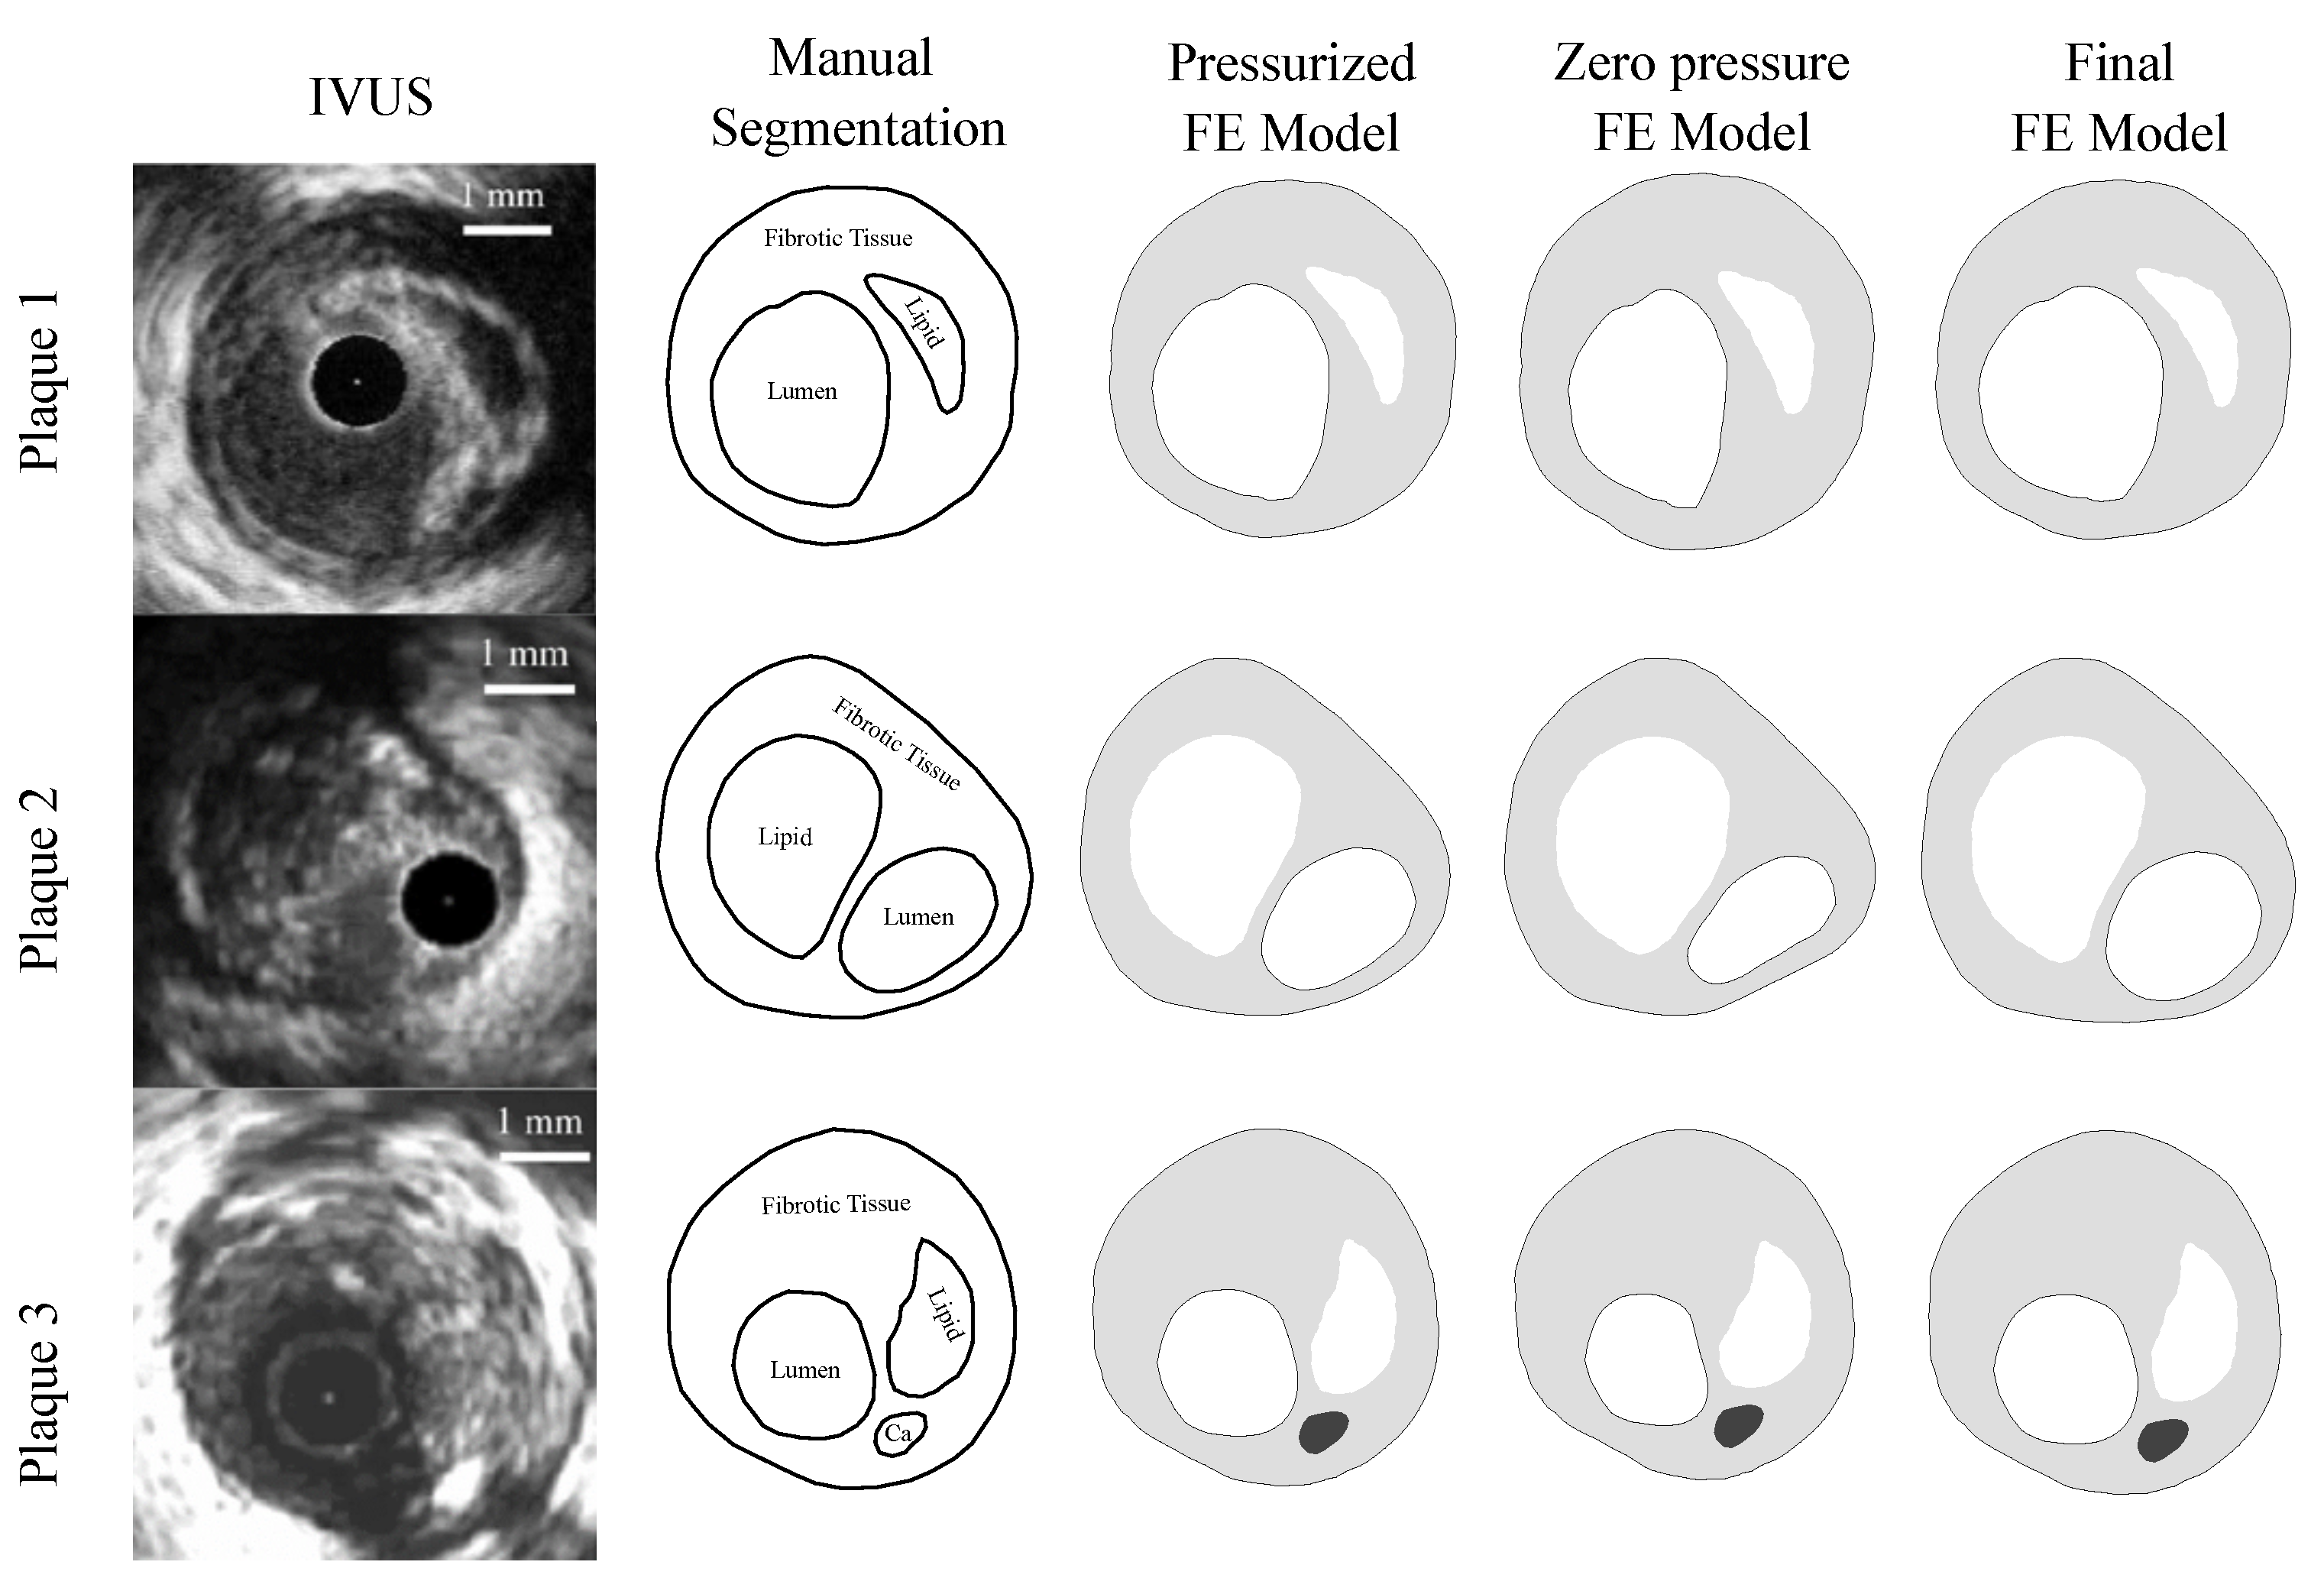
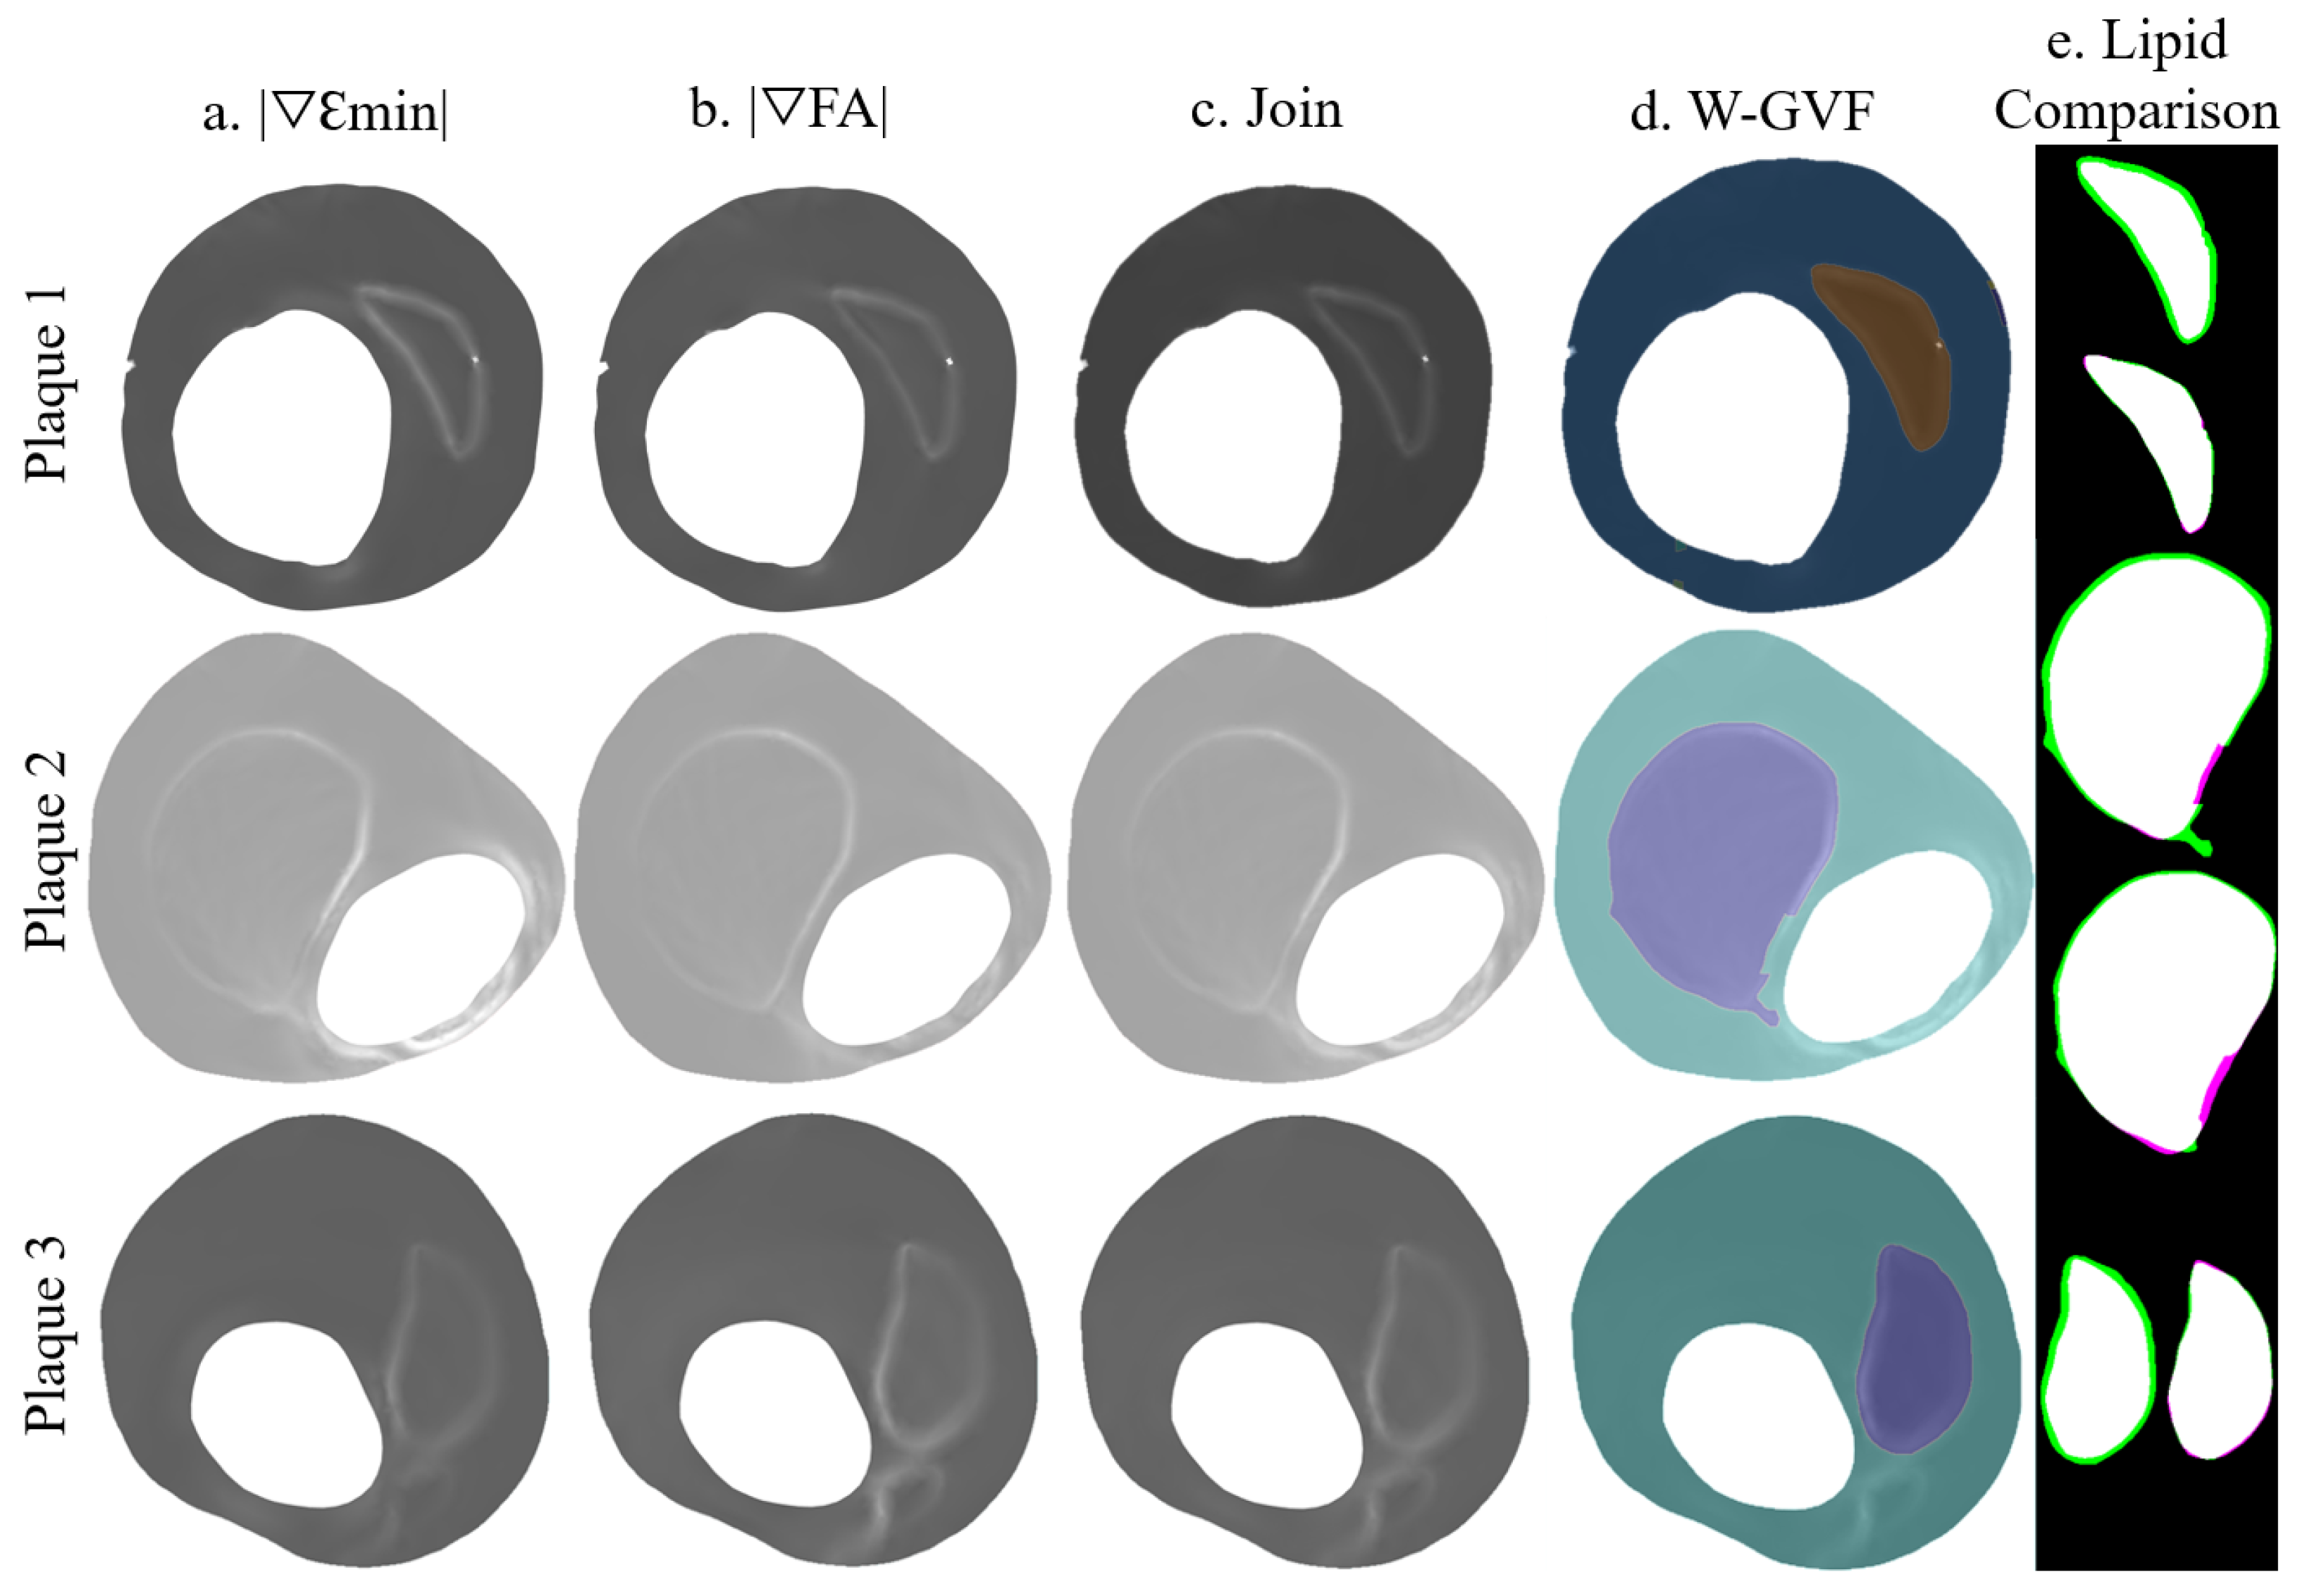
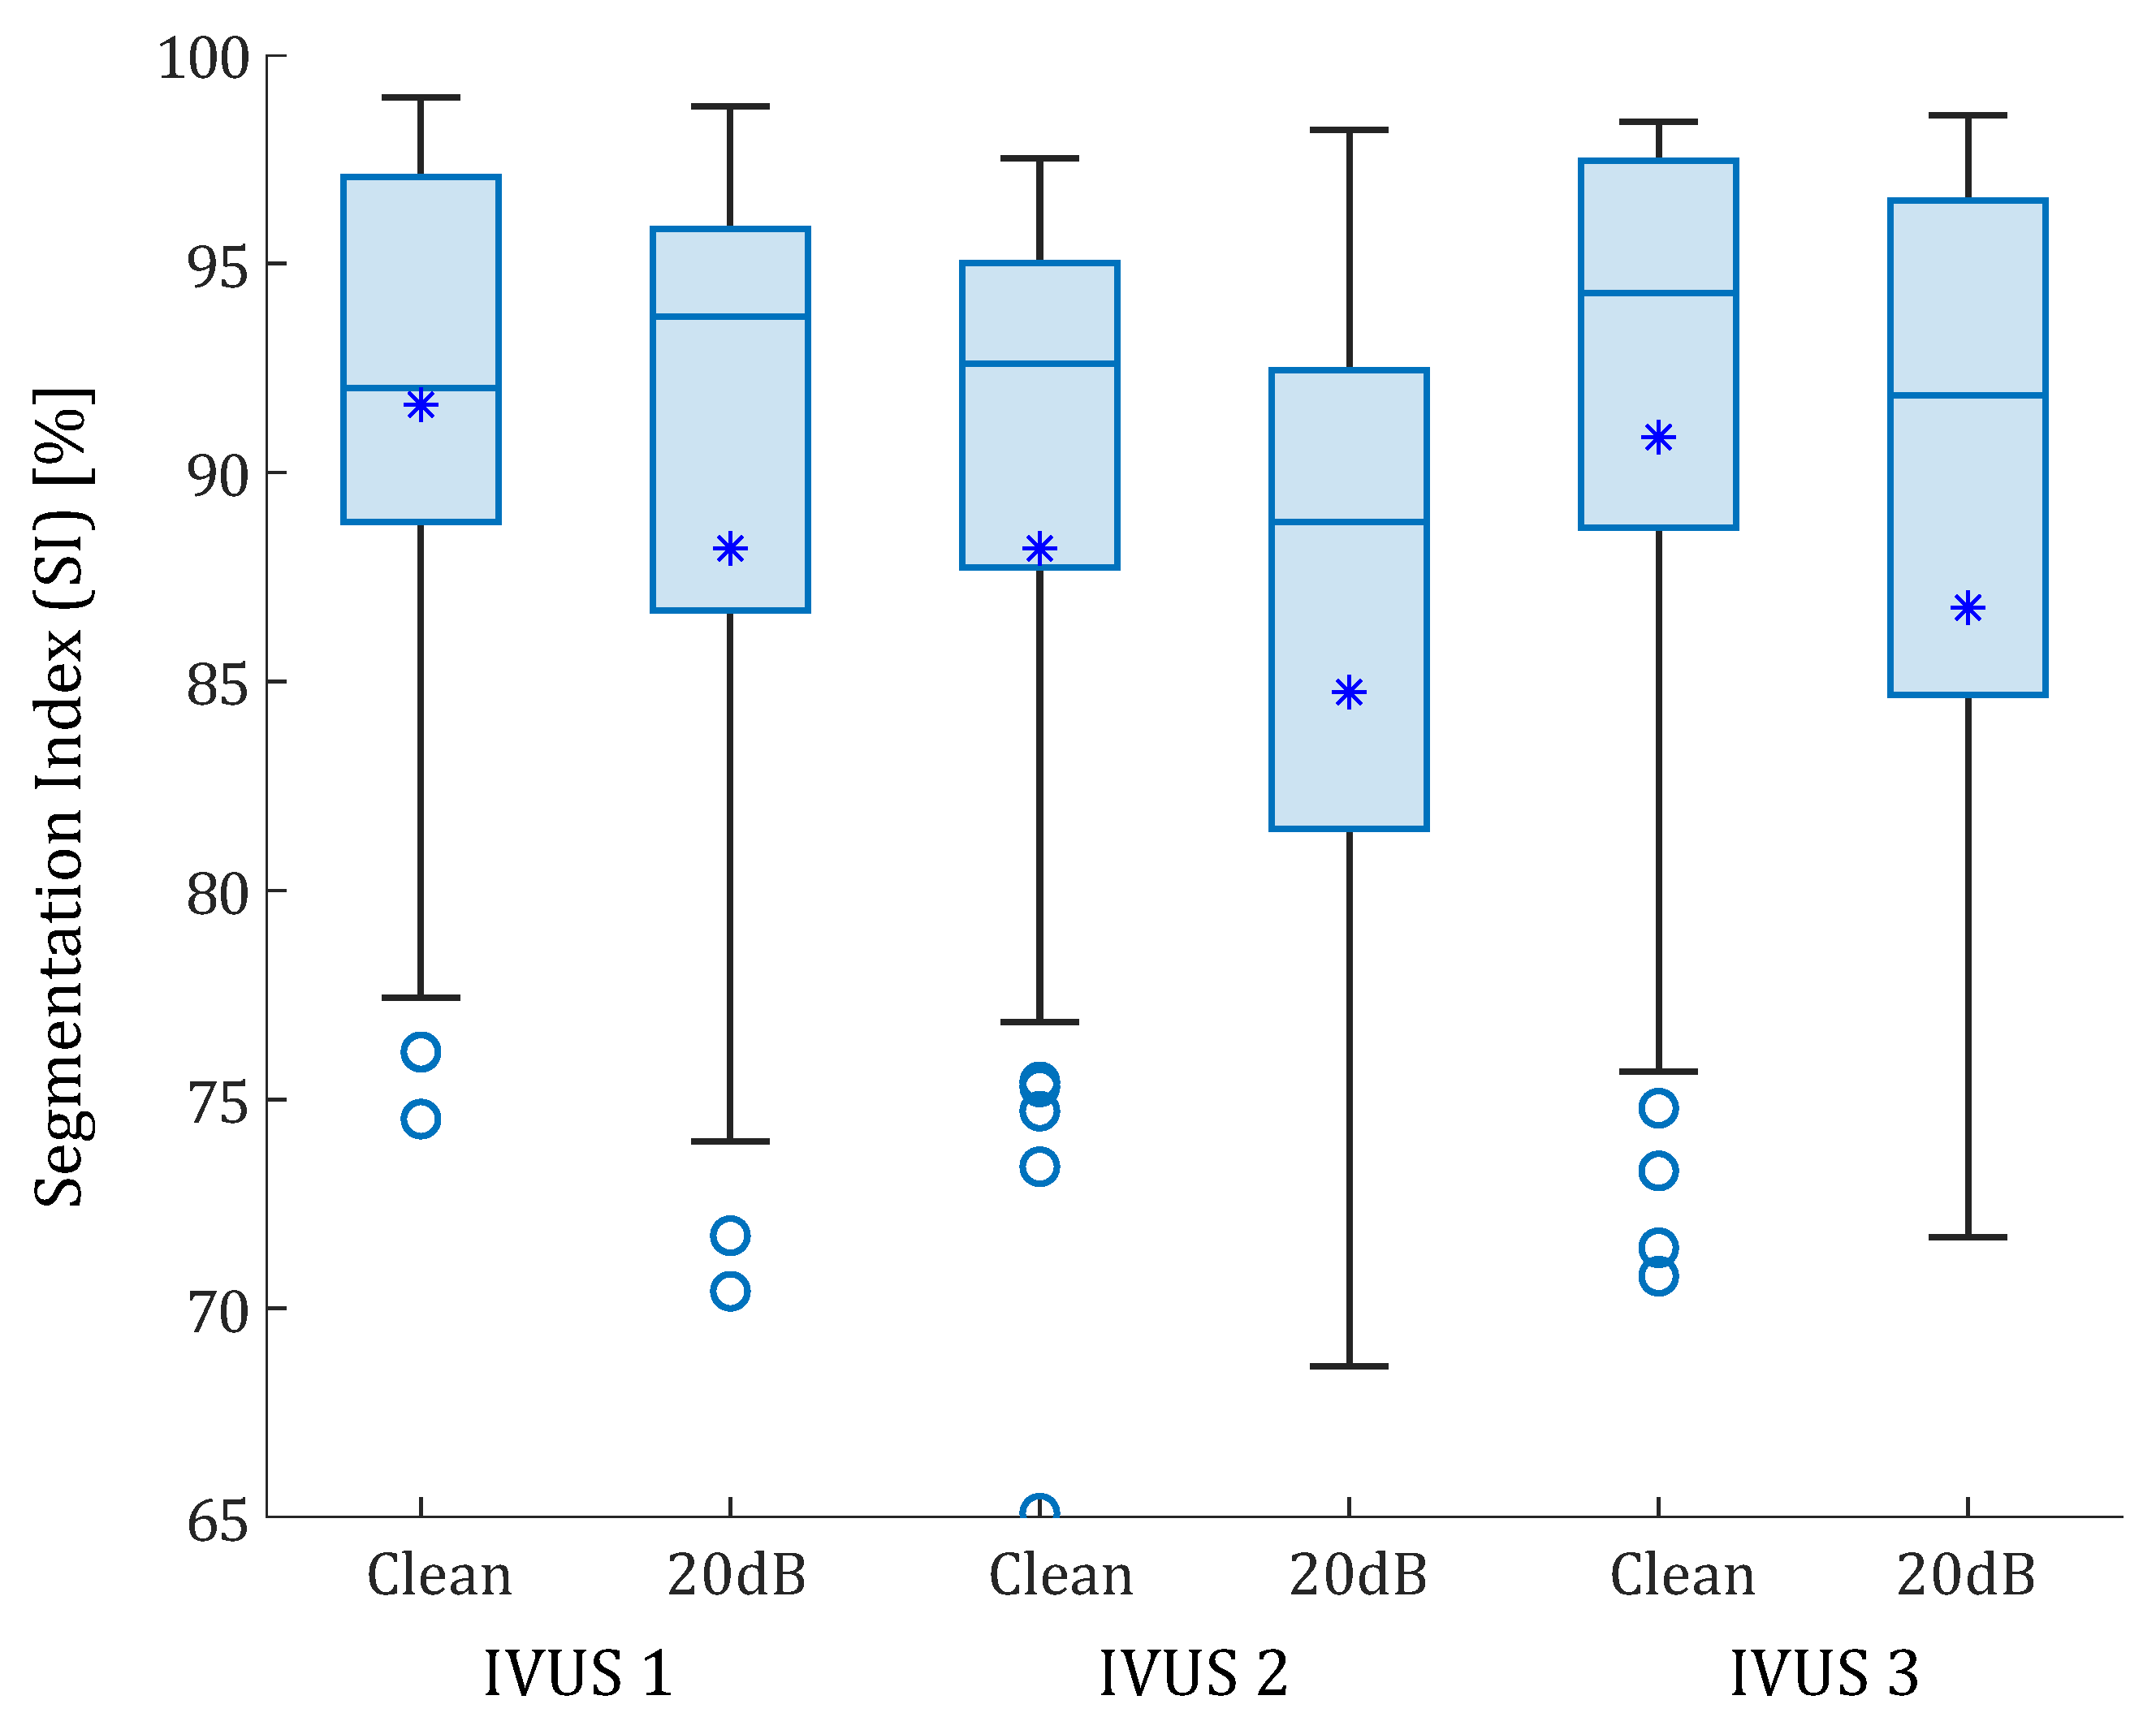
3.2. Real IVUS Geometries

The proposed methodology was tested with the three real IVUS plaque geometries. The lipid cores had different shapes, areas (1.65, 5.53, and 1.93 mm 2 ), and FCTs (330, 175, and 209 μ m). Figure 7 is an example of lipid segmentation with the SGV combination of the invariants ε m i n and F A for the case of clean strains. The performance of the segmentation is represented in the box-plot shown in Figure 8, where the segmentation was not only affected by the FCT, but also by the lipid core area. In all cases, the noise addition increased the interquartile range and decreased the mean and the median (except in the first plaque, where the median increased after the 20 dB). A single SGV such as ε m i n , d W , ε r r , d W , ε T r e s c a or combinations such as ε y y + ε r r , ε y y + ε m i n , or ε m i n + ε M i s e s still had promising results for these geometries. As what happened in the idealized cases, the SGV ε r θ did not show any adequate SI for any plaque.

3.3. SGV Candidates

Finally, the mean SI value ( S I ¯ ) was computed by considering all of the geometries together. All of the SGVs from FE strains, alone or in combination with others, were analyzed, and the best five single SGVs and fifteen SGV combinations were collected in Table 2. This table shows the SGVs or SGV combinations with better performance in the segmentation process, allowing to have good accuracy not only in the area, but also in the FCT. The mean SI value of those combinations with 20 dB of noise was included ( S I n o i s e ¯ ) to visualize the noise influence. Single SGVs, such as d W or ε r r , presented good segmentation results. Furthermore, ε v M i s e s or ε m i n had good performance as well, and in these cases they had the advantage of being invariants, so they will be not affected by the catheter position or coordinate system. However, the invariants have the disadvantage of needing the entire strain tensor. On the other hand, there were a great number of SGV combinations with high segmentation accuracy regardless of the analyzed case, such as ε v M i s e s + ε r θ , or ε y y + ε r r . Additionally, combination of invariants appeared to have good results, such as ε m i n + ε T r e s c a . Table 2 shows that SGV combinations achieved higher SI values than single SGVs.
The elastic gradient of the material ( d W ) was calculated in a simplified way, following Le Floc’h et al. [29] and with the whole 2D strain tensor. In order to have the lipid contour marked and to achieve a better combination with other SGVs, the absolute value d W was computed. These variables are shown in Figure 9. The variable d W S i m p l i f i e d had a mean SI value of 32.13% in the six geometries without noise and 28.48% with noise, whereas d W without simplifications achieved a mean SI value of 94.70% without noise and 90.62% with 20 dB of noise and d W 94.63% and 86.04% without and with noise, respectively.

3.4. Sensitivity Analysis

Once the SGV candidates were analyzed, we selected the best four SGV combinations and the best single SGV of Table 2 to evaluate the robustness of the proposed segmentation methodology. For this purpose, we studied the influence of plaque and IVUS variables in the segmentation results only within the idealized geometry with 150 μ m of FCT. Figure 10 shows all of the results of the sensitivity study. Each SGV had seven variables to analyze (incompressibility, different material behavior of fibrotic tissues, addition of inclusions, different catheter positions, total pressures and pressure increments, and noise addition), and all are color-coded in Figure 10. The SI values obtained with the FE strains were taken as a reference. In this reference case, the model was analyzed as fully incompressible, with a stiffer tissue, the catheter placed in the center of the lumen, with a pressure analysis of 110–115 mmHg and without noise. The SI values achieved with that model are represented in Figure 10 with a horizontal dotted line.

4. Discussion

The clinical detection and segmentation of the atherosclerotic plaque is still a challenging step for an early diagnosis. Machine learning techniques are mainly focused either on the segmentation of the lumen and outer contours [21] or on the detection of calcifications [16,17] or vulnerable FCT [15]. However, it is difficult to find a quantitative study of FCT or the lipid area. Other techniques based on IVUS allow to estimate the 2D strain field in the arterial wall [27,30]. From the strain map, with iterative optimization tools, it is possible to estimate the mechanical properties and the segmentation of the plaque [28,29,31]. However, these cases had high computational cost and depended on the inclusions evaluated. The most difficult issue was to obtain an accurate segmentation of the plaque that could provide good estimations of the FCT. In this paper, we have presented the theoretical basis to segment the tissues of the atherosclerotic plaque from the representation of different strain variables without any iteration or the need for a large database to train the methodology. The segmentation procedure was based on the Watershed and Gradient Vector Flow algorithms that extract the tissues. In this article, we focused on the lipid core segmentation due to its role in plaque vulnerability [5]. The accuracy of the results depends on the represented SGVs. This approach allowed us to obtain measurements of the lipid area and FCT and it achieved promising results with many different SGV combinations. The methodology was developed and validated with computational models designed from idealized and real IVUS geometries. The aim was to check if the strain map method was able to segment the lipid and also to know which are the best SGVs to achieve it. Furthermore, the process was performed with different morphological and IVUS technical variations to prove the versatility of the proposed method.

4.1. Segmentation Analysis

4.1.1. Idealized Geometries

Using idealized geometries, the results show that as the FCT was smaller, there were less SGVs available to obtain a proper segmentation. The box-plot of Figure 6 shows that the variability of SI values decreases with larger thicknesses, while the segmentation performance increases. The explanation is that the amount of data available on the fibrous cap is lower and the SGVs in low thicknesses; it marked the lipid contour close to the lumen and it was more difficult for the segmentation process to track the lipid. Therefore, the measure of the FCT presents higher errors. Consequently, the precision of the IVUS technology will delimit the amount of strain information in the fibrous cap and thus the segmentation performance. After analyzing the 105 possible SGV combinations in each geometry with clean FE strains, the median SI value was always above 93% in all cases. That highlights the strong segmentation capacity of the proposed methodology. Previous studies also showed a decrease in the FCT segmentation at lower thicknesses, increasing the relative error of the segmented FCT [28,31]. However, this proposed methodology opened the possibility of using a large number of SGVs for segmentation. Some combinations of SGV, such as d W , ε v M i s e s + ε r θ or ε y y + ε r r , had errors close to zero and with negligible variation between thicknesses. After adding a 20 dB SNR to the FE strains, the SGVs were not as smooth as in the previous cases; however, the median SI of each group decreased by most 3%, but all of them were above 90%. Hence, the segmentation method proved that there were large amounts of SGVs that allowed to extract the lipid core regardless of the FCT or the noise addition. Furthermore, the areas of the lumen and the complete plaque were automatically segmented with the proposed method. This provided results similar to those obtained with machine learning [21,22] but without the need to train a neural network.

4.1.2. IVUS Geometries

The IVUS geometries allowed testing the segmentation procedure on real human atherosclerotic coronary plaque geometries with distinct lipid core areas and FCT. The results showed that the W-GVF process relied not only on the fibrous cap thickness, but also on the lipid area and stenosis degree, showing a strong dependency on the real IVUS plaques. The segmentation performance varied greatly in each geometry due to their differences. In all cases the median of the SI value was above 88% (with or without noise). The noise addition slightly reduced the segmentation except for the first IVUS plaque, where noisy strains improved the median SI value by 1.87%. The noise addition also increases the variability of the performance. The third IVUS plaque had a calcification that was segmented using the W-GVF technique with a relative error smaller than a 5%. Nevertheless, the study showed that the segmentation procedure was able to track lipids with different areas and morphologies. Since these geometries were analyzed in other studies [28,32], it was possible to compare the segmentation results with those of previous studies. Previous work reached a relative FCT error of between 1.4 and 15.5% depending on the geometry [28]. Other methodologies obtained a mean error above 16% by measuring the FCT on other real geometries [31,47]. In this work, the FCT measure depended on the chosen SGV. For the SGVs analyzed in Table 2, the mean relative error was 3.11% in the IVUS geometries.

4.2. SGV Candidates

Different studies rate the segmentation performance with a qualitative index, such as thin vs. stable FCT [11,15,18], or by detecting the calcified plaques [16,17]. Those studies that used quantitative values only considered the error of the segmented FCT and lipid area [28,31,47]. Our SI included values to consider the relative error of the FCT, the value of the segmented lipid and its shape, which facilitates the comparison of segmentations between geometries. Studies that used a strain variable for segmenting only used a single strain variable (commonly the modified Sumi’s transformation ( d W S i m p l i f i e d ) [28,46,47] or von Mises strains [31]). On the contrary, this methodology made it possible to use 105 different strain variables (single SGVs or combinations of SGVs).
The combination of idealized and real IVUS results showed that the segmentation results depended mainly on the FCT and the lipid core area. Nevertheless, there were some variables with a high SI by itself regardless of the geometry case. That was the case of SGVs such as d W , ε m i n or ε r r , which obtained an overall SI value of more than 90% with or without noise. By the combination of different SGV, some variables with low accuracy increased the results. That was the case of ε r θ , which had a mean SI value of 67.24% and in combination with ε v M i s e s was the best pair, achieving a mean SI of 97.1% (95.22% with noise). SGV combinations reached higher precision than single SGVs. Some examples were ε y y + ε r r or ε m i n + ε T r e s c a with SI mean values of 96.88–95.68% and 96.69–93.67%, respectively (with clean strains–with 20 dB of SNR, repsectively). All of the SGV combinations presented in Table 2 allowed for a very precise segmentation of the lipid in all scenarios with different SGV options.
On the other hand, after analyzing the elastic gradient of the material ( d W ), all d W SGVs had a similar representation; however, the d W s i m p l i f i e d proposed by Le Floc’h et al. [28] had more trouble marking the shoulder of the lipid core and obtained worse segmentation results than d W and d W . The variable d W marked the whole lipid contour, and alone proved to be the best SGV for the lipid segmentation. Its absolute value, d W , was computed in order to obtain better results in combination with the others SGVs; however, it showed similar SI values to d W and it was the second-best single SGV option.

4.3. Sensitivity analysis

The best single SGVs and SGV combinations were analyzed in a sensitivity analysis to study the influence of different variables (plaque- and IVUS-related variables). We concluded that the incompressibility of the materials did not affect the segmentation performance in the five selected SGVs. By changing the material behavior of the fibrotic tissue, the SI values remained above 92%, except in one case for d W . This parameter was related to the different stiffness between tissues, and it would fail if the lipid and fibrotic tissue had similar stiffness. The addition of inclusions could affect the lipid segmentation if they were placed close to the lipid contour. Nonetheless, the methodology appeared to obtain similar results. Principal strains are widely used because of their non-dependence on the coordinate system [45]; however, the catheter position seemed to have no influence on the process, since the worst SI value obtained was 93.23%. Finally, the pressure and pressure increments did not affect the method due to the fact that the tool is based on gradients of the strains, and they had a similar representation regardless of the modification of pressures. Overall, the results suggest that the proposed methodology had no dependency on the analyzed cases, showing a strong robustness.

4.4. Relevance for Clinical Applications

The new developed technology is an intuitive segmentation tool that could provide morphological information on the atherosclerotic plaque. It could help to reduce segmentation human errors and it could assist clinicians with a new accurate diagnosis support. From IVUS images and the use of a strain estimator, we can use the representation of different moduli of the gradient of variables to detect the lipid or inclusions contours in a fast way. After that, with the W-GVF segmentation procedure it is possible to extract the lipid core or other tissues and take measurements, which are directly involved with plaque vulnerability. The results show that the performance of certain SGV combinations depended on plaque morphology; however, the SGV combination between ε m i n and ε v M i s e s presented good segmentation performances for the lipid core, regardless of the plaque geometry. Additionally, other combinations showed in Table 2 appear to be accurate enough for good clinical diagnosis. Single SGVs such as ε r r or d W provided accurate segmentations. In addition, ε r r is the strain variable that can be extracted from IVUS with the highest accuracy, so it will be one of the main candidates for clinical application.
The highlights of this work are presented in the following list in order to summarize the results of the research.
  • A segmentation process based on strain representation was presented to extract the different tissues of an atherosclerotic plaque. This methodology achieved high accuracy in measuring FCT and the lipid core area. These measurements play a key role in the vulnerability of the plaque.
  • Unlike other segmentation processes, this method does not require a database to be trained or an optimization process, as it relies on image processing rather than machine learning or analysis of the mechanical properties of the tissues. In addition, it could be performed with many different strain variables instead of a single one [27,28,31,47]. Thus, there are different possibilities to obtain the segmentation using only one variable or combining different SGVs.
  • The results show that the performance of the segmentation was linked to the plaque geometry and the selected SGVs. However, there were some SGVs with good results regardless of the geometry. The method also showed good robustness in sensitivity analysis, providing accurate results with different catheter positions, pressures, and noise addition.

4.5. Limitations

This study has two main limitations that have to be mentioned:
  • Since this work was a theoretical framework, the methodology was only tested with computational models of in silico data. Therefore, the next step would be to prove the segmentation methodology with in vitro and in vivo IVUS data from patients with coronary atherosclerotic plaques. After analyzing the methodology with noise, which simulates the intrinsic noise of IVUS data, the results for segmentation are expected to be valid on real IVUS data.
  • In the finite element analysis we only have considered the load of the blood pressure. We have disregarded the residual stress and the influence of heart motion. As the methodology is based on gradients and not on absolute strain/stress values, we could expect a minimum influence of the residual stress on this segmentation methodology.

5. Conclusions

In this paper we have proposed a new method to segment the atheroma plaque based on strain measurements with low computational and time costs. This work is a theoretical framework and has been developed and tested with FE models with idealized and real IVUS geometries. The representation of the SGVs opens the possibility of segmenting the lipid core with different strain variables. This representation is used in the W-GVF segmentation to extract the tissues and measure the FCT and lipid area for the clinical diagnosis. We made an extensive study of the strain variables used for the W-GVF segmentation and selected only those who detect the lipid core and other tissues. The method had good results in all scenarios, showing an SI value higher than 94% (with noise). There are strain variables such as ε v M i s e s in combination with ε r θ or ε y y + ε r r that achieved accurate results regardless of the geometry, morphological changes, or noise addition. Furthermore, single SGVs such as d W or ε m i n could provide the lipid segmentation. Although the methodology has to be tested with in vivo data, it has promising preliminary results.

Author Contributions

Conceptualization of the study: J.O. and E.P. Investigation and methodology: Á.T.L. Supervision: M.A.M., M.C. and E.P. Writing: Á.T.L. Review and editing: Á.T.L., M.C., M.A.M., J.O. and E.P. Funding acquisition, M.A.M. and E.P. All authors have read and agreed to the published version of the manuscript.

Funding

This work was supported by the Spanish Ministry of Science and Technology through research project PID2019-107517RB-I00, the regional Government of Aragón support for the funding of the research project T24-20R, and grant CUS/581/2020. CIBER Actions are financed by the Instituto de Salud Carlos III with assistance from the European Regional Development Fund. Jacques Ohayon was supported by the SIMR project (2019–2023) operated by the French National Research Agency.

Data Availability Statement

Not applicable.

Acknowledgments

We would like to thank Santiago Cruz (Department of Electronic Engineering and Communications of University of Zaragoza) for the helpful discussion on the segmentation procedure.

Conflicts of Interest

The authors declare no conflict of interest.

Abbreviations

The following abbreviations are used in this manuscript:
IVUSIntravascular Ultrasound
FCTFibrous Cap Thickness
VHVirtual Histology
FEFinite Element
CNNConvolutional Neural Networks
SGVStrain Gradient Variable
SNRSignal-to-Noise Ratio
SISegmentation Index
W-GVFWatershed-(Gradient Vector Flow)

References

  1. Roth, G.A.; Abate, D.; Abate, K.H.; Abay, S.M.; Abbafati, C.; Abbasi, N.; Abbastabar, H.; Abd-Allah, F.; Abdela, J.; Abdelalim, A.; et al. Global, regional, and national age-sex-specific mortality for 282 causes of death in 195 countries and territories, 1980–2017: A systematic analysis for the Global Burden of Disease Study 2017. Lancet 2018, 392, 1736–1788. [Google Scholar] [CrossRef] [Green Version]
  2. Casscells, W.; Naghavi, M.; Willerson, J.T. Vulnerable atherosclerotic plaque: A multifocal disease. Circulation 2003, 107, 2072–2075. [Google Scholar] [CrossRef]
  3. Jebari-Benslaiman, S.; Galicia-García, U.; Larrea-Sebal, A.; Olaetxea, J.R.; Alloza, I.; Vandenbroeck, K.; Benito-Vicente, A.; Martín, C. Pathophysiology of Atherosclerosis. Int. J. Mol. Sci. 2022, 23, 3346. [Google Scholar] [CrossRef]
  4. Libby, P.; Theroux, P. Pathophysiology of coronary artery disease. Circulation 2005, 111, 3481–3488. [Google Scholar] [CrossRef] [Green Version]
  5. Cilla, M.; Peña, E.; Martínez, M.A. 3D computational parametric analysis of eccentric atheroma plaque influence of axial and circumferential residual stresses. Biomech. Model. Mechanobiol. 2012, 11, 1001–1013. [Google Scholar] [CrossRef] [PubMed]
  6. Finet, G.; Ohayon, J.; Rioufol, G. Biomechanical interaction between cap thickness, lipid core composition and blood pressure in vulnerable coronary plaque: Impact on stability or instability. Coron. Artery Dis. 2004, 15, 13–20. [Google Scholar] [CrossRef]
  7. Guo, X.; Zhu, J.; Maehara, A.; Monoly, D.; Samady, H.; Wang, L.; Billiar, K.L.; Zheng, J.; Yang, C.; Mintz, G.S.; et al. Quantify patient-specific coronary material property and its impact on stress/strain calculations using in vivo IVUS data and 3D FSI models: A pilot study. Biomech. Model. Mechanobiol. 2017, 16, 333–344. [Google Scholar] [CrossRef] [PubMed] [Green Version]
  8. Olender, M.L.; Athanasiou, L.S.; Michalis, L.K.; Fotiadis, D.I.; Edelman, E.R. A Domain Enriched Deep Learning Approach to Classify Atherosclerosis Using Intravascular Ultrasound Imaging. IEEE J. Sel. Top. Signal Process. 2020, 14, 1210–1220. [Google Scholar] [CrossRef]
  9. Gudigar, A.; Nayak, S.; Samanth, J.; Raghavendra, U.; Ashwal, A.J.; Barua, P.D.; Hasan, M.N.; Ciaccio, E.J.; Tan, R.S.; Rajendra Acharya, U. Recent Trends in Artificial Intelligence-Assisted Coronary Atherosclerotic Plaque Characterization. Int. J. Environ. Res. Public Health 2021, 18, 3. [Google Scholar] [CrossRef] [PubMed]
  10. Kubo, T.; Nakamura, N.; Matsuo, Y.; Okumoto, Y.; Wu, X.; Choi, S.Y.; Komukai, K.; Tanimoto, T.; Ino, Y.; Kitabata, H.; et al. Virtual Histology Intravascular Ultrasound Compared With Optical Coherence Tomography for Identification of Thin-Cap Fibroatheroma. Int. Heart J. 2011, 52, 175–179. [Google Scholar] [CrossRef] [PubMed]
  11. Rezaei, Z.; Selamat, A.; Taki, A.; Mohd Rahim, M.S.; Abdul Kadir, M.R. Automatic plaque segmentation based on hybrid fuzzy clustering and k nearest neighborhood using virtual histology intravascular ultrasound images. Appl. Soft Comput. 2017, 53, 380–395. [Google Scholar] [CrossRef]
  12. Athanasiou, L.S.; Karvelis, P.S.; Tsakanikas, V.D.; Naka, K.K.; Michalis, L.K.; Bourantas, C.V.; Fotiadis, D.I. A Novel Semiautomated Atherosclerotic Plaque Characterization Method Using Grayscale Intravascular Ultrasound Images: Comparison with Virtual Histology. IEEE Trans. Inf. Technol. Biomed. 2012, 16, 391–400. [Google Scholar] [CrossRef] [PubMed]
  13. Kim, G.; Lee, J.; Hwang, Y. A novel intensity-based multi-level classification approach for coronary plaque characterization in intravascular ultrasound images. Biomed. Eng. Online 2018, 17, 1–15. [Google Scholar] [CrossRef] [Green Version]
  14. Selvathi, D.; Emimal, N.; Selvaraj, H. Automated Characterization of Atheromatous Plaque in Intravascular Ultrasound Images Using Neuro Fuzzy Classifier. Int. J. Electron. Telecommun. 2012, 58, 425–431. [Google Scholar] [CrossRef] [Green Version]
  15. Rezaei, Z.; Selamat, A.; Taki, A.; Mohd Rahim, M.S.; Abdul Kadir, M.R.; Penhaker, M.; Krejcar, O.; Kuca, K.; Herrera-Viedma, E.; Fujita, H. Thin Cap Fibroatheroma Detection in Virtual Histology Images Using Geometric and Texture Features. Appl. Sci. 2018, 8, 1632. [Google Scholar] [CrossRef] [Green Version]
  16. Sofian, H.; Than, J.C.M.; Mohammad, S.; Mohd Noor, N. Calcification Detection of Coronary Artery Disease in Intravascular Ultrasound Image: Deep Feature Learning Approach. Int. J. Integr. Eng. 2018, 10, 43–57. [Google Scholar] [CrossRef]
  17. Liu, S.; Neleman, T.; Hartman, E.M.; Ligthart, J.M.; Witberg, K.T.; van der Steen, A.F.; Wentzel, J.J.; Daemen, J.; van Soest, G. Automated Quantitative Assessment of Coronary Calcification Using Intravascular Ultrasound. Ultrasound Med. Biol. 2020, 46, 2801–2809. [Google Scholar] [CrossRef] [PubMed]
  18. Jun, T.; Kang, S.J.; Lee, J. Automated detection of vulnerable plaque in intravascular ultrasound images. Med. Biol. Eng. Comput. 2019, 57, 863–876. [Google Scholar] [CrossRef] [Green Version]
  19. Balocco, S.; Gonzalez, M.; Ñanculef, R.; Radeva, P.; Thomas, G. Calcified Plaque Detection in IVUS Sequences: Preliminary Results Using Convolutional Nets. In International Workshop on Artificial Intelligence and Pattern Recognition; Springer: Berlin/Heidelberg, Germany, 2018; pp. 34–42. [Google Scholar] [CrossRef]
  20. Sofian, H.; Ming, J.; Muhammad, S.; Noor, N. Calcification detection using convolutional neural network architectures in intravascular ultrasound images. Indones. J. Electr. Eng. Comput. Sci. 2019, 17, 1313–1321. [Google Scholar] [CrossRef]
  21. Du, H.; Ling, L.; Yu, W.; Wu, P.; Yang, Y.; Chu, M.; Yang, J.; Yang, W.; Tu, S. Convolutional networks for the segmentation of intravascular ultrasound images: Evaluation on a multicenter dataset. Comput. Methods Programs Biomed. 2022, 215, 1065–1099. [Google Scholar] [CrossRef]
  22. Balakrishna, C.; Dadashzadeh, S.; Soltaninejad, S. Automatic detection of lumen and media in the IVUS images using U-Net with VGG16 Encoder. arXiv 2018, arXiv:1806.07554. [Google Scholar]
  23. Li, Y.C.; Shen, T.Y.; Chen, C.C.; Chang, W.T.; Lee, P.Y.; Huang, C.C.J. Automatic Detection of Atherosclerotic Plaque and Calcification From Intravascular Ultrasound Images by Using Deep Convolutional Neural Networks. IEEE Trans. Ultrason. Ferroelectr. Freq. Control 2021, 68, 1762–1772. [Google Scholar] [CrossRef] [PubMed]
  24. Porée, J.; Garcia, D.; Chayer, B.; Ohayon, J.; Cloutier, G. Noninvasive vascular elastography with plane strain incompressibility assumption using ultrafast coherent compound plane wave imaging. IEEE Trans. Med. Imaging 2015, 34, 2618–2631. [Google Scholar] [CrossRef] [PubMed]
  25. Gómez, A.; Tacheau, A.; Finet, G.; Lagache, M.; Martiel, J.L.; Le Floc’h, S.; Yazdani, S.K.; Elias-Zuñiga, A.; Pettigrew, R.I.; Cloutier, G.; et al. Intraluminal ultrasonic palpation imaging technique revisited for anisotropic characterization of healthy and atherosclerotic coronary arteries: A feasibility study. Ultrasound Med. Biol. 2019, 45, 35–49. [Google Scholar] [CrossRef] [PubMed] [Green Version]
  26. Li, H.; Porée, J.; Roy Cardinal, M.H.; Cloutier, G. Two-dimensional affine model-based estimators for principal strain vascular ultrasound elastography with compound plane wave and transverse oscillation beamforming. Ultrasonics 2019, 91, 77–91. [Google Scholar] [CrossRef] [PubMed]
  27. Li, H.; Porée, J.; Chayer, B.; Cardinal, M.H.R.; Cloutier, G. Parameterized Strain Estimation for Vascular Ultrasound Elastography With Sparse Representation. IEEE Trans. Med. Imaging 2020, 39, 3788–3800. [Google Scholar] [CrossRef]
  28. Le Floc’h, S.; Ohayon, J.; Tracqui, P.; Finet, G.; Gharib, A.M.; Maurice, R.L.; Cloutier, G.; Pettigrew, R.I. Vulnerable atherosclerotic plaque elasticity reconstruction based on a segmentation-driven optimization procedure using strain measurements: Theoretical framework. IEEE Trans. Med. Imaging 2009, 28, 1126–1137. [Google Scholar] [CrossRef] [Green Version]
  29. Le Floc’h, S.; Cloutier, G.; Saijo, Y.; Finet, G.; Yazdani, S.K.; Deleaval, F.; Rioufol, G.; Pettigrew, R.I.; Ohayon, J. A four-criterion selection procedure for atherosclerotic plaque elasticity reconstruction based on in vivo coronary intravascular ultrasound radial strain sequences. Ultrasound Med. Biol. 2012, 38, 2084–2097. [Google Scholar] [CrossRef] [Green Version]
  30. Maurice, R.L.; Ohayon, J.; Finet, G.; Cloutier, G. Adapting the Lagrangian speckle model estimator for endovascular elastography: Theory and validation with simulated radio-frequency data. J. Acoust. Soc. Am. 2004, 116, 1276–1286. [Google Scholar] [CrossRef] [PubMed]
  31. Porée, J.; Chayer, B.; Soulez, G.; Ohayon, J.; Cloutier, G. Noninvasive vascular modulography method for imaging the local elasticity of atherosclerotic plaques: Simulation and in vitro vessel phantom study. IEEE Trans. Ultrason. Ferroelectr. Freq. Control 2017, 64, 1805–1817. [Google Scholar] [CrossRef]
  32. Bouvier, A.; Deleval, F.; Doyley, M.; Yazdani, S.; Finet, G.; Le Floc’h, S.; Cloutier, G.; Pettigrew, R.; Ohayon, J. A direct vulnerable atherosclerotic plaque elasticity reconstruction method based on an original material-finite element formulation: Theoretical framework. Phys. Med. Biol. 2013, 58, 8457–8476. [Google Scholar] [CrossRef] [Green Version]
  33. Peña, E.; Cilla, M.; Latorre, Á.T.; Martínez, M.A.; Gómez, A.; Pettigrew, R.I.; Finet, G.; Ohayon, J. Emergent biomechanical factors predicting vulnerable coronary atherosclerotic plaque rupture. In Biomechanics of Coronary Atherosclerotic Plaque; Academic Press: Cambridge, MA, USA, 2021; pp. 361–380. [Google Scholar] [CrossRef]
  34. Glagov, S.; Weisenberg, E.; Zarins, C.; Stankunavicius, R.; Kolettis, G. Compensatory enlargement of human atherosclerotic coronary arteries. N. Engl. J. Med. 1987, 316, 1371–1375. [Google Scholar] [CrossRef]
  35. Le Floc’h, S. Modulographie Vasculaire: Application à l’Identification In-Vivo du Module de Young local des Plaques d’Athérosclérose. Ph.D. Thesis, Université Joseph-Fourier-Grenoble I, Saint-Martin-de-Re, France, 2009. [Google Scholar]
  36. Gasser, T.C.; Ogden, R.W.; Holzapfel, G.A. Hyperelastic modelling of arterial layers with distributed collagen fibre orientations. J. R. Soc. Interface 2006, 3, 15–35. [Google Scholar] [CrossRef] [PubMed] [Green Version]
  37. Versluis, A.; Bank, A.J.; Douglas, W.H. Fatigue and plaque rupture in myocardial infarction. J. Biomech. 2006, 39, 339–347. [Google Scholar] [CrossRef]
  38. Holzapfel, G.A.; Sommer, G.; Gasser, C.T.; Regitnig, P. Determination of layer-specific mechanical properties of human coronary arteries with nonatherosclerotic intimal thickening and related constitutive modeling. Am. J. Physiol.-Heart Circ. Physiol. 2005, 289, H2048–H2058. [Google Scholar] [CrossRef] [PubMed] [Green Version]
  39. Skacel, P. Hyperfit: Sotfware for Fitting of Hyperelastic Constitutive Models. 2018. Available online: http://www.hyperfit.wz.cz (accessed on 16 September 2020).
  40. Dassault Systèmes Simulia Corp. ABAQUS/Standard User’s Manual, Version 6.14. 2014. [Google Scholar]
  41. Ramzy, D. Definition of hypertension and pressure goals during treatment (ESC-ESH Guidelines 2018). Eur. Soc. Cardiol. J. 2019, 17. [Google Scholar]
  42. Raghavan, M.; Ma, B.; Fillinger, M. Non-invasive determination of zero-pressure geometry of arterial aneurysms. Ann. Biomed. Eng. 2006, 34, 1414–1419. [Google Scholar] [CrossRef] [PubMed]
  43. MATLAB. R2021b, The MathWorks Inc.: Natick, MA, USA, 2021.
  44. Soleimanifard, S.; Abd-Elmoniem, K.Z.; Agarwal, H.K.; Tomas, M.S.; Sasano, T.; Vonken, E.; Youssef, A.; Abraham, M.R.; Abraham, T.P.; Prince, J.L. Identification of myocardial infarction using three-dimensional strain tensor fractional anisotropy. In Proceedings of the 2010 IEEE International Symposium on Biomedical Imaging: From Nano to Macro, Rotterdam, The Netherlands, 14–17 April 2010; pp. 468–471. [Google Scholar] [CrossRef] [Green Version]
  45. Wang, D.; Chayer, B.; Destrempes, F.; Gesnik, M.; Tournoux, F.; Cloutier, G. Deformability of ascending thoracic aorta aneurysms assessed using ultrafast ultrasound and a principal strain estimator: In vitro evaluation and in vivo feasibility. Med. Phys. 2022, 49, 1759–1775. [Google Scholar] [CrossRef]
  46. Sumi, C.; Nakayama, K. A robust numerical solution to reconstruct a globally relative shear modulus distribution from strain measurements. IEEE Trans. Med. Imaging 1998, 17, 419–428. [Google Scholar] [CrossRef]
  47. Tacheau, A.; Le Floc’h, S.; Finet, G.; Doyley, M.M.; Pettigrew, R.I.; Cloutier, G.; Ohayon, J. The imaging modulography technique revisited for high-definition intravascular ultrasound: Theoretical framework. Ultrasound Med. Biol. 2016, 42, 727–741. [Google Scholar] [CrossRef]
Figure 1. Scheme of the five steps that define the methodology.
Mathematics 10 04020 g001
Figure 2. (a) 3D Idealized geometry; (b) fibrous cap thickness of 65 microns; (c) fibrous cap thickness of 150 microns; (d) fibrous cap thickness of 300 microns.
Mathematics 10 04020 g002
Figure 3. The first column presents IVUS images [35] of the three different plaques; the second column is the manual segmentation performed by a cardiologist [35]; the third column is the IVUS reconstruction in Abaqus of the pressurized geometry; the fourth column shows the plaque models with zero-pressure geometry in Abaqus. These geometries were used to initiate the FE simulations. The fifth column is the final FE model after applying an internal pressure of 115 mmHg to the previous geometry.
Mathematics 10 04020 g003
Figure 4. Comparison between the real and the segmented lipid core. The lumen is represented in gray color, the true positive area in white, the false negative area in green, the actual area that was not segmented in purple, and the measure of the FCT is the red line.
Mathematics 10 04020 g004
Figure 5. Influence of the FCT on the segmentation procedure analyzed with clean strains. The rows represent the segmentation process with the geometries of 65, 150, and 300 μ m of FCT. The segmentation process consists of the combination of two SGVs, in these cases ε m i n and F A in (a,b), respectively. The combination of both is represented in (c). This representation is the input for the W-GVF and its results are represented in (d); finally, the overlap between the actual and the segmented lipid core before and after the smooth treatment is represented in (e), where the true positive area is in white, the false negative area in green and the actual area that is not segmented in purple.
Mathematics 10 04020 g005
Figure 6. Box-plots of the SI values of the idealized geometries. From left to right: 65, 150, and 300 μ m of fibrous cap thickness. Each geometry was analyzed with clean strains and with 20 dB of SNR. The median values were represented with a horizontal line. The median values were 93% and 90.14% for the idealized geometry with 65 μ m FCT with and without noise; 94.88% and 93.42% for geometry of 150 μ m FCT; and 95.23% and 94.17% for 300 μ m. Mean values are represented with asterisks. Outliers are represented with circles. Some outliers were below 65% but are not shown.
Mathematics 10 04020 g006
Figure 7. Segmentation procedure in the IVUS geometries with clean strains. The rows represent the segmentation process with the plaques 1, 2, and 3; (a) representation of ε m i n ; (b) representation of F A ; (c) the combination of ε m i n + F A ; (d) W-GVF results; and (e) segmented lipid before and after the smooth treatment, where the true positive area is in white, the false negative area in green and the actual area that is not segmented in purple.
Mathematics 10 04020 g007
Figure 8. Box-plots of the SI values of the real IVUS geometries. The three plaques were analyzed with clean strains and with 20 dB of SNR. The median values are represented with a horizontal line. The median values were 92.02% and 93.74% for the first IVUS geometry, with and without noise; 92.60% and 88.82% for the second IVUS geometry; and 94.30% 91.84% for third IVUS geometry, respectively. Mean values are represented with asterisks. Outliers are represented with circles. Some outliers were below 65% but are not shown.
Mathematics 10 04020 g008
Figure 9. Idealized geometry with 150 μ m thickness with the different d W represented without noise. (a) d W s i m p l i f i e d , (b) d W computed with the 2D strain tensor, and (c) d W .
Mathematics 10 04020 g009
Figure 10. Graphic summary of the influence of incompressibility, changing fibrotic tissues, addition of inclusions, different catheter positions, different pressures and pressure increments, and noise addition on the segmentation process. The considered SGVs are ε M i s e s + ε r θ , ε y y + ε r r , ε y y + ε m i n , ε m i n + ε T r e s c a , and d W . Each SGV has different variables to analyze, divided by colors. Each plaque- or IVUS-related variable had different cases that were differentiated by shape markers.
Mathematics 10 04020 g010
Table 1. Fitted parameters for the hyperelastic model.
Tissue μ [kPa] k 1 [kPa] k 2 [-] κ [-] α [°]
Adventitia4.22547.67568.010.26±61.80
Media0.7206.1658.550.29±28.35
Intima3.41109.10101.040.21±52.72
Fibrotic4.7917,654.910.511/3-
Lipid Core0.025956.76701/3-
Calcification1875----
Table 2. Summary of the results for the best five single SGVs and fifteen SGV combinations for the lipid segmentation of all of the 105 possible combinations based on the results of the idealized and IVUS geometries with FE strains. The SGVs with the SI value in dark green mean a perfect segmentation; light green stands for good segmentations; yellow for SGV indicates some problems in segmenting the fibrous cap or the lipid area. S I ¯ and S I n o i s e ¯ represent the mean SI value without and with noise, respectively.
Segmentation Index (SI)
Idealized GeometryReal IVUS Geometry SI ¯ SI noise ¯
65 μ m150 μ m300 μ mPlaque 1Plaque 2Plaque 3
One SGV d W 95.2097.1394.3196.9892.0692.5094.7090.62
d W 92.3394.5596.0293.9994.6696.2394.6386.04
ε v M i s e s 93.4993.6097.6590.7494.9997.0894.5994.47
ε r r 97.6594.4093.0798.4886.7896.3294.4592.27
ε m i n 86.0793.7797.8697.7393.4397.4694.3993.29
Combination of two SGVs ε v M i s e s + ε r θ 95.8797.6397.0998.6196.1497.2897.1095.22
ε y y + ε r r 95.7497.9394.7998.5397.5196.7696.8895.68
ε y y + ε m i n 95.7498.2194.2398.5395.5598.2896.7594.28
ε m i n + ε T r e s c a 96.9796.3296.0997.3695.9897.4396.6993.67
ε m a x + ε r r 97.7394.0898.5897.7692.3398.0396.4292.88
ε m i n + F A 97.8593.0196.1797.4695.2497.4796.2094.76
ε m i n + ε v M i s e s 95.1793.2896.8797.4395.9898.3796.1895.10
ε r r + ε r θ 92.8197.4997.9598.9493.1396.4396.1388.68
ε T r e s c a + ε r r 93.3096.2595.8197.3496.1297.7796.1093.67
ε y y + ε T r e s c a 93.0697.6495.1798.4193.5597.9495.9693.09
F A + ε r r 92.8794.8896.5397.5195.9697.4995.8792.88
ε m a x + ε m i n 97.5394.4692.7496.3495.4097.9695.7493.65
F A + ε r θ 93.6897.4095.0498.5690.9997.5395.5392.69
ε x x + F A 95.9395.7995.5192.4495.2998.2395.5392.03
ε x y + F A 94.3294.2194.8496.4995.1297.1695.3693.04
Publisher’s Note: MDPI stays neutral with regard to jurisdictional claims in published maps and institutional affiliations.

