1. Introduction
Radioembolization is a treatment for patients with inoperable malignant liver tumors, one of the deadliest types of cancer worldwide [
1]. The treatment is carried out using a microcatheter placed in the hepatic artery to infuse radiolabeled microspheres into the hepatic arterial bloodstream, which carries the microspheres to the tumoral bed, where they get lodged and irradiate tumoricidal doses of radiation [
2]. The treatment outcome depends on the dose absorbed by tumors, meaning that it depends on the final distribution of microspheres in tumors. The absorbed tumoricidal dose to be achieved depends on the types of microspheres, which can be resin or glass microspheres loaded with isotope yttrium-90 or with isotope holmium-166 [
3].
In the last decade, many computational fluid dynamics (CFD) studies have analyzed the microsphere distribution in hepatic arterial trees during radioembolization by analyzing the hepatic artery hemodynamics and microsphere transport, and assessed the influence of various parameters (e.g., injection velocity [
4,
5], microcatheter location [
6,
7,
8,
9], catheter type [
10], etc.) on the microsphere distribution at the outlets of the trees. However, to date, no study has focused on the analysis of the microsphere concentration in the blood (i.e., the number of microspheres per unit blood volume) as these microspheres exit the hepatic arteries under study. The analysis of this parameter could be included when developing an integrated software package to provide clinicians with practical recommendations about the optimal treatment parameters based on CFD simulations [
11].
We hypothesize that the microsphere concentration in the blood could play a role in the distal penetration of microspheres and tumor microsphere coverage, and therefore in the final microsphere deposition in tumors. Indeed, recent publications have stressed the importance of glass microsphere density in tumors (i.e., the number of microspheres per unit tumor volume) [
12,
13], the number of microspheres injected based on the vascularity of tumors [
14], and the method of administration [
15] on the treatment outcome. Additionally, the microsphere volume fraction, which is directly related to the microsphere concentration in the blood, could play a role in the penetration of microspheres because the probability of clogging distal arterioles with vessel-to-microsphere diameter ratios below 3 depends on the microsphere volume fraction [
16]. Such clogging may occur when microspheres would group together before reaching distal vessels with diameters below the microsphere diameter.
In addition to studying the microsphere distribution at the outlets of the arterial trees, CFD simulations allow for analyzing the microsphere concentration in the blood at such outlets. In order to explore this parameter, the aim of the present study was to analyze the influence of injection conditions on the microsphere concentration in the blood at the outlets of a patient-specific hepatic artery tree using CFD.
2. Materials and Methods
2.1. Patient Data
This study was based on a patient-specific case. To conduct the present study, the protocol 186/2018 was approved by the ethics committee of the University of Navarra and informed consent was signed by the patient. This patient was a 69-year-old male with multinodular hepatocellular carcinoma (HCC) involving liver segments S2, S3, S6, S7, and S8.
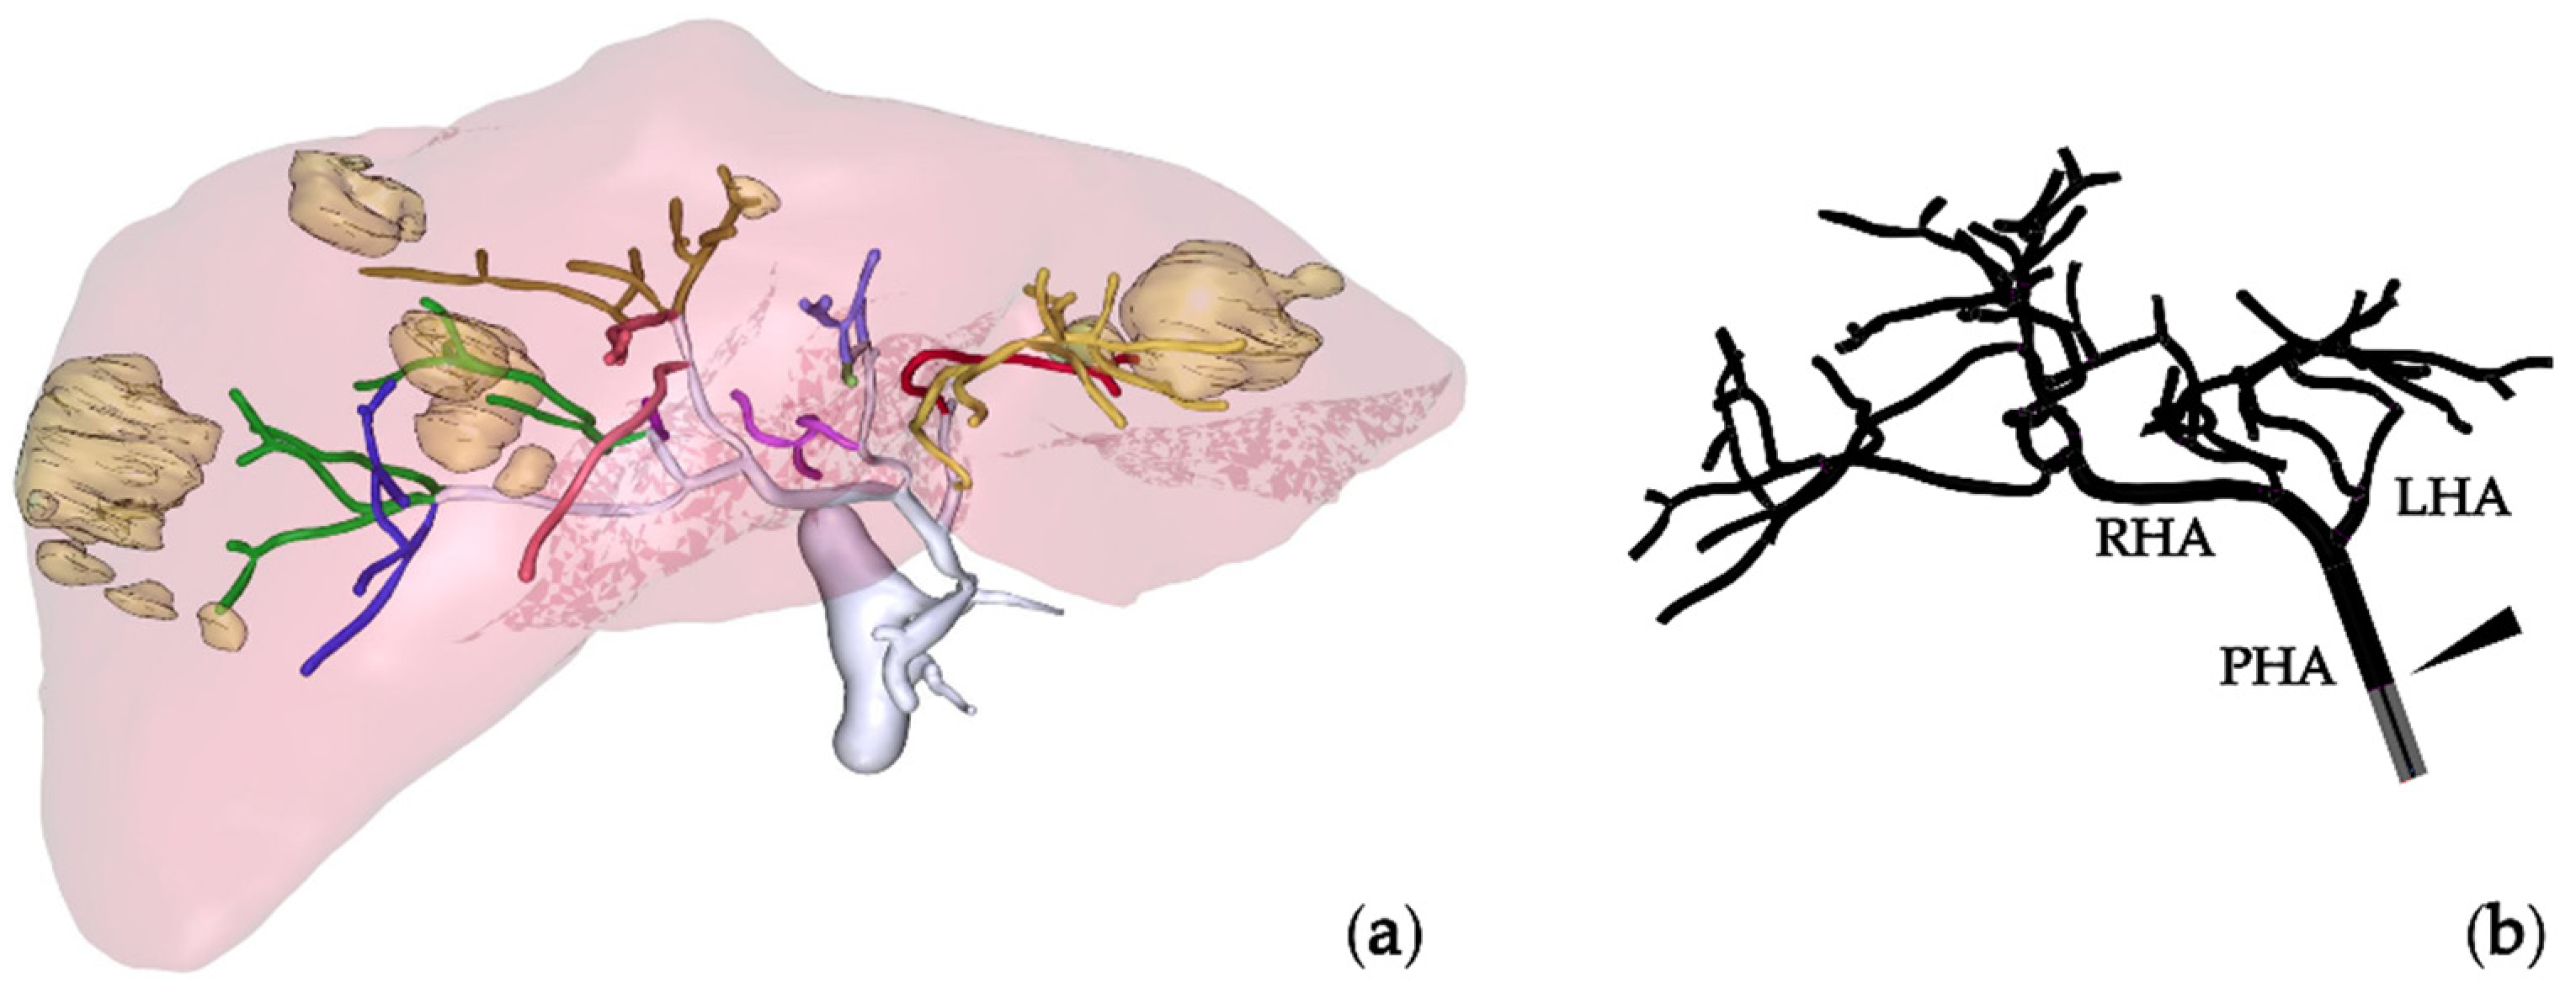
For CFD simulations, the geometries of the hepatic artery and microcatheter, and boundary conditions, were needed. The hepatic artery geometry and boundary conditions were extracted or derived from the information provided by MeVis (MeVis Medical Solutions AG, Bremen, Germany), that is, the three-dimensional hepatic artery, the healthy and tumor tissue volumes per liver segment, and information regarding the specific artery branches that feed each liver segment. In this case, the geometry of the hepatic artery starts at a 4.5 mm diameter proper hepatic artery (PHA) level and bifurcates until 43 outlets are obtained.
Figure 1a shows the liver geometry, with the locations of tumors and the hepatic artery tree, and
Figure 1b shows a model of the hepatic artery with the microcatheter, the location of which is indicated with an arrowhead. The hemodynamic conditions were derived based on volumetry analysis (volumes of normal and tumor tissue per segment) and perfusion-CT analysis (arterial perfusion of normal and tumor tissue), which were used to calculate the blood flow rate at the inlet of the PHA and the flow distribution in the 43 outlets [
17]. This patient also participated in a previous study by the authors to validate the simulation methodology by comparing the microsphere distributions measured in vivo with the microsphere distributions calculated based on the results of CFD simulations that reproduced the actual treatments [
18]. The segment-to-segment tissue volumes and arterial blood flow rates are tabulated in
Table 1. Even though, previously, three microsphere injections were administered to the patient, in this study, only one injection was simulated, with the microcatheter placed in the PHA, 20 mm away from the bifurcation. The microcatheter was modeled as a standard end-hole microcatheter with an inner diameter of 0.65 mm and outer diameter of 0.9 mm.
2.2. Simulation of Radioembolization
The geometry of the hepatic artery was imported into the software package SpaceClaim (Ansys Inc., Canonsburg, PA, USA), where the microcatheter geometry was also added. The geometries were discretized in Fluent Meshing 2021R1 (Ansys Inc.) using poly-hexcore elements, yielding a sufficiently fine mesh of 2.5 million elements.
Regarding the governing equations and boundary conditions, the model used by Aramburu et al. [
6] was used: blood flow was simulated using the conservation of mass and the conservation of linear momentum in a laminar regime for an incompressible (1050 kg/m
3) and non-Newtonian fluid with the viscosity modeled using a modified Quemada model. Microspheres were modeled as 32 μm, 1600 kg/m
3 spheres and their dynamics were modeled with Newton’s second law of motion. Four forces were considered to be acting on the microspheres: virtual mass force, gravitational force, pressure gradient force, and drag force. The interaction of blood flow with microspheres was modeled as bidirectional, but the interaction between microspheres was neglected. As for the boundary conditions, a periodic pulsatile fully-developed velocity profile with a period of one second representing one cardiac cycle was prescribed at the inlet, flow fractions at the outlets, and the no-slip condition at the walls. Microspheres were injected through the inlet of the microcatheter and elastic collisions were assumed at the walls.
The equations of the model were solved numerically using Fluent 2021R1 (Ansys Inc.). The SIMPLE scheme (i.e., Semi-Implicit Method for Pressure Linked Equations) was used for the pressure and velocity coupling, the least squares cell-based algorithm for the computation of gradients, and second-order schemes to interpolate pressure and momentum. The convergence criterion was to attain scaled residuals of 10−5. The time step was fixed at a value of 2 milliseconds with a maximum of 80 iterations per time step. A total of seven cardiac cycles were simulated: the first cycle, i.e., one second, was for flow convergence (from t = −1 s to t = 0 s), during the second cycle the microspheres were injected (from t = 0 s to t = 1 s), and the remaining five cycles ensured that the majority of the injected microspheres exited the domain (from t = 1 s to t = 6 s). Simulation results were analyzed from t = 0 s onward. In this study, depending on the simulation, the injection of microspheres sometimes lasted more than one cycle, in which cases the remaining cycles for microsphere exiting were fewer than five cycles.
2.3. Study Design and Postprocessing
The objective of this study was to analyze the influence of injection conditions on the microsphere concentration in the blood at the outlets. The number of injected microspheres can be calculated using Equation (1):
where
(microspheres, hereafter MS) is the total number of microspheres injected in the simulation,
(MS/mL) is the number of microspheres per unit milliliter in the vial,
(cm/s) is the injection velocity,
(cm
2) is the cross-sectional area of the microcatheter, and
is the injection span (s).
In this study, three simulations were run. In these simulations,
was kept constant, meaning that the same number of microspheres was injected, and
was also kept constant, so
and
were modified, as shown in
Table 2.
Regarding the postprocessing of simulation results, the overall outlet-to-outlet and segment-to-segment microsphere distributions were extracted, as well as the concentration of microspheres in the blood in the PHA and at the outlets over time. To calculate the concentration of microspheres in the blood in the PHA, Equation (2) was used:
where
(MS/mL) is the concentration of microspheres in the blood in the PHA calculated for a given span,
(MS) is the number of microspheres that were infused into the PHA during the same span, and
(mL) is the volume of blood and the volume of injection fluid that flowed through the PHA during the same span. To calculate the concentration of microspheres in blood at the outlets Equation (3) was used:
where
(MS/mL) is the concentration of microspheres in the blood for outlet
i (with
i from 1 to 43), calculated for a given span,
(MS) is the number of microspheres that exited through outlet
i during the same span, and
(mL) is the volume of blood that flowed through outlet
i during the same span. In this study, a span of 20 milliseconds was selected.
3. Results
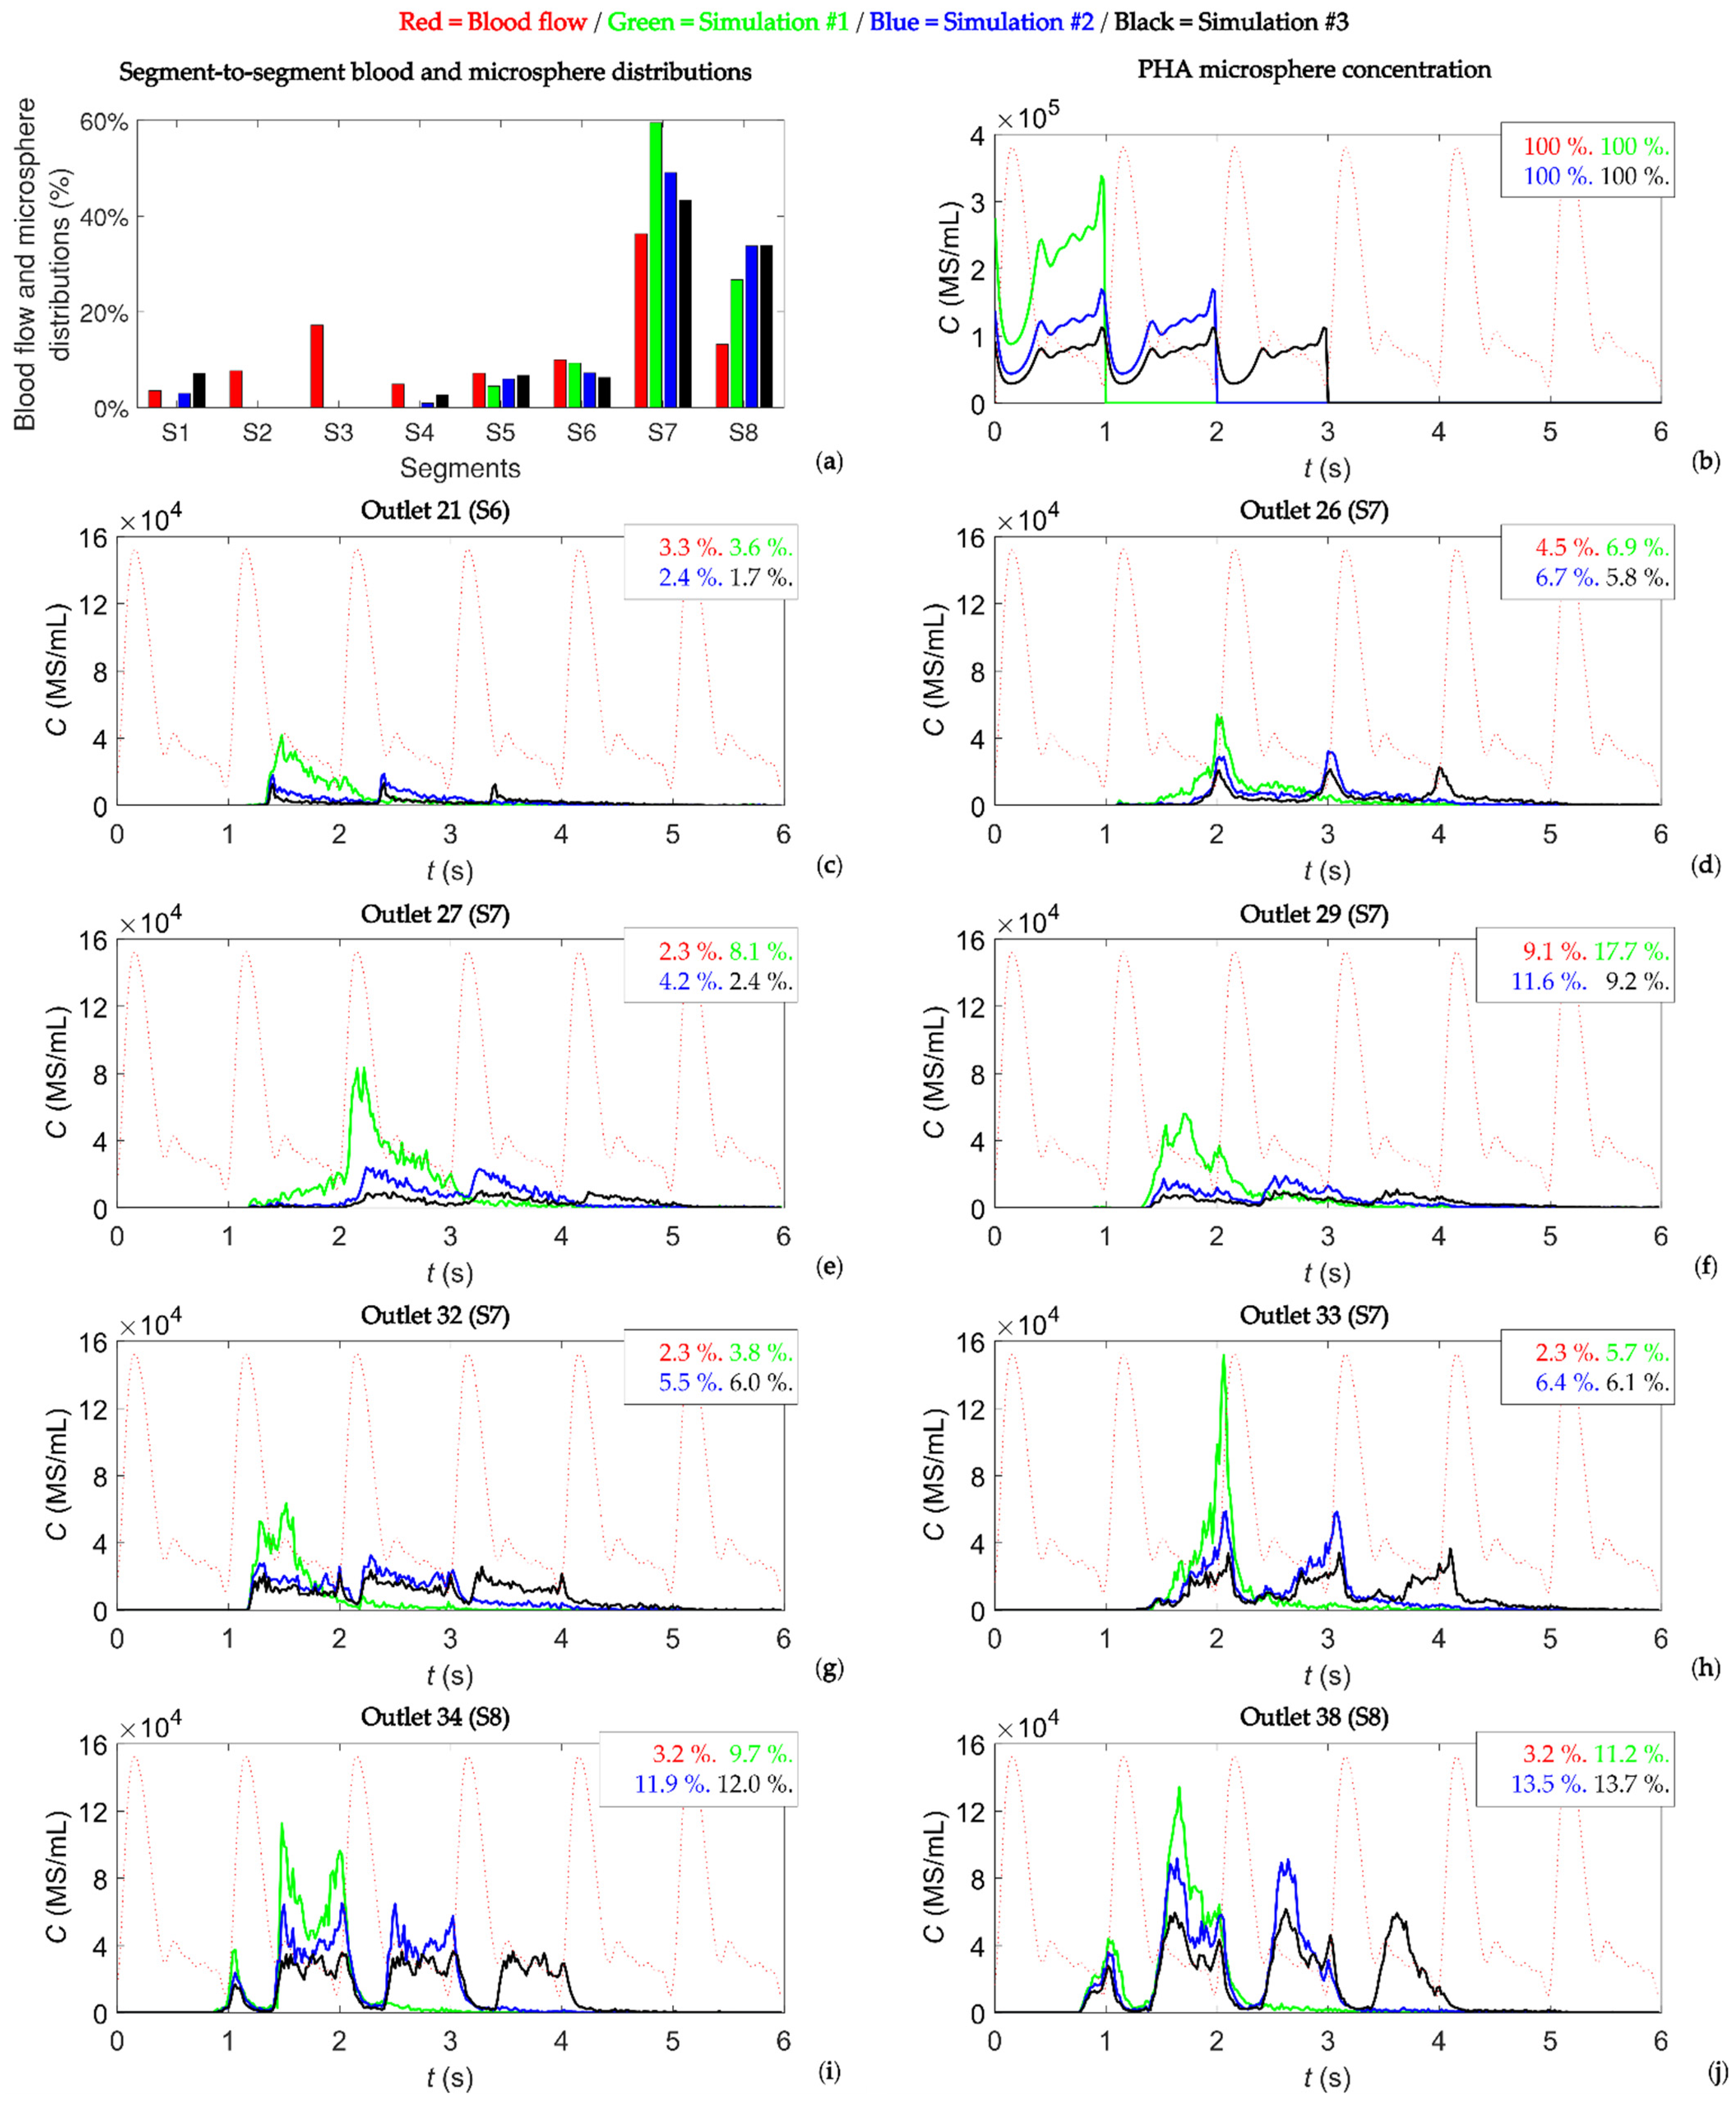
First, the segment-to-segment microsphere distribution was analyzed. The total number of microspheres injected was the same in all simulations (4.45 × 10
5 MS), so the results were normalized with respect to the total number of microspheres injected. For example, a value of 50% for a given segment means that half of the injected microspheres reached that segment. When analyzing the differences between simulations, the absolute differences were computed, i.e., the differences in percent (%). These results are shown in
Figure 2a, where the blood flow distribution and segment-to-segment microsphere distribution are shown. Despite the disease being bilobar (present in segments S2, S3, S6, S7, and S8), almost no microspheres reached the left lobe, and those which did reach the left lobe reached segments S1 and S4. Therefore, the injection point used in this study did not produce an effective microsphere distribution. In fact, three injections were given to this patient. It can be noted that for the segments of the right lobe (S5, S6, S7, and S8), the microsphere distribution followed a trend where the greater the blood flow rate to a given segment, the greater the number of microspheres exiting toward that segment. Moreover, differences can be seen between simulations. For example, microspheres flowed toward segments S1 and S4 in simulations #2 and #3, while no microsphere flowed toward the left lobe in simulation #1. In all simulations, the segment receiving the most microspheres was segment S7, which is the segment with the biggest nodule (a 23 mL nodule). It can also be noted that even though segment S3 received 17% of the total blood flow, no microspheres reached that segment. Additionally, the microsphere distributions were different in the simulations, with an absolute difference of 16 percent between simulations #1 and #3 for segment S7. The average absolute difference between simulations in all segments was 5 percent.
Second, the concentration of microspheres in the blood over time in the PHA and at each outlet was studied. In this study, the concentration of microspheres in the vial was of the order of 10
6 MS/mL, which was reduced to a concentration of microspheres in the blood of the order of 10
5 MS/mL in the PHA, and was further reduced to a concentration of microspheres in the blood of the order of 10
4 MS/mL (and below that value) in segmental arteries, meaning that the concentration decreased as microspheres flowed toward distal vessels.
Figure 2b shows the microsphere concentration in blood at the PHA level over time. A constant injection flow and microsphere injection rate resulted in a microsphere concentration in the blood with a minimum value during systole and a maximum value during diastole. The geometry had 43 outlets, but only the outlets with a flow fraction greater than 1% and a concentration of microspheres in the blood greater than 40,000 MS/mL are reported, resulting in an analysis of eight outlets: outlet 21 feeding segment S6, outlets 26, 27, 29, 32, and 33 feeding segment S7, and outlets 34 and 38 feeding segment S8. These results are shown in
Figure 2c–j. In each panel, the time-dependent microsphere concentration in the blood is plotted for simulations #1, #2, and #3. Additionally, the shape of the blood flow rate is plotted in dotted lines, and the percentage of blood flow feeding that outlet and the percentage of microspheres exiting that outlet are indicated.
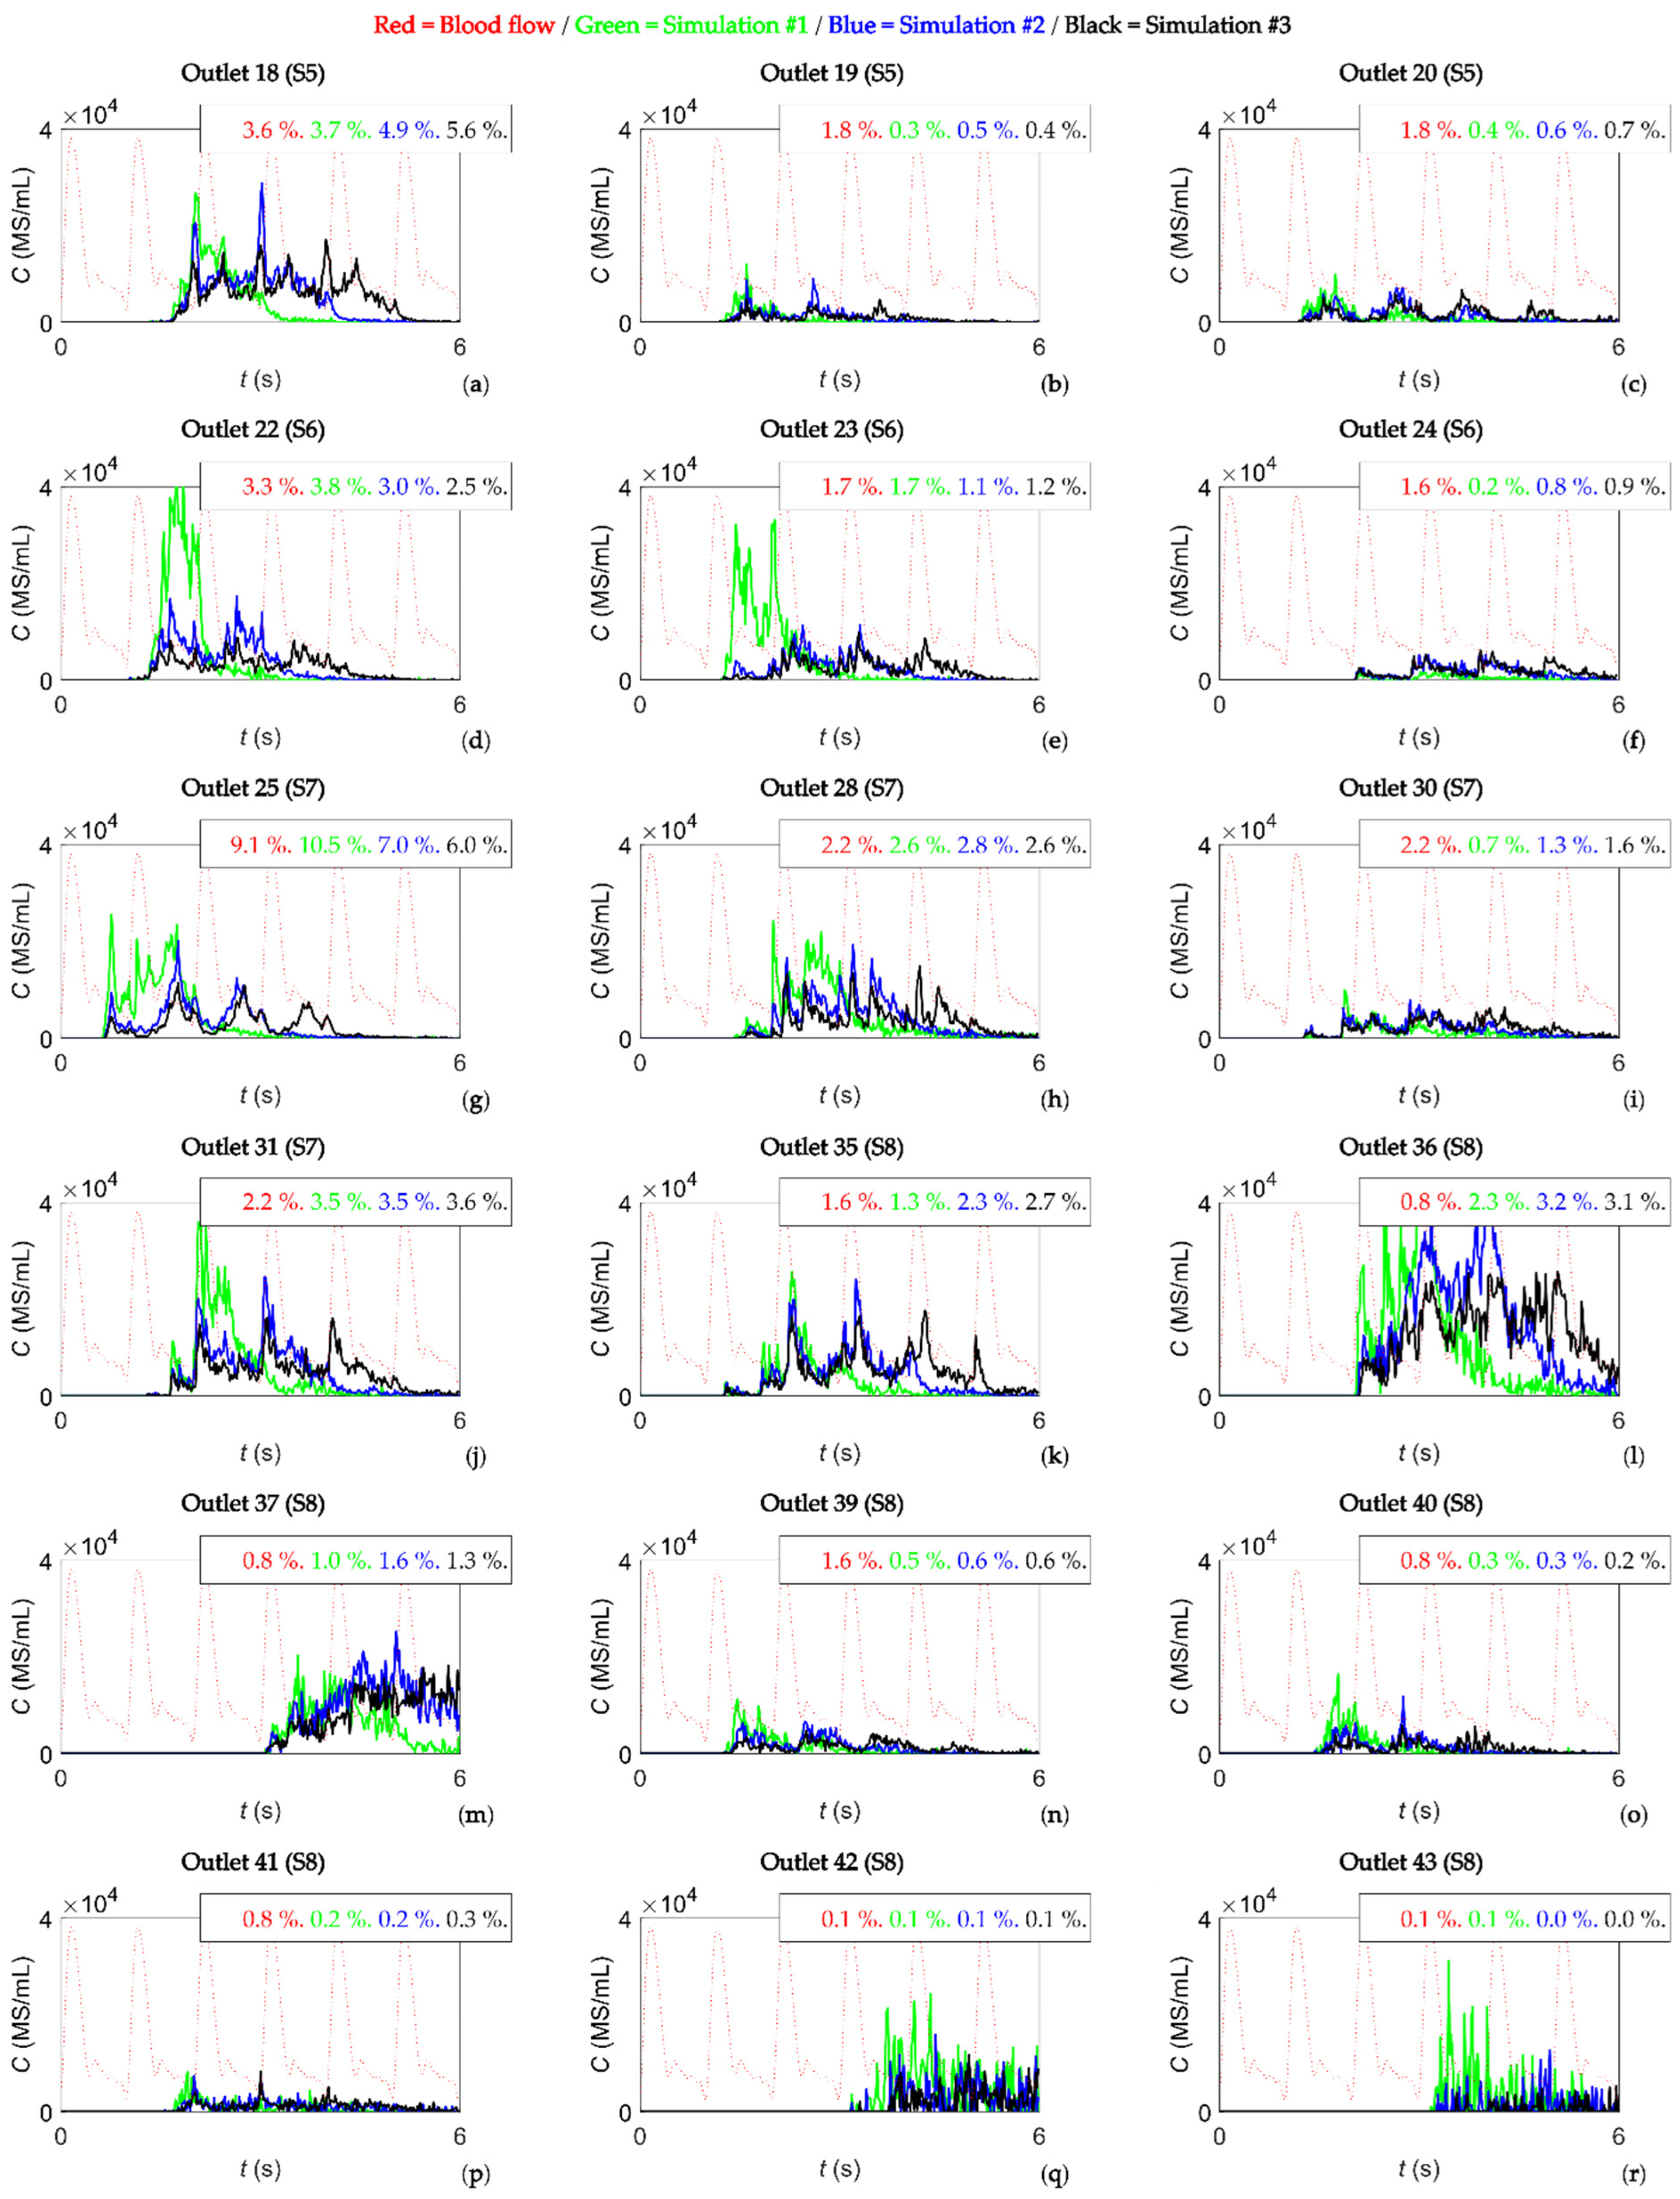
Figure A1 in
Appendix A shows the same information as in
Figure 2 for the outlets that had a flow of microspheres but did not meet the criteria of having a flow fraction greater than 1% and a concentration of microspheres in the blood greater than 40,000 MS/mL.
Regarding the percentage of microspheres exiting the eight outlets of
Figure 2, this value was, in general, different from the blood flow percentage, but it also differed slightly among simulations. The mean value of the difference in microsphere distributions in these outlets was 3 percent, with the greatest difference being 8 percent for outlet 29 between simulations #1 and #3 (see
Figure 2f).
As for the microsphere concentration in the blood over time, the following trend was seen for the outlets in
Figure 2c–j for a periodic flow and a constant microsphere infusion: (i) the greater the concentration of microspheres in the vial, the greater the microsphere concentration in the blood at the outlets, and (ii) the concentration of microspheres in the blood was periodic-like, meaning that the same shape was repeated over the cardiac cycles with a period similar to that of the cardiac cycle. In this case, for simulations #1, #2, and #3 (with microspheres injected during one, two, and three cardiac cycles, respectively), one-cycle, two-cycle, and three-cycle outlet-specific patterns were observed. This trend was not seen at the outlets shown in
Figure A1.
It is also important to note that the peaks of the periodic-like patterns did not coincide with any specific moment of the cardiac cycle (e.g., the systole or diastole) (see
Figure 2c–j). Microspheres were injected at a constant rate, and their velocity matched the blood flow velocity shortly after they were incorporated into the bloodstream. If the microspheres had traveled through straight streamlines, the concentration of microspheres in the blood at the outlet should have had the same pattern as that in the PHA (
Figure 2b). However, the tortuosity of arteries made the blood flow and microsphere trajectories intricate, and this fact made the concentration of microspheres inconstant. Likewise, there were some non-periodic peaks for outlets 34 and 38 at the beginning of microsphere crossing (see
Figure 2i,j), which could be due to transient effects. When analyzing the peak values, if the outlets of
Figure 2 were considered, on average, the concentration values were reduced by 52% from simulation #1 to simulation #2, and by 69% from simulation #1 to simulation #3. These values were similar to the decrease in the concentration of microspheres in the vial between simulations #1 and #2 and simulations #1 and #3 (50% and 67%, respectively). If all the outlets were considered, these average peak values decreased to 27% for simulation #2 and 45% for simulation #3.
4. Discussion
The objective of this study was to analyze the influence of the microsphere concentration in the vial on the microsphere distribution in the blood using CFD techniques. The concentration of microspheres in the blood depends on the injection conditions (e.g., the microsphere concentration in the vial and injection velocity) and the hemodynamic characteristics of patients. This concentration could play a role in the final distribution of microspheres within tumors because of potential microsphere aggregation, distal vessel clogging, and hemodynamic redistributions in the microvasculature. Indeed, the study of the microsphere density in tumors is an active area of ongoing research. Recent studies have shown that the resin microsphere distribution in tumors determines the treatment outcome [
12,
13], and that the number of microspheres injected and the method of administration play a role in the microsphere distribution [
14,
15].
Regarding segment-to-segment microsphere distributions, our results showed that the microsphere dynamics’ and hemodynamics’ interaction could play a role in microsphere transport and therefore should be considered. Indeed, a difference of 16 percent was obtained between simulations #1 and #3 in segment S7, and no microspheres targeted the left lobe in simulation #1, with microspheres targeting the left lobe only in simulations #2 and #3; the only difference between simulations was the concentration of microspheres in the vial, and therefore the rate at which microspheres were injected.
With regard to the microsphere concentration in the blood, periodic patterns were observed. As for the specific patterns, no relationship was observed between the concentration of microspheres in the blood in the PHA and the microsphere concentration in the blood at the outlets, nor between the shape of the microsphere distribution in the blood and the shape of the blood flow. The microsphere concentration decreased as the flow reached distal vessels of the hepatic artery tree studied, from 10
5 MS/mL in the PHA to 10
4 MS/mL or lower values. However, these results showed a relationship between the microsphere concentration in the vial and the peak value of the microsphere concentration in the blood. In fact, the concentration of microspheres in the vial was reduced by 50% between simulations #1 and #2, and on average the peak of microsphere concentrations in the blood was reduced by 52%. Between simulations #1 and #3, the concentration of microspheres in the vial was reduced by 67%, and on average the peak of microsphere concentrations in the blood was reduced by 69%. This relationship could be of interest for future research. Additionally, the influence of the microsphere concentration in the blood in distal arterioles and capillaries needs to be assessed. As the ratio of the vessel diameter to the microsphere diameter approaches a value of 3, the probability of clogging depends on the microsphere volume fraction [
16], which is similar to the microsphere concentration in the blood. Microspheres could become clogged before reaching the distal arterioles and capillaries with diameters similar to that of the microsphere, influencing the final microsphere distribution in tissues.

 ,
, 


