

Research on the Mathematical Model for Optimal Allocation of Human Resources in the Operation and Maintenance Units of a Heavy Haul Railway

 ,
,
Abstract
1. Introduction
- (1)
- Helping the project improve the effect of human resource management and improving the comprehensive competitiveness of the enterprise. The current project is facing fierce competition and a more complex competition pattern. It is impossible for enterprises to realize long-term competitive advantage based on one kind of competitiveness. Following its emergence, the project’s competitive advantage will be constantly imitated and then gradually disappear. Competitive advantage formed on the basis of core human resources, however, is unique and therefore difficult for other enterprises to copy and surpass. Therefore, the project needs to establish the mechanisms for the right human resources management;
- (2)
- Achieving the profit maximization effect, based on cost minimization. First, in the process of staff allocation, we should consider the ability and experience of employees to ensure that the results after distribution can support the realization of the personal value of employees. Under the control of human resources, employees can communicate in a timely manner and flexibly adjust their work, thus effectively reducing the operating cost;
- (3)
- Improving the skills and quality of employees to promote the technological renewal of enterprises. Circulation of information together with improving the technical ability of employees can be realized through the exchange of information between employees in the project. This is very beneficial for the mining of staff skills and abilities, which can help the enterprise to continuously develop.
- (1)
- Literature induction
- (2)
- Questionnaire survey method
- (3)
- Mathematical modeling method
2. Current Human Resource Allocation Overview
3. Analysis of the Optimal Allocation Model Based on Existing Human Resources
3.1. Model Hypothesis
- (1)
- All types of personnel are paid a fixed salary every month;
- (2)
- The four bridge and tunnel operation and maintenance units are working every day, and there is no suspension of the bridge and tunnel operation and maintenance units;
- (3)
- No additional temporary recruiters;
- (4)
- The same person is not considered as two bridge and tunnel operation and maintenance units at the same time;
- (5)
- The influence of various factors on the bridge and tunnel operation and maintenance unit and staff is excluded;
- (6)
- This paper does not consider many of the uncertainties of future transportation conditions, including possible changes in transportation elasticity and external costs.
3.2. Model Construction
- (1)
- Definitions
- : the operation and maintenance unit of each bridge and tunnel;
- : the number of the i-th type personnel required for the j-th bridge and tunnel operation and maintenance unit;
- : the average transportation benefit of the i-th type personnel assigned to the j-th bridge and tunnel operation and maintenance unit;
- : the direct income of four bridge and tunnel operation and maintenance units;
- : the total wages paid to 328 personnel per month;
- : the direct transportation benefits, ;
- : the direct income of the fixed part;
- : the direct income from the assignment;
- : the net profit generated by the i-th type personnel as the j-j-th bridge and tunnel operation and maintenance unit to the company;
- : the salary paid by the four bridge and tunnel operation and maintenance units to the i-th type personnel.
- (2)
- Model preparation
- (3)
- Integer programming model
- (4)
- Objective function
- (5)
- Constraints
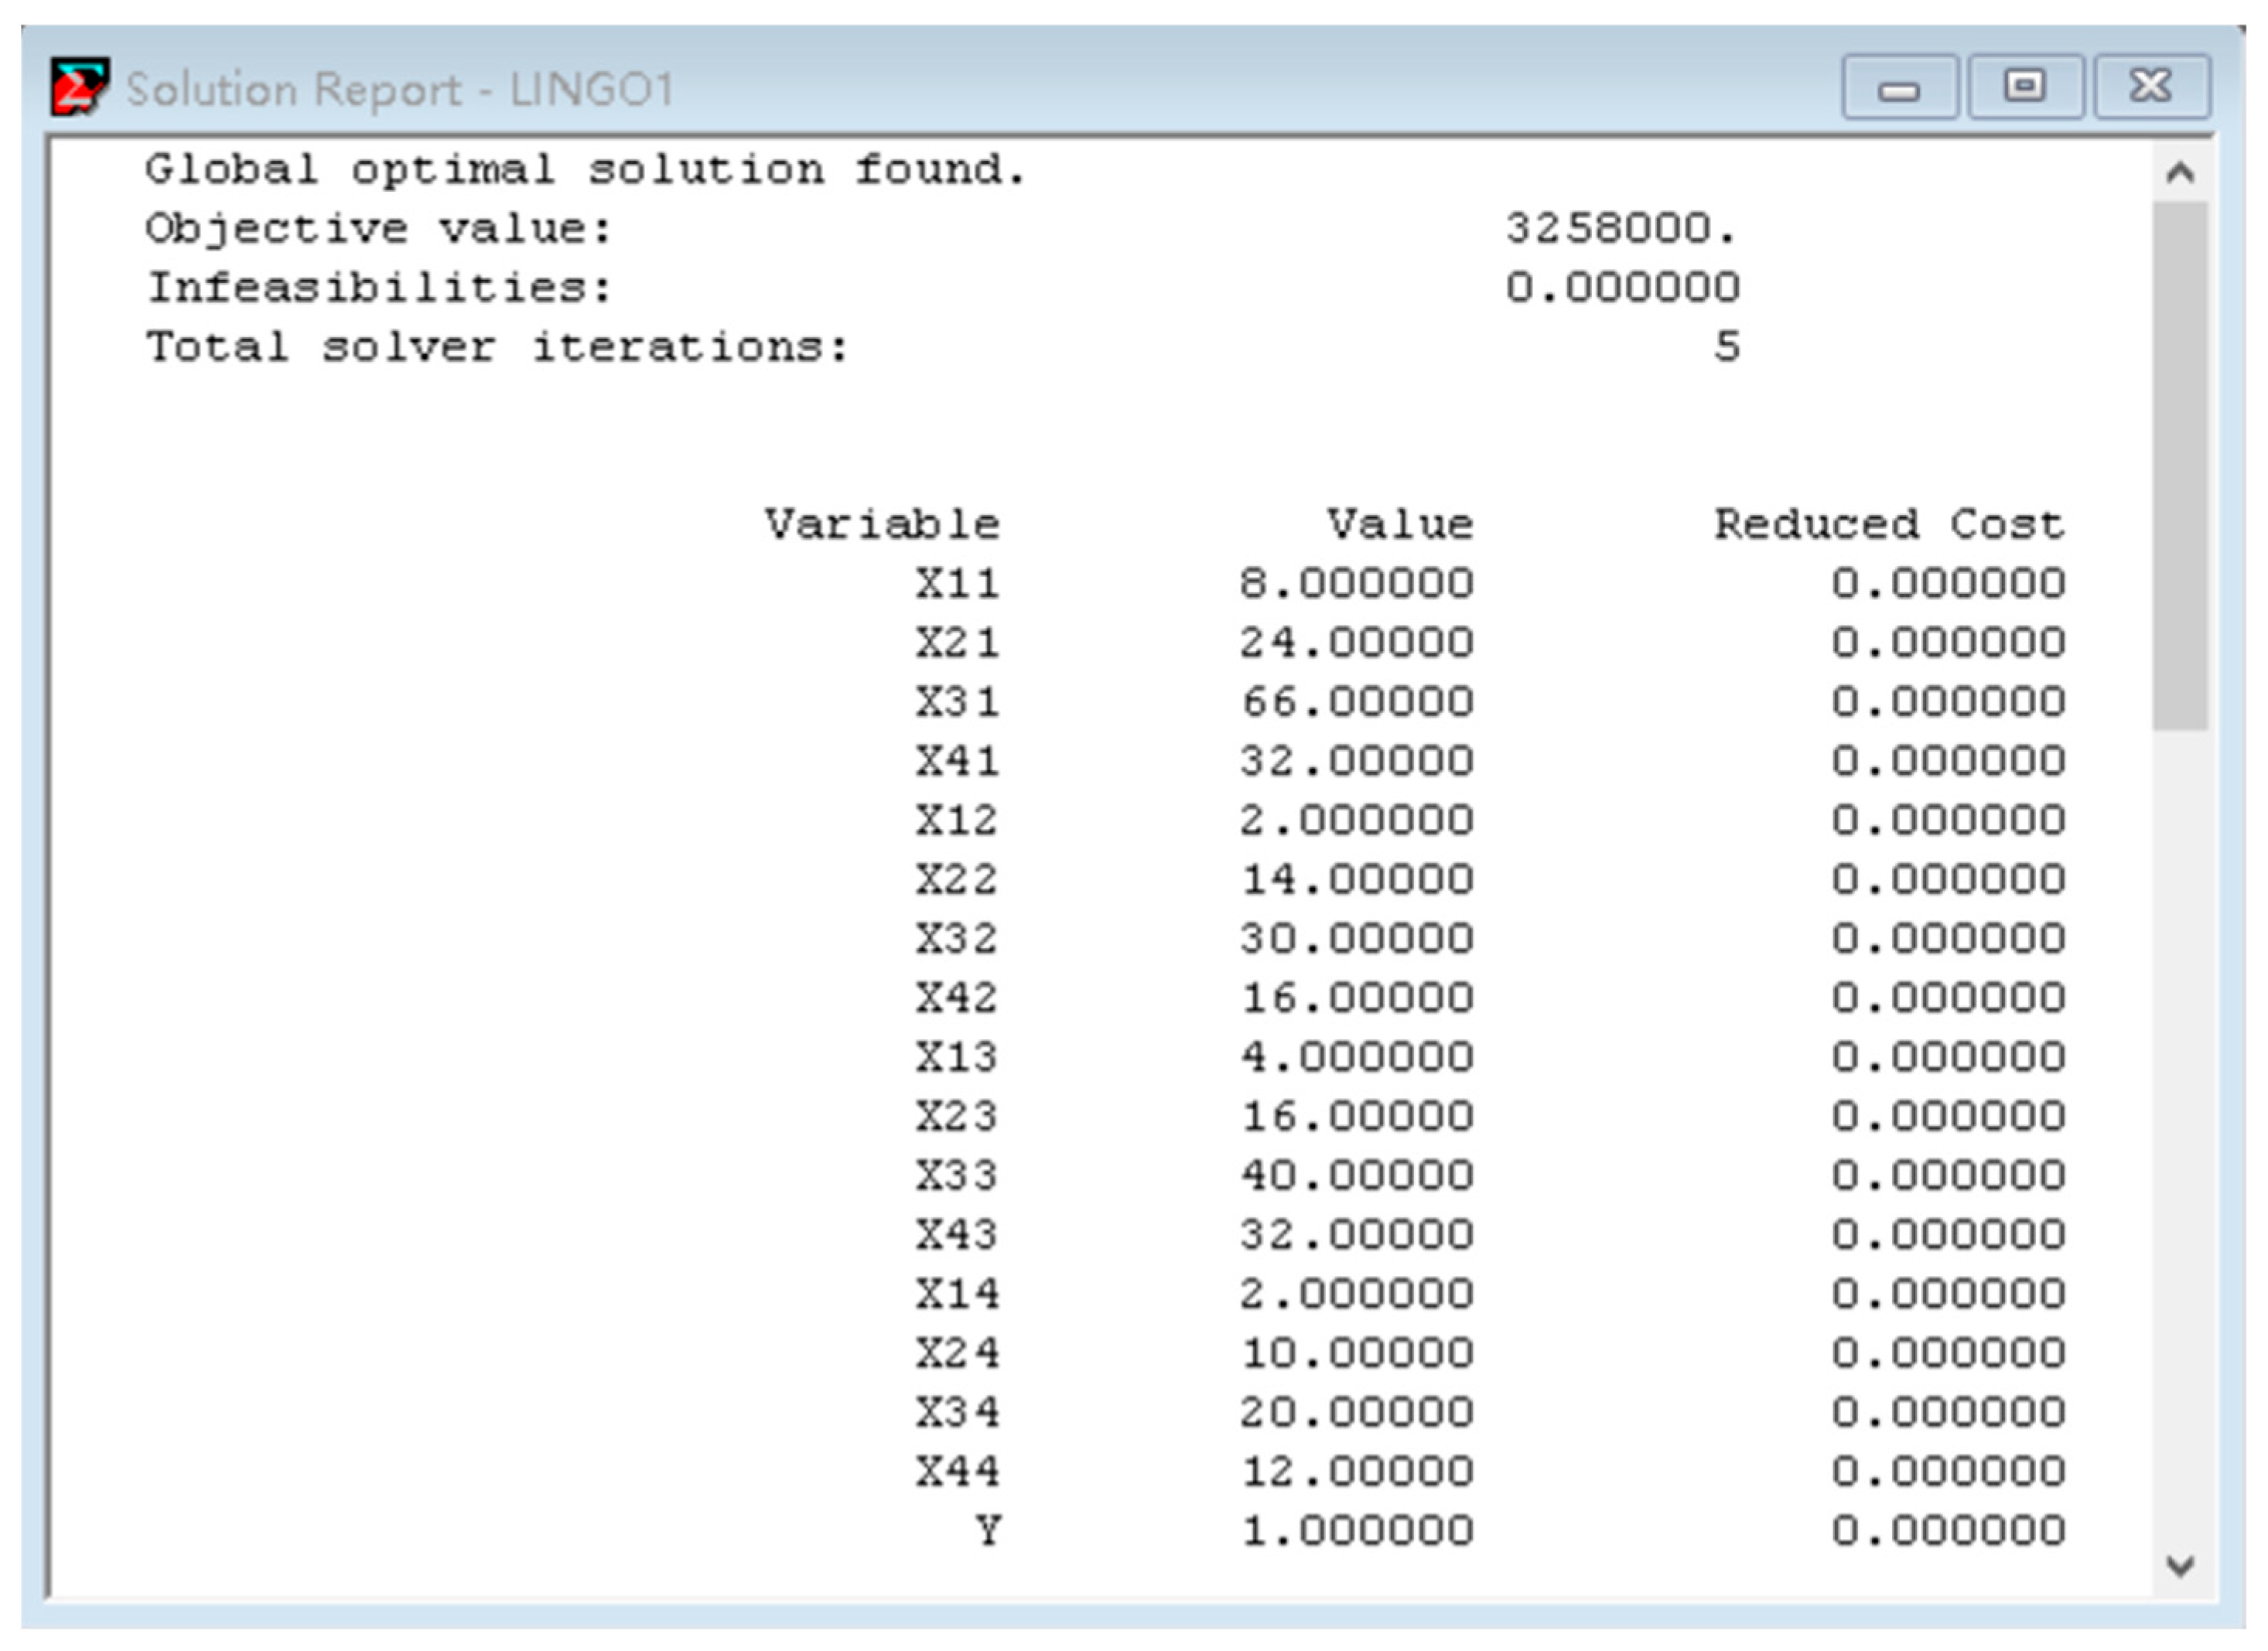
3.3. Model Solving
4. Analysis of the Optimal Allocation Model of Human Resources in the Past Three Years
4.1. Human Resources Planning
- (1)
- Recruitment
- (2)
- Training
- (3)
- Lower level
- (4)
- Dismissal
- (5)
- Overemployment
- (6)
- Non-staff personnel
4.2. Human Resource Model Analysis
- (1)
- Minimum dismissal model
- (2)
- Lowest cost model
4.3. Model Hypothesis
- (1)
- Assuming that the number of workers per year is just the estimated number, recruitment will occur in strict accordance with demand. The maximum number of recruits is the sum of the estimated workforce demand of the current year and the number of overstaffed workers;
- (2)
- Assuming that the cost is considered, only recruitment, training, demotion, and dismissal are involved. The salary and workload of all types of work are not taken into account;
- (3)
- Demotion does not only consider demotion; that is, senior workers are demoted to intermediate workers, intermediate workers are demoted to junior workers, and senior workers can also be demoted to junior workers;
- (4)
- The processes of staff reduction, recruitment, dismissal, retraining, and establishment of non-staff personnel are carried out in a short time at the beginning of each year, and recruitment, demotion, dismissal, and retraining are carried out after natural staff reduction;
- (5)
- After adjustment at the beginning of each year, the workforce demand of the Shuohuang Railway Company’s operation and maintenance project can be met, and there will be no changes to personnel in the next year;
- (6)
- When calculating the workload, a non-staff member is equal to half a regular worker. When calculating recruitment, retraining, demotion, dismissal, and overemployment dismissal, a non-staff person is calculated as an independent person. Non-staff personnel are the result of the company’s transfer of various types of work according to the needs of personnel transfer;
- (7)
- All types of workers (senior workers, intermediate workers, and junior workers) have the same opportunities to be dismissed, demoted, promoted, and trained;
- (8)
- This paper does not consider many of the uncertainties of future transportation conditions, including possible changes in transportation elasticity and external costs.
4.4. Model Building
- (1)
- Definition
- : j-th type workers employed in the i-th year (i represents the number of years from 0 to 3; j indicates the type of worker, where 1 represents junior workers, 2 represents intermediate workers, and 3 represents senior workers).
- : j-th type workers dismissed in the i-th year (i represents the number of years from 0 to 3; j indicates the type of worker, where 1 represents junior workers, 2 represents intermediate workers, and 3 represents senior workers).
- : recruitment of j-th type workers among non-staff personnel in the i-th year (i represents the number of years from 0 to 3; j indicates the type of worker, where 1 represents junior workers, 2 represents intermediate workers, 3 represents senior workers).
- : additional j-th type workers recruited in the i-th year (i represents the number of years from 0 to 3; j indicates the type of worker, where 1 represents junior workers, 2 represents intermediate workers, 3 represents senior workers).
- : j-th type workers recruited in the i-th year (i represents the number of years from 0 to 3; j indicates the type of worker, where 1 represents junior workers, 2 represents intermediate workers, 3 represents senior workers).
- : j-th type workers trained in the i-th year (i represents the number of years from 0 to 3; j indicates the type of worker, where 1 represents junior workers, 2 represents intermediate workers, 3 represents senior workers).
- : j-th type workers demoted in the i-th year (i represents the number of years from 0 to 3; j indicates the type of worker, where 1 represents junior workers, 2 represents intermediate workers, 3 represents senior workers).
- : j-th type workers promoted after demotion in the i-th year (i represents the number of years from 0 to 3; j indicates the type of worker, where 1 represents intermediate workers recovered after demotion, 2 represents senior workers that were promoted to intermediate level after being demoted, 3 represents senior workers recovered after being demoted to intermediate level, and 4 represents senior workers recovered after being demoted to primary level). Workers who have been reinstated do not need additional training.
- (2)
- Decision of variables:
- ①
- ②
- Number of workers recruited:
- ③
- Number of workers trained:
- ④
- Number of workers demoted:
- ⑤
- The number of demoted workers who are promoted again:
- ⑥
- Number of workers dismissed:
- ⑦
- Additional recruitment of all types of worker per year: .
- ⑧
- Number of non-staff recruited every year: .
- (3)
- Establish objective function:
- Objective function of minimum dismissal:
- Objective function of minimum cost model:
4.5. Model Solving
- (1)
- Minimum dismissal model
- (2)
- Lowest cost model
5. Conclusions and Discussion
5.1. Conclusions
- (1)
- Optimal allocation model of existing human resources
- (2)
- Optimal allocation scheme of the minimum dismissal model
- (i)
- Dismissal scheme: There is no need to dismiss workers;
- (ii)
- Recruitment scheme: Recruit 10 junior workers in the first year. Recruit 7 junior workers in the second year. A total of 6 junior workers were recruited in the second year;
- (iii)
- Staff training program: Training 30 junior workers and 12 intermediate workers in the first year. Training 18 intermediate workers in the second year. In the third year, 30 junior workers and 7 intermediate workers were trained;
- (iv)
- Additional recruitment scheme: Only four additional intermediate workers meeting the post requirements need to be recruited in the third year;
- (v)
- Employee demotion scheme: In the first year, 42 intermediate workers were demoted to junior workers and 35 senior workers were demoted to intermediate workers. In the second year, senior workers were demoted to two intermediate workers. In the third year, senior workers were demoted to 20 junior workers;
- (vi)
- Scheme for promotion and employment of workers after demotion: three workers will be restored after senior workers are demoted to junior workers in the second year. In the third year, 4 senior workers were reinstated after being demoted to intermediate workers, and 43 senior workers were reinstated after being demoted to primary workers.
- (3)
- Optimal allocation scheme of the lowest cost model
- (i)
- Dismissal plan: dismiss one junior worker whose working ability is not competent for the post requirements in the first year. There is no need to dismiss any category of worker in the second and third years;
- (ii)
- Recruitment Scheme: recruit six senior workers in the first year. Recruit four senior workers in the second year. In the third year, there is no need to recruit any type of worker;
- (iii)
- Staff training program: a total of 12 intermediate workers will be trained in the first year. Three intermediate workers will be trained in the second year. In the third year, there is no need to train any type of worker;
- (iv)
- Additional recruitment scheme: there is no need to recruit any additional category of worker;
- (v)
- Scheme for demotion of workers: in the first year, intermediate workers are demoted to six junior workers. In the second year, intermediate workers were demoted to 18 junior workers. In the third year, intermediate workers were demoted to 9 junior workers and senior workers to 30 junior workers;
- (vi)
- Scheme for promotion and employment of employees after demotion: 12 employees will be restored after senior workers are demoted to junior workers in the second year. In the third year, 11 intermediate workers were reinstated after being demoted to primary workers, and 64 senior workers were reinstated after being demoted to primary workers.
5.2. Discussion
Author Contributions
Funding
Data Availability Statement
Conflicts of Interest
References
- Drucker, P.F. The Practice of Management; Harper: New York, NY, USA, 1954. [Google Scholar]
- Dubois, D.D.; Rothwell, W.J. Competency-Based Human Resource Management; Davies-Black Publishing: Boston, MA, USA, 2004; pp. 2–8. [Google Scholar]
- Dyer, L. A Strategic Perspective Human Resource Management: Evolving Role and Responsibility; American Society for Personnel Administration, Bureau of National Affairs Books: Washington, DC, USA, 1989; pp. 10–34. [Google Scholar]
- Chatman, J.A. Improving interactional organizational research: A model of person-organization fit. Acad. Manag. Rev. 1989, 14, 333–349. [Google Scholar] [CrossRef]
- Kiker, D.S.; Motowidlo, S.J. Main and interaction effects of task and contextual performance-supervisory reward decisions. J. Appl. Psychol. 1999, 84, 602–609. [Google Scholar] [CrossRef]
- Kristof, A.L. Person-organization fit: An integrative review of its conceptualizations, measurement, and implications. Pers. Psychol. 2006, 49, 1–49. [Google Scholar] [CrossRef]
- Price, J.L. The Study of Turnover; University of Iowa Press: Ames, IA, USA, 1977; pp. 160–165. [Google Scholar]
- Lepak, D.P.; Snell, S.A. Examining the human resource architecture: The relationships among human capital, employment, and human resource configurations. J. Manag. 2002, 28, 517–543. [Google Scholar] [CrossRef]
- Heneman, H.G. Staffing Organization; McGraw-Hill College: New York, NY, USA, 2005; pp. 38–40. [Google Scholar]
- Demeulemeester, E.; Herroelen, W. A branch-and-bound procedure for the multiple resource-constrained project scheduling problem. Manag. Sci. 1992, 38, 1803–1881. [Google Scholar] [CrossRef]
- Joel, P.S.; Edward, W.D.; Basheer, M.K. Multiple resource–constrained scheduling using branch and bound. AIIE Trans. 1978, 10, 252–259. [Google Scholar]
- Demeulemeester, E.L.; Herroelen, W.S. New Benchmark results for the resource-constrained project scheduling problem. Manag. Sci. 1995, 43, 1485–1492. [Google Scholar] [CrossRef]
- Fayer, F.B. Some efficient multi-heuristic procedures for resource-constrained project scheduling. Eur. J. Oper. Res. 1990, 49, 3–13. [Google Scholar]
- Rainer, K. Serial and parallel resource-constrained project scheduling methods revisited: Theory and computation. Eur. J. Oper. Res. 1996, 90, 320–333. [Google Scholar]
- Bouleimen, K.; Lecocq, H. A new efficient simulated annealing algorithm for the resource-constrained project scheduling problem and its multiple mode version. Eur. J. Oper. Res. 2003, 149, 268–281. [Google Scholar] [CrossRef]
- Hartman, N.S. A competitive genetic algorithm for resource-constrained project scheduling. Nav. Res. Logist. 1998, 45, 733–750. [Google Scholar] [CrossRef]
- Hartmann, S.; Kolisch, R. Experimental evaluation of state-of-the-art heuristics for the resource-constrained project scheduling problem. Eur. J. Oper. Res. 2000, 127, 394–408. [Google Scholar] [CrossRef]
- Fendley, L.G. Towards the development of a complete multi-project scheduling system. J. Ind. Eng. 1968, 19, 505–515. [Google Scholar]
- Kurtulus, I.; Davis, E.W. Multi-project scheduling: Categorization of heuristic rules performance. Manag. Sci. 1982, 2, 161–172. [Google Scholar] [CrossRef]
- Schuler, R.S. Managing Human Resources, 5th ed.; West Publishing Co.: St. Paul, MN, USA, 1995. [Google Scholar]
- Bakke, E.W. The Human Resources Function; Yale Labor Management Center: New Haven, CO, USA, 1958; pp. 198–200. [Google Scholar]
- Ferguson, L.W. The Development of Industrial Psychology. In Industrial Psychology; McGraw-Hill Book Company: New York, NY, USA, 1961; pp. 18–27. [Google Scholar]
- Farmer, E. Early days in industrial psychology: An autobiographical note. Occup. Psychol. 1958, 32, 264–267. [Google Scholar]
- Harrell, T.W. Industrial Psychology. Annu. Rev. Psychol. 1953, 4, 215–238. [Google Scholar] [CrossRef]
- Cicourel, A. The front and back of organizational leadership: A case study. Pac. Sociol. Rev. 1958, 1, 54–58. [Google Scholar] [CrossRef]
- Robinson, S.P. Personnel: The Management or Human Resources; Prentice Hall: Hoboken, NJ, USA, 1978. [Google Scholar]
- Henneman, H.G.; Schwab, D.; Fossum, J.; Dyer, L.D. Personnel/Human Resource Management; Irwin: Toronto, ON, Canada, 1980. [Google Scholar]
- Beer, M.; Lawrence, B. Managing Human Assets; Free Press: New York, NY, USA, 1984. [Google Scholar]
- Fombrun, C.; Tichy, N.M.; Devanna, M.A. Strategic Human Resource Management; John Wiley: Hoboken, NJ, USA, 1984. [Google Scholar]
- Walton, R.E. Toward a Strategy of Eliciting Employee Commitment Based on Policies of Mutuality; Harvard Business School Press: Boston, MA, USA, 1985. [Google Scholar]
- Storey, J. Development in the Management Human Resources; Blackwell: Oxford, UK, 1992. [Google Scholar]
- Kamoche, K. Strategic human resource management within a resource capability view of the firm. J. Manag. Stud. 1996, 33, 213–233. [Google Scholar] [CrossRef]
- Schuler, R.S.; Huber, V.L. Personnel and Human Resource Management, 5th ed.; West Publishing Co.: St. Paul, MN, USA, 1993. [Google Scholar]
- Legee, K. Human Resource Management: A Critical Analysis; The Law Book Company Limited: London, UK, 1989. [Google Scholar]
- Moorhead, G.; Griffin, R.W. Organizational Behavior; Houghton Mifflin: Boston, MA, USA, 1992. [Google Scholar]
- Ouchi, W.G.; Theory, Z. How American Business Can Meet the Japanese Challenge; Addison Wesley: Boston, MA, USA, 1981. [Google Scholar]
- Peters, T.; Waterman, R. In Search of Excellence; Harper and Row: New York, NY, USA, 1982. [Google Scholar]
- Cheng, J. Residential land leasing and price under public land ownership. J. Urban Plan. Dev. 2021, 147, 05021009. [Google Scholar] [CrossRef]
- Cheng, J. Analysis of commercial land leasing of the district governments of Beijing in China. Land Use Policy 2021, 100, 104881. [Google Scholar] [CrossRef]
- Cheng, J. Analyzing the factors influencing the choice of the government on leasing different types of land uses: Evidence from Shanghai of China. Land Use Policy 2020, 90, 104303. [Google Scholar] [CrossRef]
- Cheng, J. Data analysis of the factors influencing the industrial land leasing in Shanghai based on mathematical models. Math. Probl. Eng. 2020, 2020, 9346863. [Google Scholar] [CrossRef]
- Cheng, J. Mathematical models and data analysis of residential land leasing behavior of district governments of Beijing in China. Mathematics 2021, 9, 2314. [Google Scholar] [CrossRef]
- Libardo, A.; Nocera, S. Transportation Elasticity for the Analysis of Italian Transportation Demand on a Regional Scale. Traffic Eng. Control 2008, 49, 187–192. [Google Scholar]
- Adenbaum, J.; Copeland, A.; Stevens, J. Do long-haul truckers undervalue future fuel savings? Energy Econ. 2019, 81, 1148–1166. [Google Scholar] [CrossRef]
- Forkenbrock, D.J. Comparison of external costs of rail and truck freight transportation. Transp. Res. Part A Policy Pract. 2001, 35, 321–337. [Google Scholar] [CrossRef]
- Nocera, S.; Cavallaro, F.; Irranca Galati, O. Options for reducing external costs from freight transport along the brenner corridor. Eur. Transp. Res. Rev. 2018, 10, 53. [Google Scholar] [CrossRef]


| Personnel Category | Management | Senior Worker | Intermediate Worker | Junior Worker |
|---|---|---|---|---|
| Number of people | 16 | 64 | 156 | 92 |
| Salary (CNY/month) | 8000 | 6000 | 5000 | 4000 |
| Personnel Category | Average Transportation Benefit (CNY/Month) | |||
|---|---|---|---|---|
| A | B | C | D | |
| Management | 30,000 | 20,000 | 26,000 | 15,000 |
| Senior worker | 22,000 | 10,000 | 16,000 | 8000 |
| Intermediate Worker | 18,000 | 15,000 | 13,000 | 12,000 |
| Junior worker | 15,000 | 8000 | 10,000 | 6000 |
| ρ11 | ρ12 | ρ13 | ρ14 | ρ21 | ρ22 | ρ23 | ρ24 |
| 22,000 | 12,000 | 18,000 | 7000 | 16,000 | 4000 | 10,000 | 2000 |
| ρ31 | ρ32 | ρ33 | ρ34 | ρ41 | ρ42 | ρ43 | ρ44 |
| 13,000 | 10,000 | 8000 | 7000 | 11,000 | 4000 | 6000 | 2000 |
| Personnel Category | Personnel Structure Restrictions | |||
|---|---|---|---|---|
| A | B | C | D | |
| Management | 8~10 8~10 | 2~4 2~4 | 4~8 4~8 | 2~4 2~4 |
| Senior worker | 20~30 20~30 | ≥14 ≥14 | 16~24 16~24 | ≥10 ≥10 |
| Intermediate worker | ≥50 ≥50 | 30~36 30~36 | ≥40 ≥40 | 20~30 20~30 |
| Junior worker | ≥30 ≥30 | ≥16 ≥16 | ≥24 ≥24 | ≥12 ≥12 |
| Total | ≤130 ≤130 | ≤90 ≤90 | ≤110 ≤110 | ≤70 ≤70 |
| Personnel Category | Optimal Staffing Structure | |||
|---|---|---|---|---|
| A | B | C | D | |
| Management | 8 | 2 | 4 | 2 |
| Senior worker | 24 | 14 | 16 | 10 |
| Intermediate worker | 66 | 30 | 40 | 20 |
| Junior worker | 32 | 16 | 32 | 12 |
| Total | 130 | 62 | 92 | 44 |
| Personnel Category | Management | Senior Worker | Intermediate Worker | Junior Worker |
|---|---|---|---|---|
| Current number | 16 | 64 | 156 | 92 |
| First year | 16 | 80 | 128 | 86 |
| Second year | 16 | 94 | 102 | 76 |
| Third year | 16 | 106 | 76 | 28 |
| Classification | Junior Worker | Intermediate Worker | Senior Worker |
|---|---|---|---|
| Less than one year of work | 20% 20% | 15% 15% | 9% 9% |
| Work for more than one year of work | 10% 10% | 6% 6% | 3% 3% |
| Personnel Category | Junior Worker | Intermediate Worker | Senior Worker | |
|---|---|---|---|---|
| Number of workers | Current | 92 | 156 | 64 |
| First year | 86 | 128 | 80 | |
| Second year | 76 | 102 | 94 | |
| Third year | 28 | 76 | 106 | |
| Number of dismissed workers | First year | 0 | 0 | 0 |
| Second year | 0 | 0 | 0 | |
| Third year | 0 | 0 | 0 | |
| Number of workers recruited | First year | 10 | 0 | 0 |
| Second year | 7 | 0 | 0 | |
| Third year | 6 | 0 | 0 | |
| Number of trained workers | First year | 30 | 12 | 0 |
| Second year | 0 | 18 | 0 | |
| Third year | 0 | 7 | 0 | |
| Number of additional workers recruited | First year | 0 | 0 | 0 |
| Second year | 0 | 0 | 0 | |
| Third year | 0 | 4 | 0 | |
| Personnel Category | Intermediate to Senior | Junior to Senior | Junior to Intermediate | |
|---|---|---|---|---|
| Number of demoted workers | First year | 42 | 0 | 35 |
| Second year | 0 | 0 | 2 | |
| Third year | 0 | 20 | 0 | |
| Personnel Category | Intermediate Workers Recovered after Demotion | Senior Workers Promoted to Intermediate Level after Being Demoted to Junior Level | Senior Workers Recovered after Being Demoted to Intermediate Level | Senior Workers Recovered after Being Demoted to Primary Level | |
|---|---|---|---|---|---|
| Increase in the number of workers after demotion | First year | 0 | 0 | 0 | 0 |
| Second year | 0 | 0 | 0 | 3 | |
| Third year | 0 | 0 | 4 | 43 | |
| Personnel Category | Junior Worker | Intermediate Worker | Senior Worker | |
|---|---|---|---|---|
| Number of workers | Current | 46 | 78 | 32 |
| First year | 43 | 64 | 40 | |
| Second year | 38 | 51 | 47 | |
| Third year | 14 | 38 | 53 | |
| Number of dismissed workers | First year | 1 | 0 | 0 |
| Second year | 0 | 0 | 0 | |
| Third year | 0 | 0 | 0 | |
| Number of workers recruited | First year | 0 | 0 | 6 |
| Second year | 0 | 0 | 4 | |
| Third year | 0 | 0 | 0 | |
| Number of trained workers | First year | 0 | 12 | 0 |
| Second year | 0 | 3 | 0 | |
| Third year | 0 | 0 | 0 | |
| Number of additional workers recruited | First year | 0 | 0 | 0 |
| Second year | 0 | 0 | 0 | |
| Third year | 0 | 0 | 0 | |
| Personnel Category | Intermediate to Senior | Junior to Senior | Junior to Intermediate | |
|---|---|---|---|---|
| Number of demoted workers | First year | 6 | 0 | 0 |
| Second year | 18 | 0 | 0 | |
| Third year | 9 | 30 | 0 | |
| Personnel Category | Intermediate Workers Recovered after Demotion | Senior Workers Promoted to Intermediate Level after Being Demoted to Junior Level | Senior Workers Recovered after Being Demoted to Intermediate Level | Senior Workers Recovered after Being Demoted to Primary Level | |
|---|---|---|---|---|---|
| Increase the number of workers after demotion | First year | 0 | 0 | 0 | 0 |
| Second year | 0 | 0 | 0 | 12 | |
| Third year | 0 | 0 | 11 | 64 | |
| Personnel Category | Optimal Staffing Structure | |||
|---|---|---|---|---|
| A | B | C | D | |
| Management | 8 | 2 | 4 | 2 |
| Senior worker | 24 | 14 | 16 | 10 |
| Intermediate worker | 66 | 30 | 40 | 20 |
| Junior worker | 32 | 16 | 32 | 12 |
| Total | 130 | 62 | 92 | 44 |
Publisher’s Note: MDPI stays neutral with regard to jurisdictional claims in published maps and institutional affiliations. |
© 2022 by the authors. Licensee MDPI, Basel, Switzerland. This article is an open access article distributed under the terms and conditions of the Creative Commons Attribution (CC BY) license (https://creativecommons.org/licenses/by/4.0/).
Share and Cite
Shen, L.; Liu, K.; Chai, J.; Ma, W.; Guo, X.; Li, Y.; Zhao, P.; Liu, B. Research on the Mathematical Model for Optimal Allocation of Human Resources in the Operation and Maintenance Units of a Heavy Haul Railway. Mathematics 2022, 10, 3707. https://doi.org/10.3390/math10193707
Shen L, Liu K, Chai J, Ma W, Guo X, Li Y, Zhao P, Liu B. Research on the Mathematical Model for Optimal Allocation of Human Resources in the Operation and Maintenance Units of a Heavy Haul Railway. Mathematics. 2022; 10(19):3707. https://doi.org/10.3390/math10193707
Chicago/Turabian StyleShen, Linfang, Kuoyu Liu, Jinfei Chai, Weibin Ma, Xiaoxiong Guo, Yao Li, Peng Zhao, and Boying Liu. 2022. "Research on the Mathematical Model for Optimal Allocation of Human Resources in the Operation and Maintenance Units of a Heavy Haul Railway" Mathematics 10, no. 19: 3707. https://doi.org/10.3390/math10193707
APA StyleShen, L., Liu, K., Chai, J., Ma, W., Guo, X., Li, Y., Zhao, P., & Liu, B. (2022). Research on the Mathematical Model for Optimal Allocation of Human Resources in the Operation and Maintenance Units of a Heavy Haul Railway. Mathematics, 10(19), 3707. https://doi.org/10.3390/math10193707