Article

Numerical Analysis of Building Cooling Using New Passive Downdraught Evaporative Tower Configuration in an Arid Climate

by
Mohammad Abdullah Alshenaifi
1,
Abdelhakim Mesloub
1,
Walid Hassen
2,
Mohammed Awad Abuhussain
3 and
Lioua Kolsi
4,*
1
Department of Architectural Engineering, College of Engineering, University of Ha’il, Ha’il 2440, Saudi Arabia
2
Laboratory of Metrology and Energy Systems, University of Monastir, Monastir 5000, Tunisia
3
Architectural Engineering Department, College of Engineering, Najran University, Najran 66291, Saudi Arabia
4
Department of Mechanical Engineering, College of Engineering, University of Ha’il, Ha’il 2440, Saudi Arabia
*
Author to whom correspondence should be addressed.
Mathematics 2022, 10(19), 3616; https://doi.org/10.3390/math10193616
Submission received: 5 August 2022 / Revised: 11 September 2022 / Accepted: 26 September 2022 / Published: 2 October 2022

Abstract

:
Building energy consumption in hot arid climates is dominated by air conditioning use. Therefore, using passive cooling methods could reduce this demand, improve resource efficiency, and decrease carbon emissions. In this study, an innovative configuration of a passive downdraught evaporative cooling (PDEC) tower is investigated numerically. The governing equations are solved using the finite element method (FEM), and the effects of inlet velocity (0.5 m·s−1 ≤ uin ≤ 3 m·s−1) and temperature (35 °C ≤ Tin ≤ 45 °C) on the fluid structure, temperature field, and relative humidity are studied for three cases related to the position of the air outlet. The flow is considered as turbulent, and the building walls and the tower are assumed to be thermally well insulated. The PDEC tower is equipped with two vertical isotropic saturated porous layers. The results revealed that the inlet velocity and temperature play an essential role in the quality of the indoor temperature. In fact, the temperature can be reduced by about 7 degrees, and the relative humidity can be enhanced by 9% for lower inlet velocities.

1. Introduction

Global primary energy demand and global CO2 emissions have increased significantly in recent decades. Fossil fuels provided nearly 84% of total global energy in 2019 [1]. The use of fossil fuels to produce energy for buildings is a crucial contributor to greenhouse gas (GHG) emissions, which are now known to be related to global warming. In this context, more than one third of worldwide energy consumption and almost 40% of overall CO2 emissions are due to buildings and construction activity related to this sector [2,3]. The demands of these industries increase due to an effort to improve energy access in developing nations, the increased ownership and use of energy-consuming devices, and the expansion shown in global buildings’ total floor area.
The construction sector has also been exposed to rapid growth, urbanization, and developmental progress, facilitating a greater standard of living for its rapidly expanding population. Due to the widespread use of air conditioning, the building industry has had robust energy demands, making it the leading contributor to high energy use.
Buildings consume approximately 75% of the total electricity generated; air conditioning represents half of this figure. Thus, reducing or replacing air conditioning use in buildings with passive cooling systems could significantly influence energy consumption and greenhouse gas emissions. In this regard, numerous strategies have been used to cool buildings in hot climates using vernacular architecture approaches, including internal courtyards and ponds [4], occasionally along with stack ventilation (wind towers) [5,6] to help encourage air movement for the production of evaporative cooling. Contemporary approaches have advanced these vernacular practices to provide passive cooling through an environmental heat sink [7]. Different solutions must be thought of to further shift from active to passive cooling, as the latter uses extremely little or even zero energy. Passive cooling techniques involved in the cooling of buildings exploit natural heat sinks, for example the ground, sky, ambient air, and water [8,9].
Numerous passive cooling techniques are used under various climate conditions, depending on the available natural energy sources, such as cooling with ventilation, radiant cooling, evaporative cooling, and earth cooling [10]. An increased level of attention has been paid to the integration of passive cooling strategies in buildings in order to reduce cooling loads while still providing acceptable indoor thermal comfort. Passive cooling can effectively reduce the energy consumption from air conditioners, whereas the cooling load of the buildings/rooms are dominated by the thermal properties of building envelopes, indoor heat sources, and outdoor climates. Due to the climate dependence of passive cooling methods, there are always concerns associated with their applicability to specific climates or climatic conditions, which leads to investigations of them before considering them as a cooling method for a specific climate or building.
Passive downdraught evaporative cooling (PDEC) towers are categorized as an evaporative cooling technique [8]. A PDEC tower consists of a wind catcher at the top of a tower, an evaporative/water medium, and a shaft to deliver the caught, evaporatively cooled air to an occupied space via openings at the bottom of the tower [11]. PDEC is frequently referred to as a “reverse thermal chimney” as air is drawn downwards, instead of upwards, as in an ordinary thermal chimney [10]. PDEC catches external air at the tower’s top, lowering its temperature via evaporative cooling, before finally releasing the cooled air to the desired internal environment [12,13]. The whole process operates passively, as evaporative cooling leads to a raised air density, which in turn results in the air dropping through the tower and into the desired location, with no requirement for mechanical ventilation. PDEC cooling can help reduce the air temperature and can thus be considered to have the potential to provide considerable cooling in hot arid areas. A major advantage of such applications is the substantial energy savings they ensure. The PDEC technique has been employed for hundreds of years. In more recent times, particularly after the 1970s energy crisis, it has become a subject of growing interest.
A number of investigations has been conducted, particularly by Bowman et al. [14], Givoni [15], Pearlmutter et al. [16], and Ford et al. [17]. Contemporary applications of PDEC towers can be classified as four different types based on the evaporation method: (1) shower Towers (large droplets of spray), (2) PDEC with wetted porous ceramic, (3) cool towers (wetted pads), and (4) misting towers (misting nozzles).
The performance of PDEC systems has developed significantly in the last decades. Moreover, several experimental and computational studies have investigated the applicability and opportunity for further developments of the system in different parts of the world. In an experimental study, Pearlmutter et al. [16] indicated that most of the designs attain the greatest drop in temperature at the top of the tower as a consequence of direct contact here between the air and water. Different PDEC configurations were investigated, including fan assisted designs. Ford et al. [17] discussed the performance of a PDEC in a small experimental prototype house. This is considered the initial European application and performance analysis of this type of cooling technology for a housing case. Belarbi et al. [18] examined the cooling ability of the PDEC system by investigating the effect of water droplet size and distance between nozzles. Kang and Strand [19,20] conducted studies using a parametric computational analysis approach to maximize PDEC performance by manipulating the components of the water system components and the tower. The authors concluded that PDEC can lead to important energy savings and acceptable indoor air quality. Similar studies were performed by Alaidaroos and Kararti [21,22,23] following a similar approach to optimize a ventilated wall cavity in terms of energy, water use, and thermal comfort. Most of the performed numerical studies have been limited to investigating only the tower without paying attention to the building itself. Thus, in this study, the whole system, including the tower and the building, is considered in the computational domain. In addition, a new configuration consisting of the use of vertical layers of porous medium is considered. Such a configuration allows for the improvement of the indoor air quality in hot and arid climates without the need for high energy consumption compared to the spray systems. The configuration is complex and includes several phenomena: fluid flow, conduction, convection, mass diffusion, and porous medium.

2. Governing Equations and Numerical Procedure
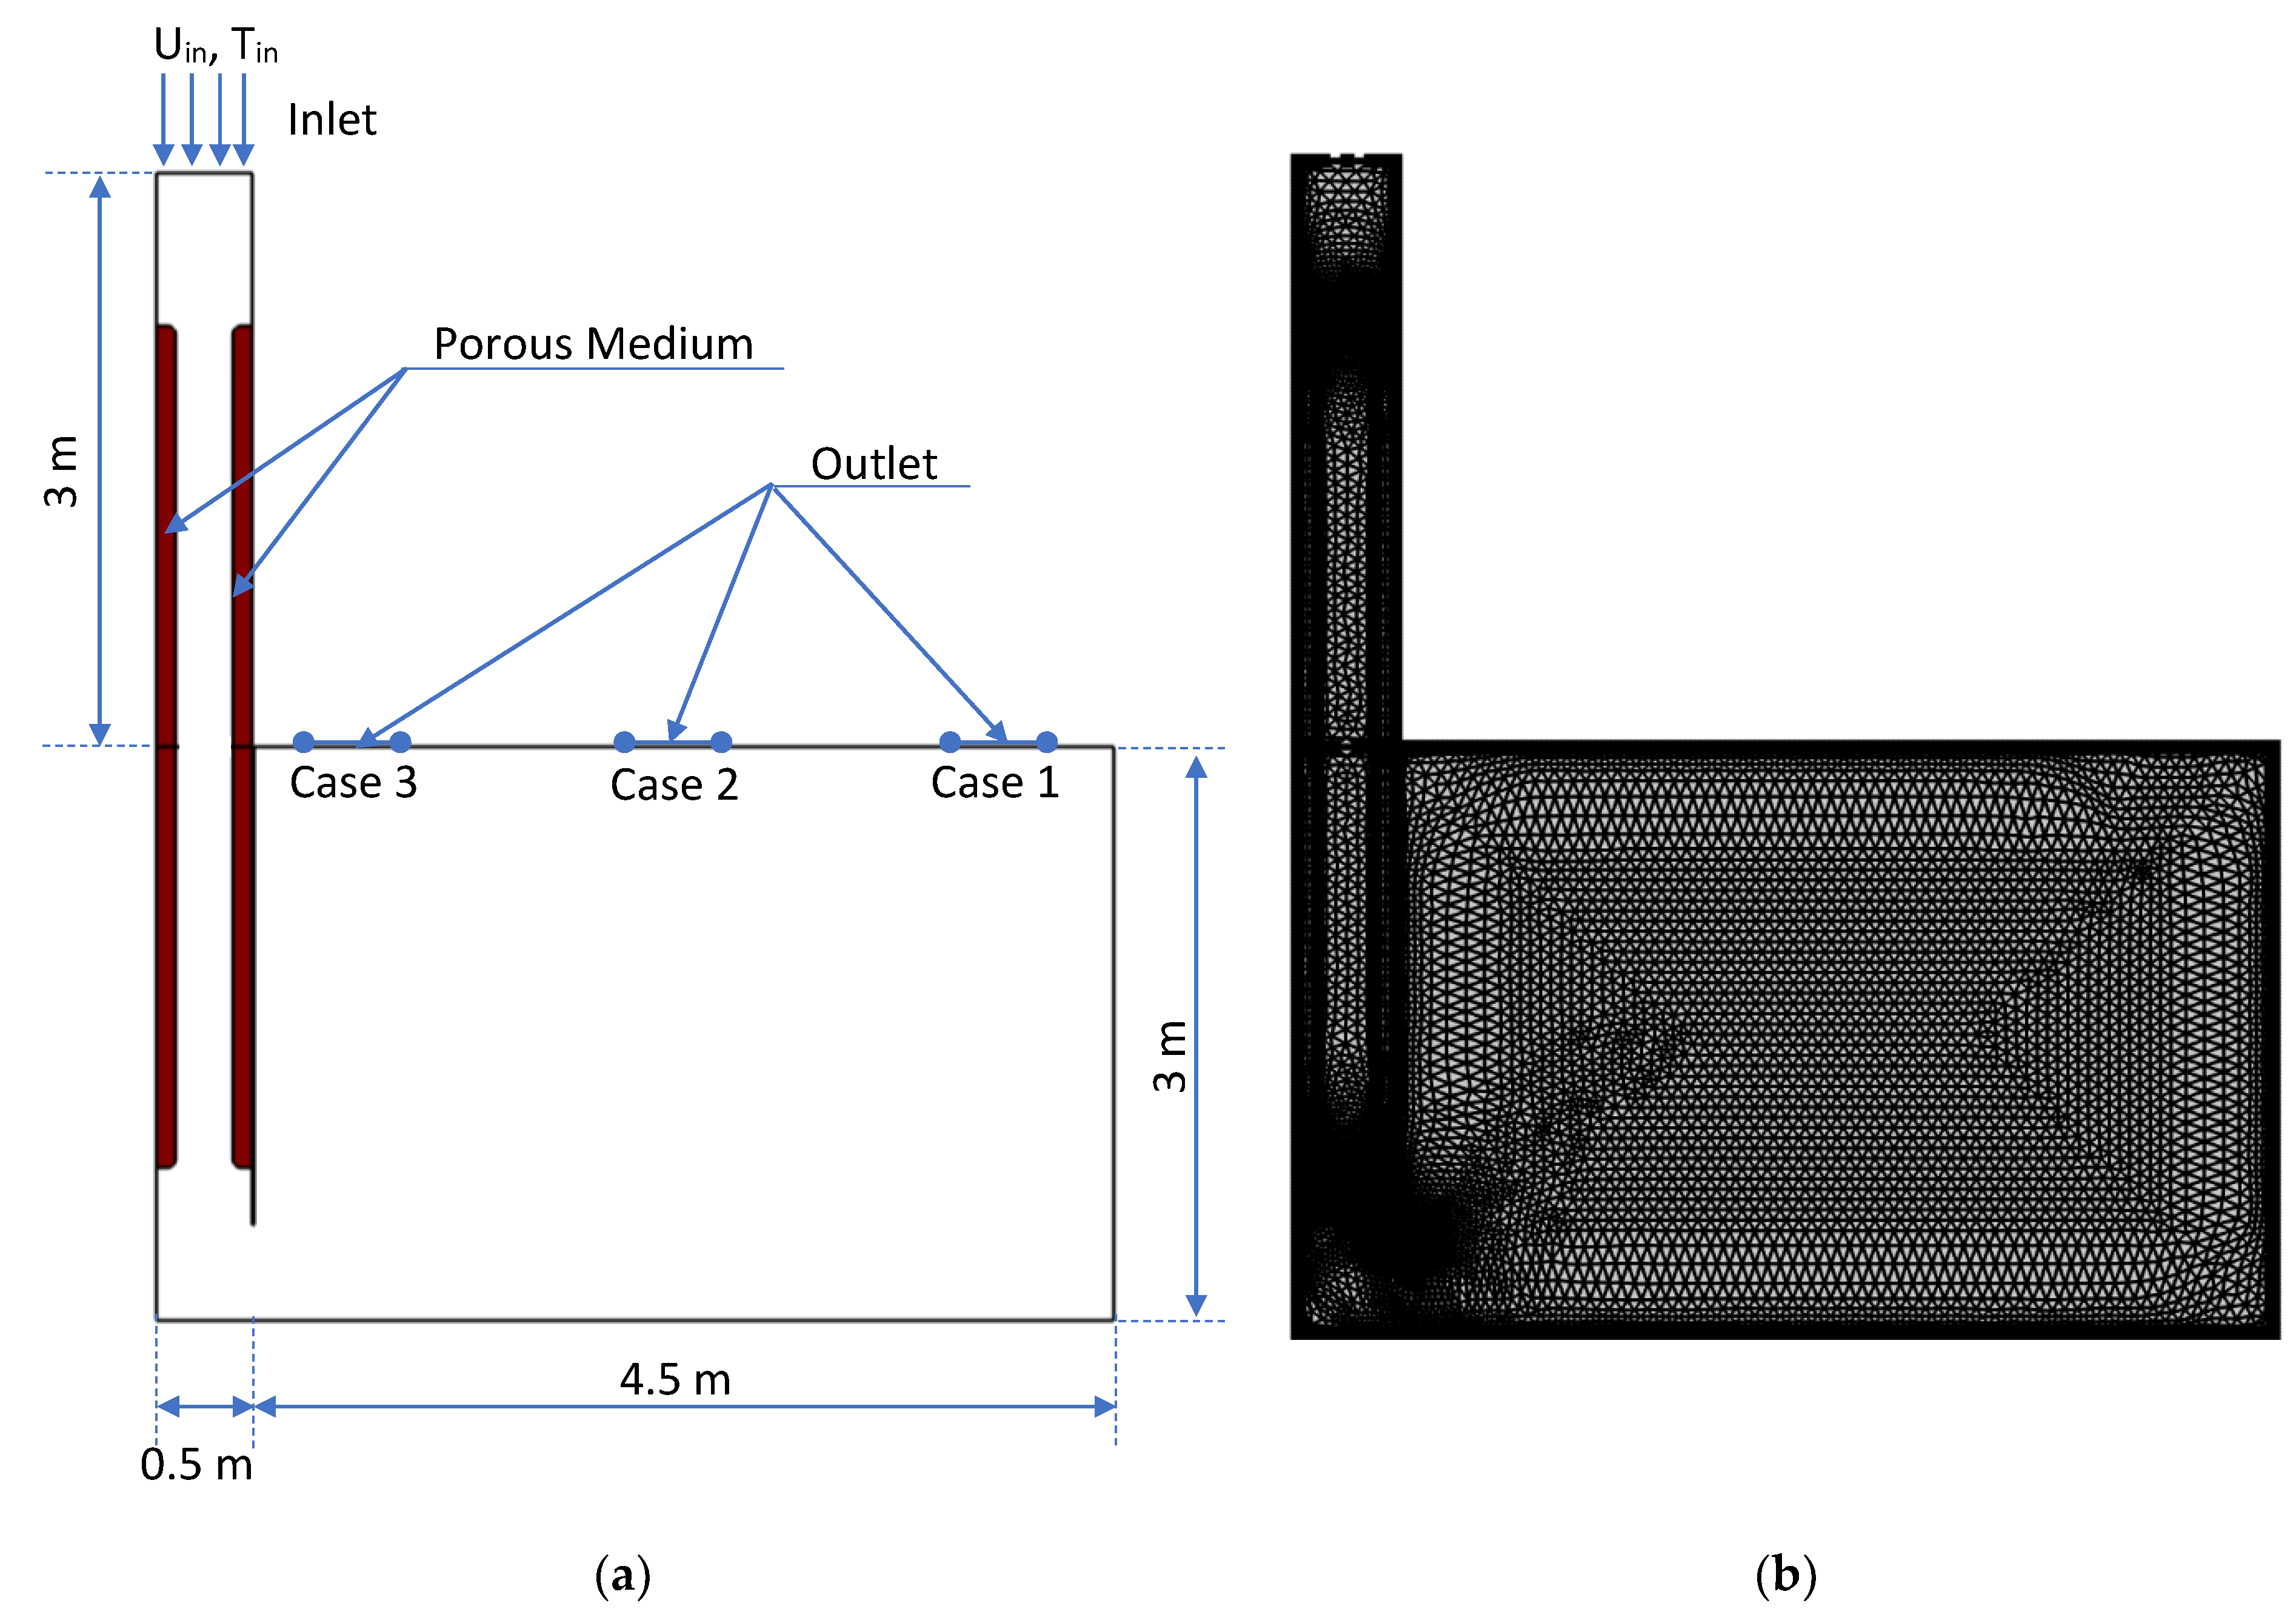
Figure 1 shows a 2D layout of the studied domain. It consists of a passive downdraft evaporative cooling system composed of a wind catcher placed at the top of the tower. This tower, with a length of 5 m and a width of 0.5 m, acts as an “inverted thermal chimney” and is partially covered on its inner surface by a porous evaporation/water medium. The tower’s bottom is connected to a chamber of 4.5 m × 3 m in size through an opening. A 0.5 m long air outlet system is mounted on the room’s roof to promote natural ventilation.
Since the purpose is to evaluate the performance of such cooling systems in arid areas, the relative humidity was set at 25%, and the climatic conditions were varied so that the temperature ranged between 35 °C and 45 °C and the wind velocity between 0.5 m/s and 3 m/s. Three scenarios were explored based on the air outlet position. Case 1: right air outlet; Case 2: center air outlet; and Case 3: left air outlet.
The turbulent air flow mass, momentum, and energy conservation equations are given as follows:
ρ air t + x i ( ρ air U i ) = 0
t ( ρ air U i ) + x j ( ρ air U i U j ) = p x i + x j [ μ air ( U i x j + U j x i 2 3 δ i j U l x l ) ] + x j ( ρ air U i U j ¯ )
ρ air T t + ρ air T U j x j = x j [ μ air P r T x j ρ air T U ]
The last term in Equation (2), called the Reynolds stress, represents the turbulence effect. The Boussinesq approximation relates the Reynolds stress to the average gradient velocity. This term can be written as:
ρ air U i U j ¯ = μ T u ( U i x j + U j x i ) 2 3 ( ρ air k + μ T U k x k ) δ i j
t ( ρ air C P , air T ) + x j ( ρ air C P , air U i T ) = x j ( λ air T x j )
Based on previous numerical studies related to passive downdraft evaporative cooling towers (PDEC) [20], the appropriate turbulence model to close the above equations is the k-ε model.
For the k-ε model, the turbulent viscosity defined in Equation (4) is calculated for this model using the following equation:
μ T u = ρ air C μ k 2 ε
where k is turbulent kinetic energy (m2/s2), and ε is the turbulent energy dissipation ratio (m2/s).
The transport equations for the turbulent kinetic energy, k, and its dissipation rate, ε, are determined from the following:
( ρ air k ) t + ( ρ air k U i ) x i = x j [ ( μ air + μ T u σ k k x j ) ] + G k + G b ρ air ε Y M + S k *
( ρ air ε ) t + ( ρ air ε U i ) x i = x j [ ( μ air + μ T u σ ε ε x j ) ] + C 1 ε ε k ( G k + C 3 ε G b ) C 2 ε ρ air ε 2 k + S ε *
Gk is the production of turbulence kinetic energy
G k = ρ air U i U j ¯ U j x i
Using the Boussinesq hypothesis, Gk can be written as:
G k = μ T S * 2
Here, S* is the average rate-of-strain tensor, given by:
S * 2 S i j * S i j *
with
S i j * = 1 2 ( U i ¯ x j + U j ¯ x i )
Gb is the generation of turbulence due to buoyancy forces
G b = β g i μ T u Pr t T x i
Prt is the turbulent Prandtl number, and gi is the component of the gravitational vector. For the standard k-ε models, a default value of Prt can be set to 0.85.
β is the coefficient of thermal expansion, defined as:
β = 1 ρ ( ρ a i r T ) P
YM is the dilatation dissipation term, which can be written as follows:
Y M = 2 ρ air ε k a 2
where a is the speed of sound.
All other constants of Equation (7) and Equation (8) are summarized in Table 1.
Concerning the porous medium, it is considered multiphasic and isotropic. It is composed of a matrix of solid pores filled with water, air, and steam. To express the relations between the different phases in a convenient way, it is assumed that in a given elementary volume of the porous medium, we can write [25]:
Δ V = Δ V S + Δ V W + Δ V g
The subscripts “s”, “w”, and “g” represent the solid, liquid water, and gaseous phases, respectively.
The proportion of water and gas volume in the stated ΔV is defined as porosity ϕ.
ϕ = Δ V W + Δ V g Δ V
The volume fraction of water and gas in the pore volume corresponds to the water saturation SW and the gas saturation Sg, respectively.
S W = Δ V W Δ V W + Δ V g = Δ V W ϕ Δ V
S g = Δ V g Δ V W + Δ V g = Δ V g ϕ Δ V
According to the mass conservation law, the mass equations in the tower equipped with a porous medium are given below.
The mass balance equation for air:
C air t + n air , i x i = 0
The mass balance equation for liquid water and gaseous phases in porous media:
C W t + n W , i x i = R e v a p
C g t + n g , i x i = R e v a p
where Revap represents the evaporation rate, and (nW,CW) and (ng,Cg) are the mass fluxes and the concentrations of water liquid and water steam, respectively.
In the porous media, gases such as water vapor can migrate by molecular diffusion. The diffusion process can be defined by Fick’s law, as stated below.
n g d i f f = D g C g x
Gas transport in the porous medium can also be achieved by pressure effects. Darcy’s law, in Equation (24), allows us to describe this phenomenon:
n g press = ρ g κ g μ g P x
where μg is the viscosity of the gas, ρg is the density of the gas, and P is the total pressure in the gas phase.
The gas phase permeability κg is given by [26]:
κ g = κ   κ r , g
where κ is named the intrinsic permeability [27]:
κ = 1 8 τ i Δ β i r i 2
where Δβi is the volume fraction of pores in the i-th class having radius ri, and τ is the tortuosity and can be defined as the quotient of the length of a fluid element measured between two points and the straight-line length between the same two points.
More simply, the intrinsic permeability can also be obtained graphically from the curves given in Ref. [28].
For the relative gas permeability κr,g which varies between 0 and 1, it can be determined by [28]:
κ r , g = { 1 1.1   S W S W 1 / 1.1 0   S W 1 / 1.1
Regarding the mass flow of the water liquid phase nW of Equation (21), it is created by the inertial forces due to the gas pressure and is slowed down by the capillary forces due to the concentration gradient and the capillary forces due to the temperature gradient.
This flow is calculated by the following relation:
n W = ρ W D C C W x D T T x
The quantities DC and DT represent the capillary diffusivity and temperature diffusivity, respectively.
D C = ρ W κ W μ W p C C w
D T = ρ W κ W μ W p C T
The water phase permeability κW is given by [26]:
κ w = κ   κ r , w
with the intrinsic permeability κ defined in Equation (26), and the relative water permeability κr,w given by [28]:
κ r , W = { ( S W S W , i r r 1 S W , i r r ) 3   S W S W , i r r 0   S W S W , i r r
SW,irr refers to the irreducible liquid phase saturation set at SW,irr = 0.1 [29].
The energy equation in porous media can be expressed as follows:
t ( ρ eff C P , eff T ) + x j ( n g , i C P , g T + n a i r , i C P , a i r T + n W , i C P , W T ) = x j ( λ eff T x j ) R evap h evap
where hevap denotes the latent heat of evaporation (J/kg).
The effective thermophysical properties of the porous medium in Equation (33) are estimated by the following equation [25,28]:
ρ eff = ϕ ( S W ρ W + S g ρ g ) + ( 1 ϕ ) ρ s λ eff = ( 1 ϕ ) λ s + ϕ λ W S W + ϕ λ g ( 1 S g ) ρ eff C P , eff = ( 1 ϕ ) ρ s C P , s + ϕ ρ W C P , W S W + ϕ ρ g C P , g ( 1 S W ) D eff = D va . ε 0.75 . S g 3.33
where D va = 2.6 × 10 5   m · s - 1 is the vapor-air diffusivity.
The porosity and permeability of the porous matrix are fixed at 0.8 and 1 × 10⁻¹⁴, respectively. The properties of the phases of the porous moist layers are presented in Table 2. It is also to be mentioned that the evaporation rate, universal gas constant, and latent heat of evaporation are fixed at 1000 s−1, 8.314 J·mol−1·K−1, and 2.26 × 10³ kJ·kg−1, respectively.
The imposed boundary conditions are expressed as follows:
  • At the inlet: Uy = –uin, T = Tin, P = P amb , k = 3 2 ( I . u i n ) 2 , ε = C μ k 3 2 0.07 D , I = 0.16 Re 1 8 , and φ = 0.25.
  • At the outlet: U x y = U y y = k y = ε y = T y = C y = 0 ; P = P amb .
  • At the walls: U x = U y = k = ε = T n = C n = 0 , where n is the normal vector.
COMSOL Multiphysics based on the finite element method (FEM) is used to study the configuration. The Galerkin weighted technique is used to solve the non-linear multiphysics governing equations. The governing equations are written in weak form, and the field variables are approximated with Lagrange FEs and solved using the direct PARDISO solver. In addition, a second-order backward differentiation formula (BDF) is used for the time-dependent terms.
The following convergence criterion is to be satisfied for each variable ( Ω ):
max | Ω n + 1 Ω n | max | Ω n | < 10 6

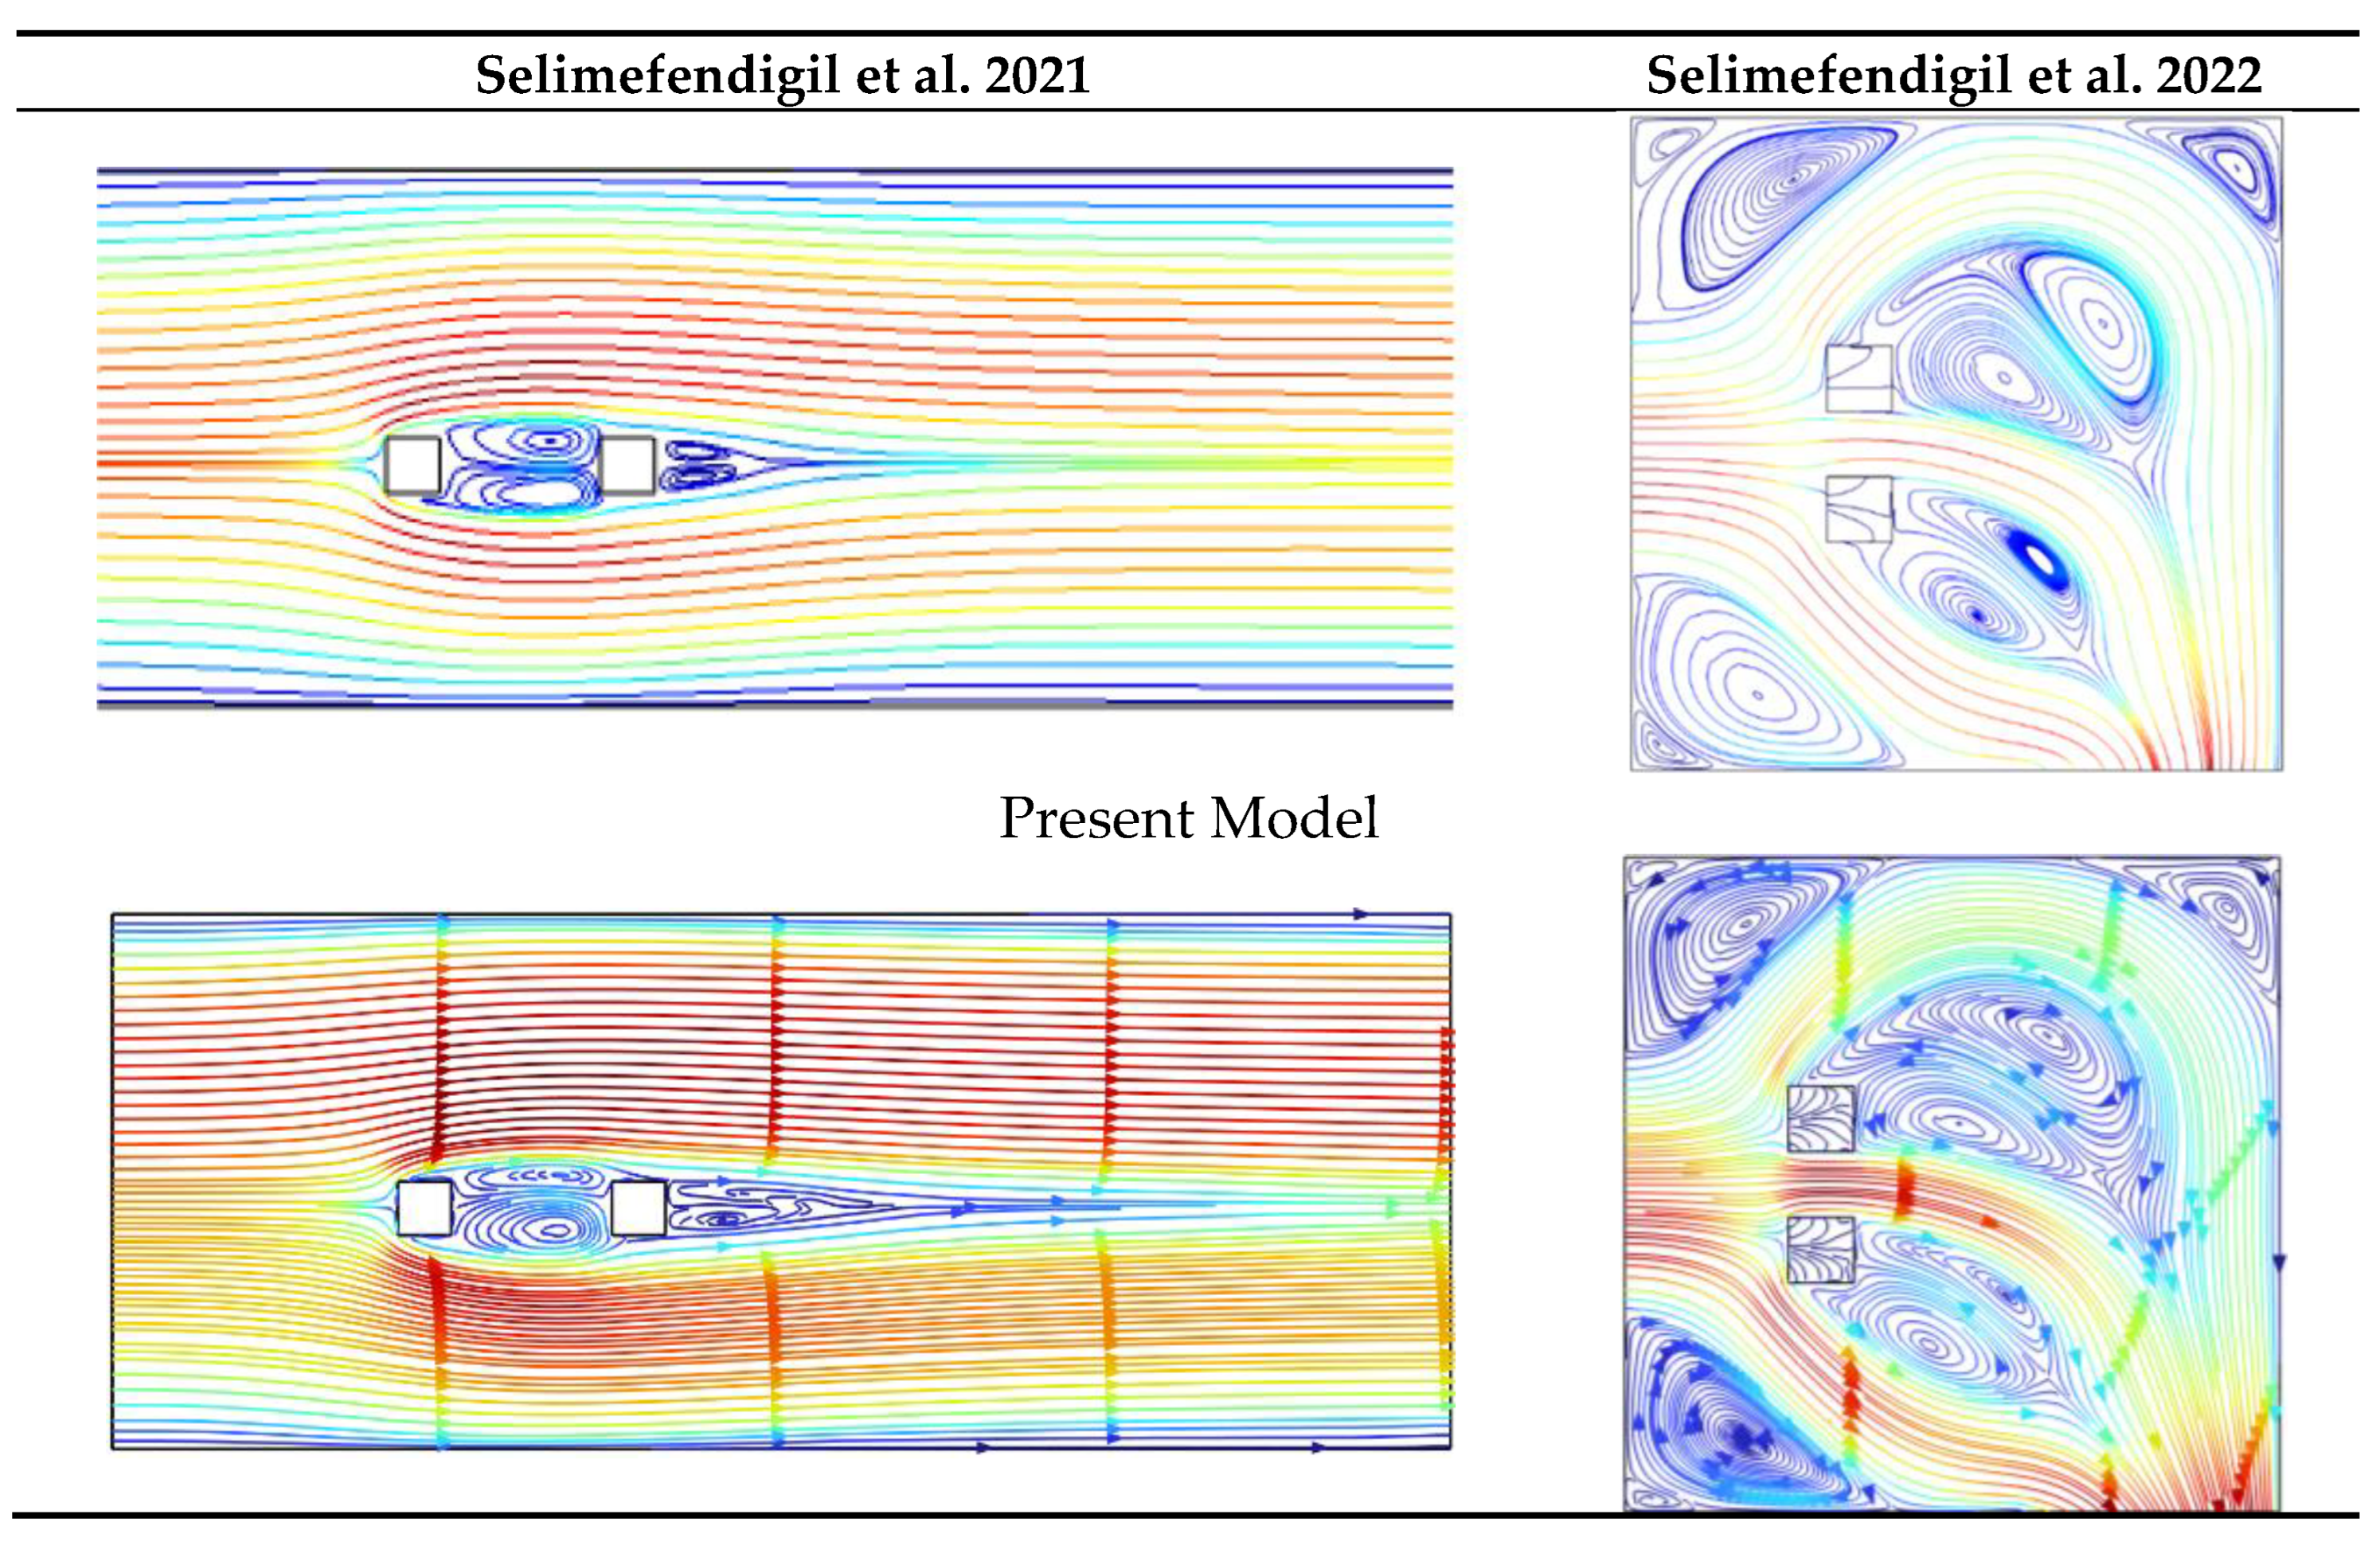
3. Numerical Model Verification and Grid Independency TEST

To check the validity of the numerical model, a verification was performed by comparing with the results of Selimefendigil et al. [29,30]. The authors studied convective heat transfer in 2D cavities ventilated with porous moist objects. The flow structures presented in Figure 2 show good concordance between the results.
To ensure the accuracy of the results, a grid sensitivity test was performed for four grids (G1, G2, G3, and G4), as presented in Table 3. The difference between the inlet temperature and the average temperature in the occupied zone (ΔT = Tin − Tav) was chosen as the sensitive variable. As shown in Table 2, the difference between the results of G3 and G4 was only 1.03%. Thus, for results precision and time economy, the grid G3 was retained to perform all the numerical executions. In order to check the time step sensitivity (Table 4), four-time steps were tested (Δt = 2.5, 5, 10, and 60 s). The variation of (ΔT = Tin − Tav) between the time steps Δt = 2.5 s and Δt = 5 s was only 0.175%. Thus, a time step of 5 s was retained for all the performed simulations.

4. Results and Discussion
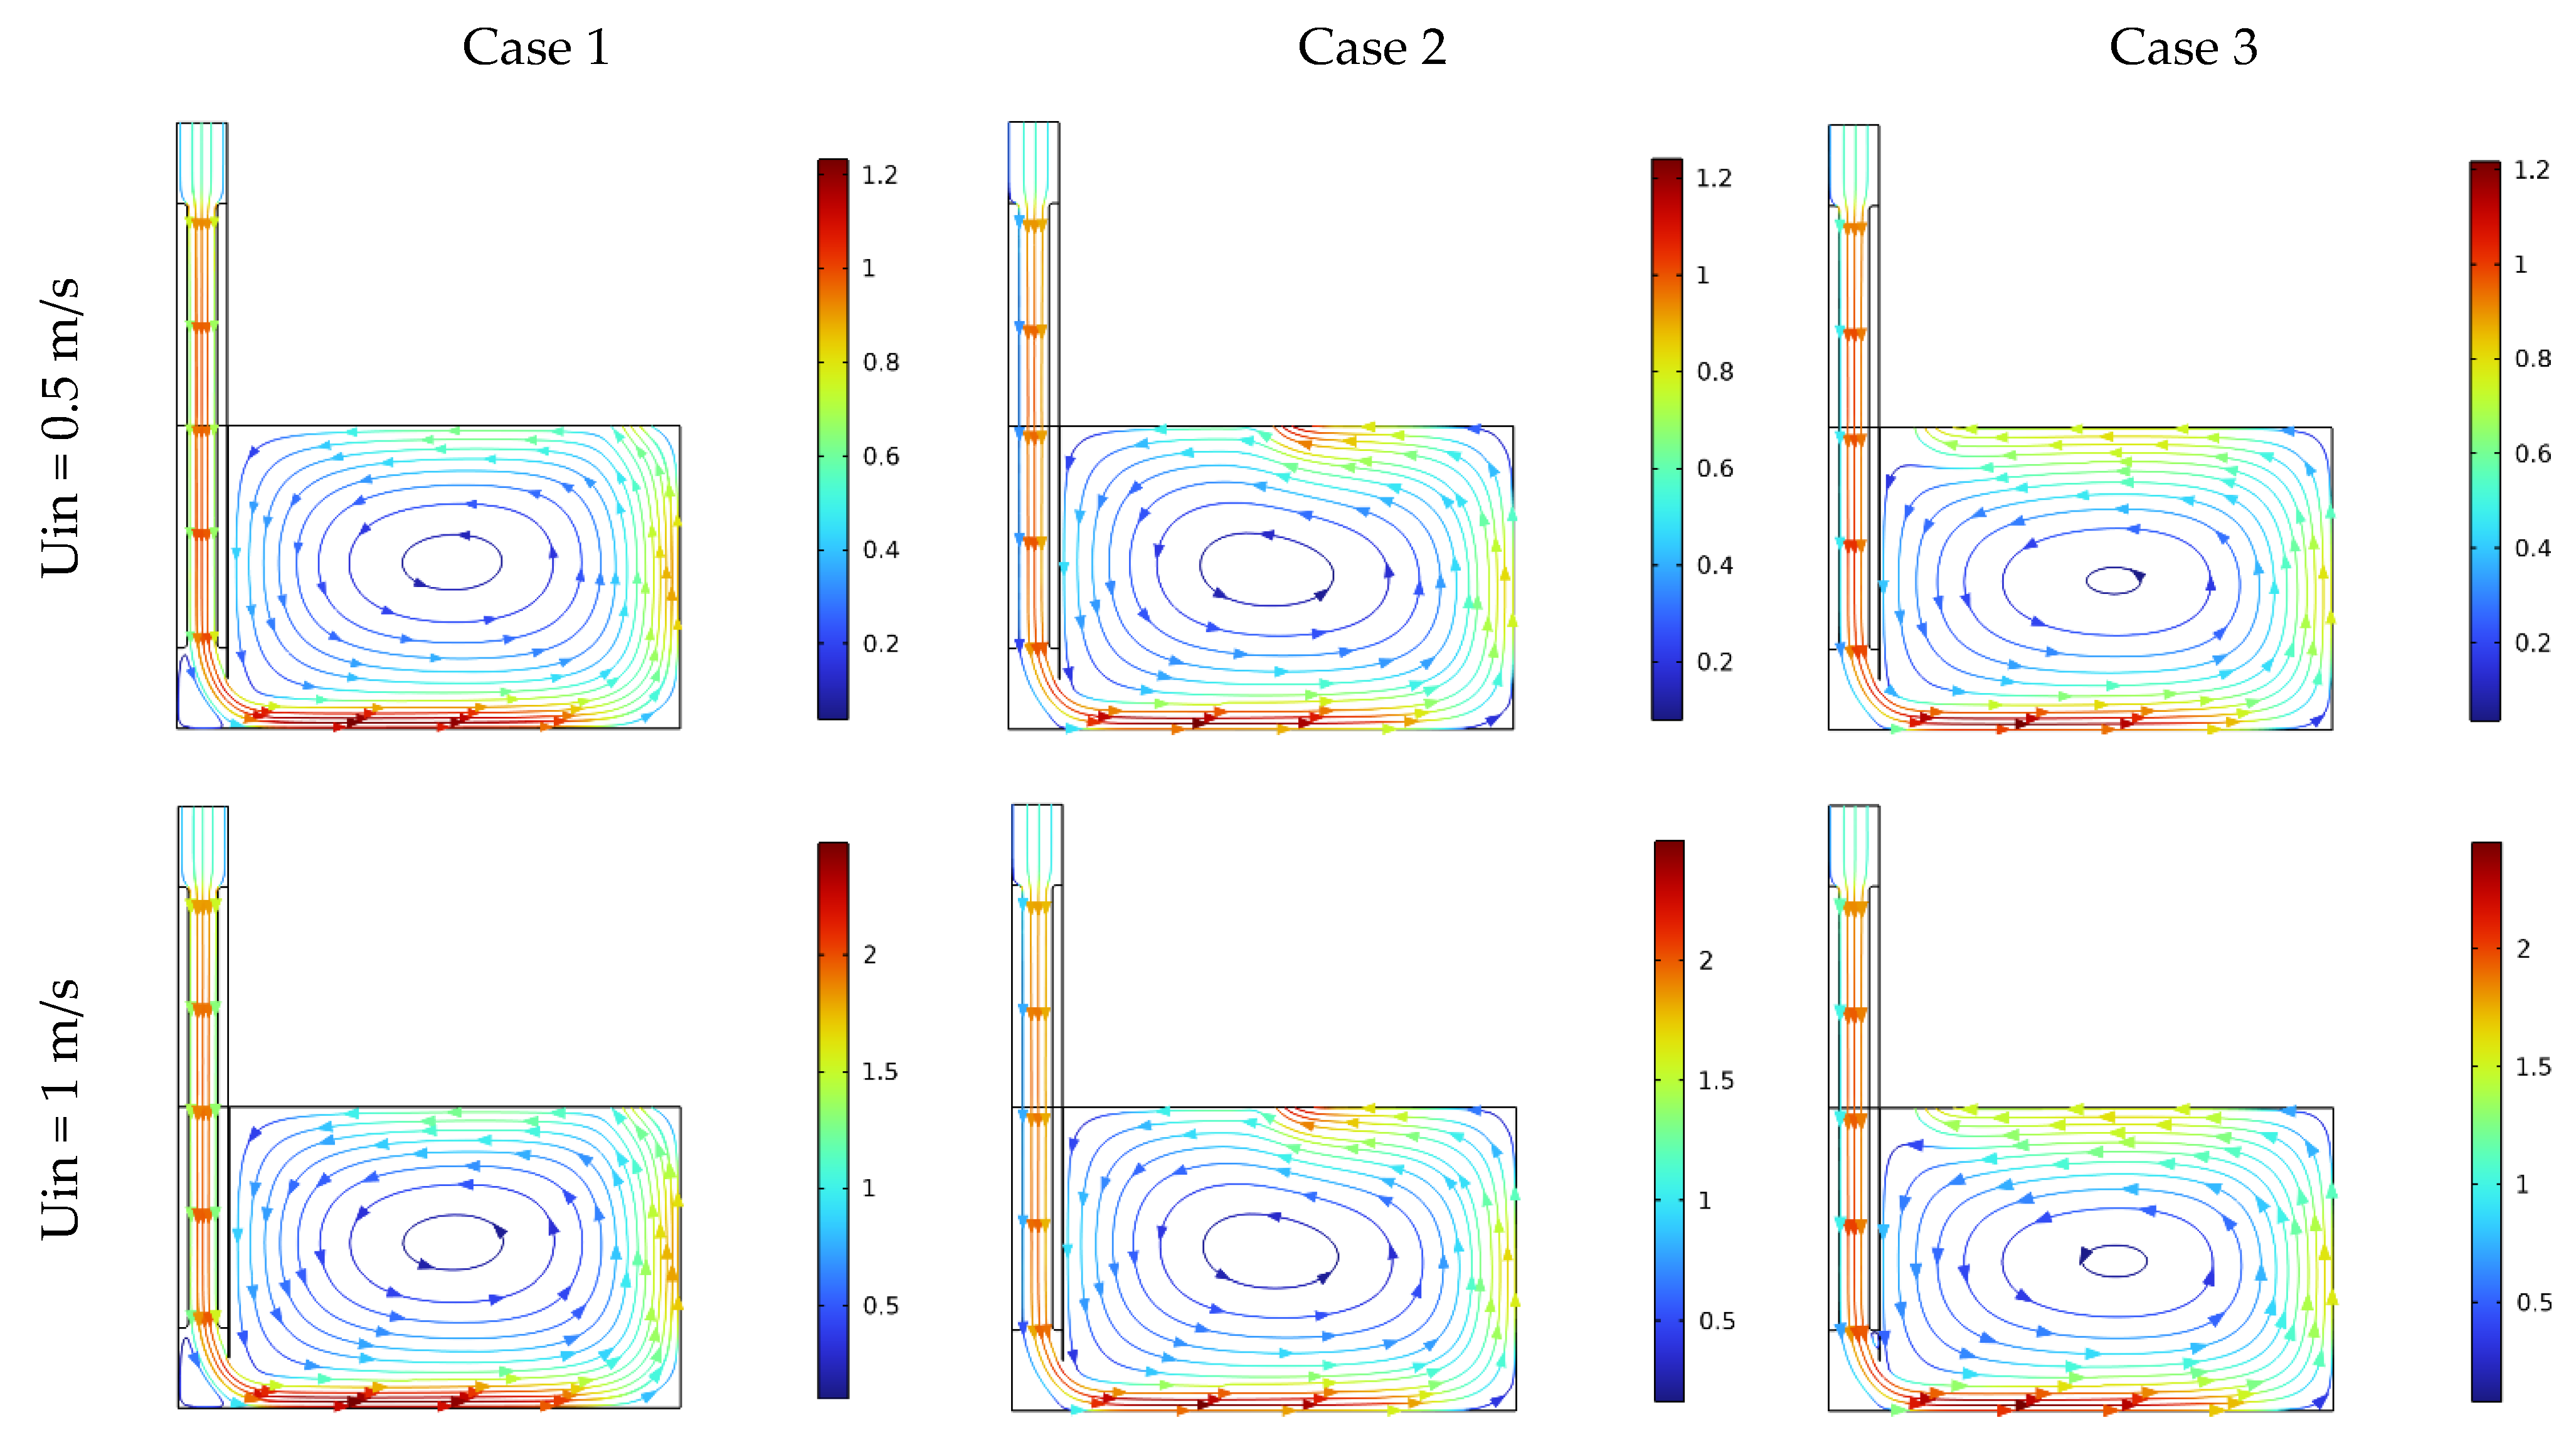
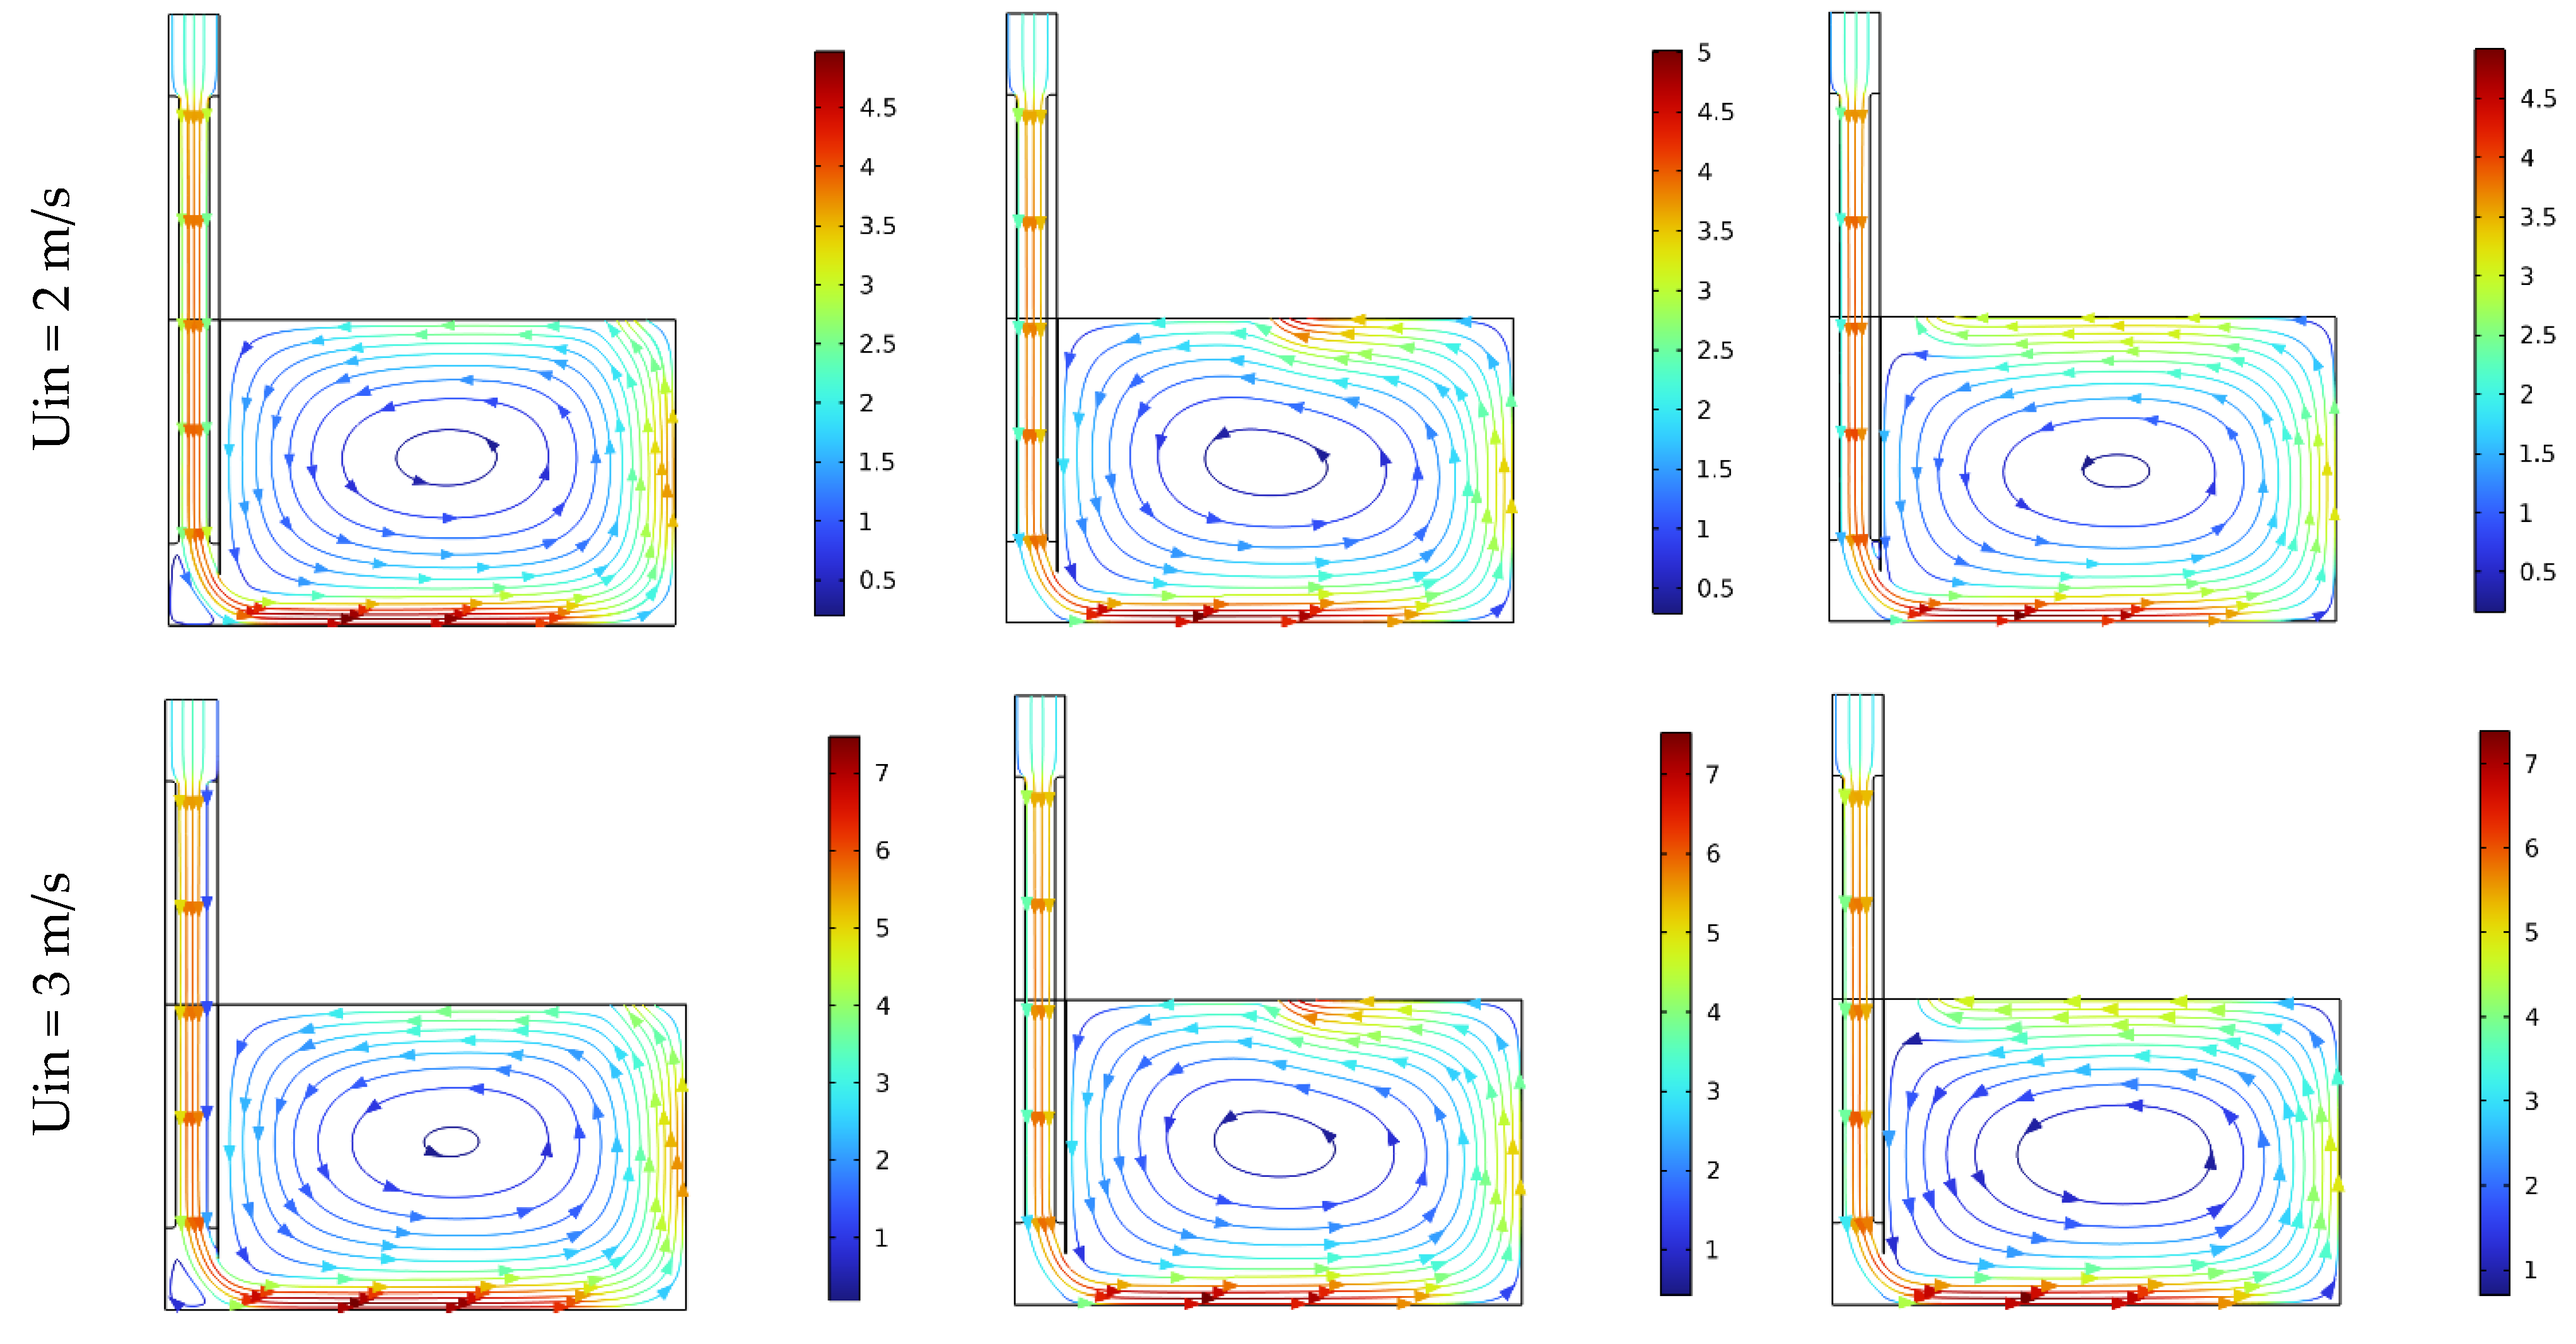
The fluid flow and heat and mass transfers in a typical building equipped with a PDEC tower were investigated. The varied parameters were the inlet velocity (0.5 m·s−1 ≤ uin ≤ 3 m·s−1) and inlet temperature (35 °C ≤ Tin ≤ 45 °C). The relative humidity at the inlet was fixed at 25%.

4.1. Flow Structure

Figure 3 shows the streamlined distribution according to the inlet cooling tower velocity. Depending on the air outlet position, three configurations were studied. As can be shown in the figure, regardless of the selected configuration, the flow topography was always similar. In fact, when the wind was captured, a downward movement was generated throughout the tower. Once the flow reached the porous medium, it accelerated considerably with a magnitude velocity two times greater than the captured one. Such an acceleration was expected since the porous medium placed on the tower walls led to a narrowing of the cross-sectional area. A second and an even greater air acceleration was recorded on the floor of the studied space. Indeed, the lower opening of the tower, which expands abruptly, created a dead recirculation zone in the bottom left corner. This dead zone further constricted the cross section of airflow, which explains the second speed increase. The main air movement in the air conditioning chamber was characterized by a single-cell flow that rotated counter-clockwise. Depending on the position of the air outlet, there was more or less recirculated airflow into the room. In fact, in Case 1 (right outlet position), it can be shown that only part of the fluid was extracted, and the main part went back into the room. In contrast, in Case 3 (left outlet position) it is clear that most of the flow was extracted and only a small amount returned to the room.

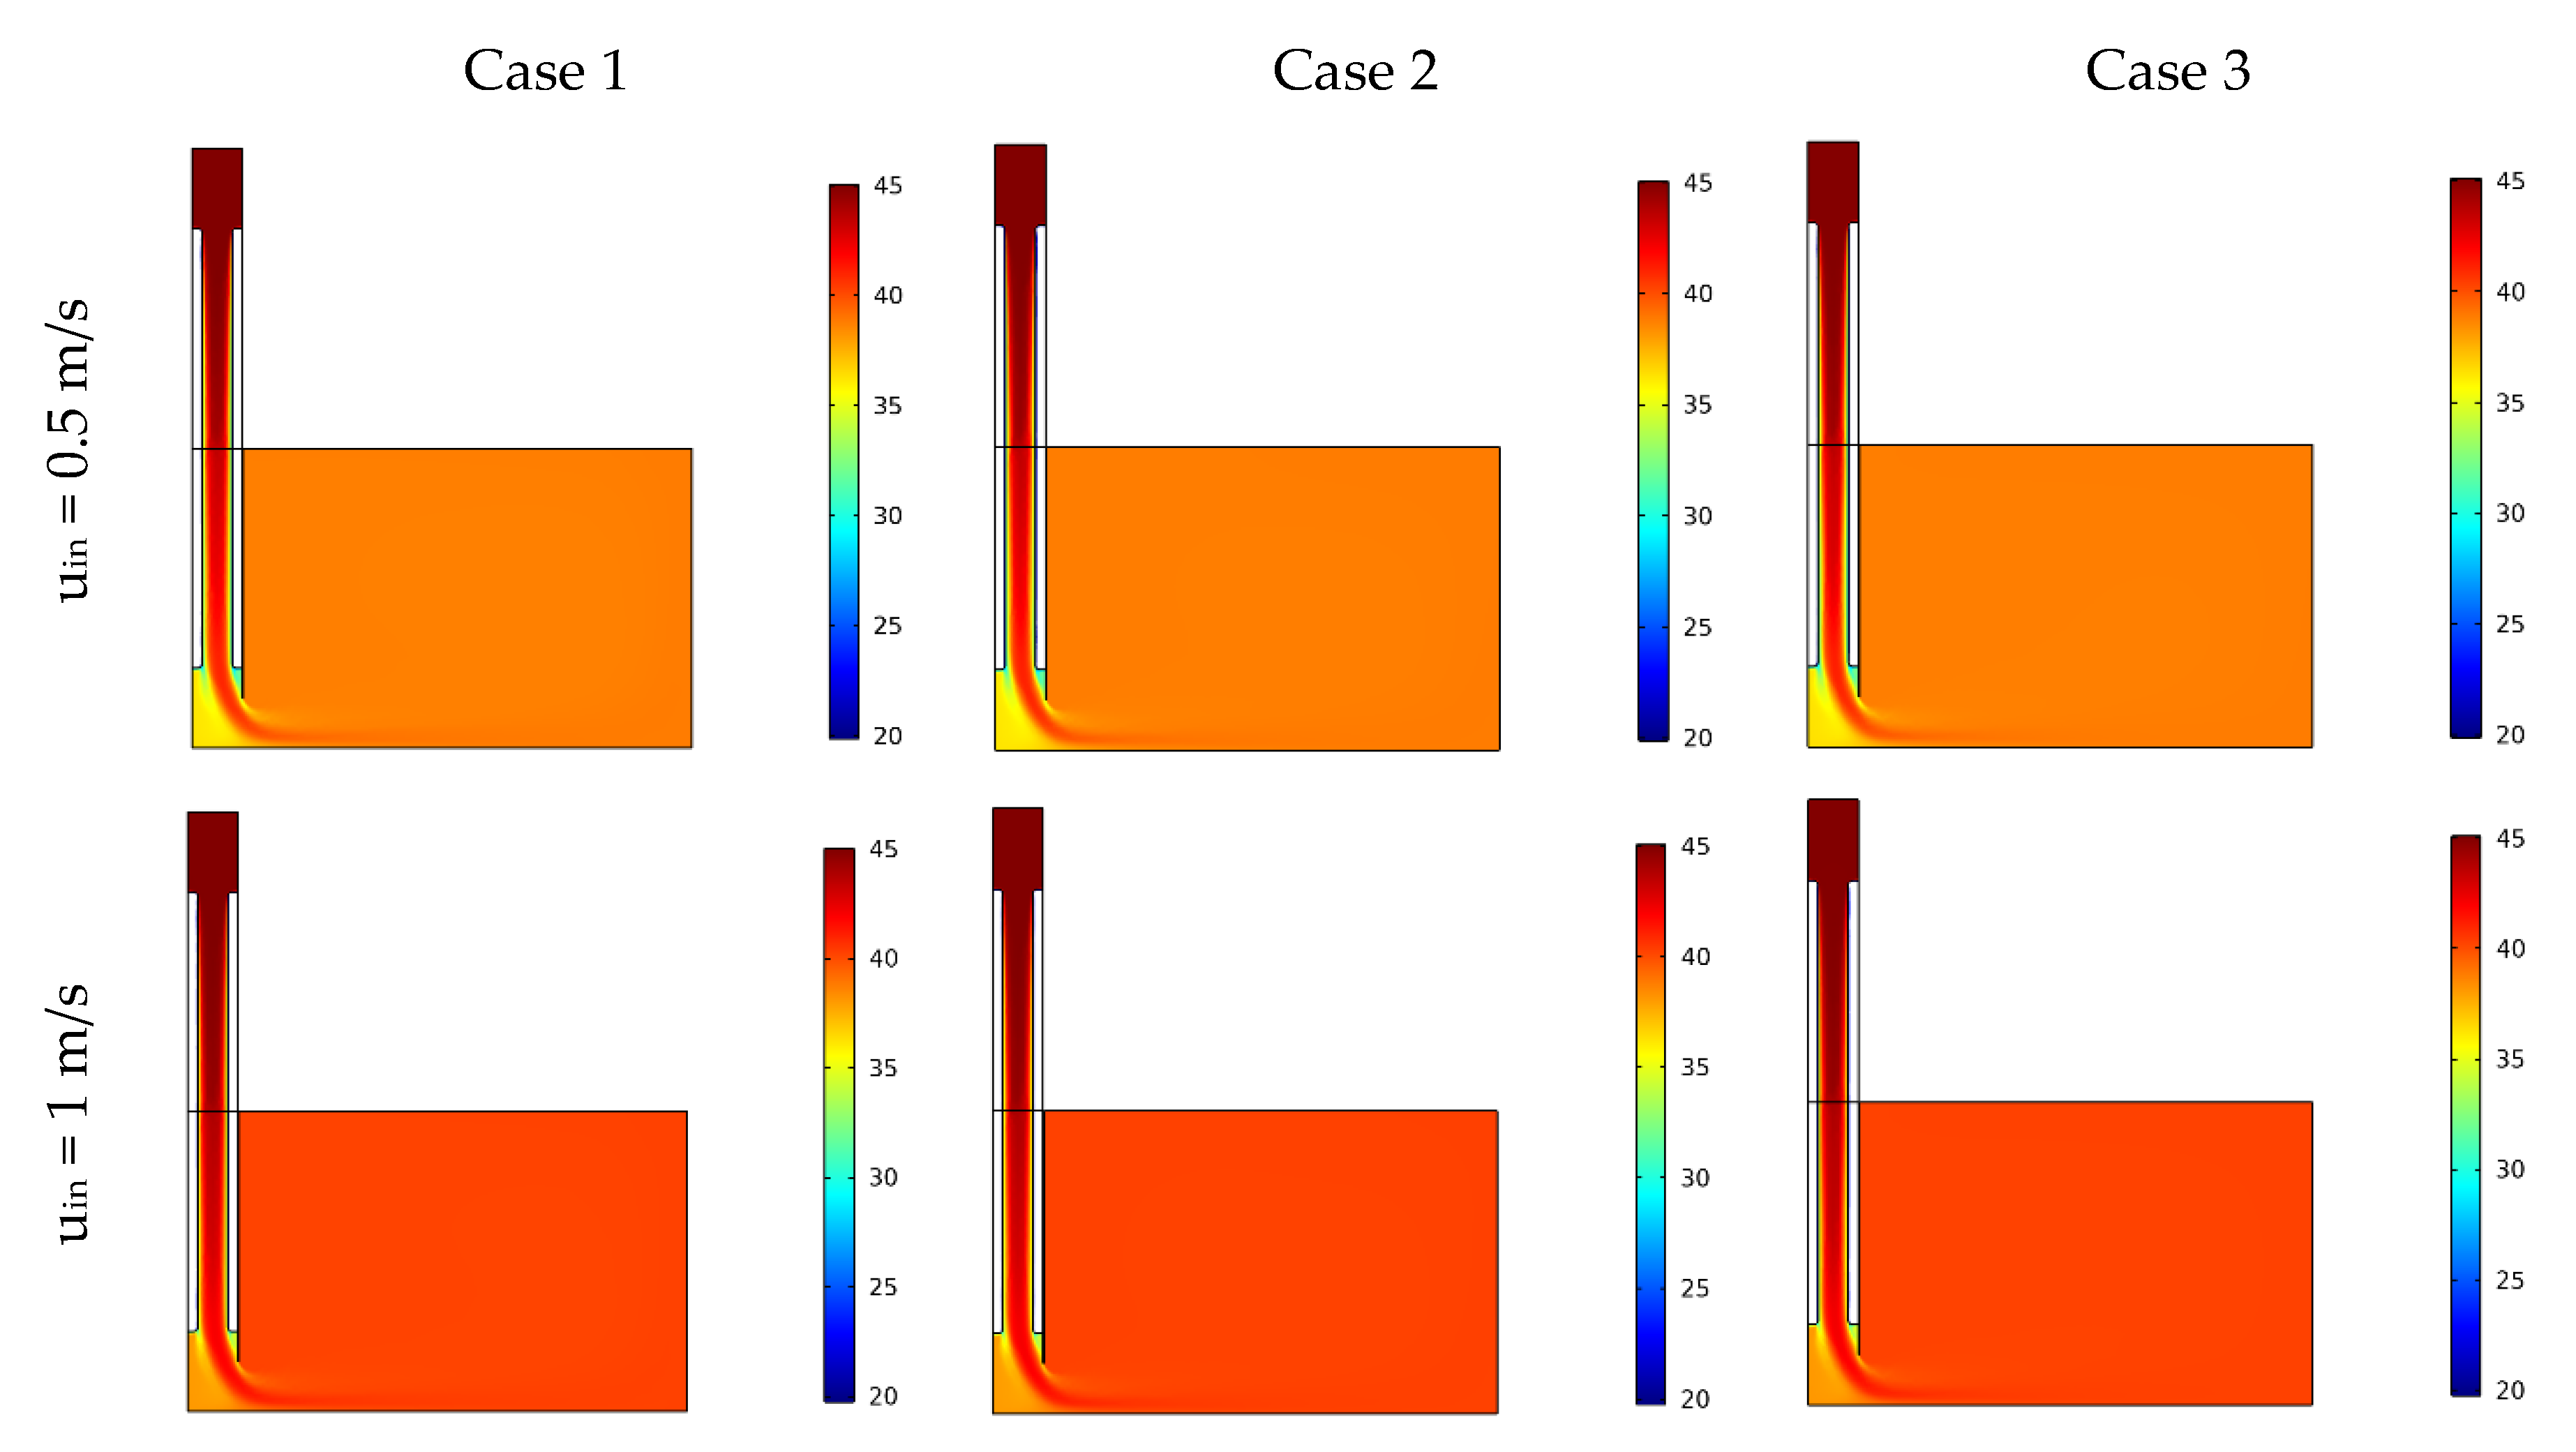
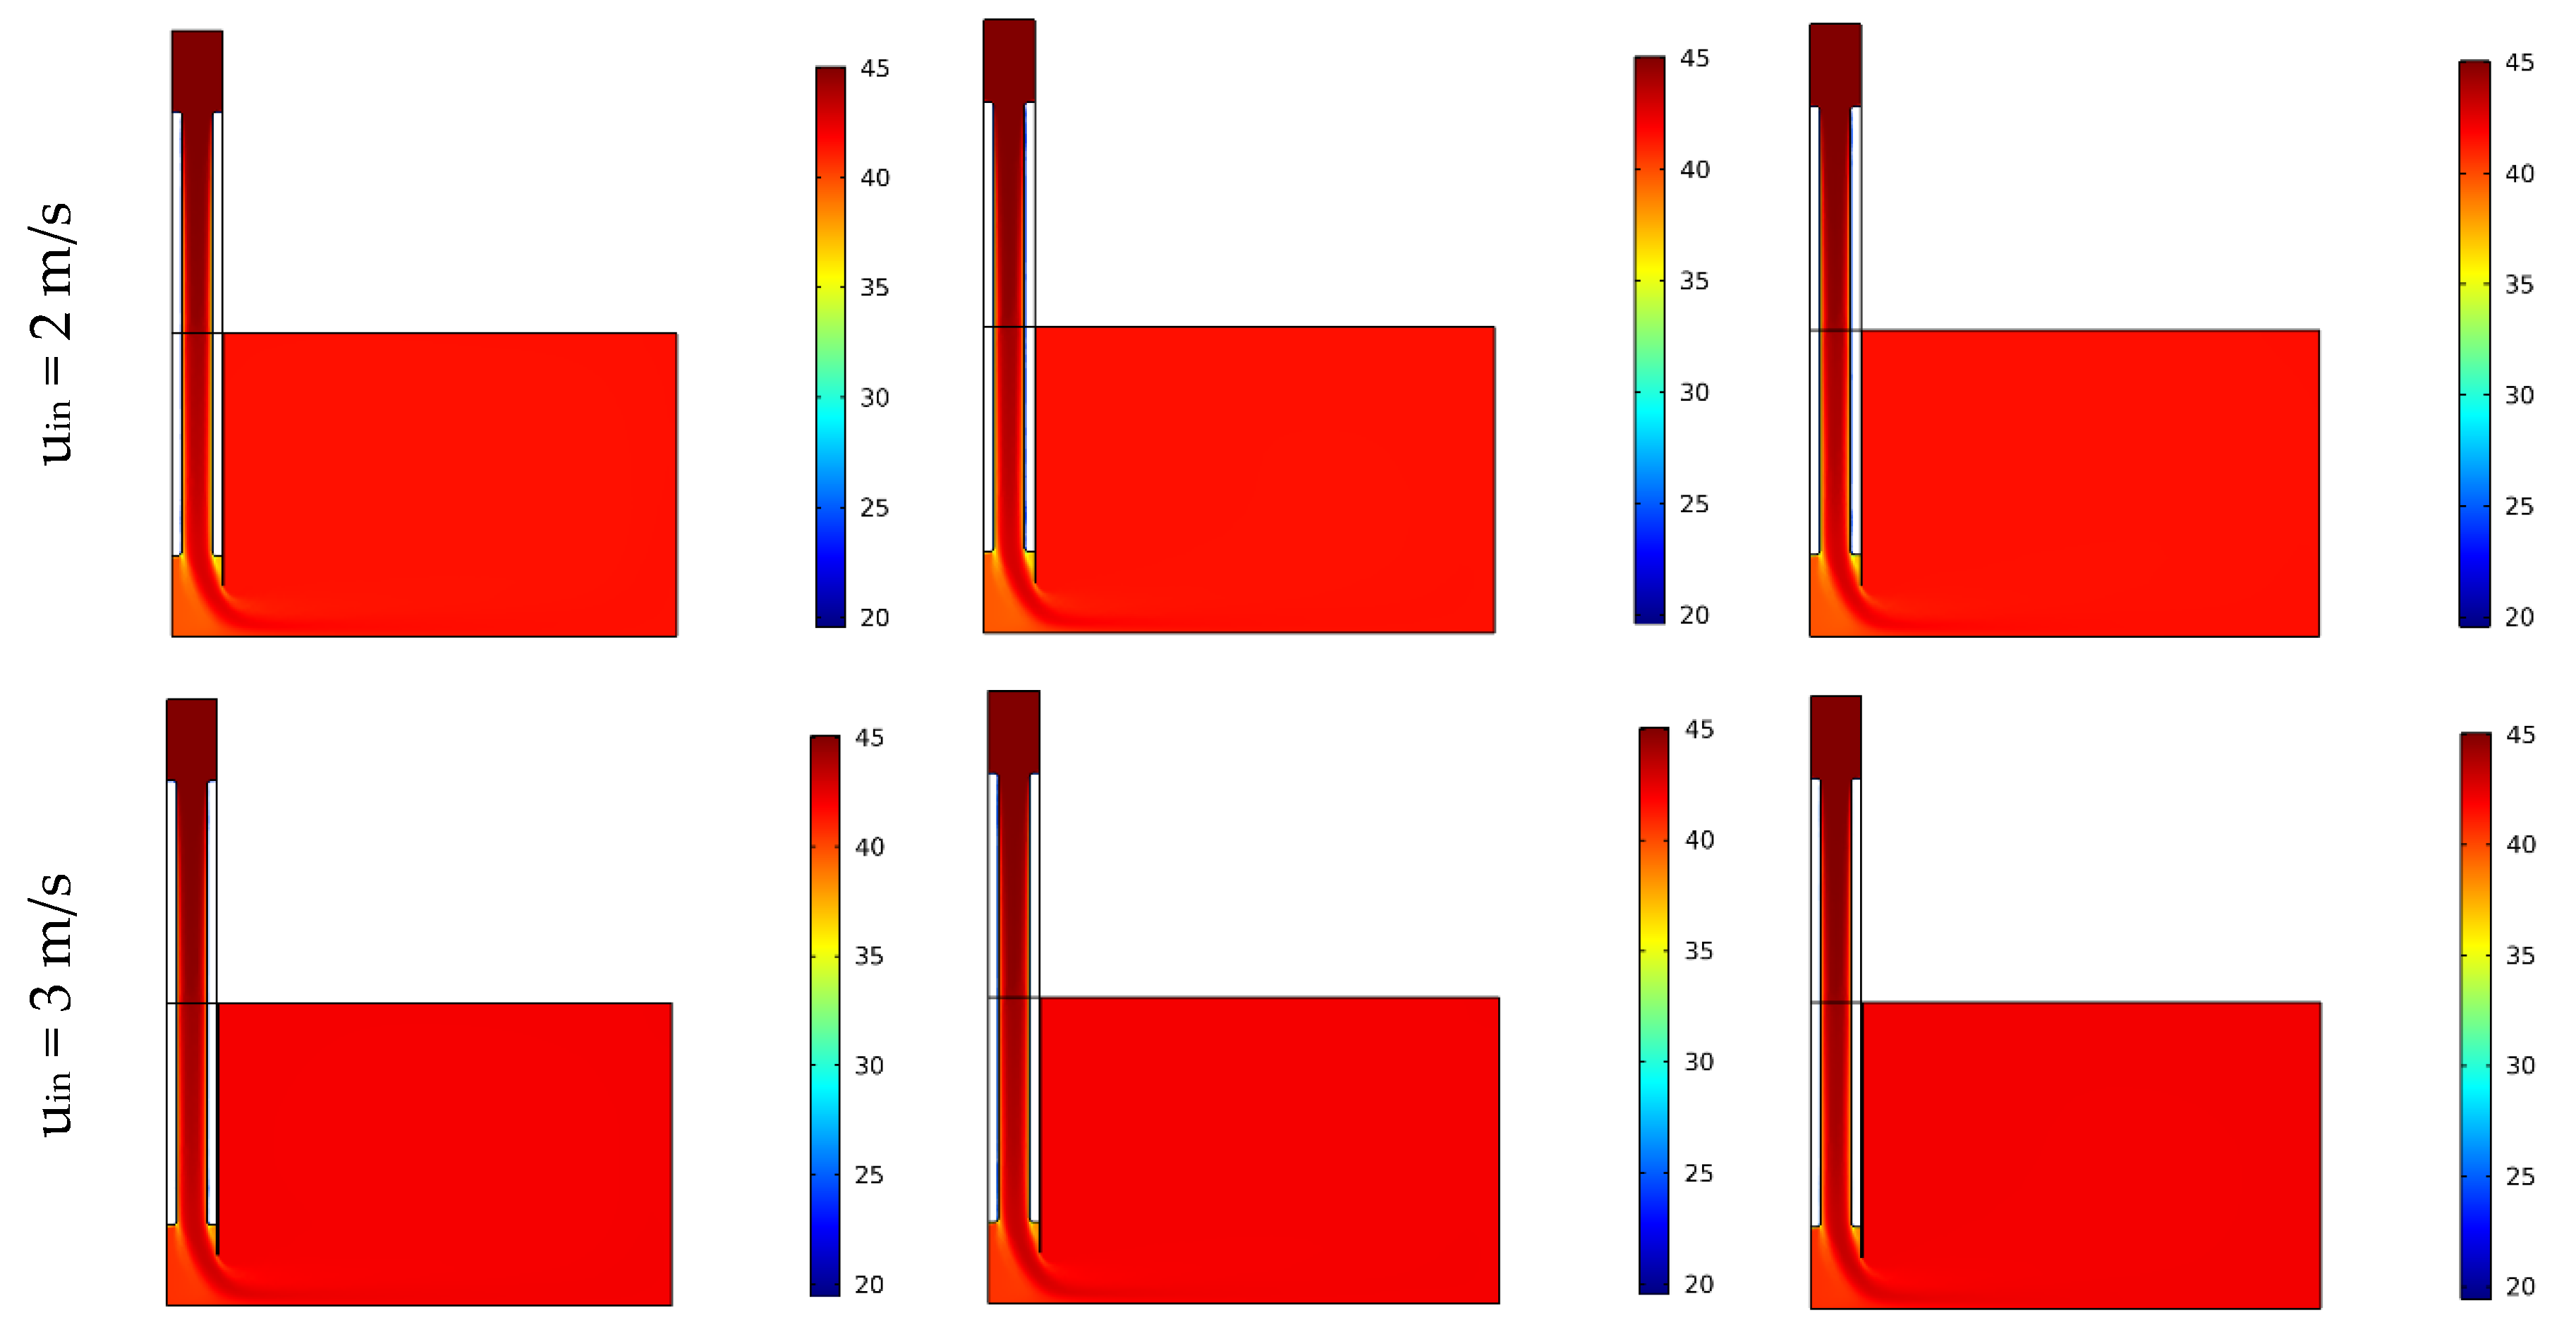
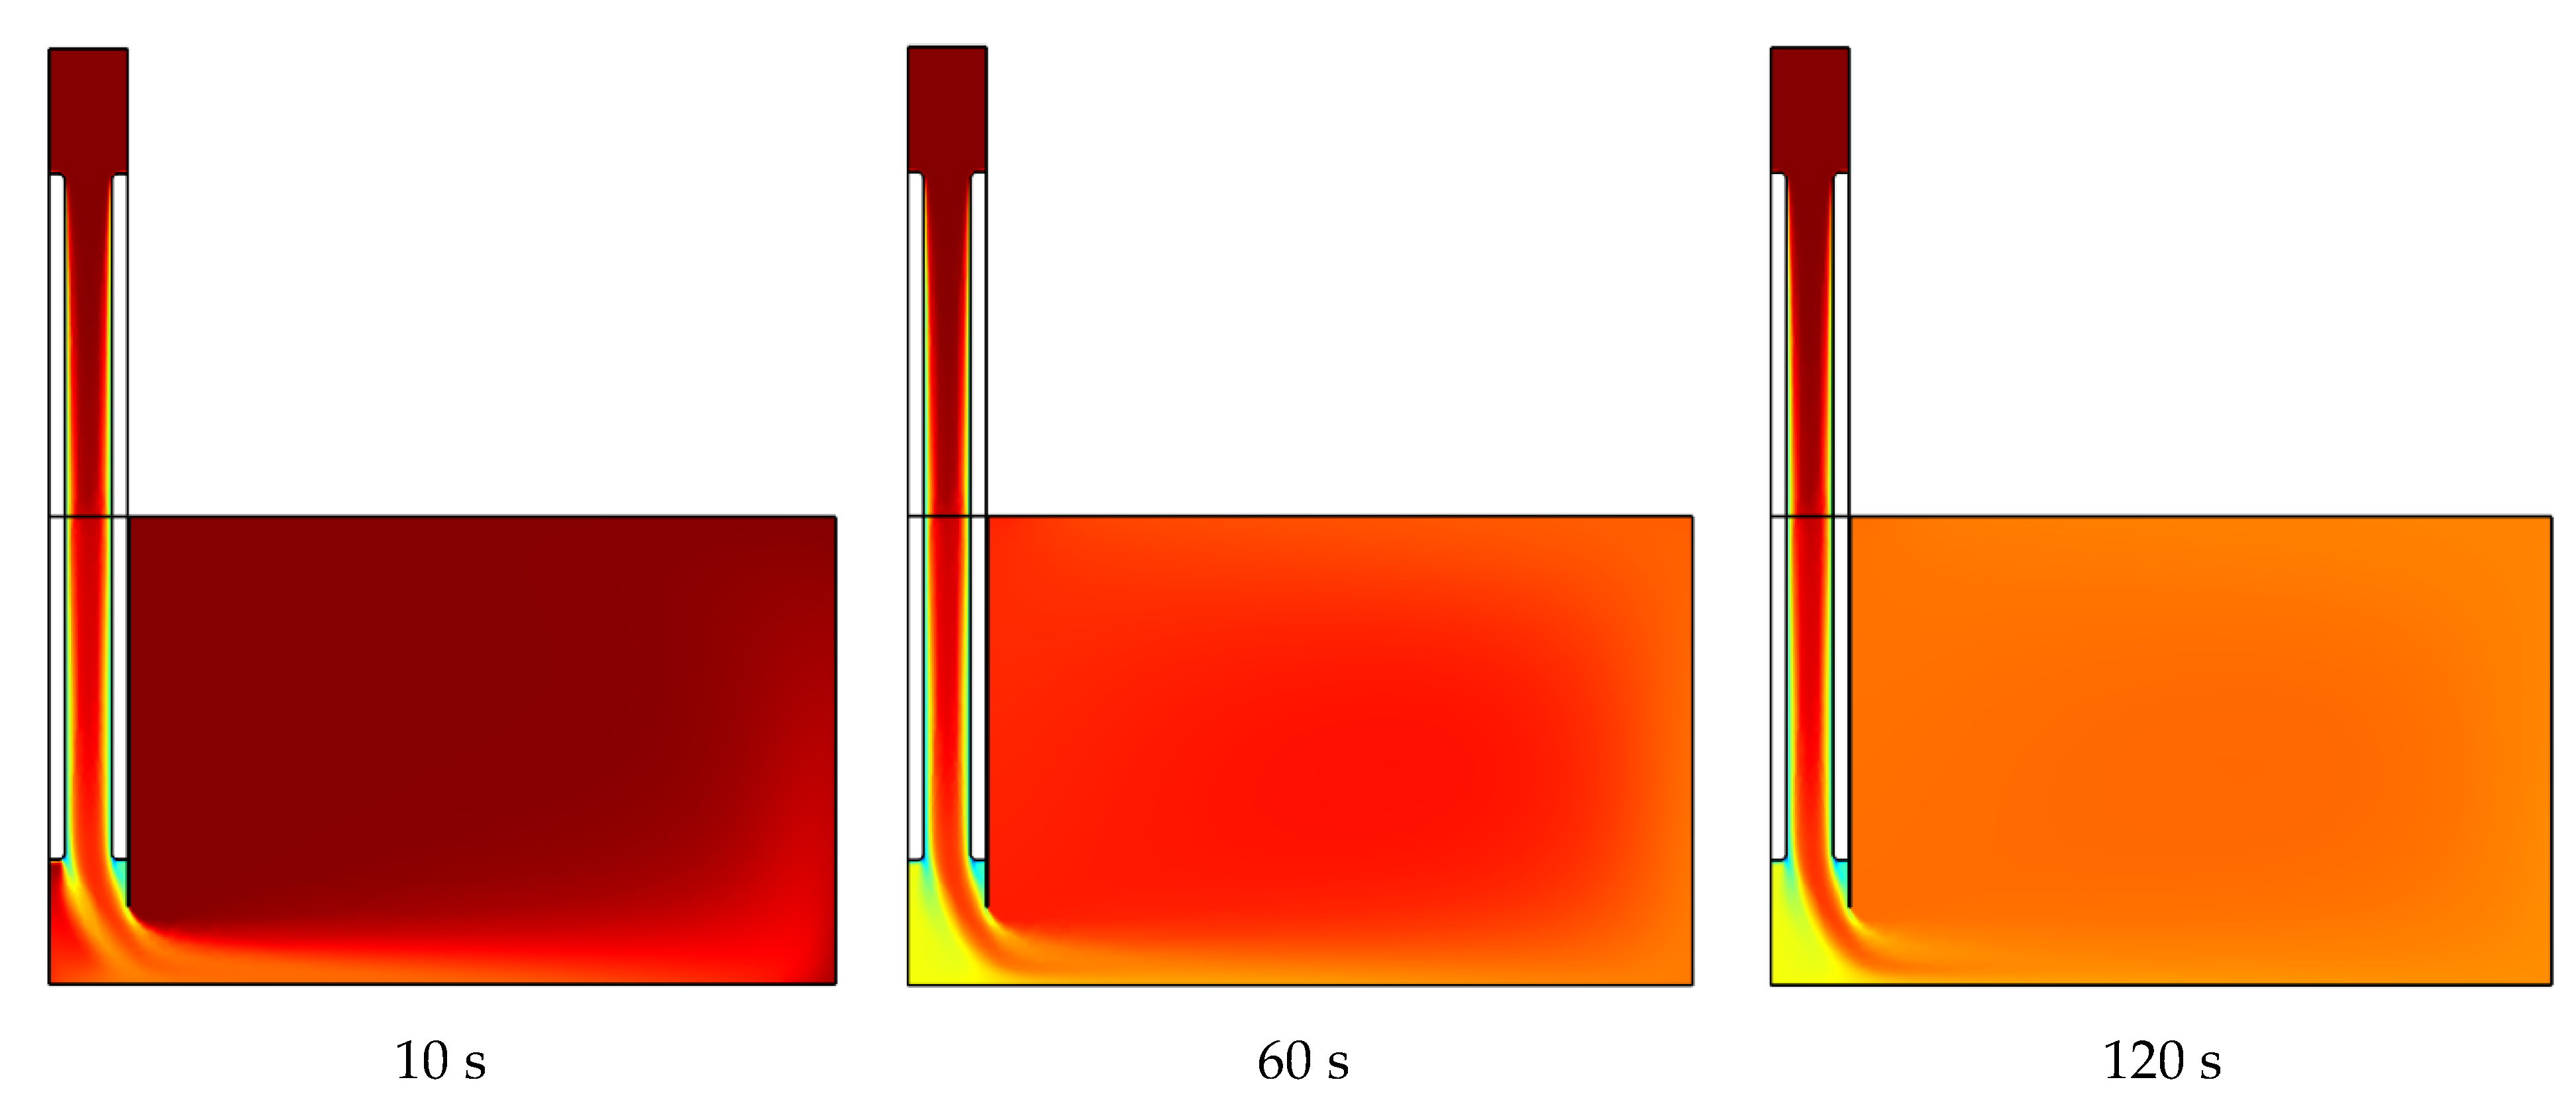
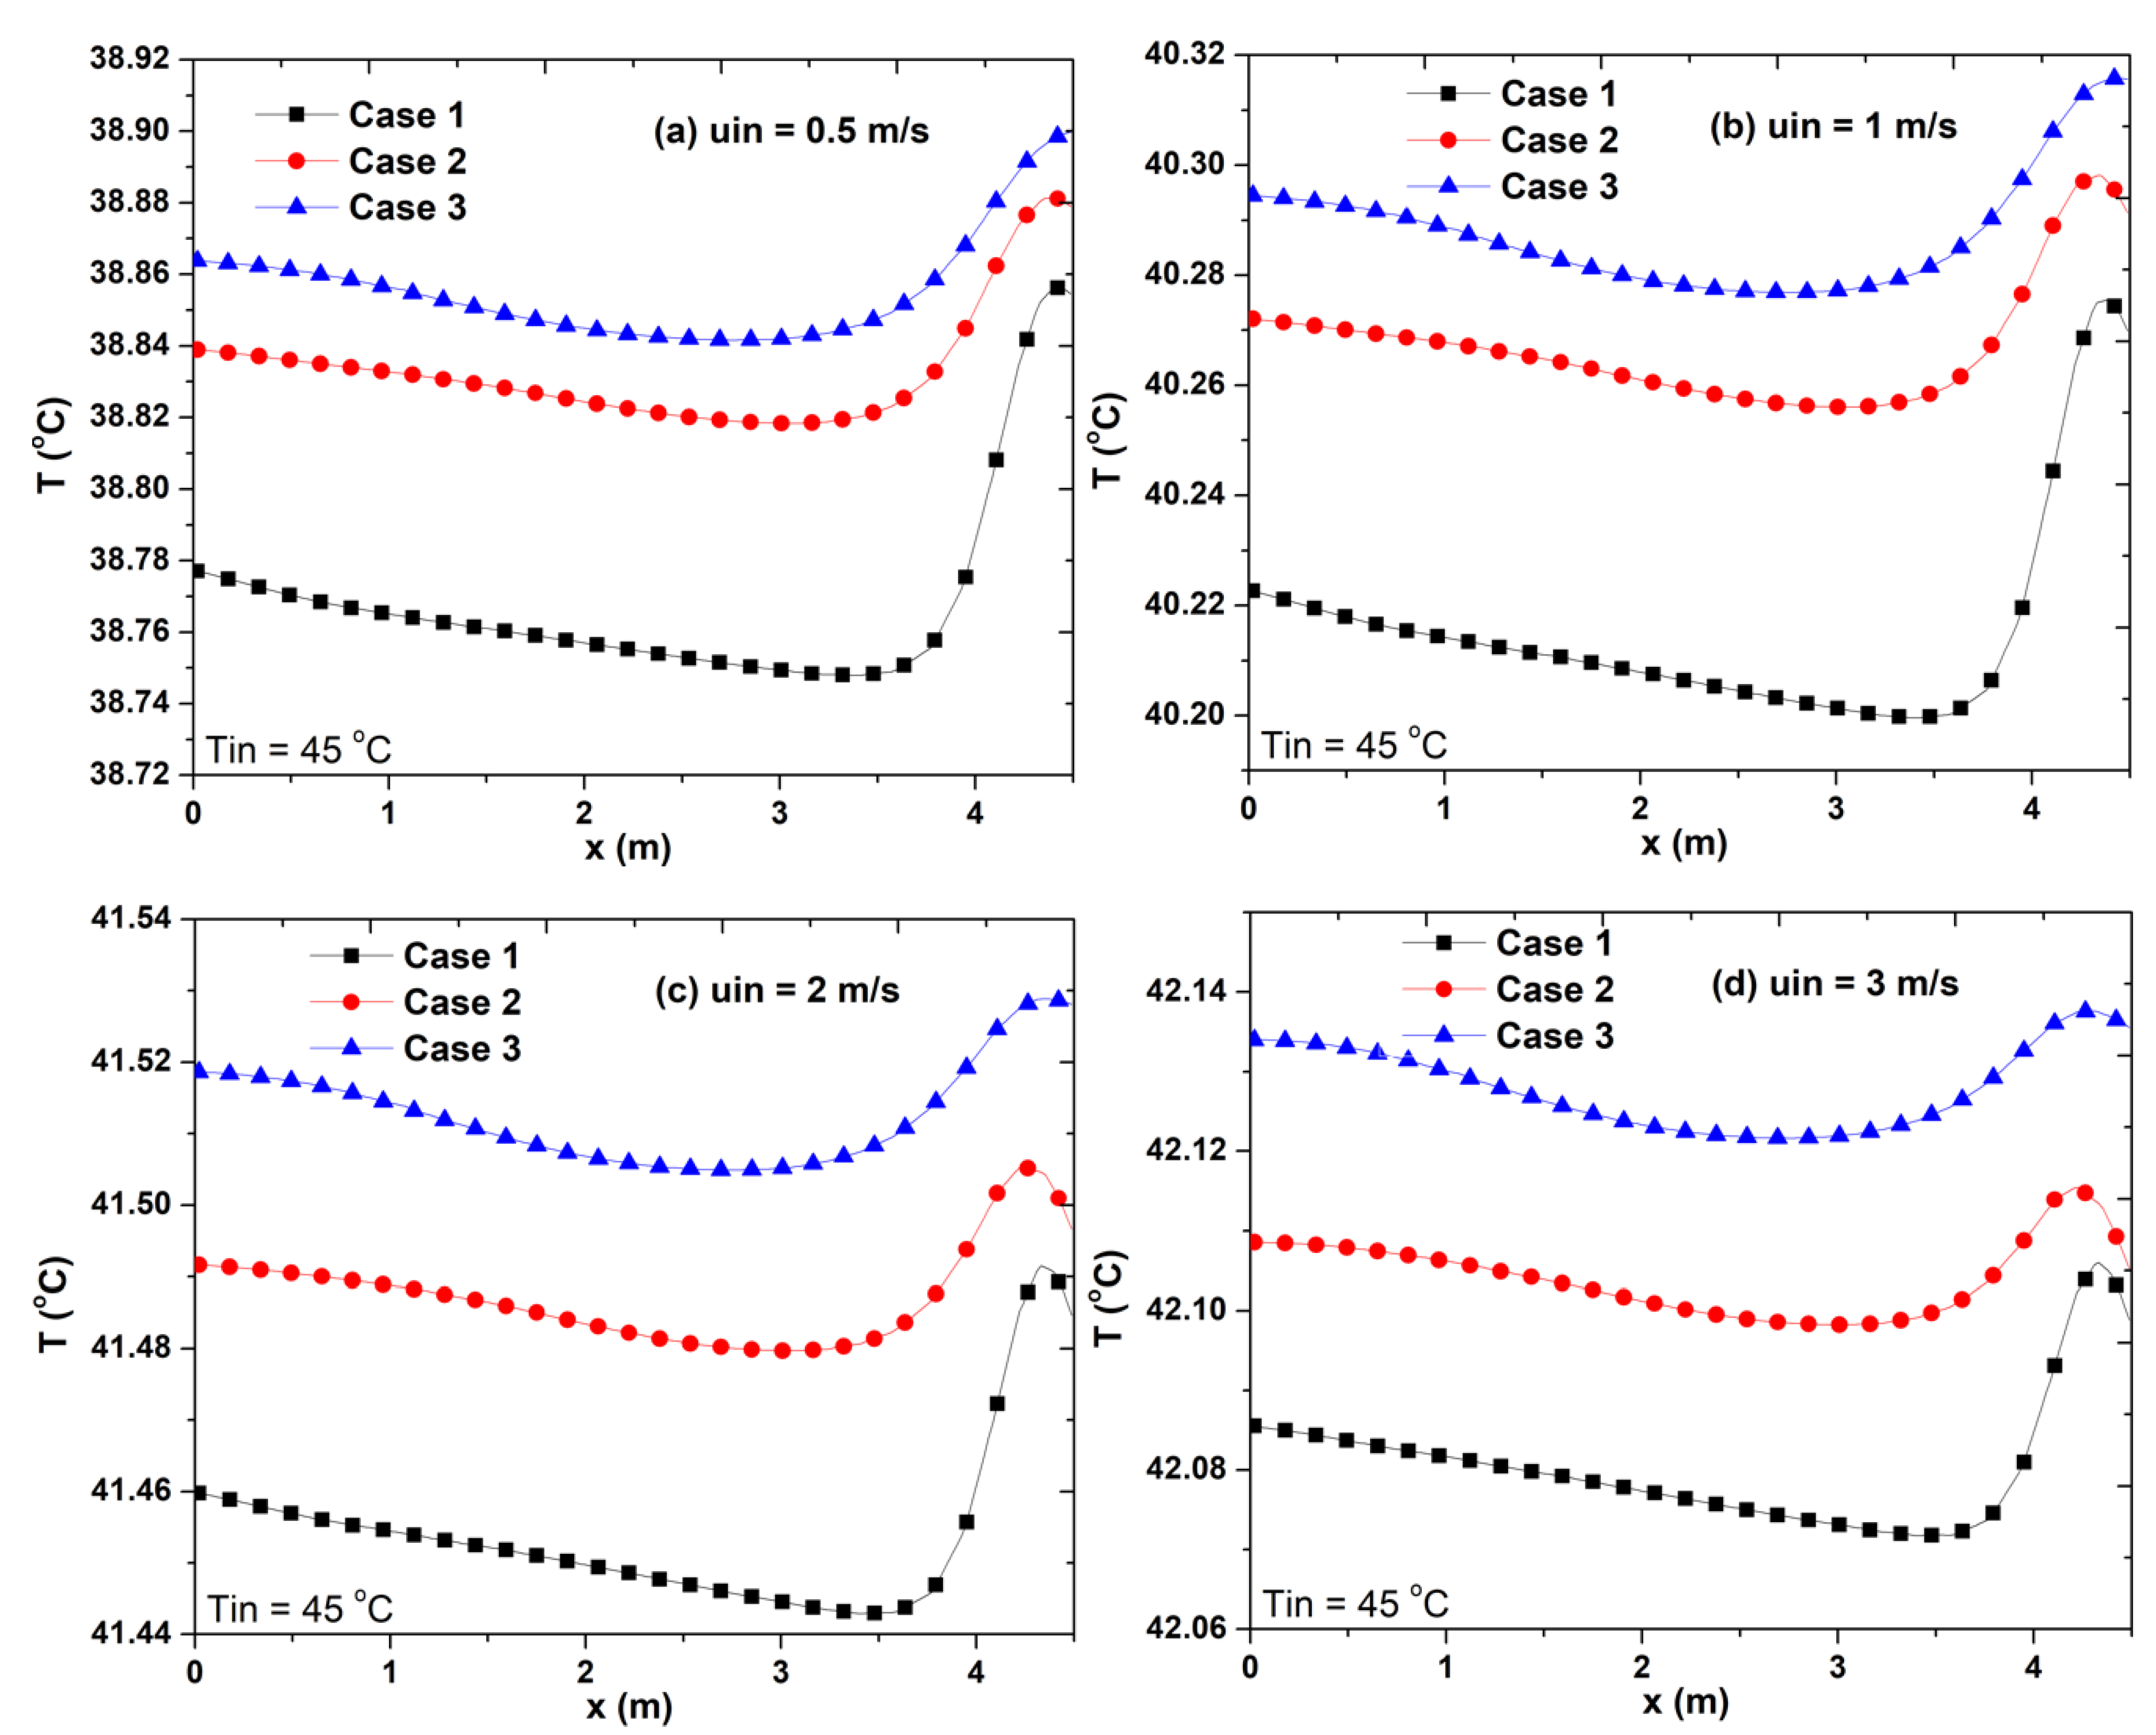
4.2. Temperature Distribution

Figure 4 shows the isothermal distribution according to the inlet velocity for three different outlet positions. Again, similar behavior was observed regardless of the configuration. The wind captured at the top of the tower, at a warm temperature of 45 °C, underwent passive downdraft evaporative cooling. Thanks to the cellular flow, the temperature in the studied room became quite homogeneous. The case where the velocity was 0.5 m/s gave the best situation with a temperature that dropped to 39 °C. Indeed, with such a low velocity, the residence time in the tower was much higher, leaving enough time for the fluid to cool down.
This is confirmed by Figure 5, which illustrates the temporal evolution of the temperature field for a tower inlet velocity of 0.5 m/s. The figure shows the development of a thermal boundary layer inside the tower along the porous medium. First, just after 10 s, the chamber floor was subjected to a temperature drop, and then the cold air layers extended along the right vertical wall and over the roof. After 240 s, the steady state was almost reached, and the chamber temperature became almost uniform. Even lower temperatures of 35 °C were detected at the tower’s base in the dead zone.
To better estimate the temperature variation at the chamber’s occupied space (height y = 1 m), the temperature profiles for different air inlet velocities and for various air outlet positions were plotted, as shown in Figure 6.
In all configurations, there was good temperature homogenization throughout the whole occupied space, except for a slight increase near the right vertical wall at x = 4.5 m. Case 1, i.e., air extraction on the right side of the roof, shows the best cooling efficiency with the lowest temperatures regardless of the extraction position. Additionally, as expected, the lowest inlet velocity (uin = 0.5 m/s) achieved the coldest recorded temperature of 37.75 °C, with a drop of 6.25 °C compared to the ambient temperature. Therefore, it can be concluded that extraction through the right side of the ceiling with the lowest possible capture velocity improved the cooling efficiency for this passive downdraft evaporative cooling (PDEC) technique.

4.3. Humidity Profiles

To ensure thermal comfort, temperature should not be the only parameter that must be controlled. In fact, humidity is also a major parameter to consider, especially in arid areas, as is the case in this study for a very hot climate (T = 45 °C) and a very low relative humidity (25%). In Figure 7, the variation of the relative humidity along all studied spaces (tower 0 < x < 0.5 m + room 0.5 < x < 5 m) on a height y = 0.25 m (to target the occupied space) is presented according to the inlet velocity value and for the three cases of the outlet air position. It is observed that regardless of the configuration, relative humidity increases from 25% to [36%; 42%] inside the tower and to [32%; 35%] in the occupied space. It appears that the value of this humidity is quite homogeneous throughout the conditioned space with a slight increase near the right vertical wall. The best conditions to increase relative humidity are obtained for a captured wind with the lowest possible temperature and velocity (T = 35 °C and uin = 0.5 m/s). The air outlet’s position does not significantly influence the humification of the occupied space.

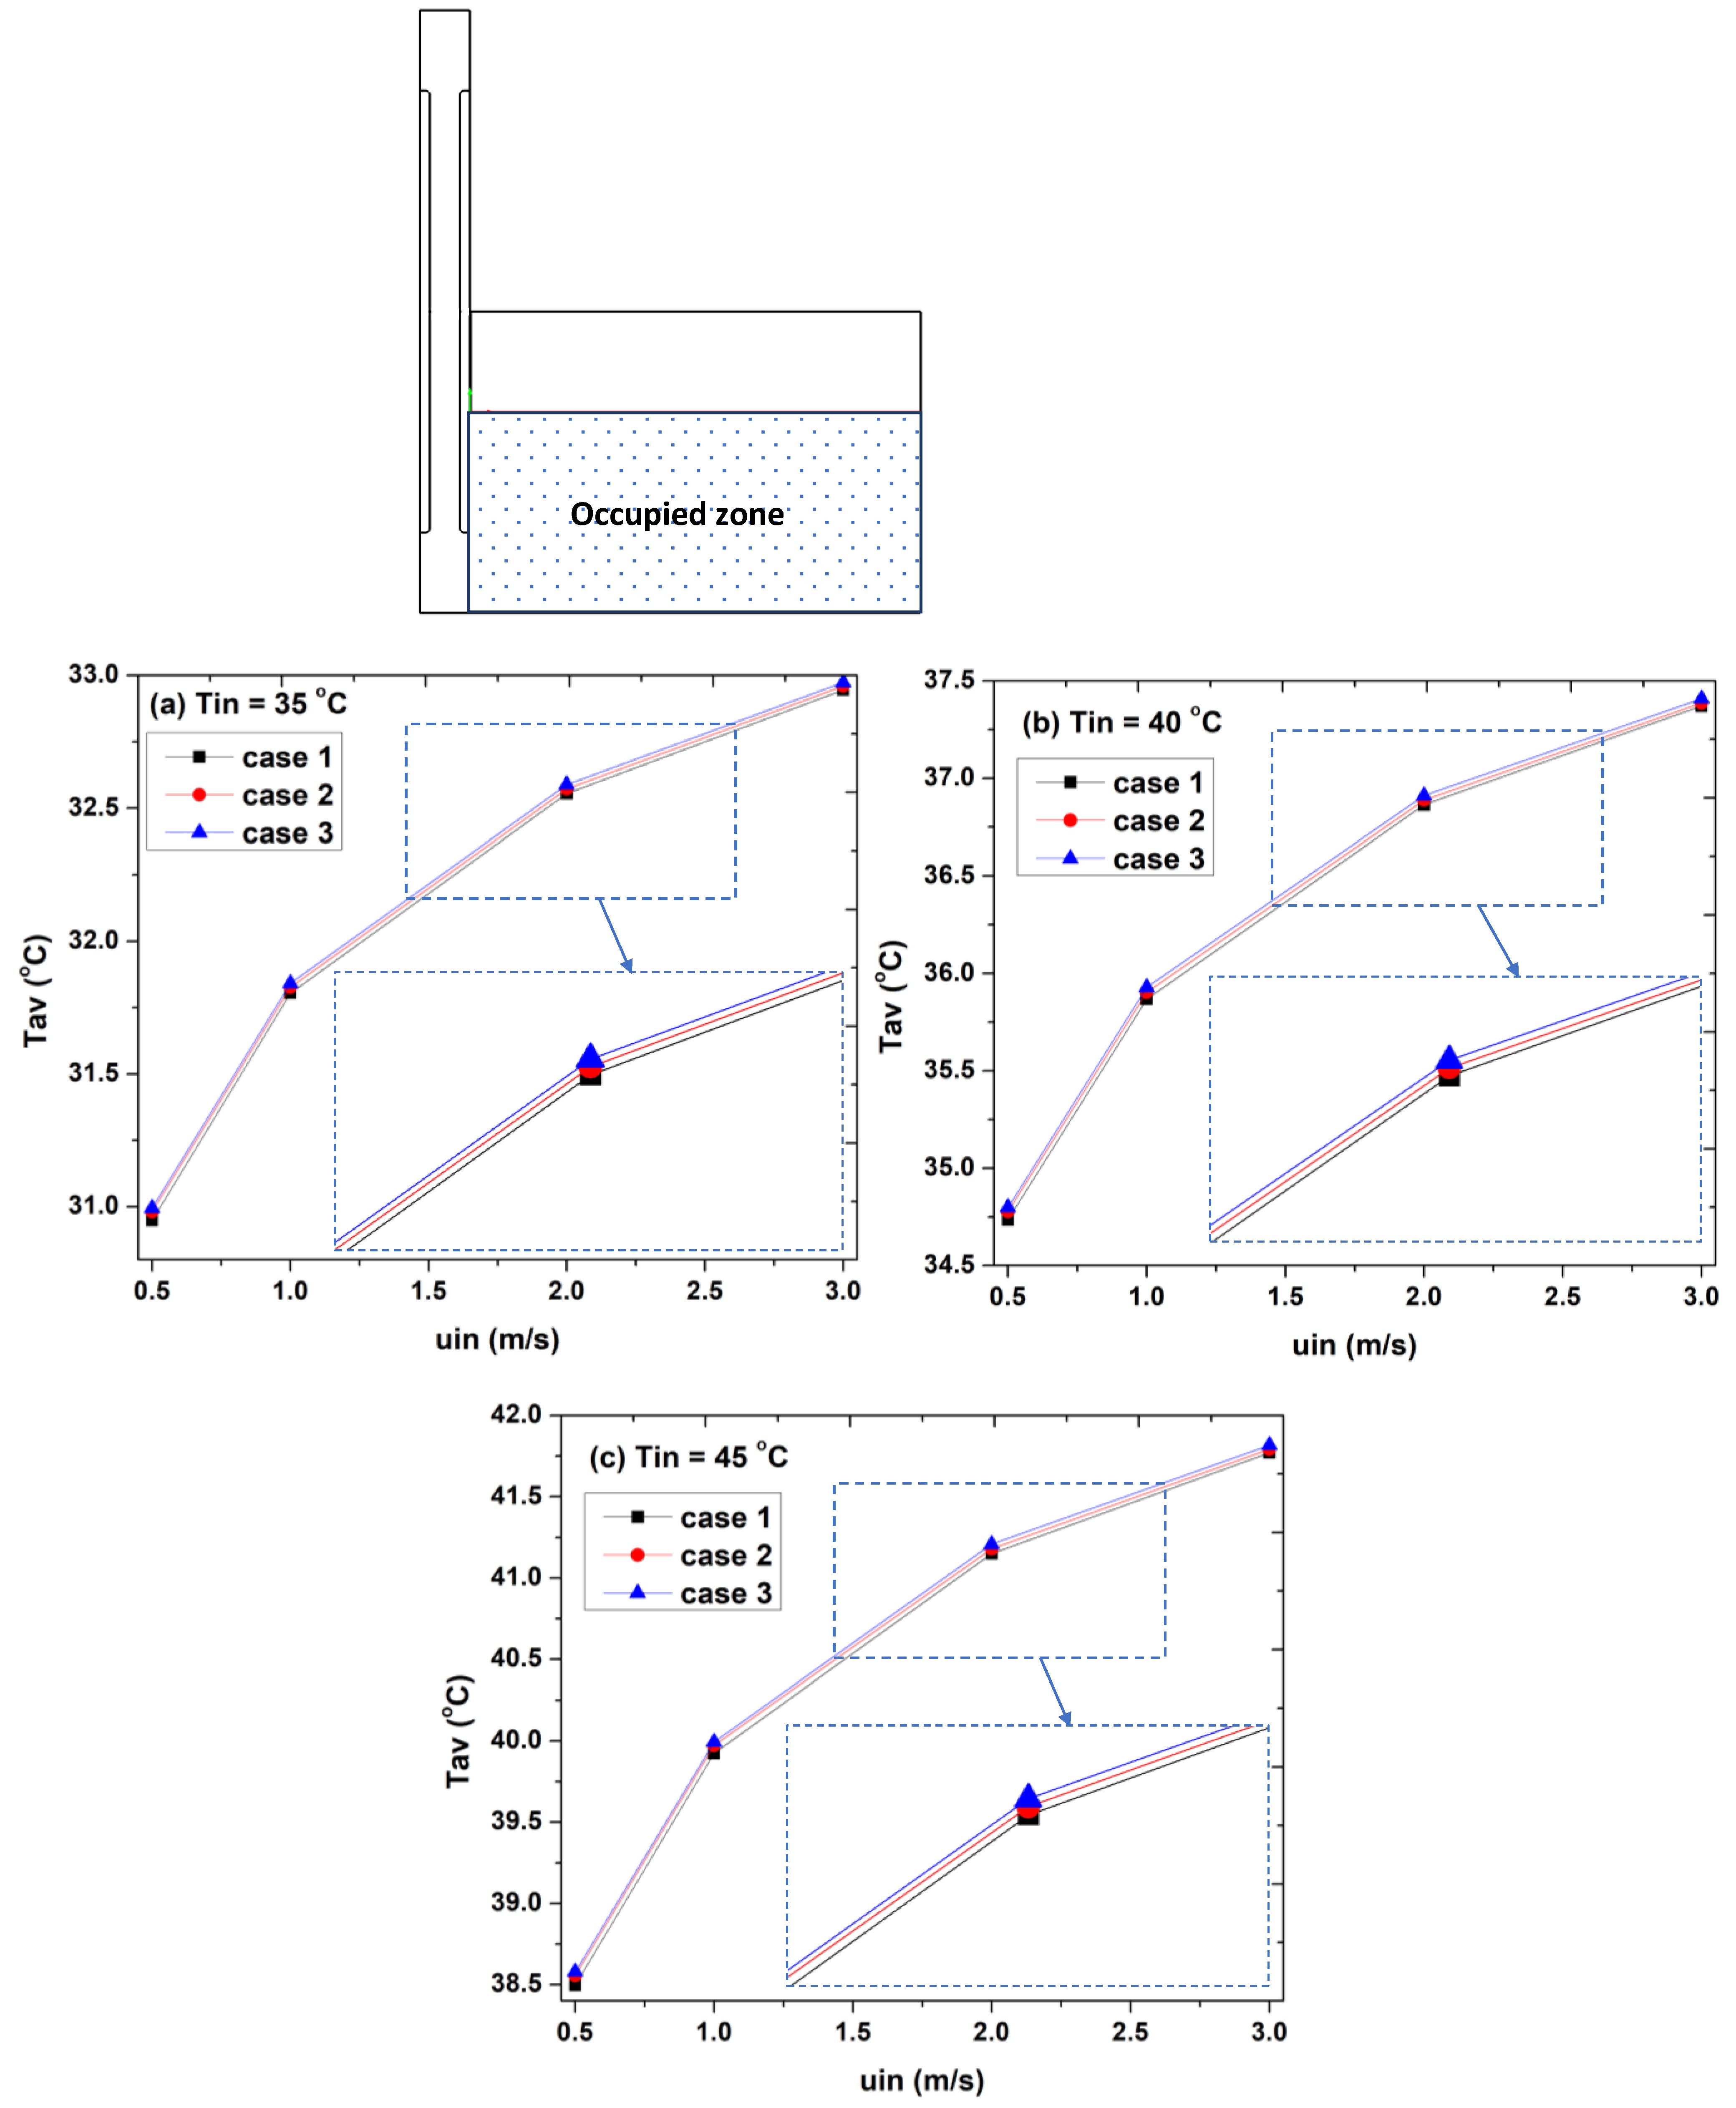
4.4. Occupation Area Study

In order to focus on the occupied area of the study space, its average surface temperature versus the velocity and temperature of the captured wind is presented in Figure 8. Three air outlet positions were considered. The previous findings were confirmed as it was noticed that the low captured wind velocities gave rise to longer residence times and consequently improved the cooling efficiency. Although the minimal cooling temperature reached was for a cold environment (low Tin), the efficiency and performance of the tower were proportional to Tin. In fact, a drop of 6.5 °C at less than 4 °C was recorded when the ambient air temperature went from 45 °C to 35 °C. Regarding the air outlet location, although Case 1 (right side roof air outlet) gave a slight efficiency improvement, its influence could be considered as negligible in relation to the occupied space.

5. Conclusions

This work investigates a new passive cooling method for buildings numerically. This innovative technique is based on a passive downdraft evaporative cooling tower (PDEC). The studied system consists of a wind collector placed at the top of a tower. This tower, which acts as an “inverted thermal chimney”, is partially covered on its inner surface with a moist porous medium. To promote natural ventilation, an air outlet system is mounted on the roof of the chamber. Three scenarios were explored based on the air outlet position. Case 1: right air outlet; Case 2: center air outlet; and Case 3: left air outlet.
In order to analyze and optimize the performance of such a system, the finite element method (FEM) with Galerkin’s procedure was applied to solve the nonlinear multiphysics governing equations.
The main interesting results obtained from this study can be highlighted as follows:
  • Regardless of the air extraction position, the flow topography is always similar. Indeed, the air movement in the chamber is always characterized by a single-cell flow turning in a counter-clockwise direction.
  • The velocity and temperature at the chimney inlet play an important role in the air conditioning quality. In fact, a temperature reduction of about 7 degrees and a relative humidity increase of 9% can be achieved inside the room for low inlet velocities.
  • The right-side roof air extraction with low capture velocity gives the best cooling efficiency.
  • The best conditions for increasing the relative humidity were found for the lowest available wind speed and temperature (Tin =35 °C and uin = 0.5 m/s). Furthermore, it should be mentioned that the position of the air outlet has no significant impact on the humification of the occupied space.

Author Contributions

M.A.A. (Mohammad Abdullah Alshenaifi): Conceptualization, Project administration, Funding acquisition, Writing—original draft, Writing—review and editing, Data curation. A.M.: Conceptualization, Investigation, Writing—review and editing, Data curation. W.H.: Writing—original draft, Writing—review and editing, Data curation. M.A.A. (Mohammed Awad Abuhussain): Formal analysis, Visualization. L.K.: Writing—original draft, Formal analysis, Visualization. All authors have read and agreed to the published version of the manuscript.

Funding

This research was funded by Scientific Research Deanship at the University of Ha’il–Saudi Arabia through project number BA-2117.

Conflicts of Interest

The authors declare no conflict of interest.

References

  1. Depren, S.K.; Kartal, M.T.; Çelikdemir, N.Ç.; Depren, Ö. Energy consumption and environmental degradation nexus: A systematic review and meta-analysis of fossil fuel and renewable energy consumption. Ecol. Inform. 2022, 70, 101747. [Google Scholar] [CrossRef]
  2. Mesloub, A.; Ghosh, A.; Albaqawy, G.A.; Noaime, E.; Alsolami, B.M. Energy and Daylighting Evaluation of Integrated Semitransparent Photovoltaic Windows with Internal Light Shelves in Open-Office Buildings. Adv. Civ. Eng. 2020, 2020, 8867558. [Google Scholar] [CrossRef]
  3. Mesloub, A.; Ghosh, A.; Touahmia, M.; Albaqawy, G.A.; Alsolami, B.M.; Ahriz, A. Assessment of the overall energy performance of an SPD smart window in a hot desert climate. Energy 2022, 252, 124073. [Google Scholar] [CrossRef]
  4. Salavatian, S. Innovative Renewable Energy. In The Importance of Greenery in Sustainable Buildings; Springer International Publishing: Berlin/Heidelberg, Germany, 2021; pp. 255–272. [Google Scholar]
  5. Michalak, P. Thermal—Airflow Coupling in Hourly Energy Simulation of a Building with Natural Stack Ventilation. Energies 2022, 15, 4175. [Google Scholar] [CrossRef]
  6. Kravchenko, I.; Kosonen, R.; Jokisalo, J.; Kilpeläinen, S. Performance of Modern Passive Stack Ventilation in a Retrofitted Nordic Apartment Building. Buildings 2022, 12, 96. [Google Scholar] [CrossRef]
  7. Mankani, K.; Nasarullah Chaudhry, H.; Kaiser Calautit, J. Optimization of An Air-cooled Heat Sink for Cooling of a Solar Photovoltaic Panel: A Computational Study. Energy Build. 2022, 270, 112274. [Google Scholar] [CrossRef]
  8. Francis, E. The Architecture and Engineering of Downdraught Cooling: A Design Source Book; PHDC Press: London, UK, 2010. [Google Scholar]
  9. Ford, B.; Schiano-Phan, R.; Vallejo, J.A. The Architecture of Natural Cooling, 2nd ed.; Routledge: London, UK, 2019. [Google Scholar]
  10. Bhamare, D.K.; Rathod, M.K.; Banerjee, J. Passive cooling techniques for building and their applicability in different climatic zones—The state of art. Energy Build. 2019, 198, 467–490. [Google Scholar] [CrossRef]
  11. Alshenaifi, M.; Sharples, S. Investigating the Impact of Architectural Form and Wind Direction on the Performance of a Passive Downdraught Evaporative Cooling Tower in Saudi Arabi. In Proceedings of the 34th International Conference on Passive and Low Energy Architecture, Hong Kong, China, 10–12 December 2018; pp. 294–299. [Google Scholar]
  12. Alshenaifi, M.; Sharples, S. Monitoring the performance of a passive downdraught evaporative cooling (PDEC) system—A case study of a library in Saudi Arabia. In Comfort at the Extremes 2019; At: Dubai, UAE, 2019. [Google Scholar]
  13. Alshenaifi, M.A.; Sharples, S. Alshenaifi, M.A.; Sharples, S. A parametric analysis of the influence of wind speed and direction on the thermal comfort performance of a Passive Downdraught Evaporative Cooling (PDEC) system—Field measurements from a Saudi Arabian library. In IOP Conference Series: Earth and Environmental Science, Proceedings of the Sustainable Built Environment Conference 2019 Wales: Policy to Practice, Cardiff, Wales, 24–25 September 2019; IOP Publishing: Bristol, UK, 2019. [Google Scholar]
  14. Bowman, N.; Lomas, K.; Cook, M.; Eppel, H.; Ford, B.; Hewitt, M.; Cucinella, M.; Francis, E.; Rodriguez, E.; Gonzalez, R.; et al. Application of Passive Downdraught Evaporative Cooling (PDEC) to non-domestic buildings. Renew Energy 1997, 10, 191–196. [Google Scholar] [CrossRef]
  15. Givoni, B. Performance of the “Shower” cooling tower in different climates. Renew Energy 1997, 10, 173–178. [Google Scholar] [CrossRef]
  16. Pearlmutter, D.; Erell, E.; Etzion, Y.; Meir, I.A.; Di, H. Refining the use of evaporation in an experimental down-draft cool tower. Energy Build. 1996, 23, 191–197. [Google Scholar] [CrossRef]
  17. Ford, B.; Wilson, R.; Gillott, M.; Ibraheem, O.; Salmeron, J.; Sanchez, F.J. Passive downdraught evaporative cooling: Performance in a prototype house. Build. Res. Inf. 2012, 40, 290–304. [Google Scholar] [CrossRef]
  18. Belarbi, R.; Ghiaus, C.; Allard, F. Modeling of water spray evaporation: Application to passive cooling of buildings. Sol. Energy 2006, 80, 1540–1552. [Google Scholar] [CrossRef]
  19. Kang, D.; Strand, R.K. Significance of parameters affecting the performance of a passive down-draft evaporative cooling (PDEC) tower with a spray system. Appl. Energy 2016, 178, 269–280. [Google Scholar] [CrossRef] [Green Version]
  20. Kang, D.; Strand, R.K. Modeling of simultaneous heat and mass transfer within passive down-draft evaporative cooling (PDEC) towers with spray in FLUENT. Energy Build. 2013, 62, 196–209. [Google Scholar] [CrossRef]
  21. Alaidroos, A.; Krarti, M. Evaluation of passive cooling systems for residential buildings in the Kingdom of Saudi Arabia. J. Sol. Energy Eng. 2016, 138, 031011. [Google Scholar] [CrossRef]
  22. Alaidroos, A.; Krarti, M. Experimental validation of a numerical model for ventilated wall cavity with spray evaporative cooling systems for hot and dry climates. Energy Build. 2016, 131, 207–222. [Google Scholar] [CrossRef]
  23. Alaidroos, A.; Krarti, M. Numerical modeling of ventilated wall cavities with spray evaporative cooling system. Energy Build. 2016, 130, 350–365. [Google Scholar] [CrossRef]
  24. Shirzadi, M.; Mirzaei, P.A.; Naghashzadegan, M. Improvement of k-epsilon turbulence model for CFD simulation of atmospheric boundary layer around a high-rise building using stochastic optimization and Monte Carlo Sampling technique. J. Wind. Eng. Ind. Aerodyn. 2017, 171, 366–379. [Google Scholar] [CrossRef]
  25. Zhu, Y.; Wang, P.; Sun, D.; Qu, Z.; Yu, B. Multiphase porous media model with thermo-hydro and mechanical bidirectional coupling for food convective drying. Int. J. Heat Mass. Transf. 2021, 175, 121356. [Google Scholar] [CrossRef]
  26. Bear, J. Dynamics of Fluids in Porous Media; American Elsevier Publishing Company, Inc: New York, NY, USA, 1972. [Google Scholar]
  27. Datta, A.K. Porous media approaches to studying simultaneous heat and mass transfer in food processes. I: Problem formulations. J. Food Eng. 2007, 80, 80–95. [Google Scholar] [CrossRef]
  28. Datta, A.K. Porous media approaches to studying simultaneous heat and mass transfer in food processes. II: Property data and representative results. J. Food Eng. 2007, 80, 96–110. [Google Scholar] [CrossRef]
  29. Selimefendigil, F.; Çoban, S.Ö.; Öztop, H. Convective drying of different shaped porous moist objects in ventilated square and l-shaped cavities. J. Porous Media 2022, 25, 45–70. [Google Scholar] [CrossRef]
  30. Selimefendigil, F.; Coban, S.O.; Öztop, H.F. An efficient method for optimizing the unsteady heat and mass transport features for convective drying of two porous moist objects in a channel. Int. J. Mech. Sci. 2021, 200, 106444. [Google Scholar] [CrossRef]
Figure 1. (a) Studied configuration and (b) used mesh.
Mathematics 10 03616 g001
Figure 2. Comparison of the flow structure with the results of References [29,30].
Mathematics 10 03616 g002
Figure 3. Effect of inlet velocity of the flow structure; Tin = 45 °C, and t = 1000 s.
Mathematics 10 03616 g003aMathematics 10 03616 g003b
Figure 4. Effect of inlet velocity of the temperature field; Tin = 45 °C, and t = 1000 s.
Mathematics 10 03616 g004aMathematics 10 03616 g004b
Figure 5. Temporal evolution of the temperature field for case 3; uin = 0.5 m/s, and Tin = 45 °C.
Mathematics 10 03616 g005aMathematics 10 03616 g005b
Figure 6. Temperature profiles in the room domain at y = 1 m for various inlet velocities.
Mathematics 10 03616 g006
Figure 7. Relative humidity profiles at y = 0.5 m for various inlet velocities and temperatures.
Mathematics 10 03616 g007
Figure 8. Effect of the inlet velocity on the average temperature in the occupied zone.
Mathematics 10 03616 g008
Table 1. The k-ε model constant [24].
CCCCμσkσε
1.441.920.00.091.01.3
Table 2. Properties of the phases of the porous moist layers.
AirLiquid WaterWater Vapor
Thermal conductivity (W·m−1·K−1)0.0250.590.026
Specific heat (J·kg−1·K−1)100641802062
Dynamic viscosity (kg/m−1·s−1)1.81 × 10−51.002 × 10−31.8 × 10⁻⁵
Molar mass (kg·mol−1)0.0280.0180.018
Table 3. Grid independency test, for Case 3, uin = 3 m/s, and Tin = 45 °C.
GridΔT = Tin − TavIncrease (%)Incremental Increase (%)
G1: 13,7522.902--
G2: 16,7202.9983.308063-
G3: 24,6513.1829.6485186.137425
G4: 59,7763.21510.785671.037084
Table 4. Time step analysis for Case 3, uin = 3 m/s, and Tin = 45 °C.
Time Step (s)2.551060
ΔT = Tin − Tav3.17643.1823.2243.2548
Publisher’s Note: MDPI stays neutral with regard to jurisdictional claims in published maps and institutional affiliations.

