You are currently viewing a new version of our website. To view the old version click .
Mathematics
  • Article
  • Open Access

26 September 2022

OADE-Net: Original and Attention-Guided DenseNet-Based Ensemble Network for Person Re-Identification Using Infrared Light Images

,
,
,
and
Division of Electronics and Electrical Engineering, Dongguk University, 30 Pildong-ro, 1-gil, Jung-gu, Seoul 04620, Korea
*
Author to whom correspondence should be addressed.
This article belongs to the Special Issue Computational Intelligent and Image Processing

Abstract

Recently, research on the methods that use images captured during day and night times has been actively conducted in the field of person re-identification (ReID). In particular, ReID has been increasingly performed using infrared (IR) images captured at night and red-green-blue (RGB) images, in addition to ReID, which only uses RGB images captured during the daytime. However, insufficient research has been conducted on ReID that only uses IR images because their color and texture information cannot be identified easily. This study thus proposes an original and attention-guided DenseNet-based ensemble network (OADE-Net)—a ReID model that can recognize pedestrians using only IR images captured during the day and night times. The OADE-Net consists of the original and attention-guided DenseNets and a shallow convolutional neural network for the ensemble network (SCE-Net), which is a model used for combining the two models. Owing to the lack of existing open datasets that only consist of IR images, the experiments are conducted by creating a new dataset that only consists of IR images retrieved from two open databases (DBPerson-Recog-DB1 and SYSU-MM01). The experimental results of the OADE-Net showed that the achieved ReID accuracy of the DBPerson-Recog-DB1 is 79.71% in rank 1, while the mean average precision (mAP) is 78.17%. Furthermore, an accuracy of 57.30% is achieved in rank 1 in the SYSU-MM01 case, whereas the accuracy of the mAP was 41.50%. Furthermore, the accuracy of the OADE-Net in both datasets is higher than that of the existing score-level fusion and state-of-the-art methods.

1. Introduction

In recent years, research on object detection and identification [1] has been actively conducted in various fields owing to advancements in pattern recognition technology. As one of the object identification fields, person re-identification (ReID) is a technology used to identify whether a pedestrian captured by a camera is the same person as a pedestrian captured by a camera at a different location [2,3]. Currently, person ReID is extensively used in security applications, particularly for tracking pedestrians based on images captured with a surveillance camera (CCTV) [4,5]. Visible-light (visible) and infrared light (IR) images are typically used for person ReID, even though most studies on ReID have traditionally used visible images captured during the daytime. However, visible images are not easily captured during nighttime or low illuminance conditions; thus, recent research has focused on person ReID where visible images and IR images are combined [4,5]. The person ReID performance in low-illuminance or nighttime environments was improved, but the necessity of using visible images still remained. Specifically, costs increase because both the visible and IR cameras are used. In addition, an issue still arises that objects are difficult to be discriminated in visible images at night. To overcome this problem, the utilization of IR images for ReID can be considered, but there is very little previous research conducted until [6]. However, it has the disadvantage of not considering various problems that occur in IR images captured during the daytime, e.g., the difficulty of distinguishing an object owing to similar background temperatures and the object, and the consequent accuracy of ReID is low. Accordingly, this study proposes an IR image-based ReID method considering the problems, and the advantage of our method is that the proposed method shows the high accuracies of the person ReID for both daytime and night IR images.
In general, there are other problems associated with the cases wherein only IR images are used compared with the use of visible images. In effect, there is no color information in IR images. Considering the color information of clothing is not available, only shape information can be used. Furthermore, there is much noise in input images and the resolution of IR images is usually low, making it difficult to re-identify a person in IR images. In addition, ReID performance is drastically degraded when the illuminance values of the background and person are similar, when the image is acquired from afar, or when the appearances of different people are similar [6,7]. To resolve these issues, this study proposes a ReID method based on an original and attention-guided DenseNet-based ensemble network (OADE-Net). The study contributions are as follows:
-
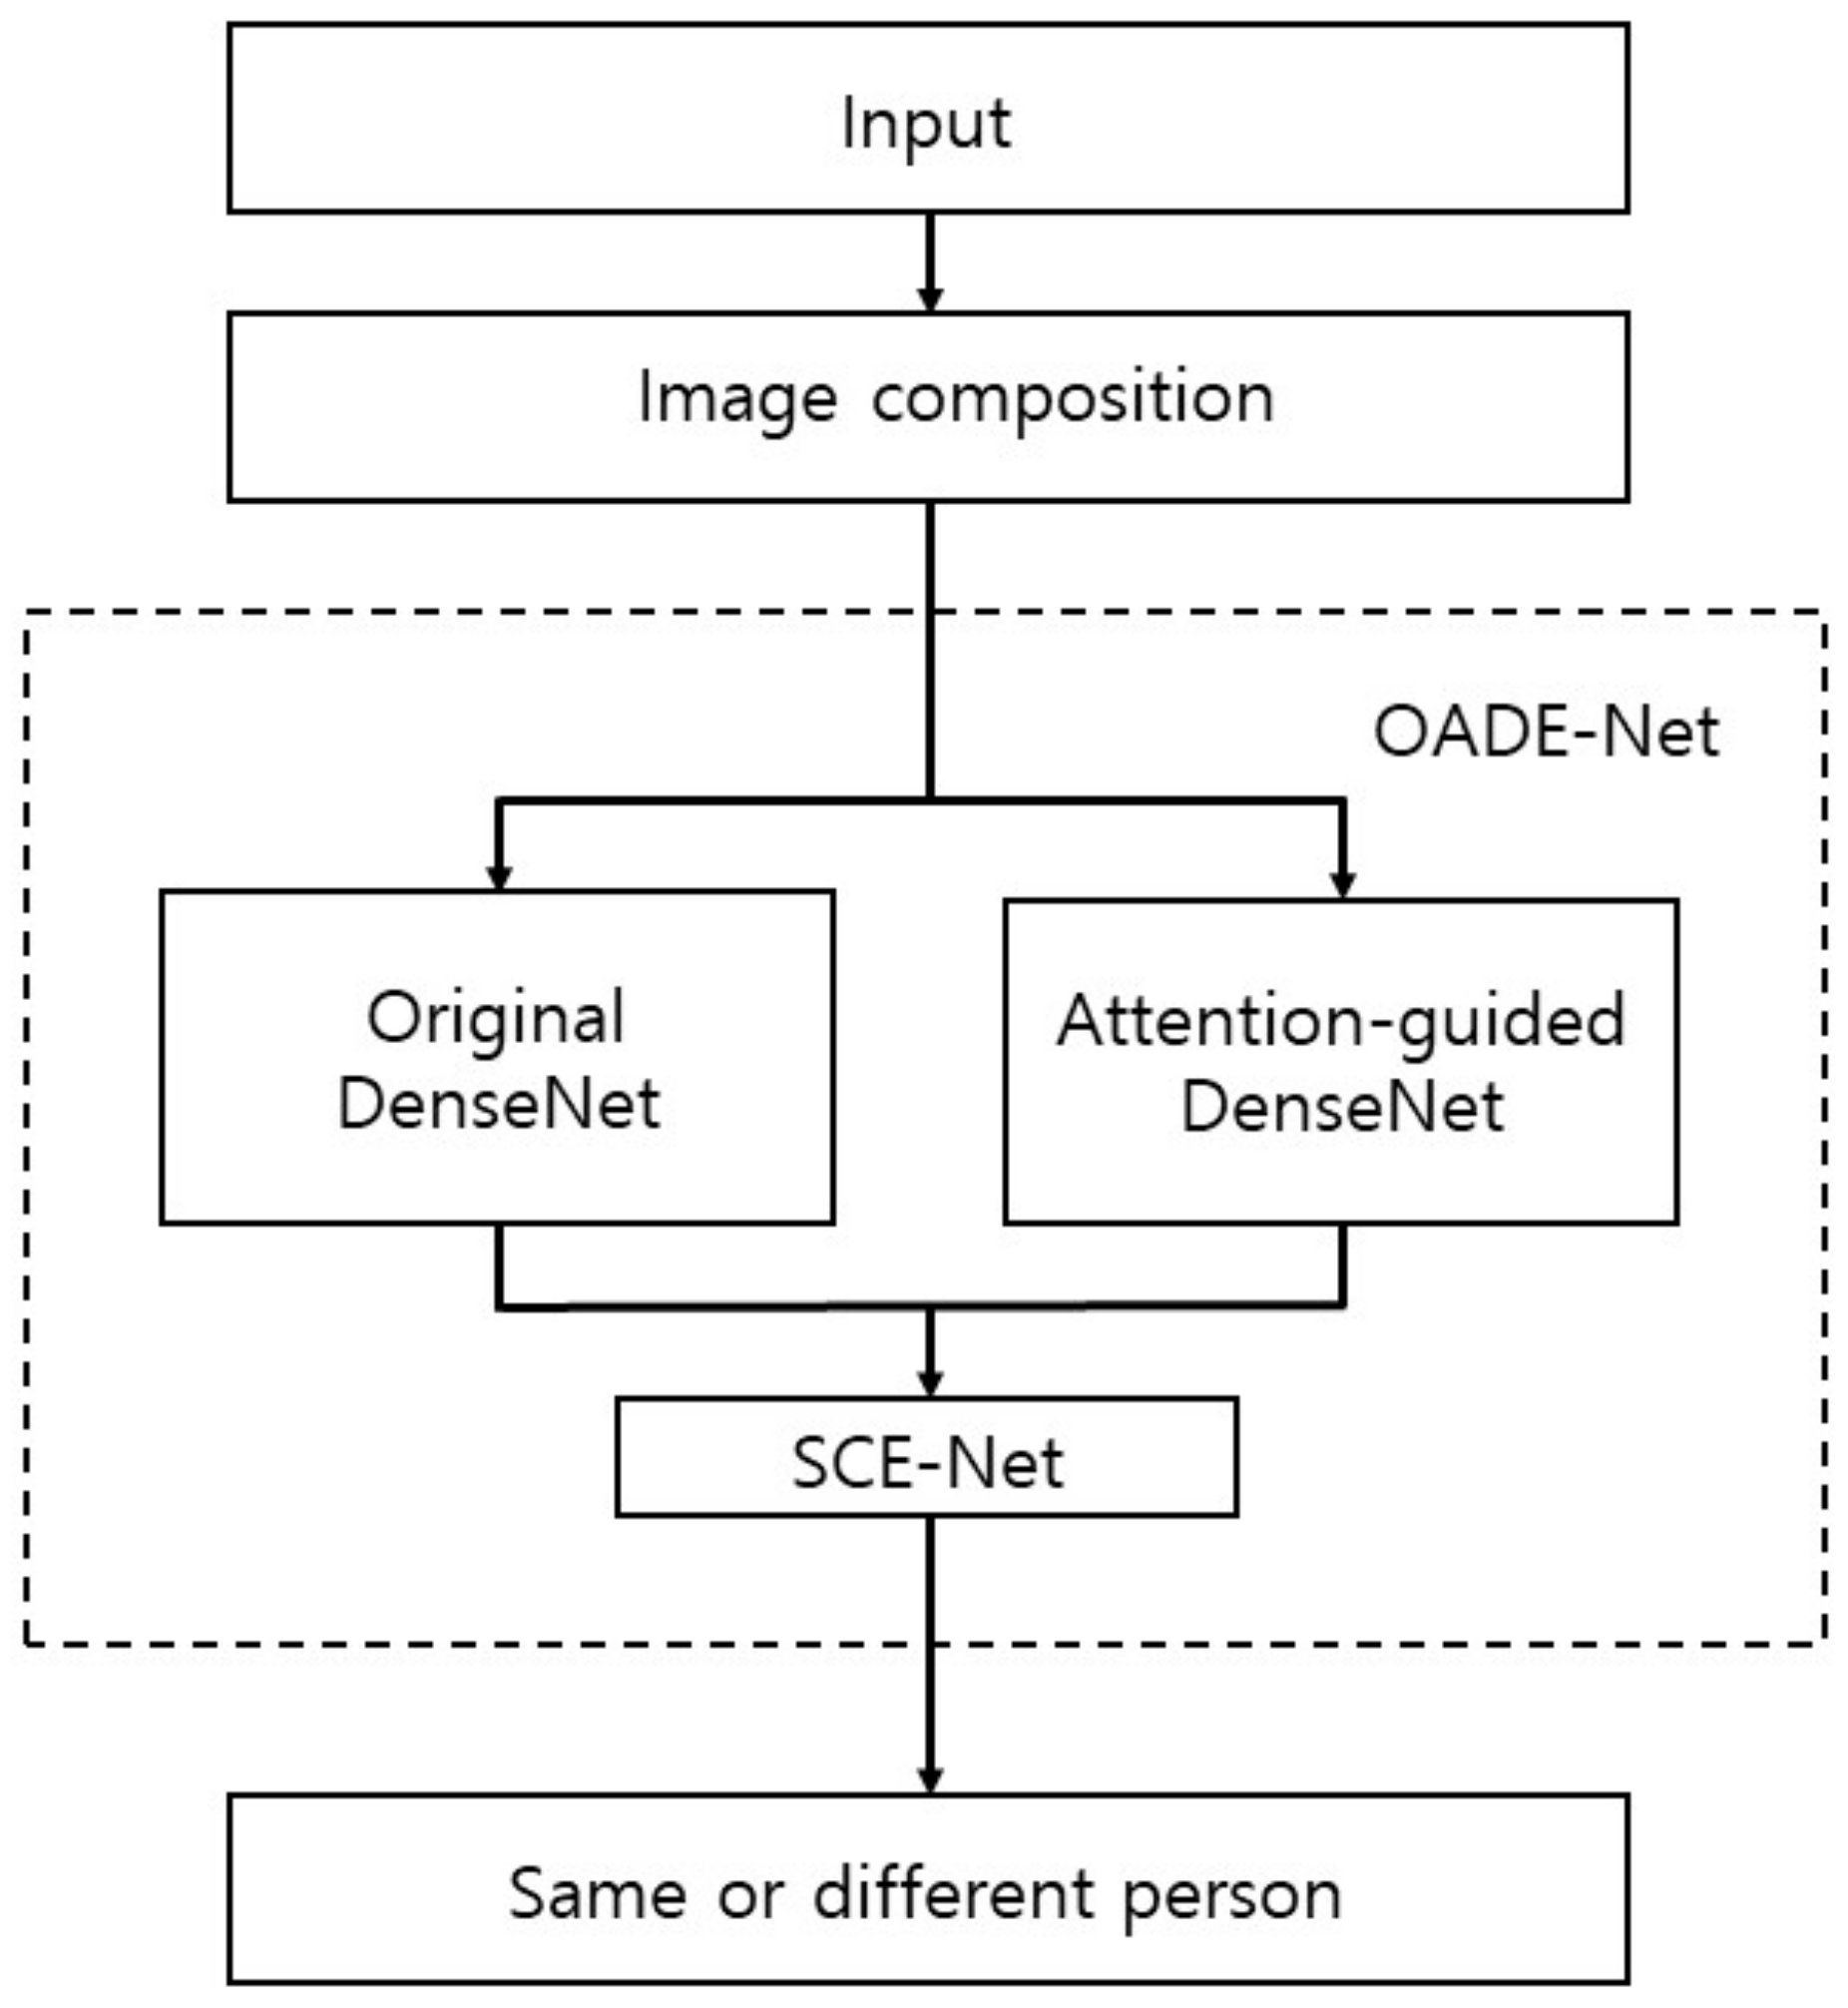
This study proposes the OADE-Net for IR image-based person ReID for solving person ReID performance affected considerably by illuminance and environmental changes of visible images;
-
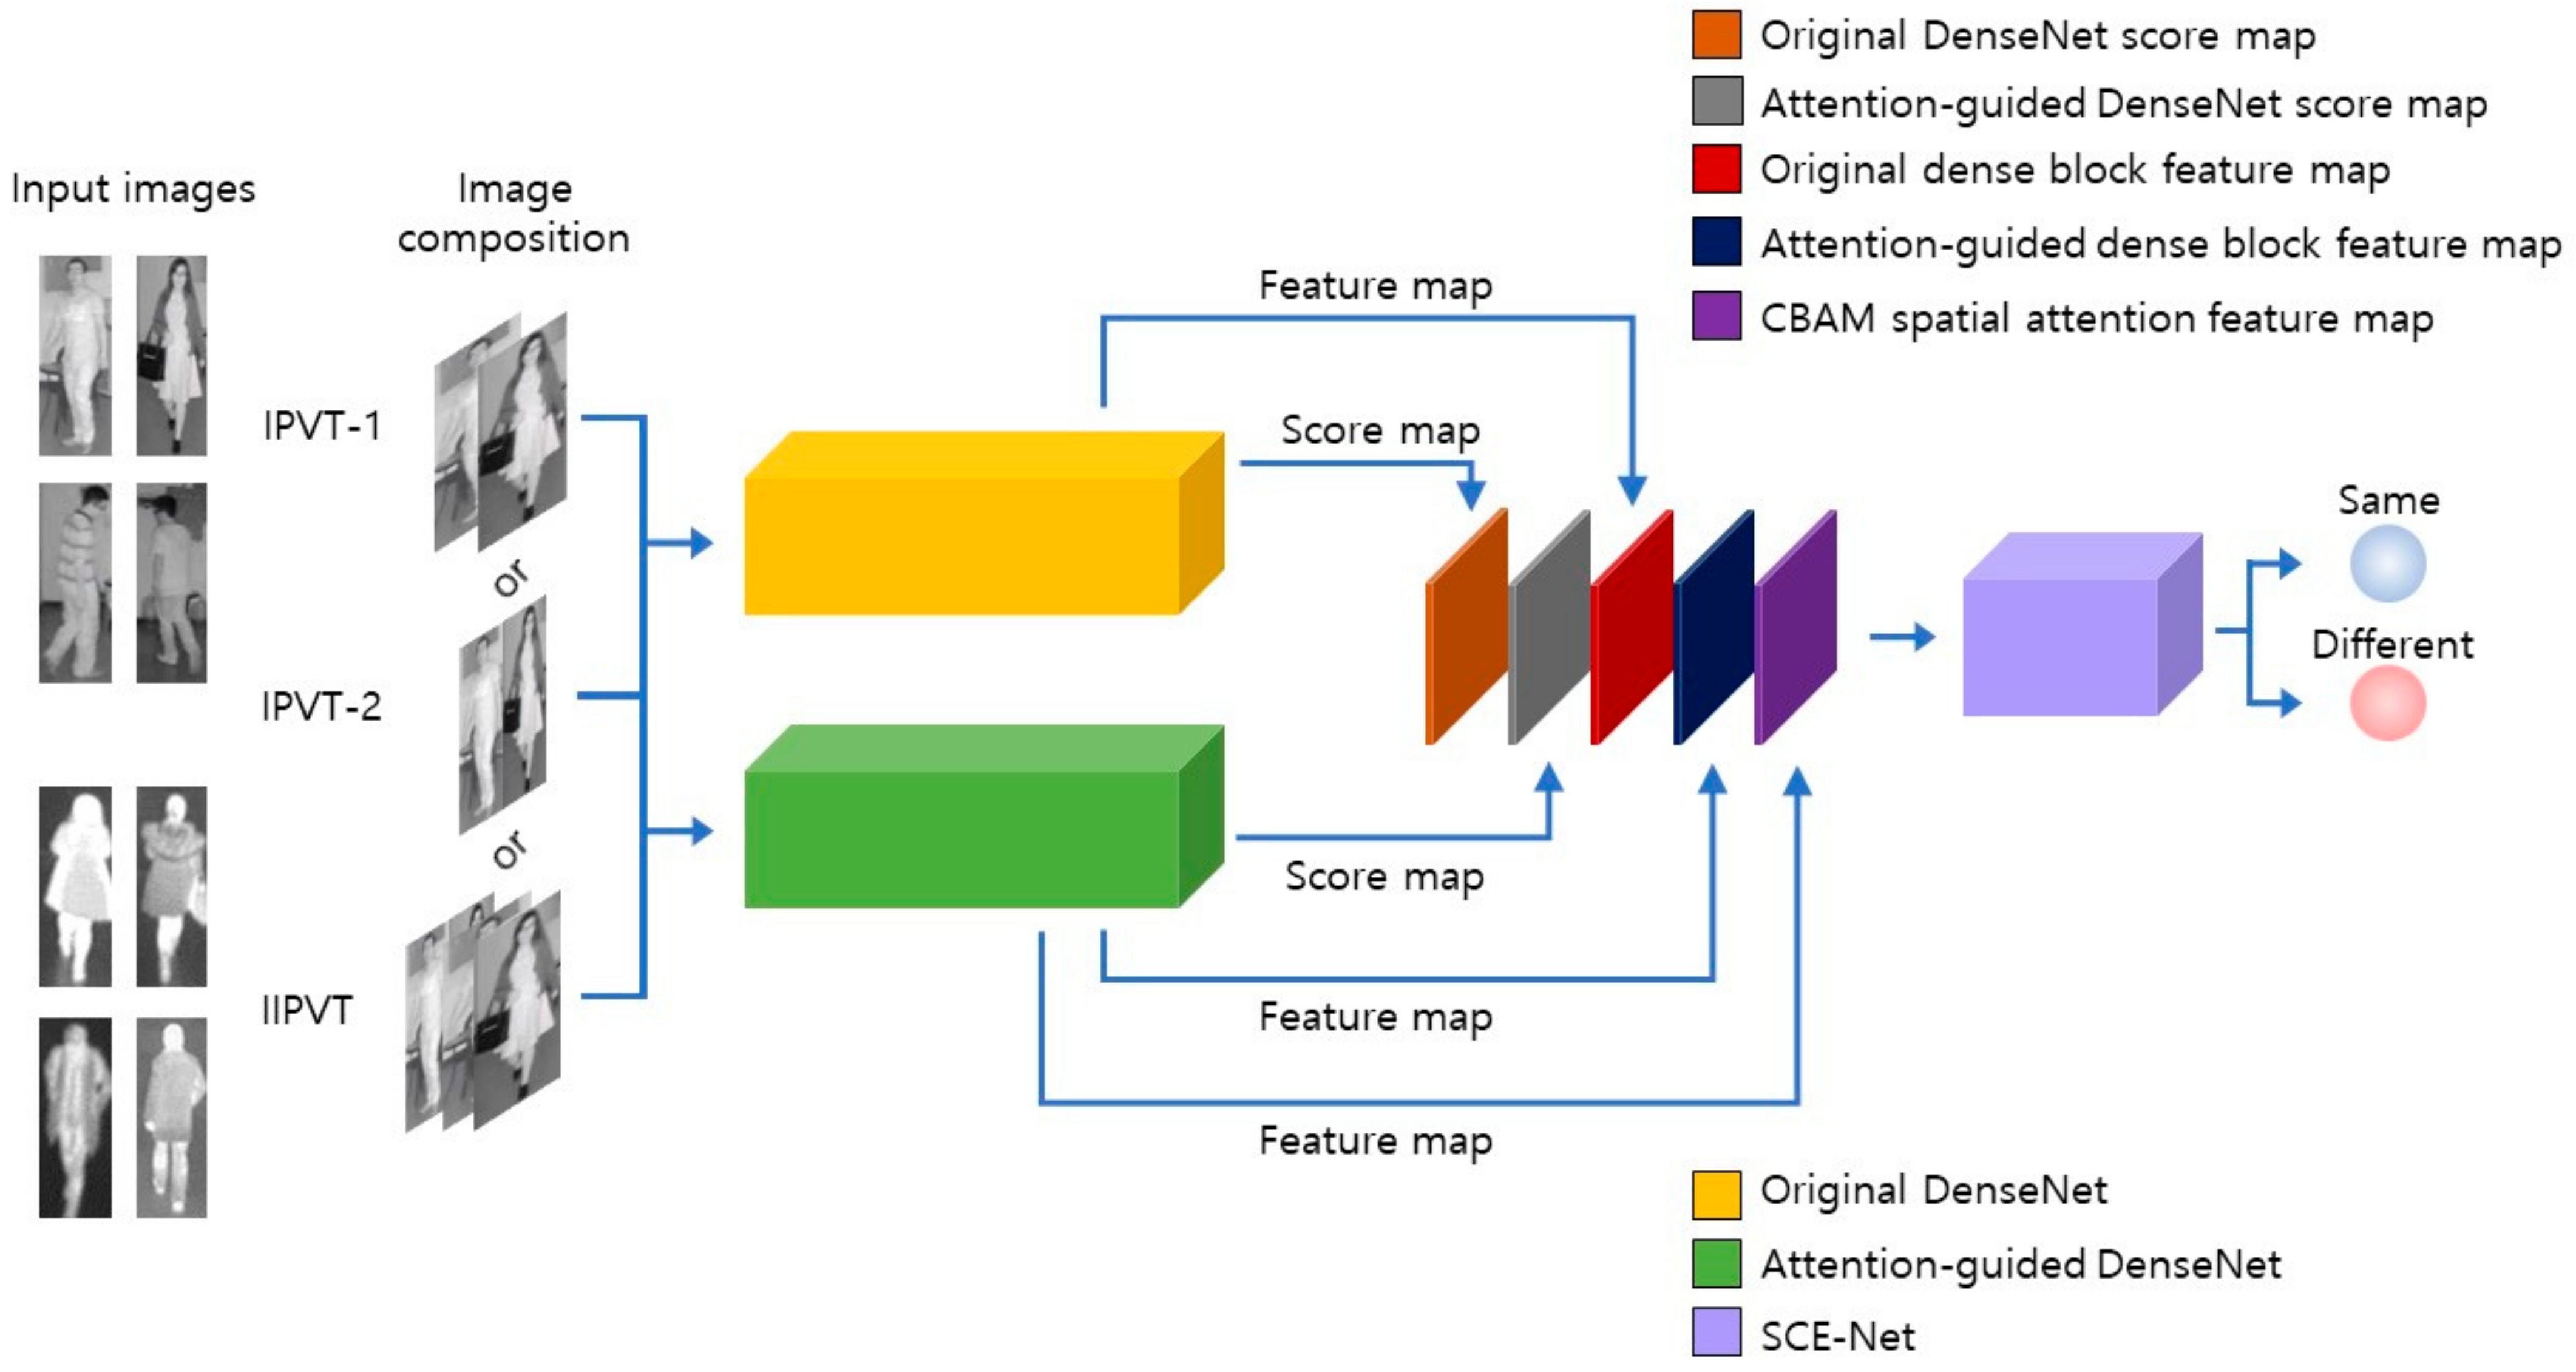
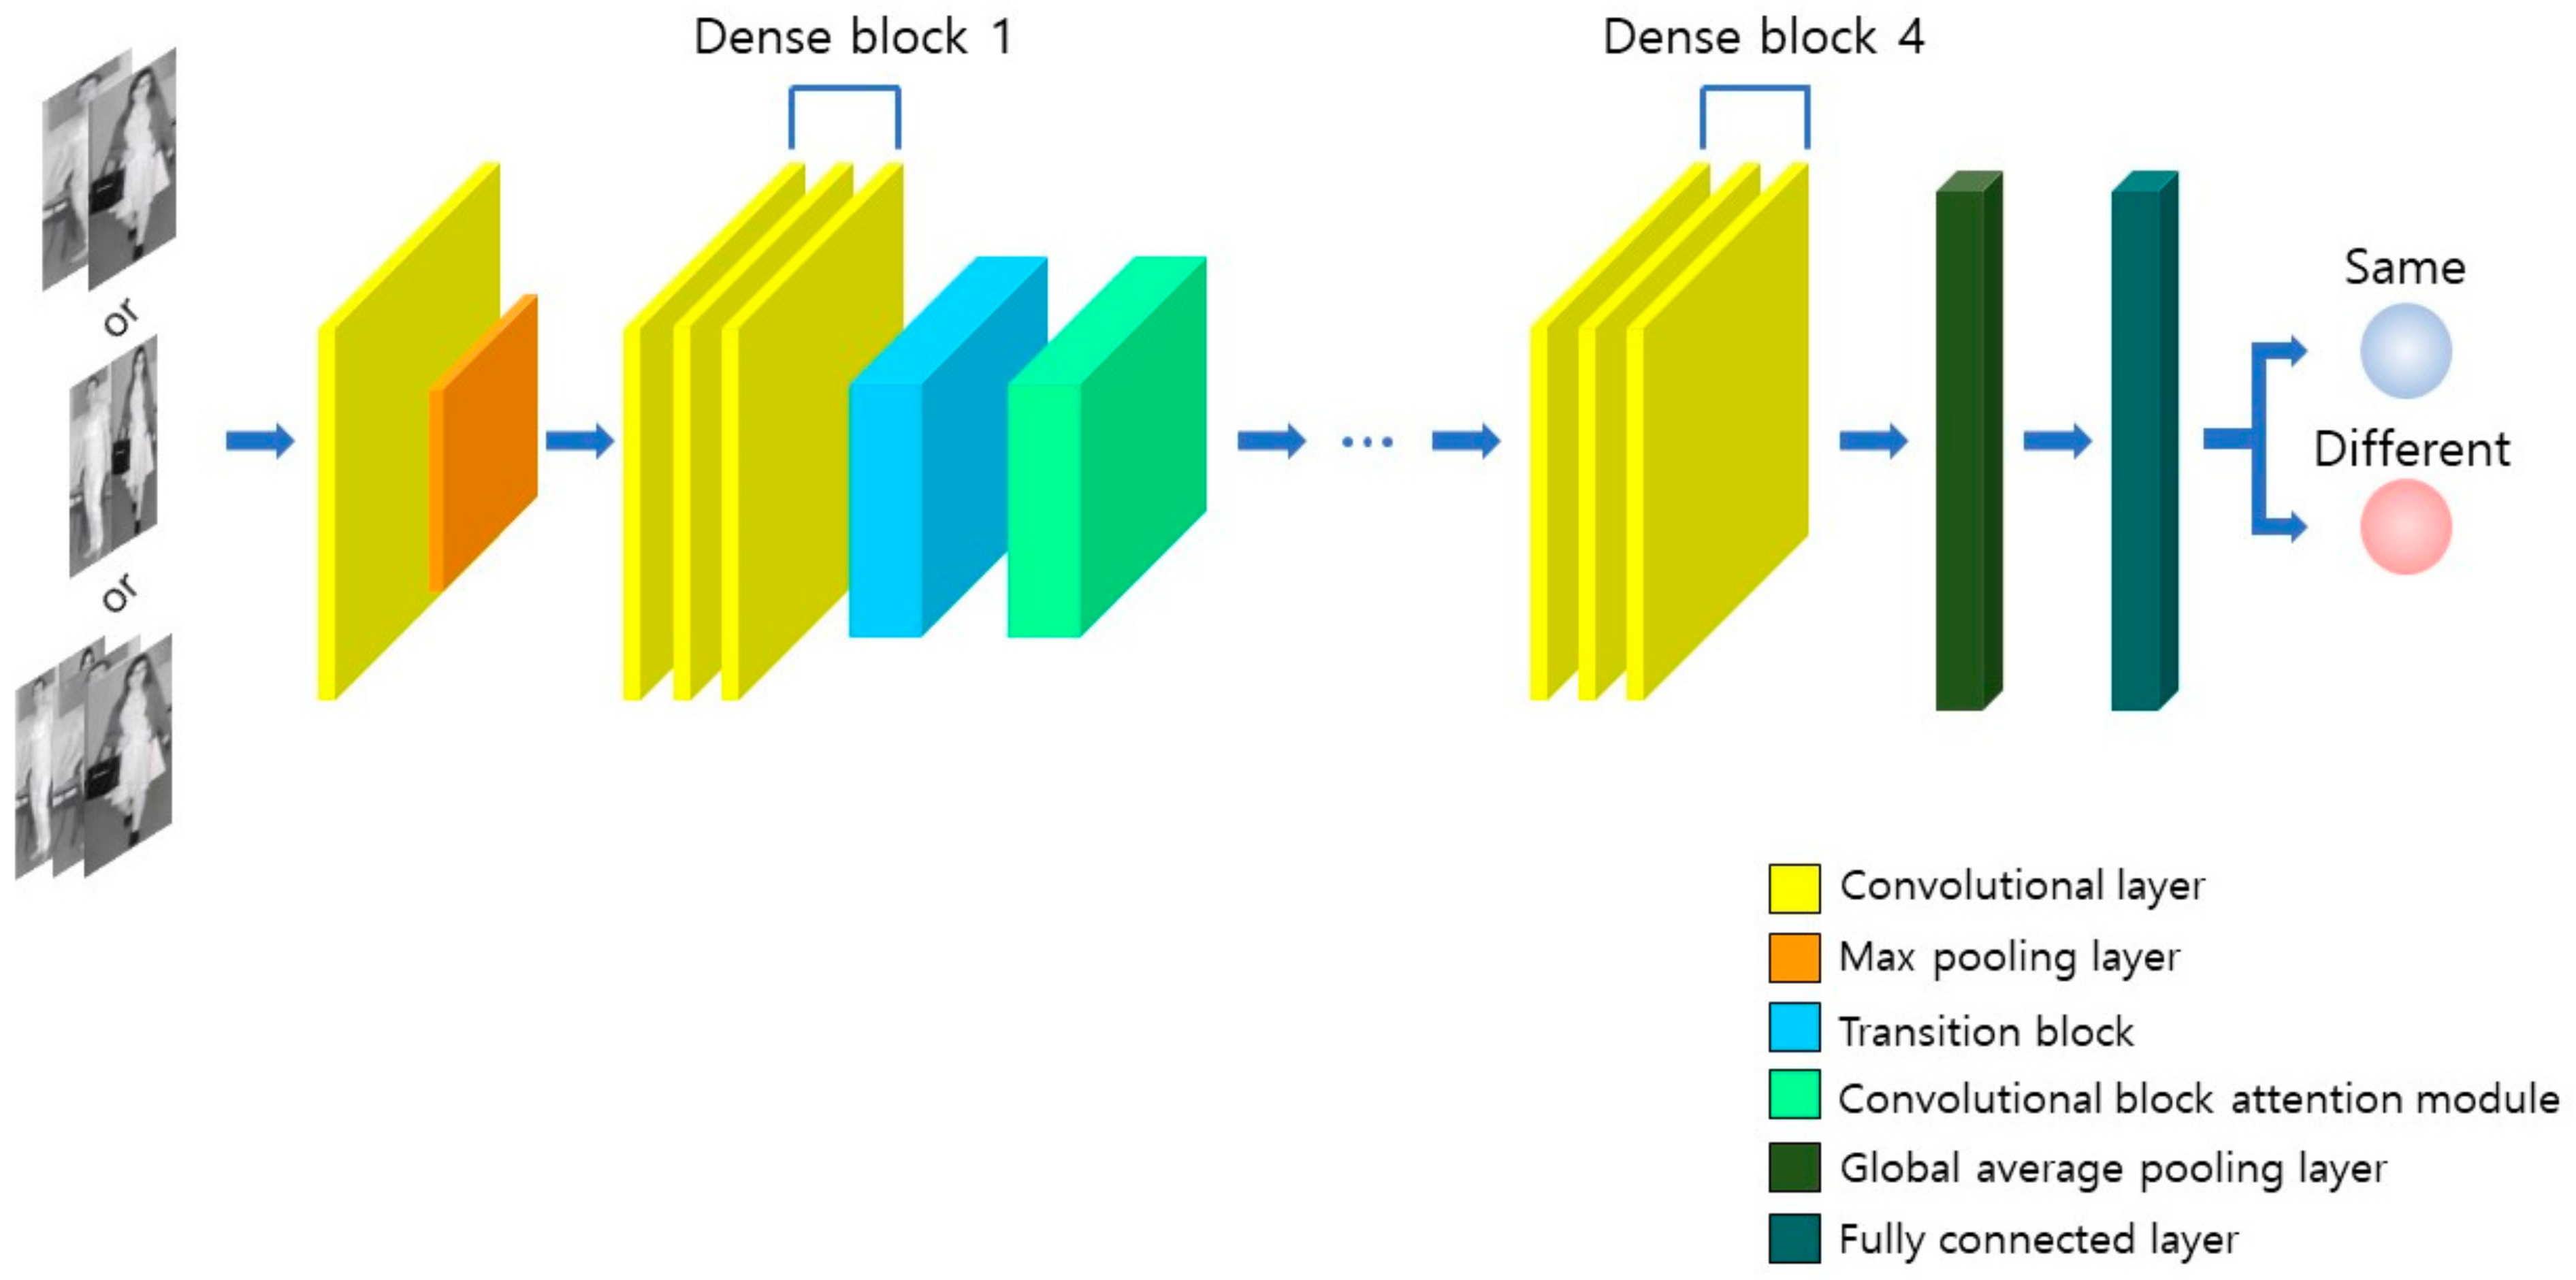
In the OADE-Net, DenseNet was combined with the attention-guided DenseNet, including the convolutional block attention module (CBAM), in the form of an ensemble network. A shallow convolutional neural network (CNN) for ensemble network (SCE-Net) was newly proposed for combining the DenseNet and attention-guided DenseNet;
-
SCE-Net uses a multiple channel input consisting of feature and score maps obtained from DenseNet and attention-guided DenseNet, achieving higher person ReID accuracies compared to those obtained using conventional score-level fusion methods;
-
The proposed models are disclosed on the GitHub site [8] for a fair performance evaluation by other researchers.
The remaining parts of this paper are organized as follows. Section 2 introduces related studies. Section 3 explains the proposed method in detail. Section 4 presents the experimental results and relevant analyses, and Section 5 outlines the conclusions.

3. Proposed Method

The overall procedure of the proposed method is illustrated in Figure 1. As proposed by Kang et al. [17], starting from the input IR image, image composition is performed based on the inter-channel pair between the visible-light and thermal images (IPVT-1), which combines two images of enrolled and query images in two channels; an intra-channel pair between the visible-light and thermal images (IPVT-2), which pastes two images of enrolled and query images in the horizontal way of one channel; inter-channel and intra-channel pairs between the visible-light and thermal images (IIPVT), which combines IPVT-1 and IPVT-2 in three channels as shown in Figure 2. Subsequently, a composited image is used as an input for DenseNet-161 (original DenseNet) and the attention-guided DenseNet; the same or different persons were determined based on the output of SCE-Net, which used the multiple-channel input extracted accordingly.
Figure 1. Overall procedure of proposed method. (OADE-Net: original and attention-guided DenseNet-based ensemble network; SCE-Net: shallow convolutional neural network for ensemble network).
Figure 2. Architecture of OADE-Net. (IPVT-1: the inter-channel pair between the visible-light and thermal images; IPVT-2: intra-channel pair between the visible-light and thermal images; IIPVT: inter-channel and intra-channel pairs between the visible-light and thermal images).

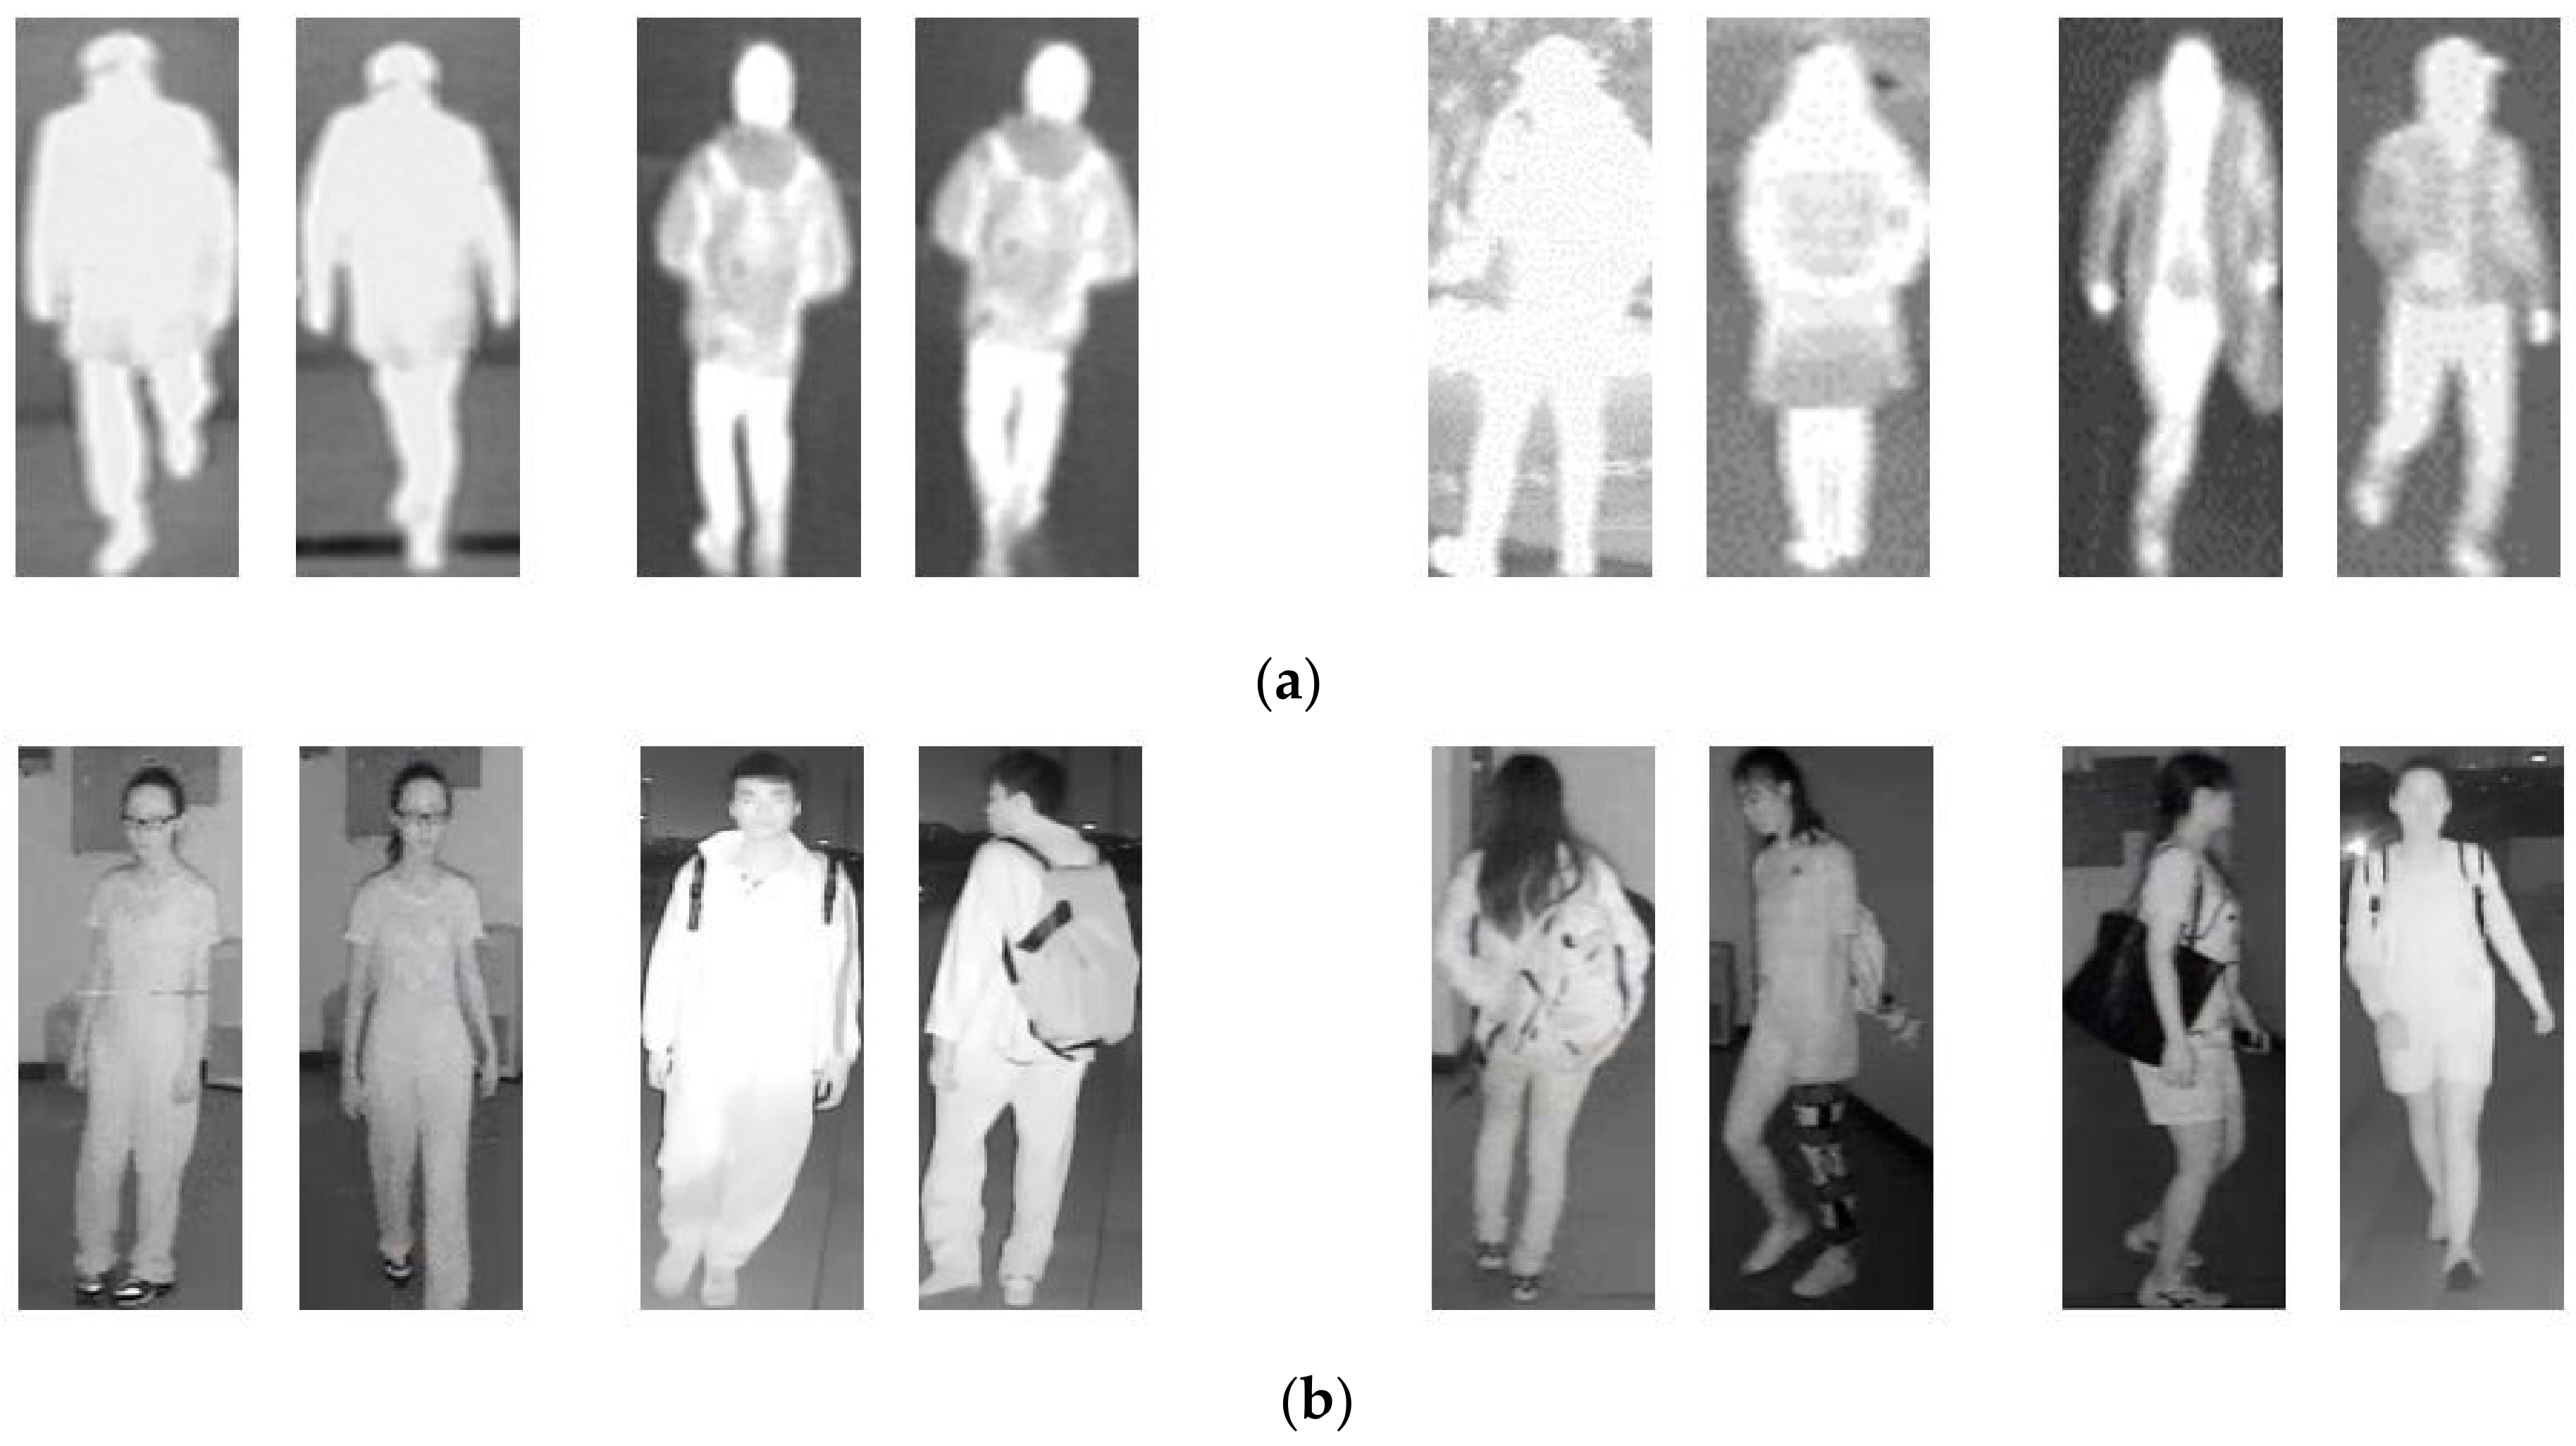
3.1. Image Composition
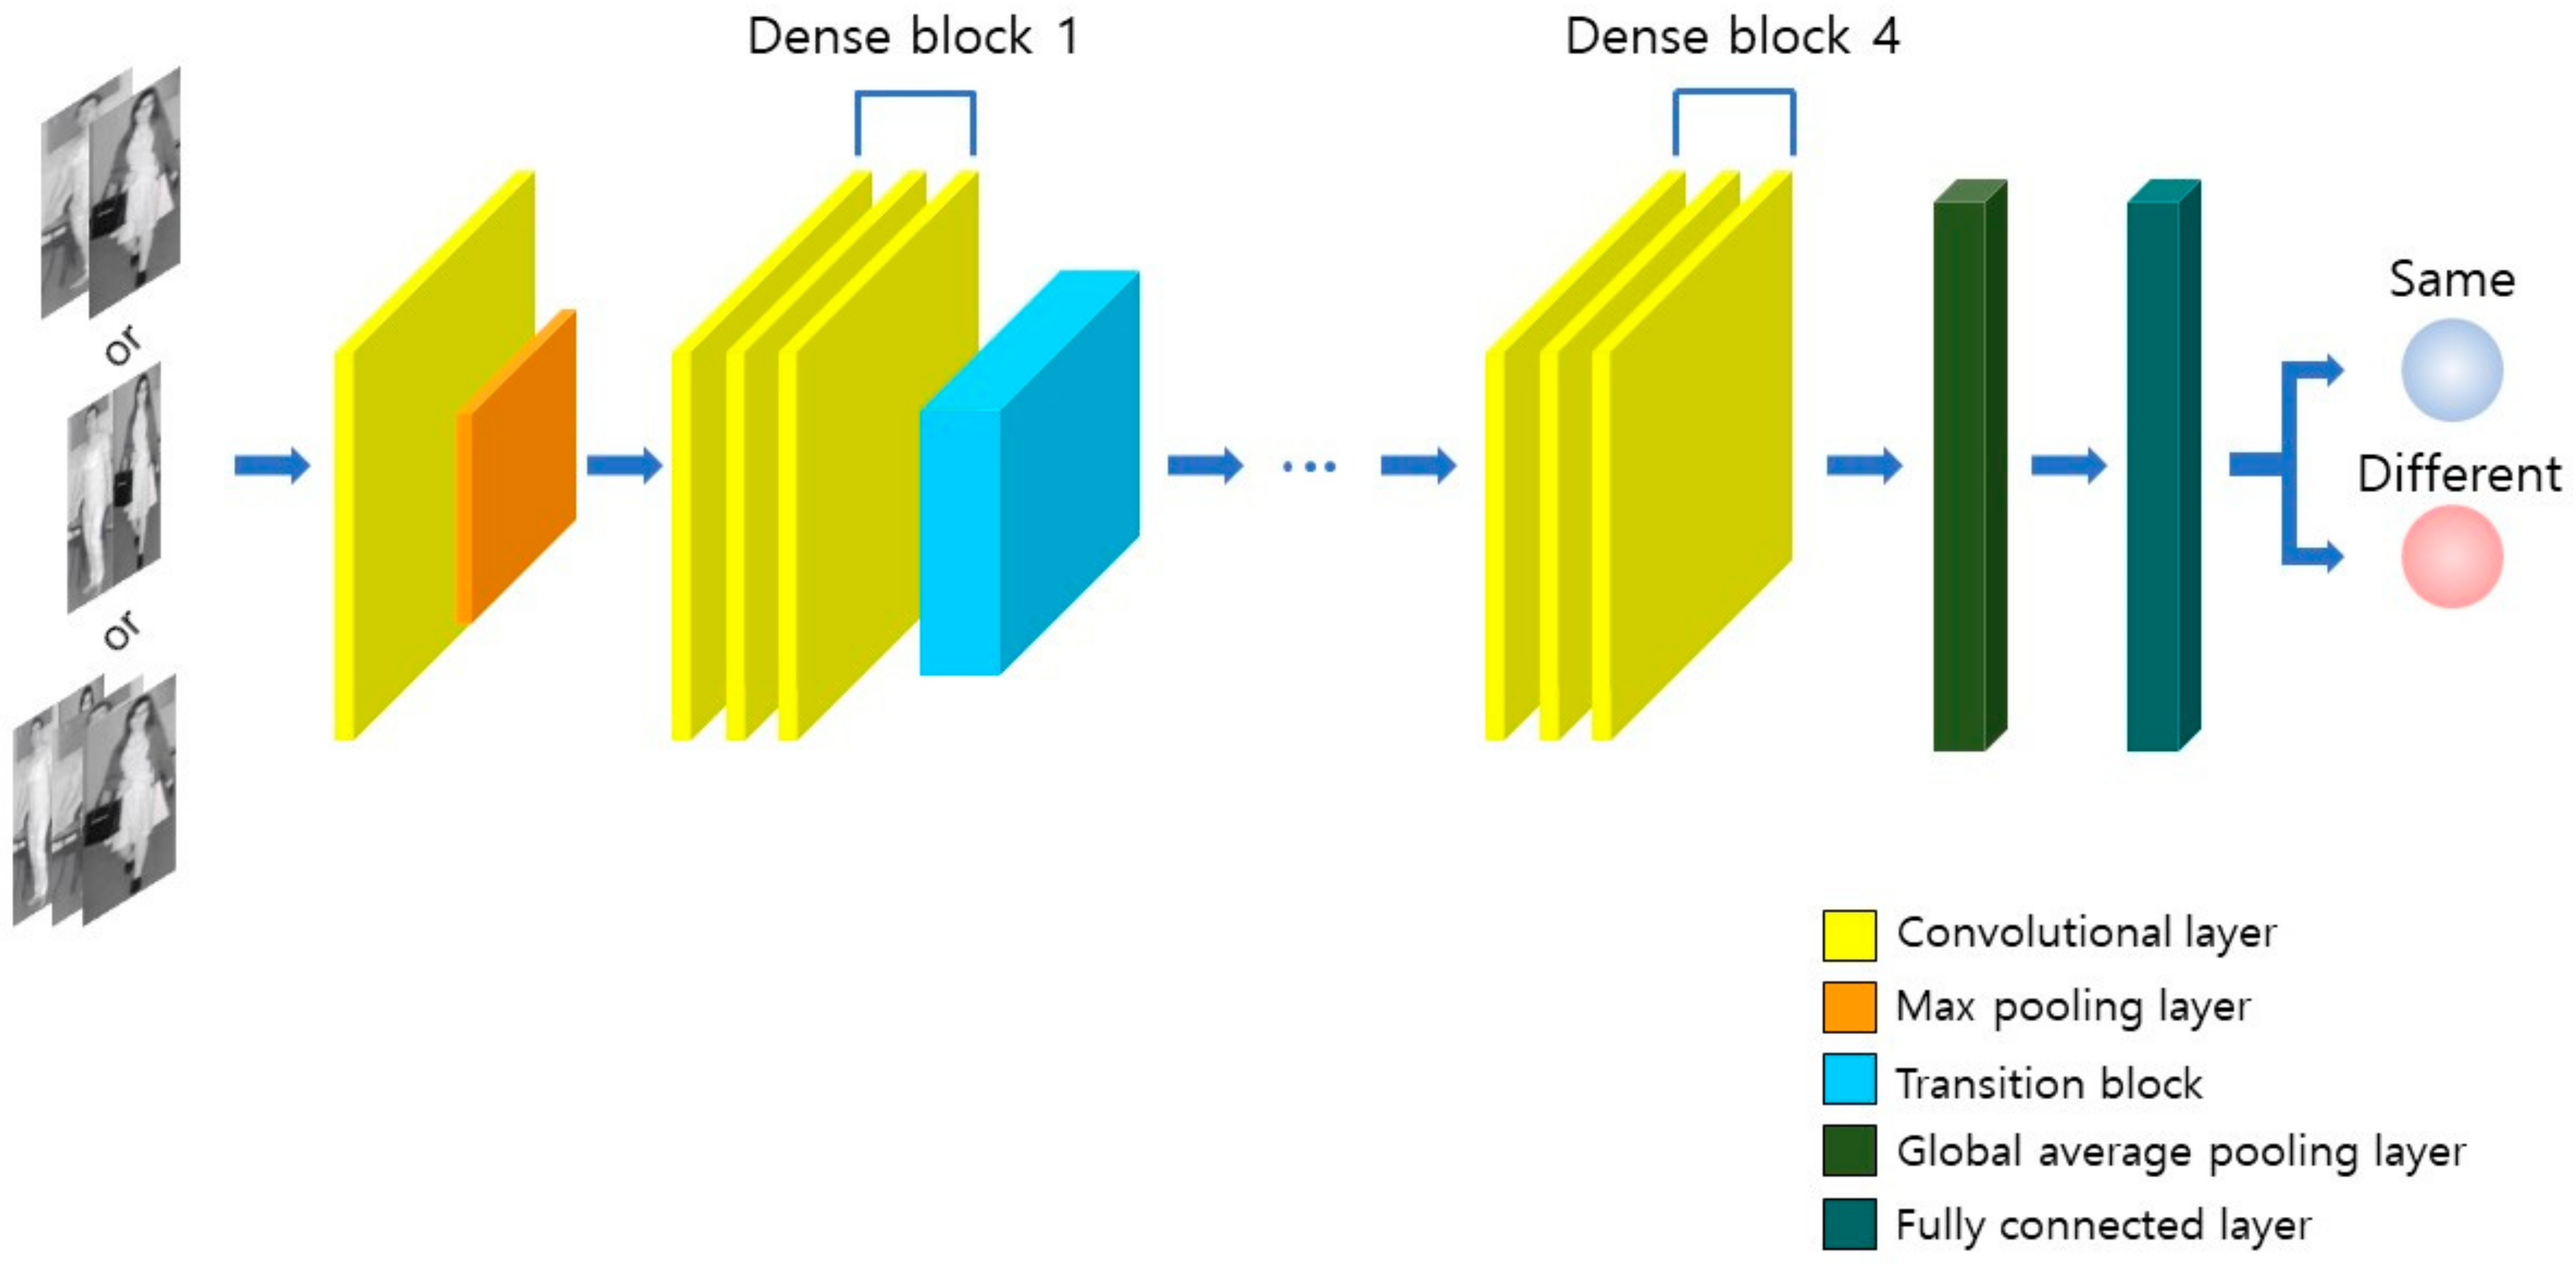
The IPVT-1, IPVT-2, and IIPVT—performed for preprocessing—are the methods used for combining images given as an input. When this preprocessing is applied, a network can be designed with one-stream instead of two-stream architectures that require two images as an input. IPVT-1 is an inter-channel combination wherein two images are concatenated in the channel direction. IPVT-2 is an intra-channel combination wherein two images are concatenated in one channel at half of their original size. IIPVT is created by combining IPVT-1 and IPVT-2. Accordingly, IPVT-1 and IPVT-2 are concatenated in the channel direction to create a three-channel image [17]. Therefore, a model is trained with features to distinguish whether the recognized person is the same person (or not) when the combined images are input into the one-stream architecture.

3.2. OADE-Net

The OADE-Net proposed in this study is a network where the original DenseNet and the attention-guided DenseNet are combined by SCE-Net. SCE-Net uses a multiple channel input consisting of feature and score maps obtained from DenseNet and attention-guided DenseNet as shown in Figure 2. Fundamentally, IR images have less color and texture information than visible images. They are thus associated with limitations in terms of person feature extraction from images. Hence, accurate person ReID cannot be expected if only the original DenseNet is used. This study proposed a method to improve performance by combining the attention-guided DenseNet added with CBAM and the original DenseNet as an ensemble. DenseNet-161 was used as the base model of the original DenseNet and the attention-guided DenseNet, and the combined image (IPVT-1, IPVT-2, IIPVT) of two pedestrian images (probe and query images) was used as an input of the network. Furthermore, the model was trained to output a score indicating whether the pedestrian in the images is the same or a different person. The architecture of the OADE-Net is illustrated in Figure 2.
DenseNet connects the feature map of a previous layer with the feature map of a subsequent layer. When the layers are connected, concatenation is applied instead of simple addition. Specifically, there is a condition in which the size of feature maps must be identical. Each layer comprises a few channels because the number of channels increases as feature maps are connected [21]. When the DenseNet architecture is used, the initial value is directly delivered to the last layer, which reduces the number of reused features, the number of parameters, and the computational workload. Another characteristic is that a dense block is used for pooling computation. A dense block consists of multiple layers, and pooling computation is performed between dense blocks. Pooling computation is performed in the order of batch normalization [22], 1 × 1 convolution, and 2 × 2 average pooling, collectively referred to as a transition layer. For the experiment, the growth rate, a hyperparameter of the original DenseNet, was set to 46. Fully connected (FC) layers, which previously had 1000 outputs, were adjusted to have two outputs and were then fine-tuned with the training data of this study. The architecture of the original DenseNet is shown in Figure 3, while the structure is presented in Table A1 (Appendix A).
Figure 3. Architecture of original DenseNet. (DenseNet-161).

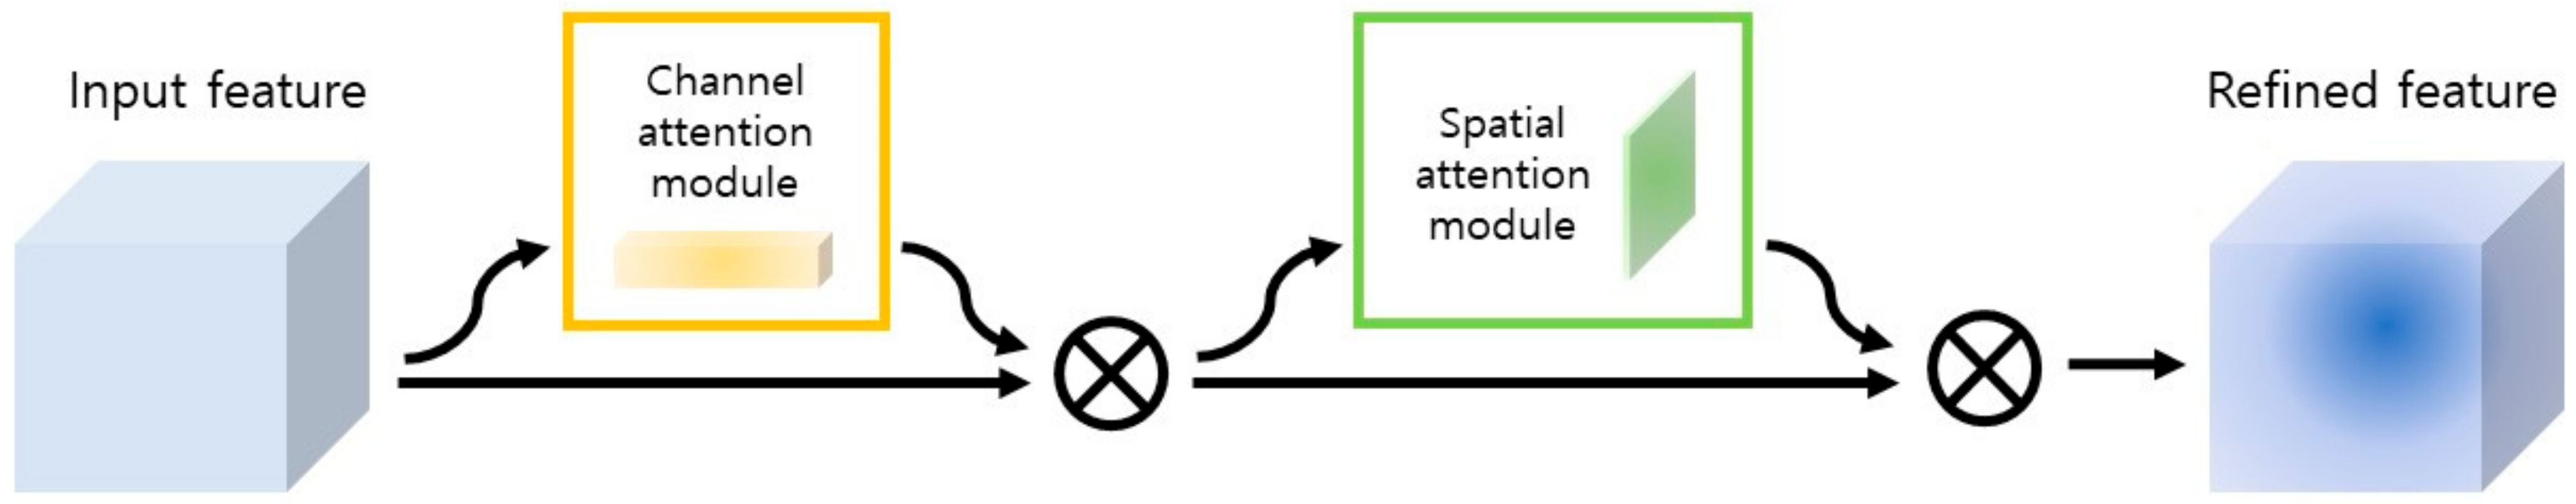
3.3. Attention-Guided DenseNet
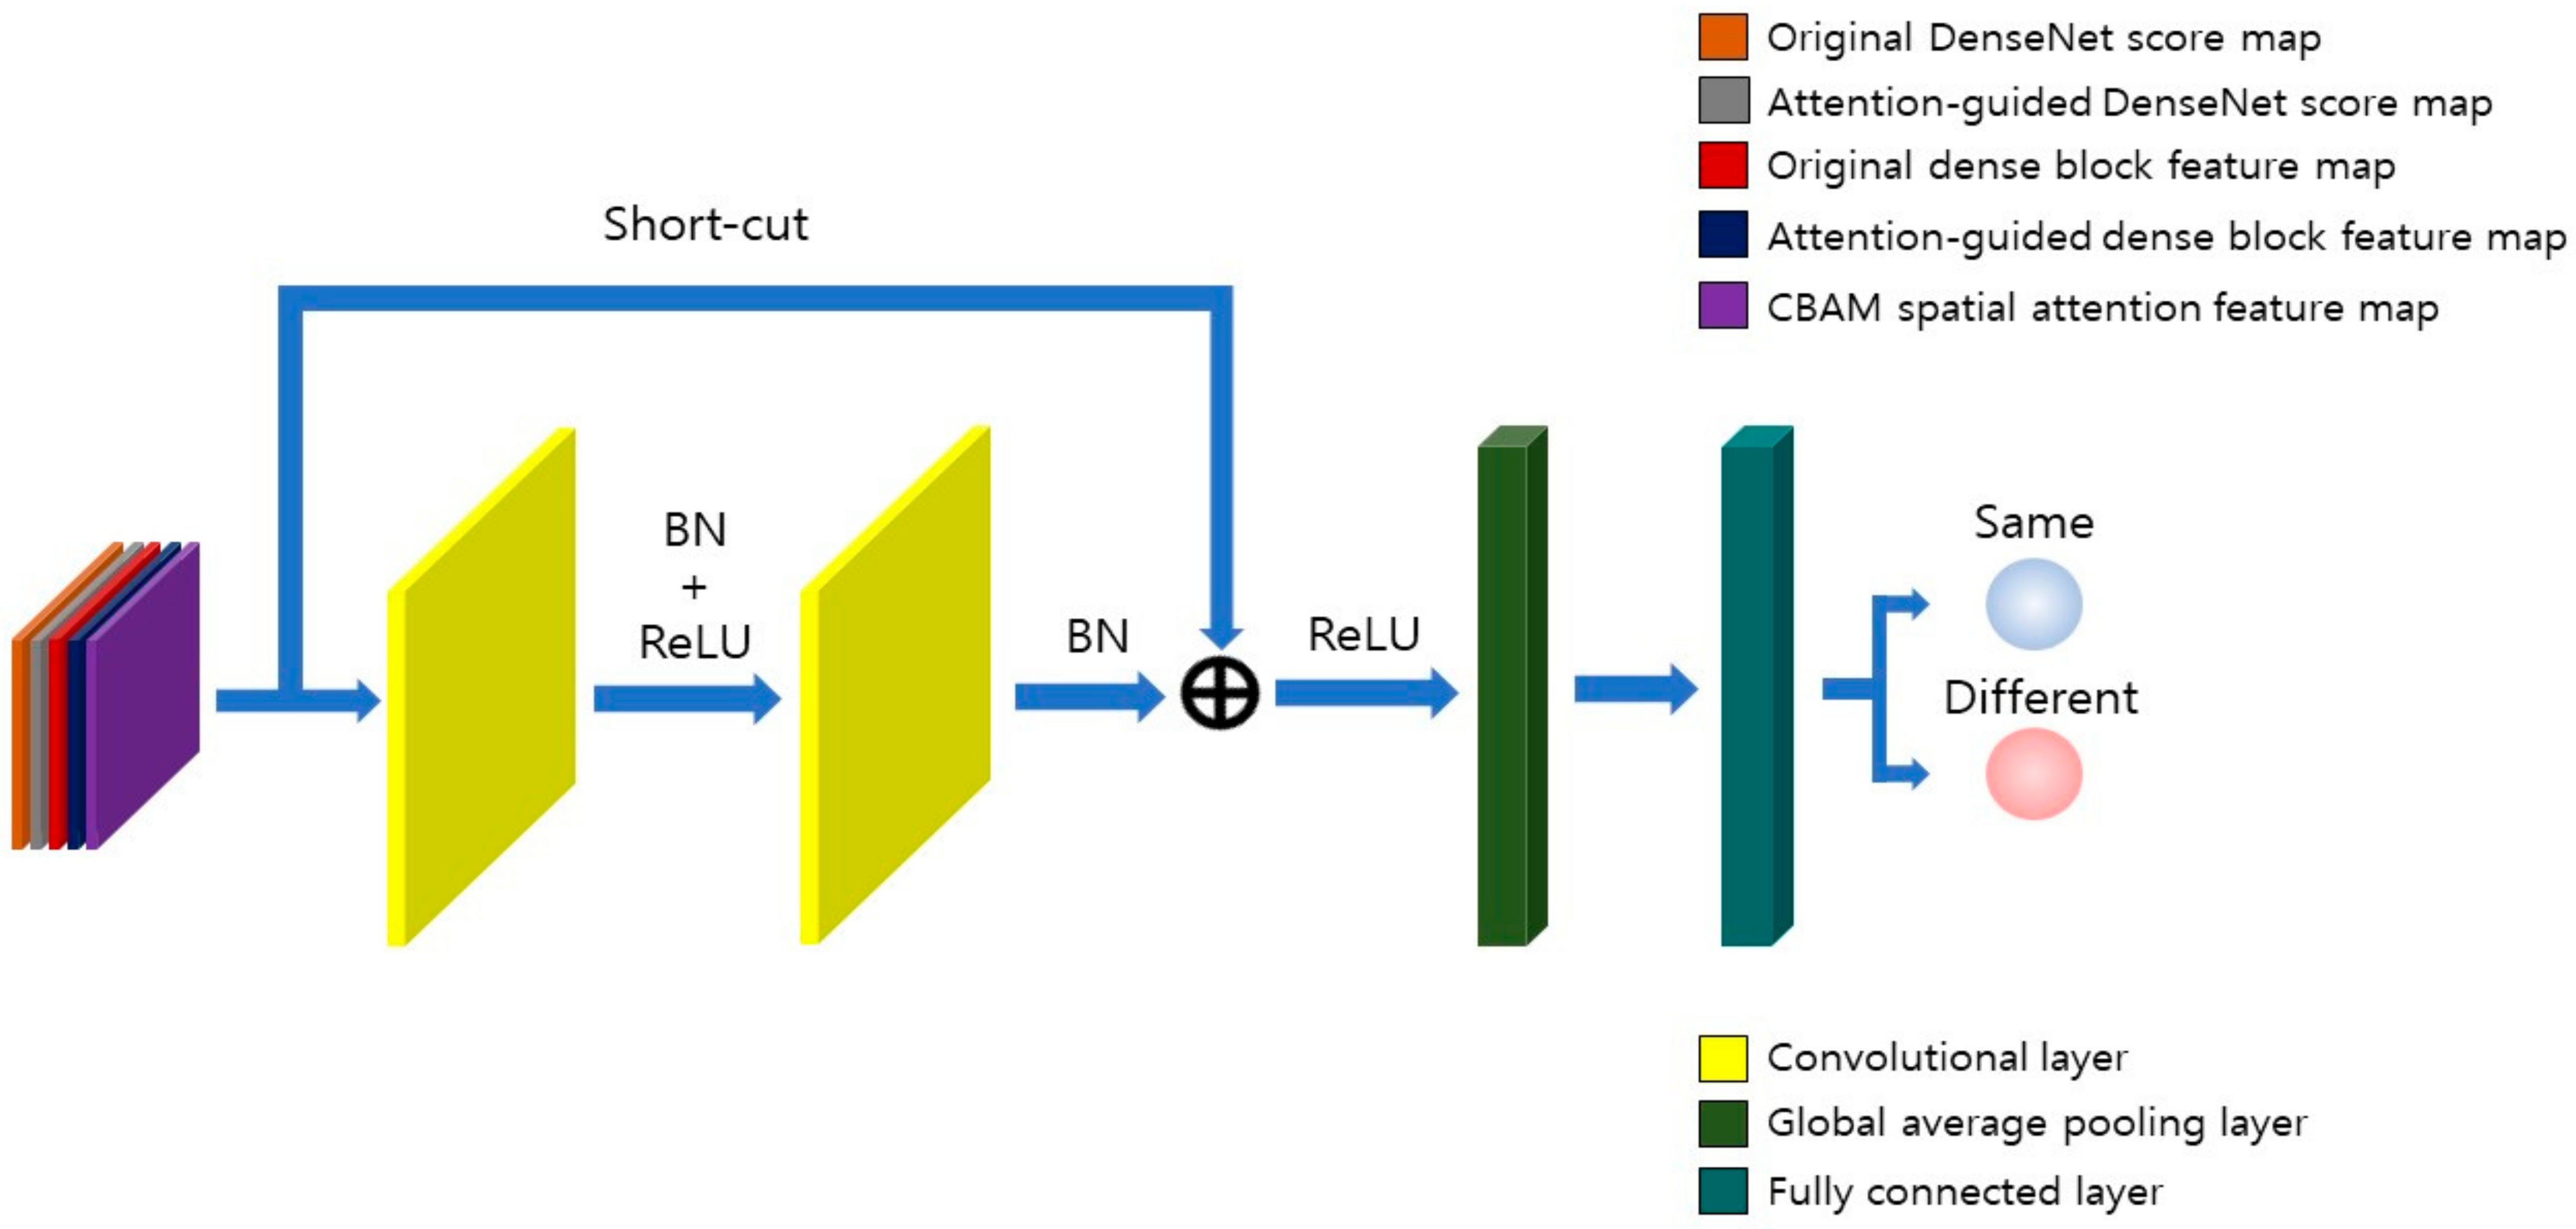
Conventional attention schemes have been mostly applied in the fields where image and text are jointly used [23]. Therefore, attention techniques have been receiving relatively less attention in CNNs where single images are used. Vaswani et al. [24] proposed a self-attention method that enables attention to be applied with the intention of focusing on something, ultimately leading to the use of attention techniques in image classification and image detection applications. Existing attention models can improve performances but entail a significant computational workload. Woo et al. [25] proposed CBAM as a solution. The characteristics of CBAM include the fact that channel and spatial attention modules are sequentially connected, max pooling and average pooling are used together in the spatial attention module, and the computational workload is reduced compared with conventional attention models. The attention-guided DenseNet proposed in this study has a form such that the original DenseNet and CBAM are combined. The attention module was connected at the bottom of a transition block; the growth rate, which is a hyperparameter, was set to 46. Furthermore, the FC layer, which previously comprised 1000 outputs, was adjusted to have two outputs as in the original DenseNet and was then fine-tuned with the training data of this study. The architecture of the attention-guided DenseNet is shown in Figure 4, while the structure is presented in Table A2 (Appendix A).
Figure 4. Architecture of attention-guided DenseNet.
Equations (1) and (2) represent CBAM [25]. If the input feature map is F   C × H × W , the channel attention map is a one-dimensional channel M c     C × 1 × 1 , while the spatial attention map is a two-dimensional channel M s 1 × H × W . The overall attention process is as follows:
F = M c F F ,
F = M s F F ,
Herein, denotes element-wise multiplication. The attention value is broadcast as channel attention values are broadcast in a spatial dimension, and vice versa. F is the element-wise multiplication value between the output of the channel attention module and F . In addition, F is the element-wise multiplication value between the output of the spatial attention module and F ’. An overview of CBAM is shown in Figure 5.
Figure 5. Overview of CBAM.

3.4. SCE-Net

This study proposes the SCE-Net for the ensemble of the original DenseNet and the attention-guided DenseNet. The SCE-Net consists of the following two convolution layers: one global average pooling layer and an FC layer. The network has a residual structure where feature information of an input end is imported through a shortcut to be added with the features that have passed through the convolution layer. Feature maps (extracted from the ends of the original DenseNet and the attention-guided DenseNet), score maps (maps for which the score of a model is reshaped with 7 × 7 × 1 metrics), and a feature map (extracted from the spatial attention module of CBAM in 7 × 7 × 1) are concatenated to be used as the SCE-Net input. The feature map extracted from the ends of the original and the attention-guided DenseNet refers to a 7 × 7 × 2208 size feature map of Dense Block 4 before it passes through the global average pooling layer. Consequently, concatenating a total of five feature maps, including the CBAM spatial attention feature map, reshape score, and DenseNet block features, creates a composite 7 × 7 × 4419 feature map that is used as an input. The features that have passed through the first convolution layer are applied with batch normalization and a rectified linear unit (ReLU), while the features that have passed through the second convolution layer are applied with batch normalization, whereby the feature information of the data used as an input of the SCE-Net is imported through a short-cut and added. Furthermore, the scores of the same or different persons are expressed through softmax after passing through ReLU, and the global average pooling and FC layers. The architecture of the SCE-Net is shown in Figure 6, while the structure is presented in Table A3 (Appendix A).
Figure 6. Architecture of ensemble network. (SCE-Net).

4. Experimental Results

4.1. Experimental Data and Setup

Although there are many open databases for the performance evaluation of person ReID such as Market-1501 [26], DukeMTMC-reID [27], MSMT17 [28], and CHUK03 [2], etc. all these databases include only visible light images and they do not have IR images. Therefore, they cannot be used for our experiments. There exist only two open databases of IR images, such as DBPerson-Recog-DB1 [29] and SYSU-MM01 [16], and we used these two databases for our experiments. DBPerson-Recog-DB1 contains visible images and thermal images of 412 persons captured from different locations. SYSU-MM01 also contains visible images and thermal images of 491 persons captured from different locations. DBPerson-Recog-DB1 contains 8240 images, including 4120 visible and 4120 thermal images. SYSU-MM01 comprises 45,863 images, including 30,071 visible images and 15,792 IR images. Only the thermal images of the two databases were used in this study. Two datasets were divided into training, validation, and testing sets to conduct the experiments in two-fold cross-validation where the validation set was set to be 10% of the training set. To evaluate the generality of the proposed model, data from the same person were not included between training, validation, and testing sets based on open-world configuration. The images in DBPerson-Recog-DB1 were captured from the front, side, and back using a visible-light camera (Logitech C600 [30]) and a thermal camera (FLIR Tau2 [31]) in an outdoor environment. Visible-light images in DBPerson-Recog-DB1 have a size of 37 × 102 × 3 pixels on average, while thermal images have an average size of 42 × 112 × 3 pixels. The images in SYSU-MM01 were captured from the front, side, and back views by using the Kinect V1 and IR cameras in an indoor environment. Visible-light images in SYSU-MM01 have an average size of 112 × 284 × 3 pixels, while IR images have an average size of 108 × 303 × 3 pixels. The sizes of the images used in the experiment were set to 224 × 224 × 3 pixels based on bilinear interpolation and were used as the input for pretrained and fine-tuned models. Figure 7 shows the examples of IR images of the same or different persons in DBPerson-Recog-DB1 and SYSU-MM01.
Figure 7. Experiment dataset examples. (a) DBPerson-Recog-DB1 thermal dataset and (b) Sun Yat-sen University multiple modality Re-ID (SYSU-MM01) IR dataset. In (a,b), two pairs from the left show the same persons, whereas the remaining two pairs present different persons. In each pair, left and right images show the enrolled and input query images, respectively.
The similarities among images in DBPerson-Recog-DB1 are high as there are numerous temporally continuous images. Hence, the images obtained with time intervals were used in the experiment. The computer used for the experiment was equipped with an Intel(R) Core(TM) i5-4690 central processing unit (CPU) @ 3.50 GHz, 16 GB random access memory (RAM), and an NVIDIA GeForce GTX 1070 graphics card (with an 8 GB RAM and 1920 cores) [32]. Pytorch (version, 1.8.1) [33] was used for model implementation.

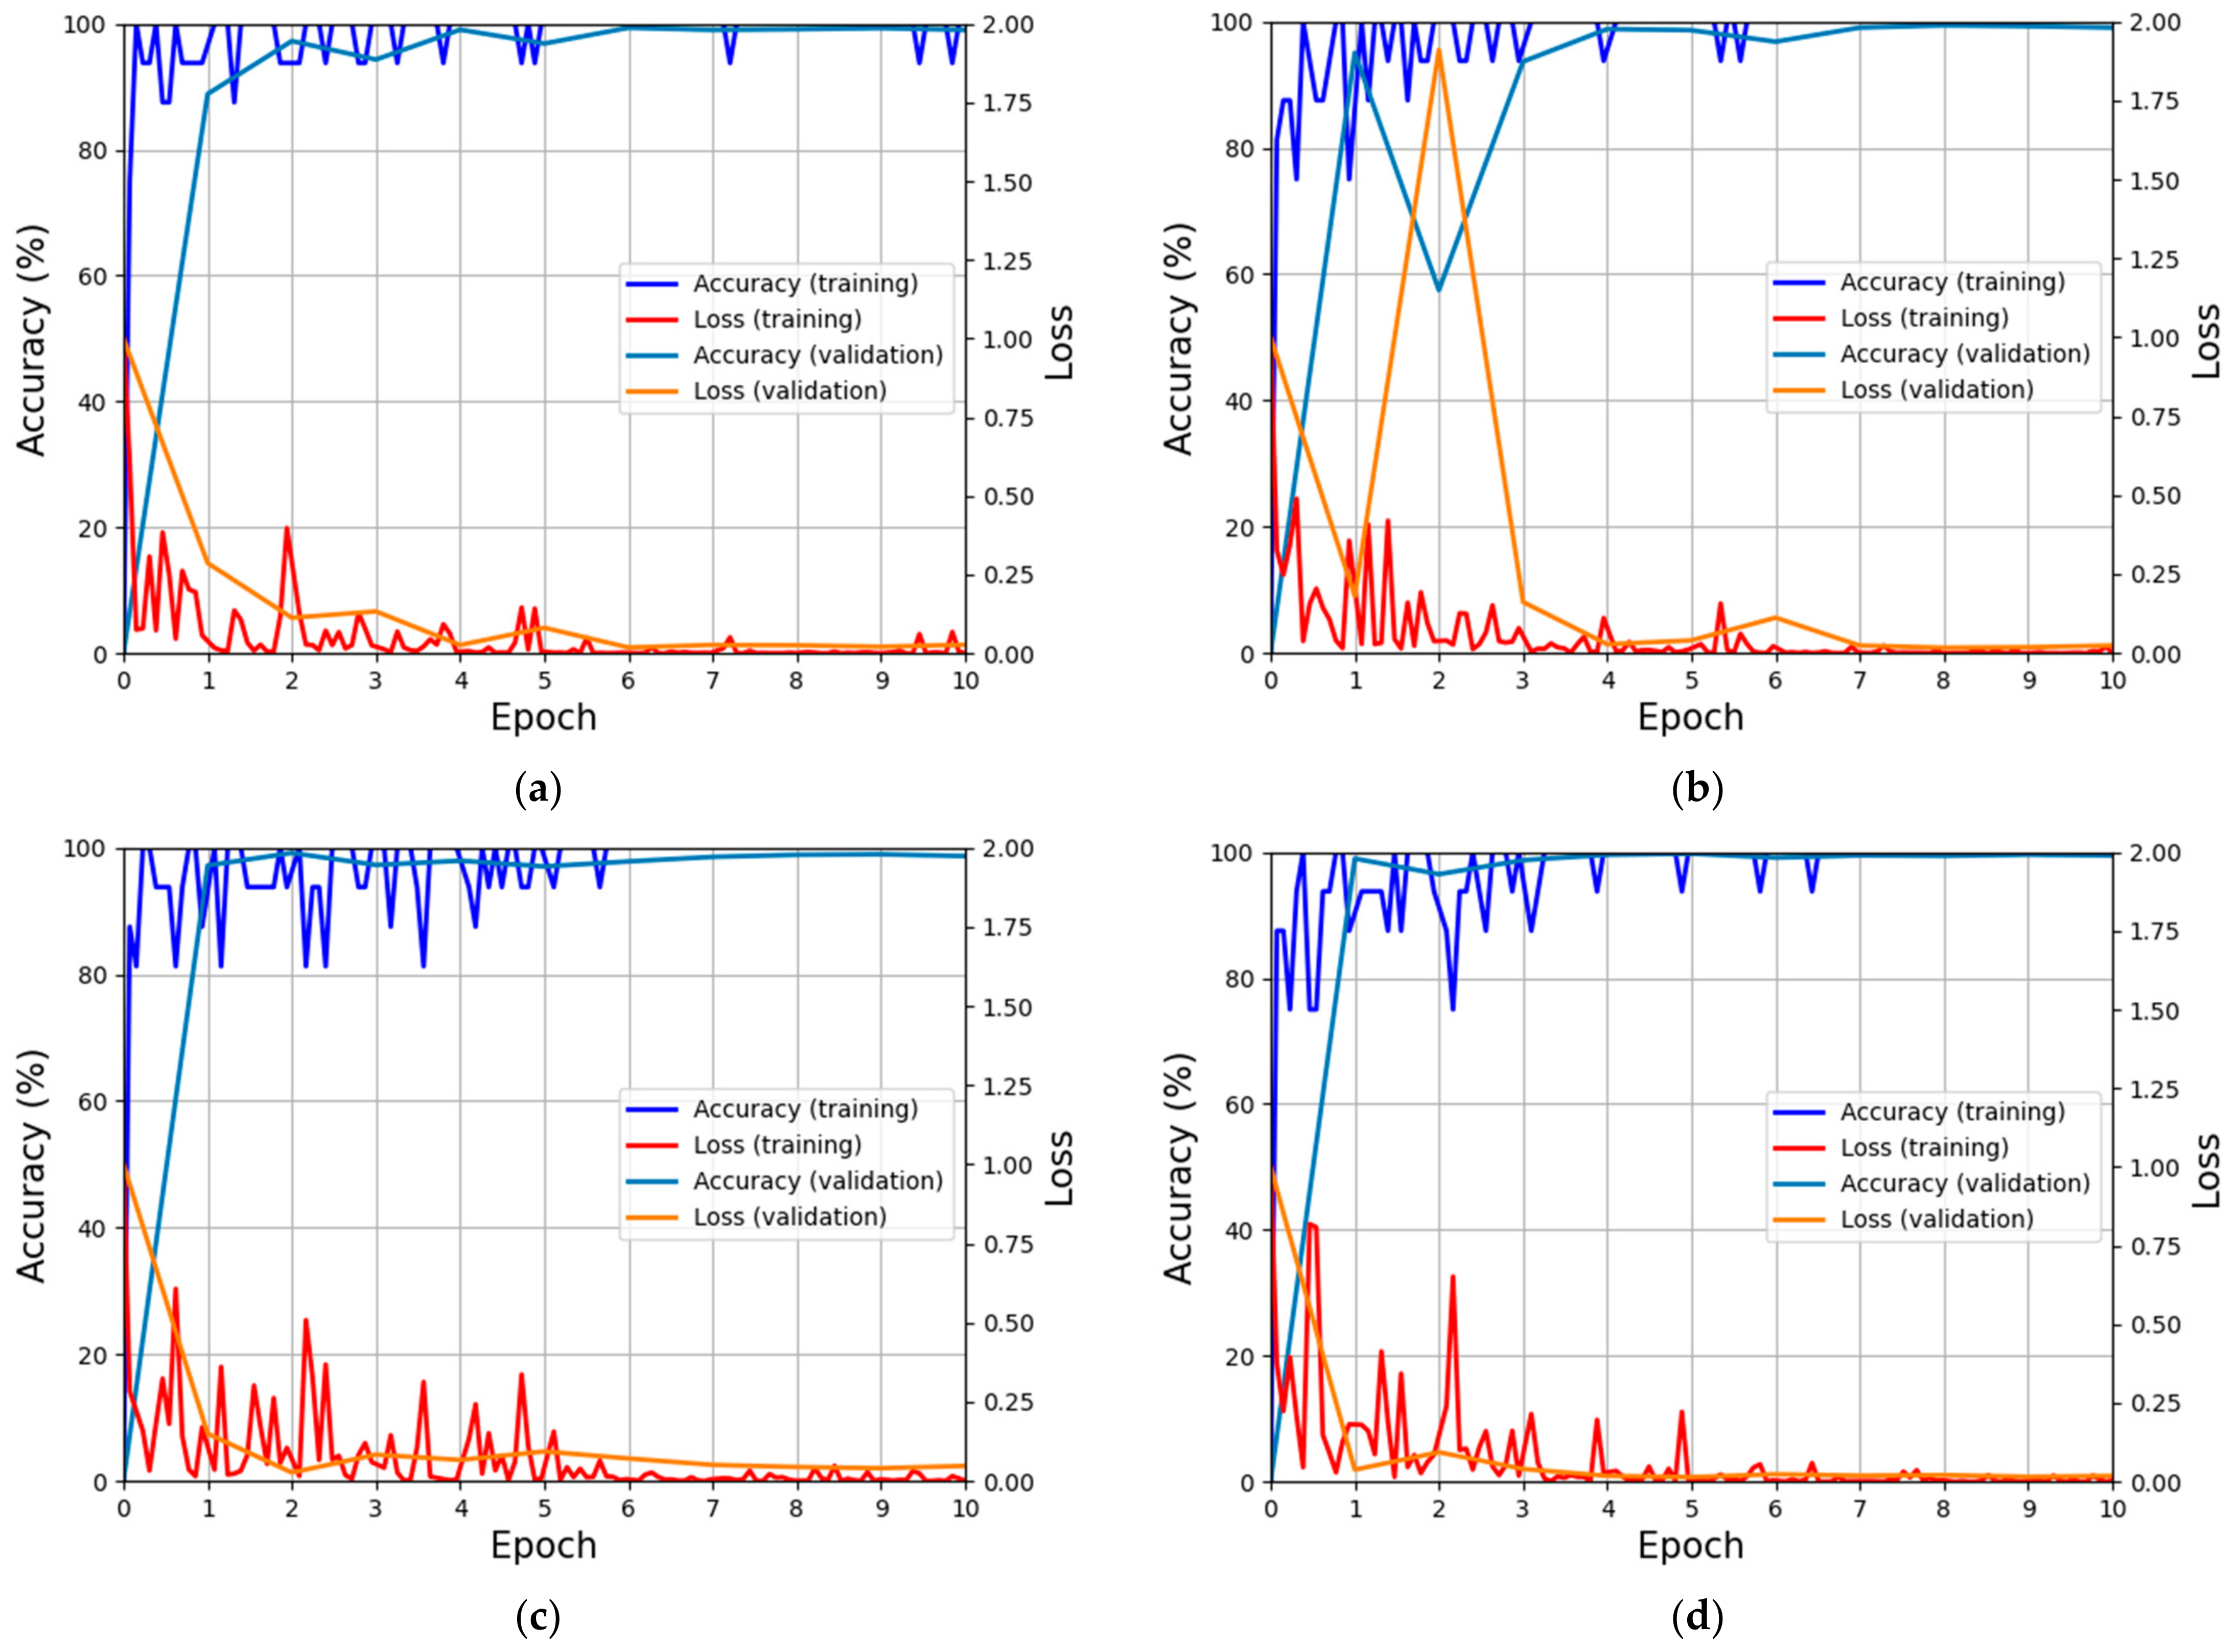
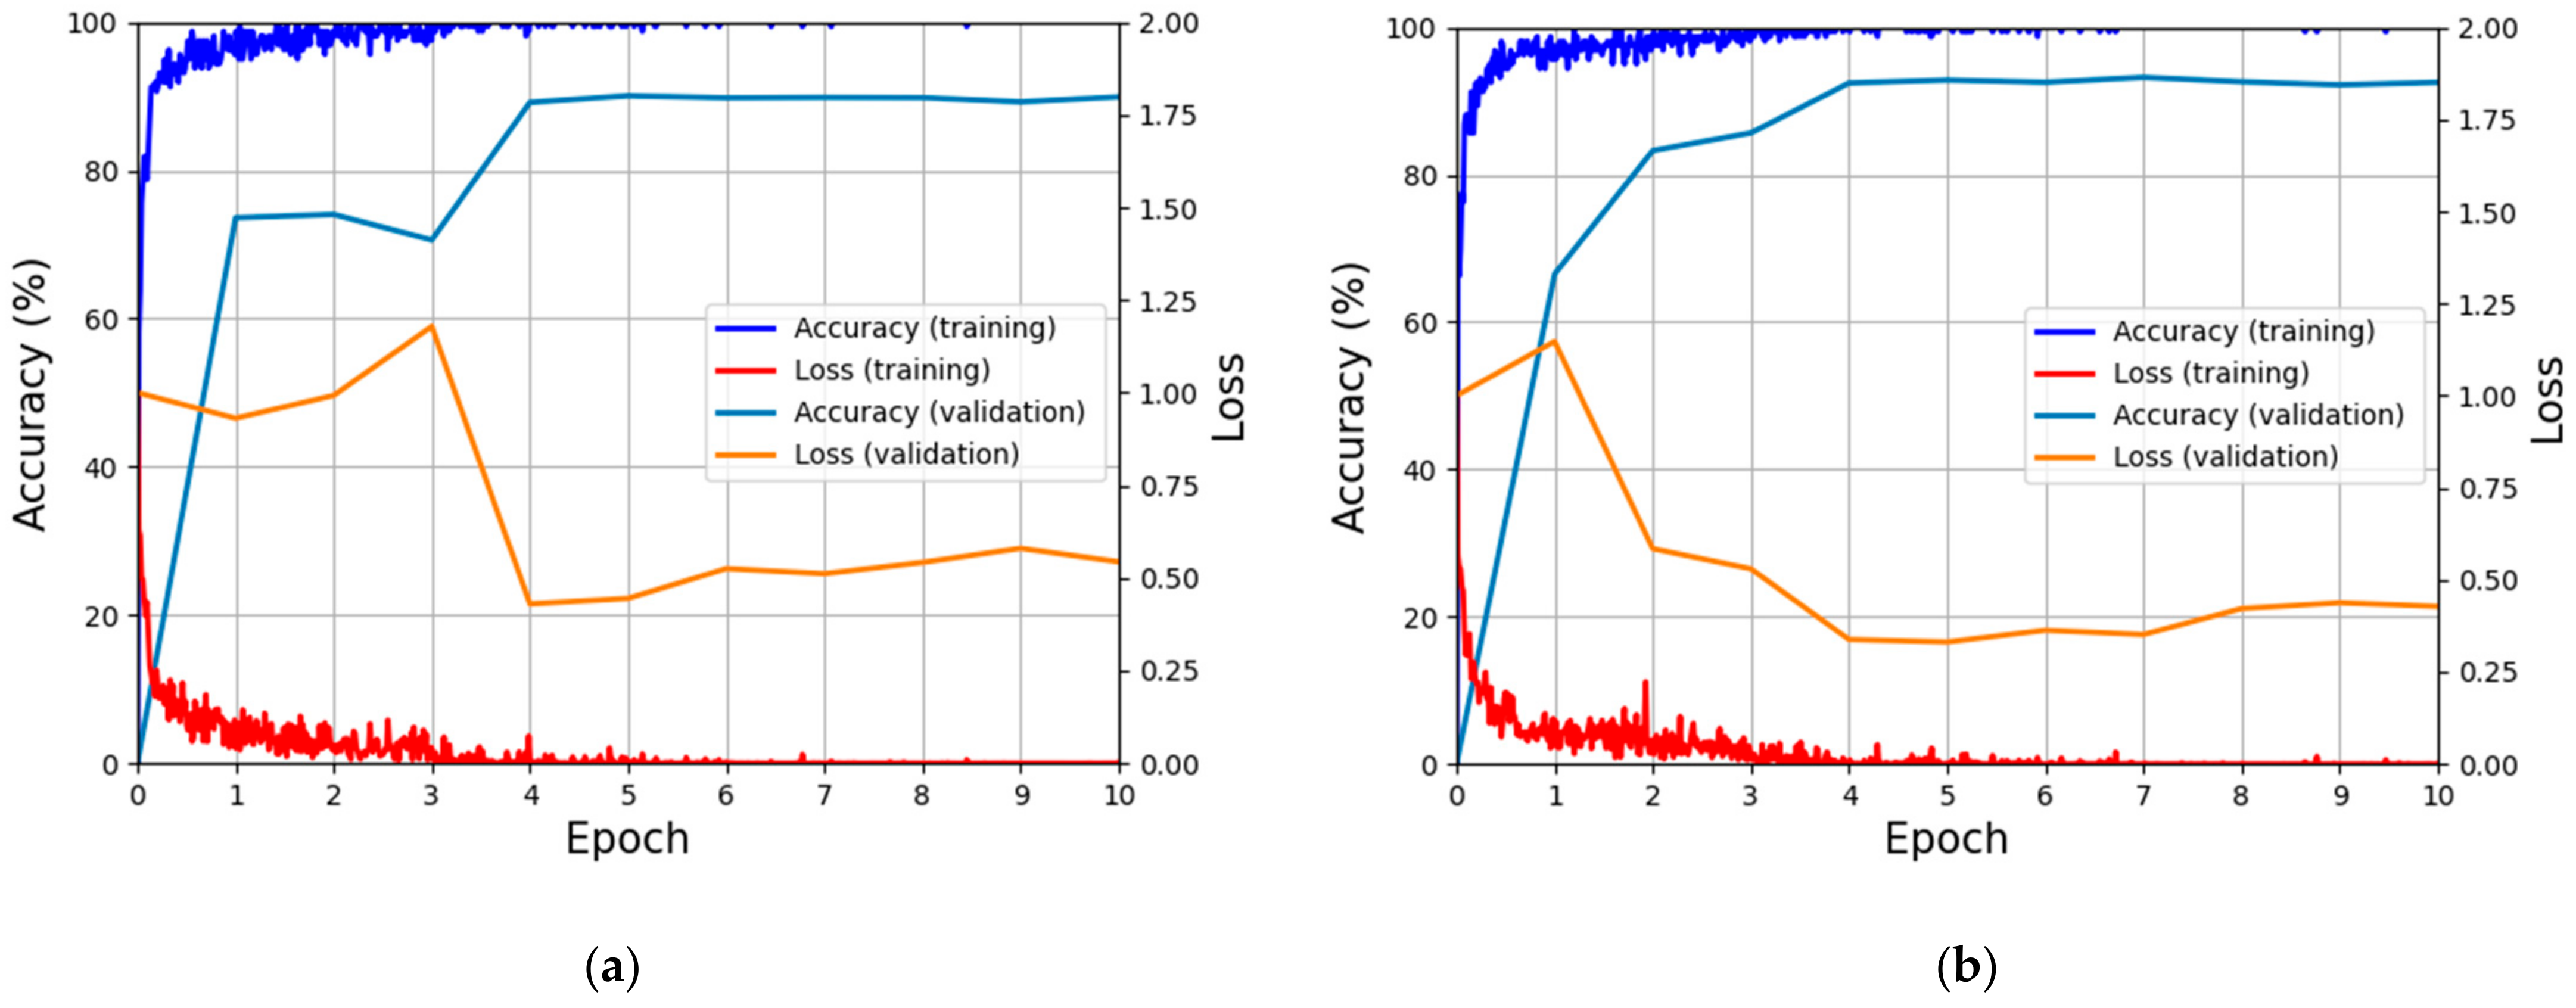
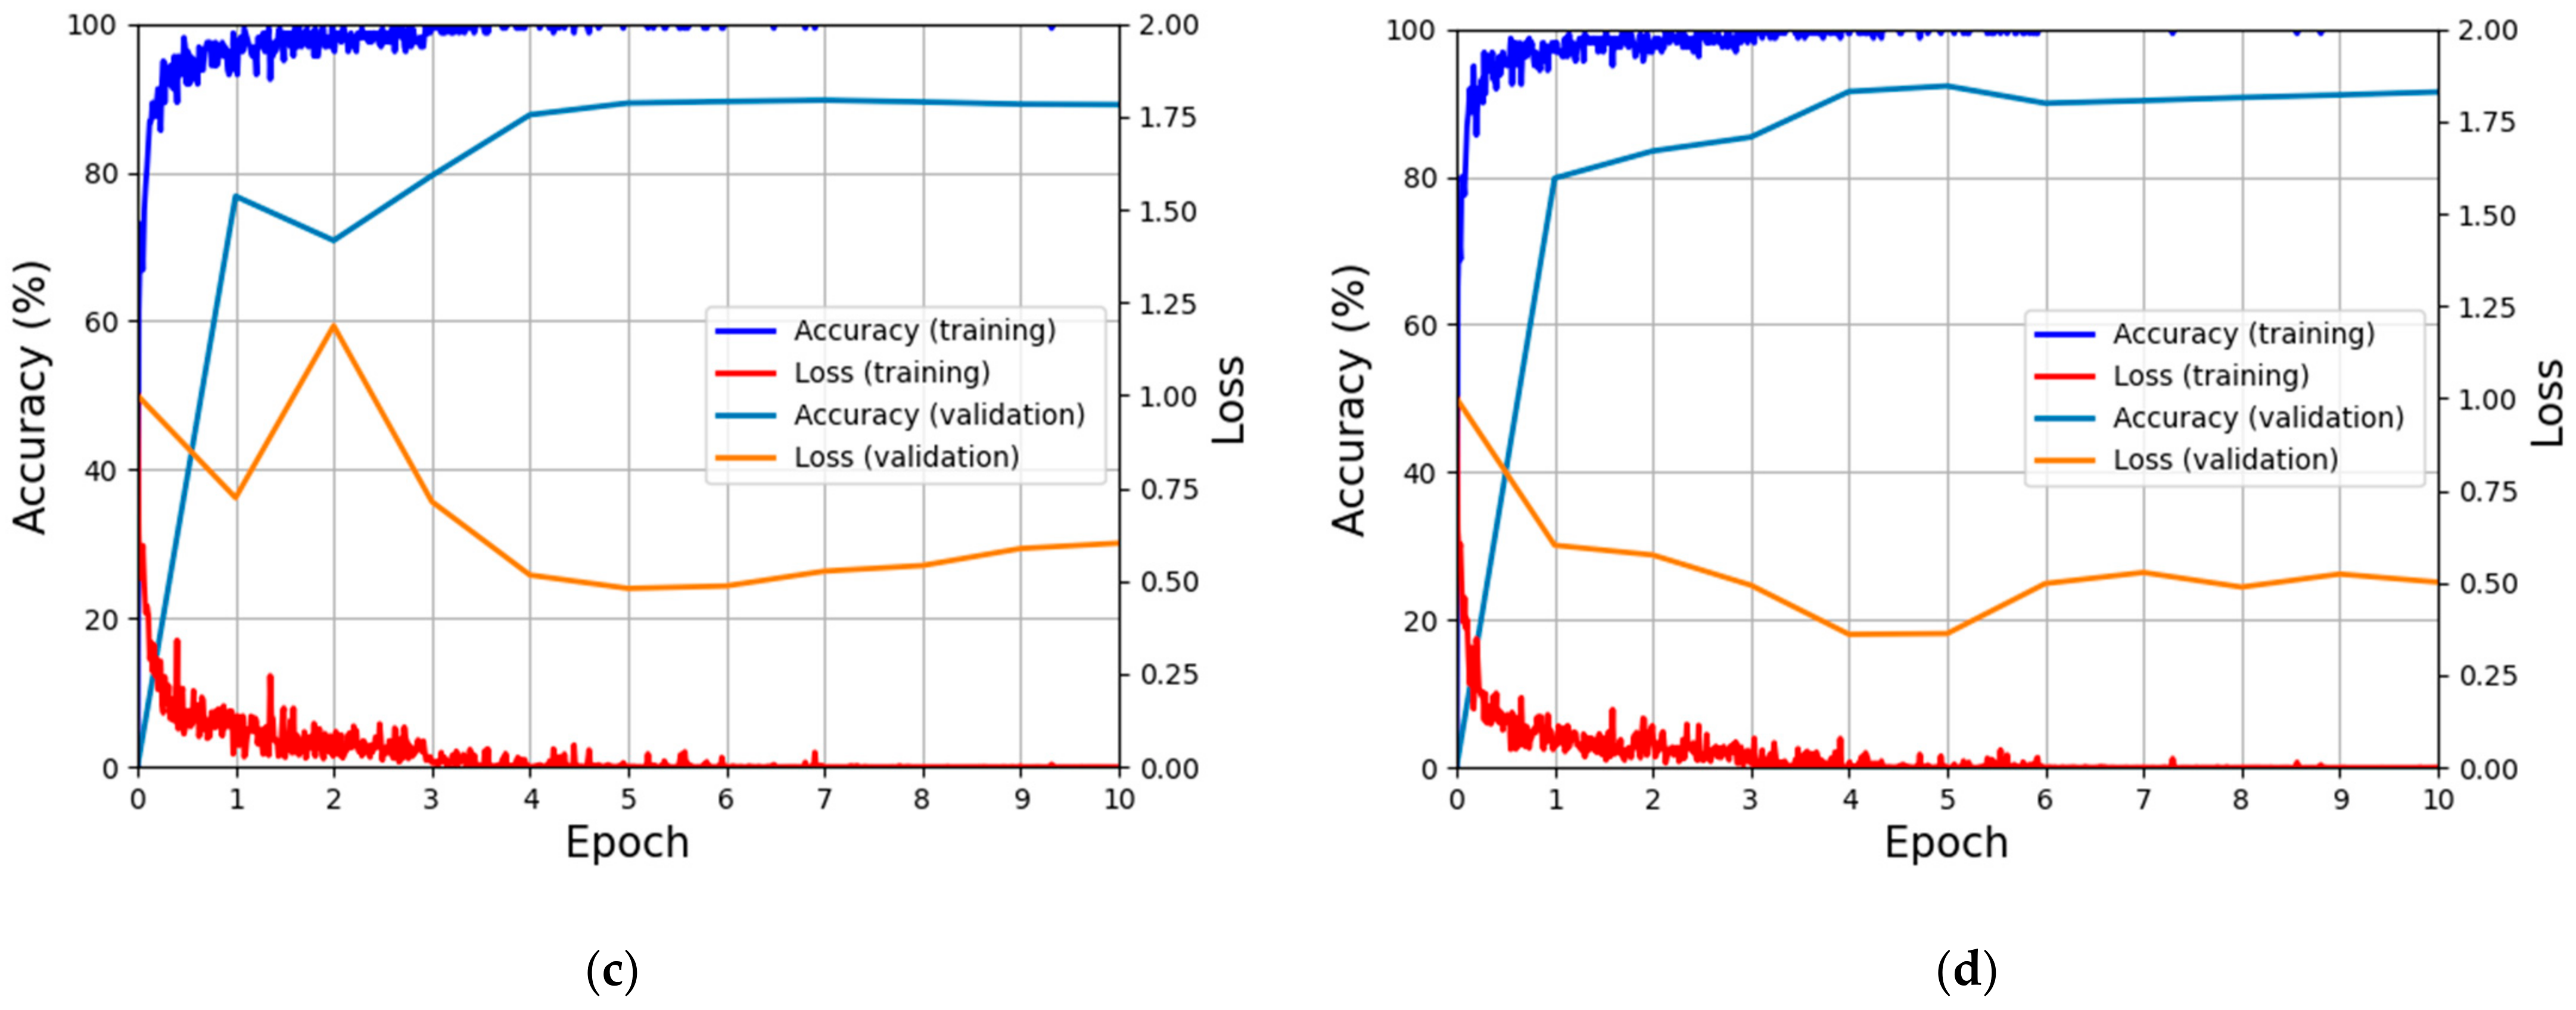
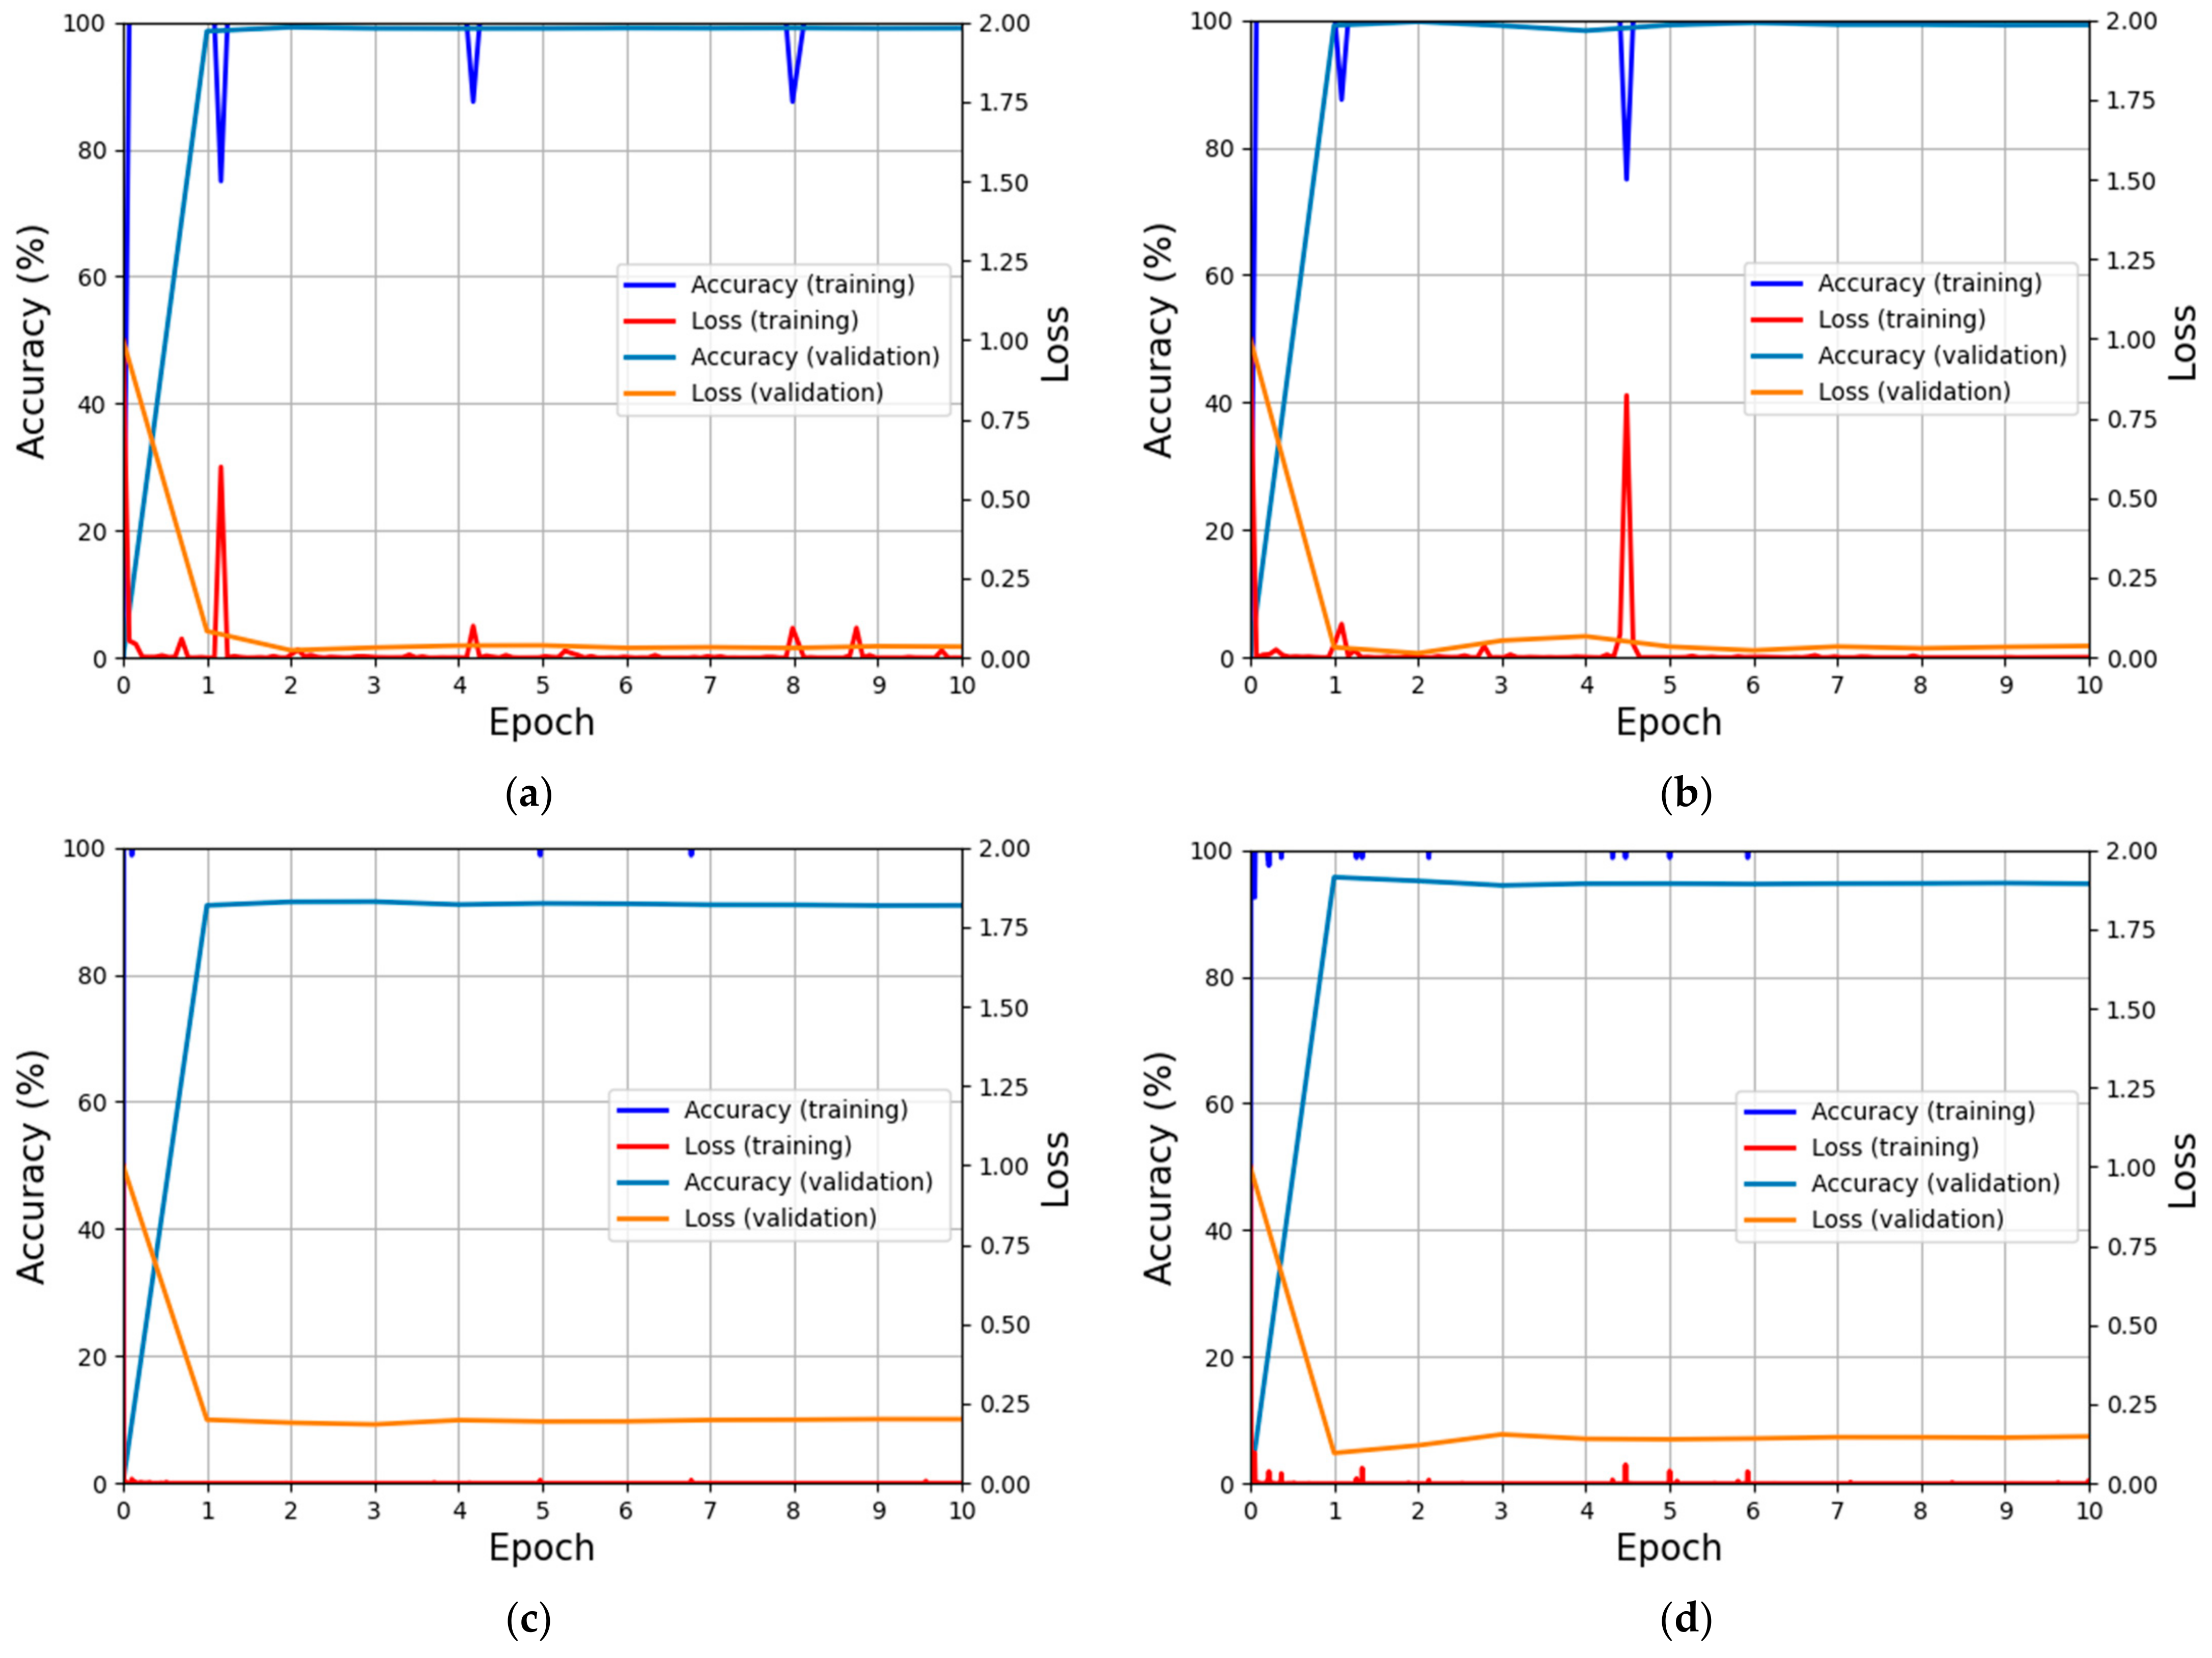
4.2. Training and Validation

In this study, the adaptive moment estimation (Adam) optimizer [34] was used for CNN training. The advantage of the Adam optimizer is that the step size is not affected by rescaling the gradient value and that stable training is possible regardless of the objective function used, as the step size is bounded. Table 2 presents the parameters and input image types used for training each model. A softmax function shown in Equation (3) [35] was used as a function to represent the output score of each model, and a cross-entropy loss shown in Equation (4) [36] was used as a training loss.
f s i = e s i j C e s j
C E = i C t i log f s i
Table 2. Training parameters and input image types for each model.
In the above equation, t i is the ground truth, while C is the number of classes. In addition, s i and s j are the i th and j th elements of the output for each class. In Equation (3), it adopts the standard exponential function to each element s i of the input vector s and normalizes them by dividing them by the sum of all these exponentials, which makes the sum of the components of the output vector f s become 1. In Equation (4), if model training is successful, t i is almost similar to log f s i and the consequent t i log f s i   becomes   large   value , which causes the CE to be minimized.
In DBPerson-Recog-DB1, the training of the original DenseNet and the attention-guided DenseNet resulted in almost 100% accuracy, as shown in Figure 8, while the loss converged to almost 0%. In SYSU-MM01, the training of the original DenseNet and the attention-guided DenseNet resulted in an accuracy almost equal to 100%, as shown in Figure 9, while the loss converged to almost 0%. In both DBPerson-Recog-DB1 and SYSU-MM01, the training of the SCE-Net also resulted in 100% accuracy, as shown in Figure 10, while the loss converged to almost 0%. The validation accuracy measured by DBPerson-Recog-DB1 yielded values closer to 100% compared with the SYSU-MM01 dataset, with the loss also converging to values close to 0%. The validation accuracy measured by the SYSU-MM01 dataset showed that accuracy did not converge to 100%, but accuracy improved as the number of epochs increased; the loss also did not converge to 0% but decreased as the number of epochs increased. Thus, ReID difficulties between object images are fewer in the DBPerson-Recog-DB1 case than in SYSU-MM01. The training loss and accuracy graphs in Figure 8, Figure 9 and Figure 10 imply that the proposed models are sufficiently trained by the training data. Furthermore, the validation loss and accuracy graphs in Figure 8, Figure 9 and Figure 10 imply that the proposed models are not overfitted to the training data.
Figure 8. Training, validation loss, and accuracy graphs with DBPerson-Recog-DB1 dataset. (a,b) are training and validation graphs of the original DenseNet for (a) fold 1 and (b) fold 2. (c) and (d) are training and validation graphs of the attention-guided DenseNet for (c) fold 1 and (d) fold 2.
Figure 9. Training, validation loss, and accuracy graphs with SYSU-MM01 dataset. (a,b) are training and validation graphs of the original DenseNet for (a) fold 1 and (b) fold 2. (c) and (d) are training and validation graphs of the attention-guided DenseNet for (c) fold 1 and (d) fold 2.
Figure 10. Training, validation loss, and accuracy graphs of SCE-Net. (a,b) are training and validation graphs of DBPerson-Recog-DB1 for (a) fold 1 and (b) fold 2. (c) and (d) are training and validation graphs of the SYSU-MM01 dataset for (c) fold 1 and (d) fold 2.

4.3. Testing of Proposed Method with DBPerson-Recog-DB1

4.3.1. Performance Metrics

We adopted Rank 1, Rank 10, Rank 20, and the mean average precision (mAP) for accuracy evaluations. Rank N is used for measuring the correct matching accuracy for the cases including true positive data from N matching candidates. The mAP means the mean of the average precision scores for each input query [37]. The average precision method shows an area size under the precision-recall graph that measures the performance of the identification algorithm. Precision and recall are expressed by Equations (5) and (6) [38]. TP, FN, and FP denote the true positive (positive data is correctly classified as positive one), false negative (positive data is incorrectly classified as negative one), and false positive values (negative data is incorrectly classified as positive one), respectively. In our experiments, we considered matching of the same class (genuine matching) as positive data and that of different classes (imposter matching) as negative data. In addition, mAP is expressed according to Equation (7).
Precision = T P / T P + F P
Recall = T P / T P + F N
mAP = q = 1 I Q A v e P q I Q
In Equation (7), I Q shows the number of input queries, and A v e P q denotes the average precision scores for each input query.

4.3.2. Ablation Studies

In the first experiment, the accuracy of various image compositions explained in Section 3.1 was evaluated. As shown in Table 3, the original DenseNet yielded the best performance in IIPVT, while the attention-guided DenseNet yielded the best performance in IPVT1.
Table 3. Comparisons of ReID accuracies according to various input image compositions with DBPerson-Recog-DB1 (unit: %).
Subsequently, comparisons of the ReID accuracies of the original DenseNet, attention-guided DenseNet, and proposed OADE-Net were performed. As shown in Table 4, the highest accuracy resulted when the original DenseNet, attention-guided DenseNet, and SCE-Net were all used. To evaluate the performance of the SCE-Net in the subsequent experiment, the accuracies of weighted sum (WS), weighted product (WP) [39], and support vector machine (SVM) were compared [40]. SVM, a model defining the decision boundary for classification, aims to identify the decision boundary that maximizes the margin. When the output score of the original DenseNet was assumed to be s o , the attention-guided DenseNet’s output score was assumed to be s a , and the weight was assumed to be w; WS, WP, and SVM can be defined according to Equations (8)–(11). The weights demonstrating the highest ReID accuracy in the experiment, based on the use of the training data, were used as the optimal weights of WS and WP. For example, w of Equation (8) was determined as 0.3 and 0.515 in the cases of DBPerson-Recog-DB1 and SYSU-MM01, respectively, whereas w of Equation (9) was determined as 0.1 and 0.528 in the cases of DBPerson-Recog-DB1 and SYSU-MM01, respectively. For SVM, the radial basis function (RBF) was determined as the optimal kernel, which showed the highest accuracies of ReID with the training data. Optimal parameters (b, γ ) of the SVM and RBF were also determined by using the training data. For example, b was determined as −0.5086 and −0.00012 in the cases of DBPerson-Recog-DB1 and SYSU-MM01, respectively. γ was determined as 1 and 0.1 in the case of DBPerson-Recog-DB1 and SYSU-MM01, respectively. In Equation (10), a i is the Lagrange multiplier, which is different according to support vector i whereas y i is the classifier output, which is +1 or −1 because our research deals with the two-class problem, e.g., same or different people.
o u t p u t ws = s o × w + s a × 1 w
o u t p u t wp = s o w × s a 1 w
o u t p u t svm = s i g n a i y i K s o , s a + b
RBF   kernel :   K s o , s a = e γ | | S o S a | | 2 ,   γ > 0
Table 4. Comparisons of ReID accuracies of the original DenseNet, attention-guided DenseNet, and proposed OADE-Net with DBPerson-Recog-DB1 (unit: %).
Table 5 presents the comparisons of ReID accuracies by the proposed method and various score-level fusions where the proposed SCE-Net demonstrates the highest accuracy.
Table 5. Comparisons on the ReID accuracies of the proposed and various score-level fusions with DBPerson-Recog-DB1 (unit: %).

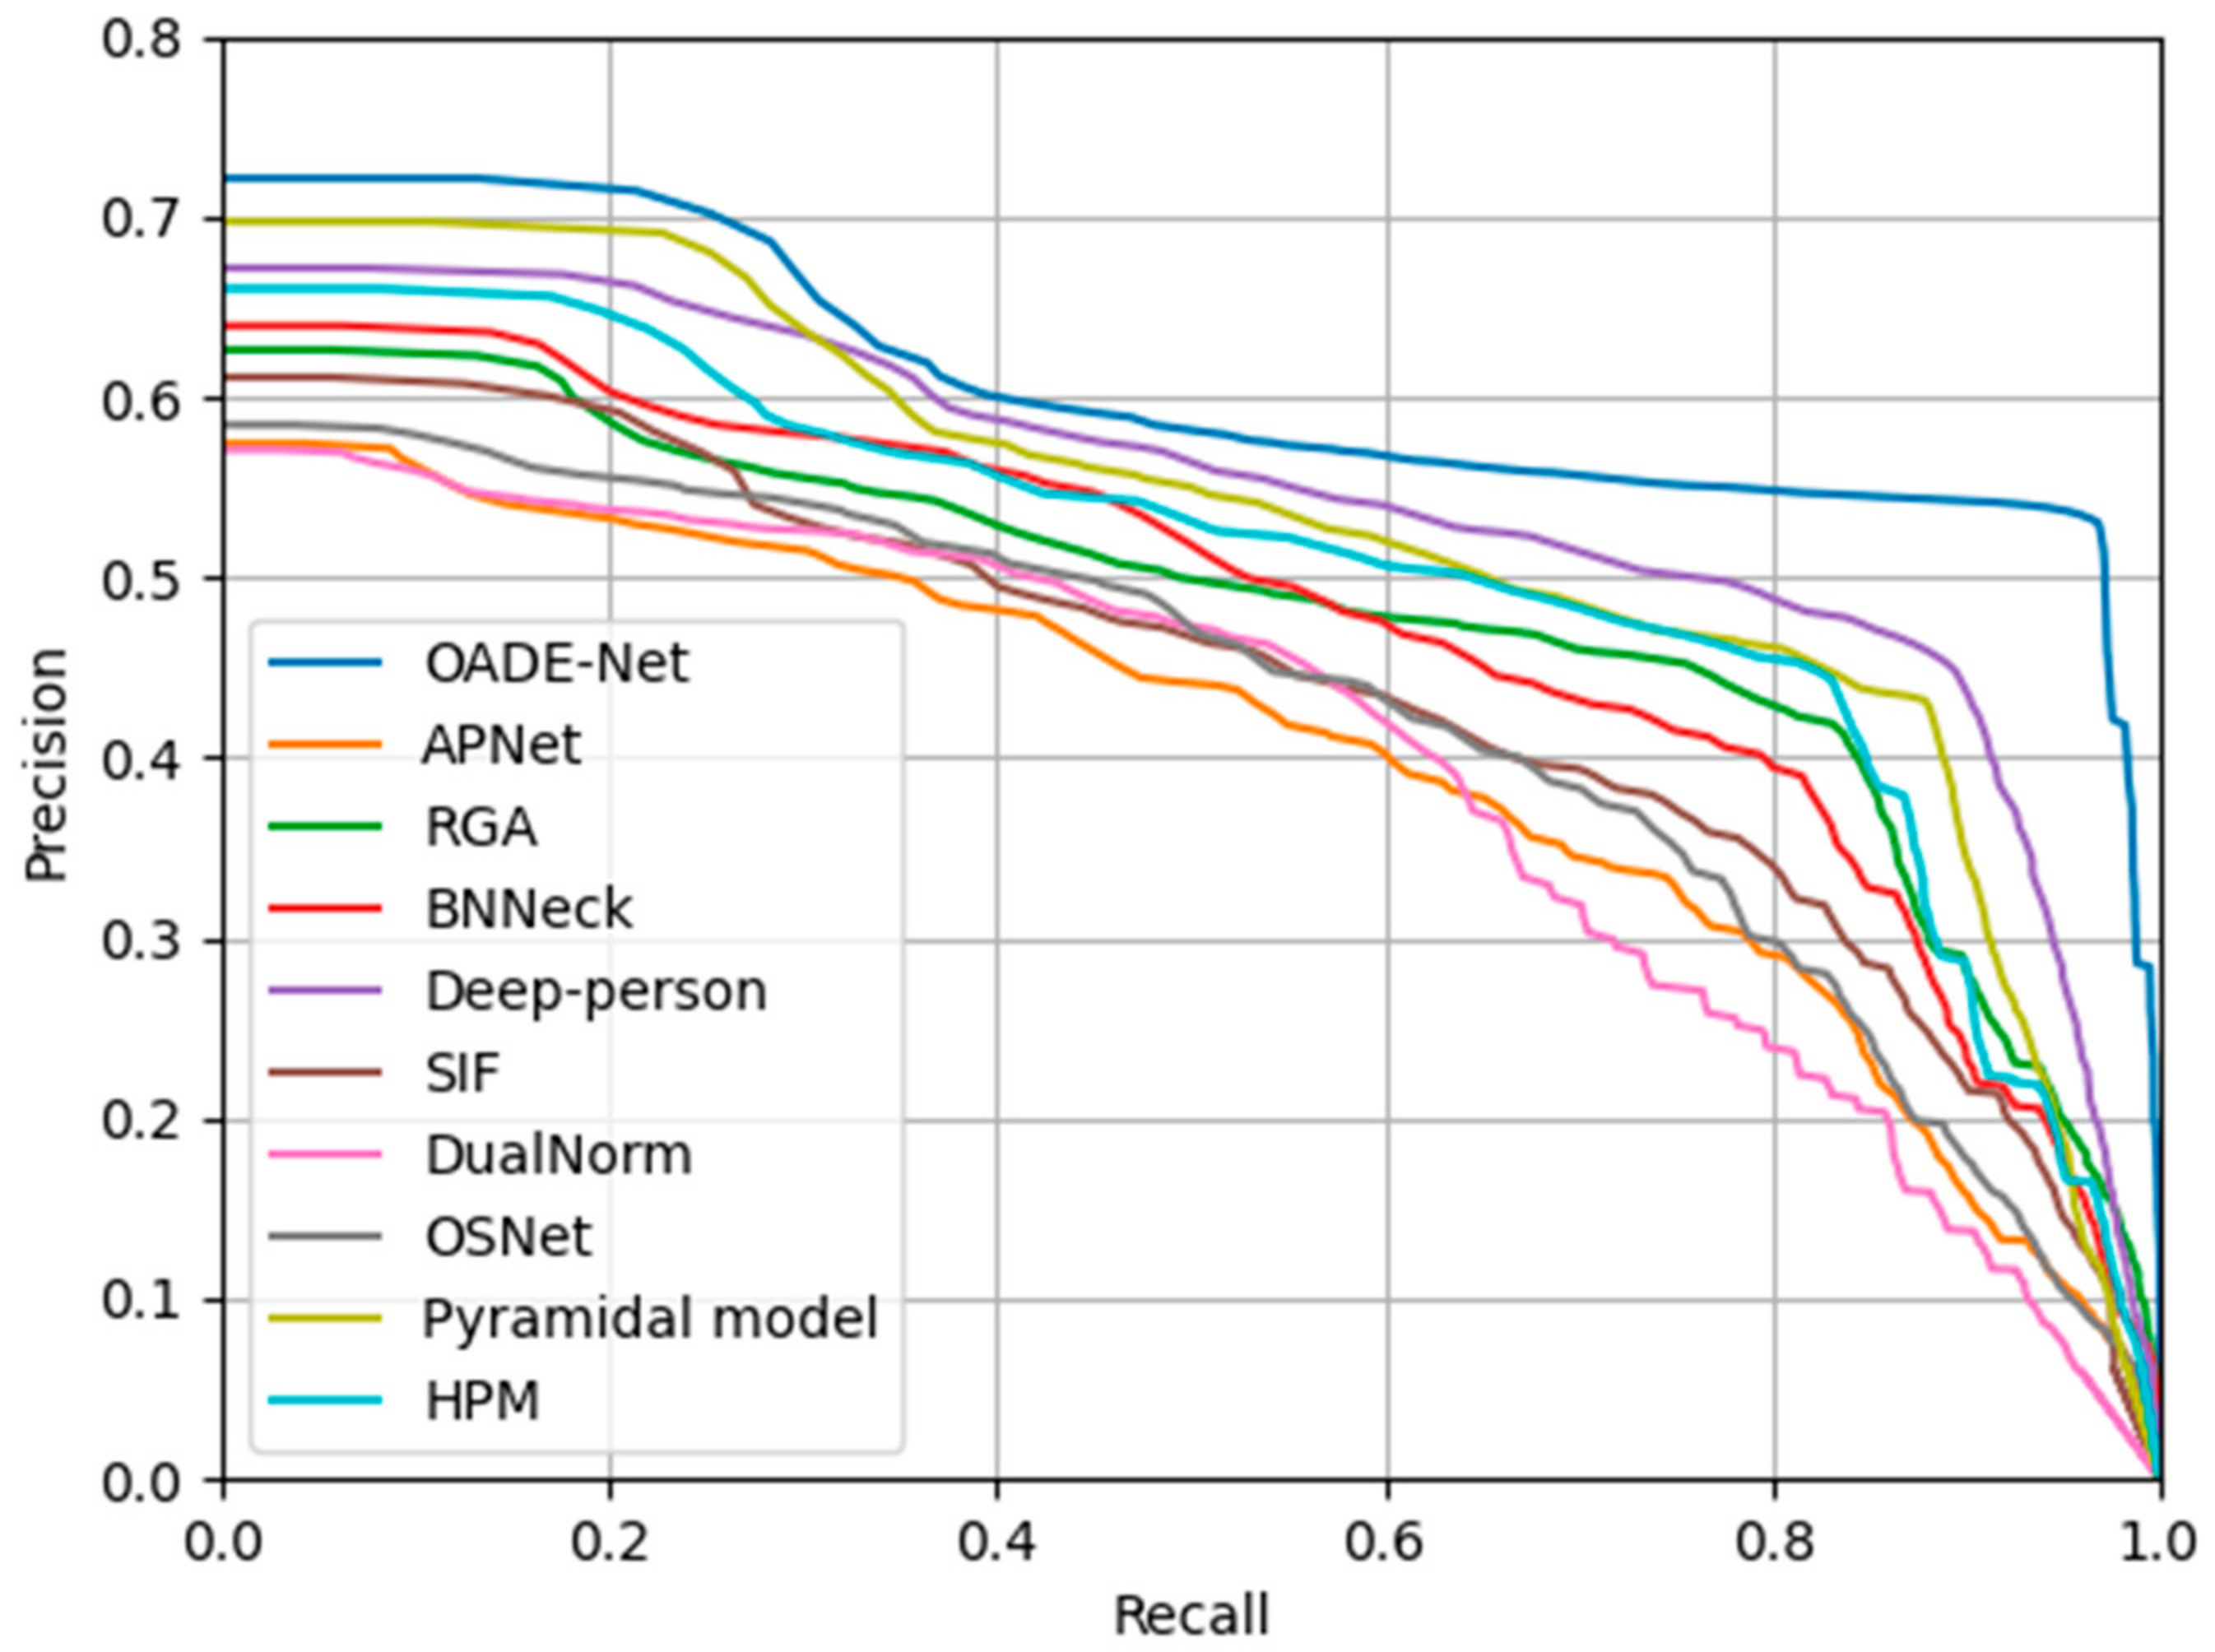
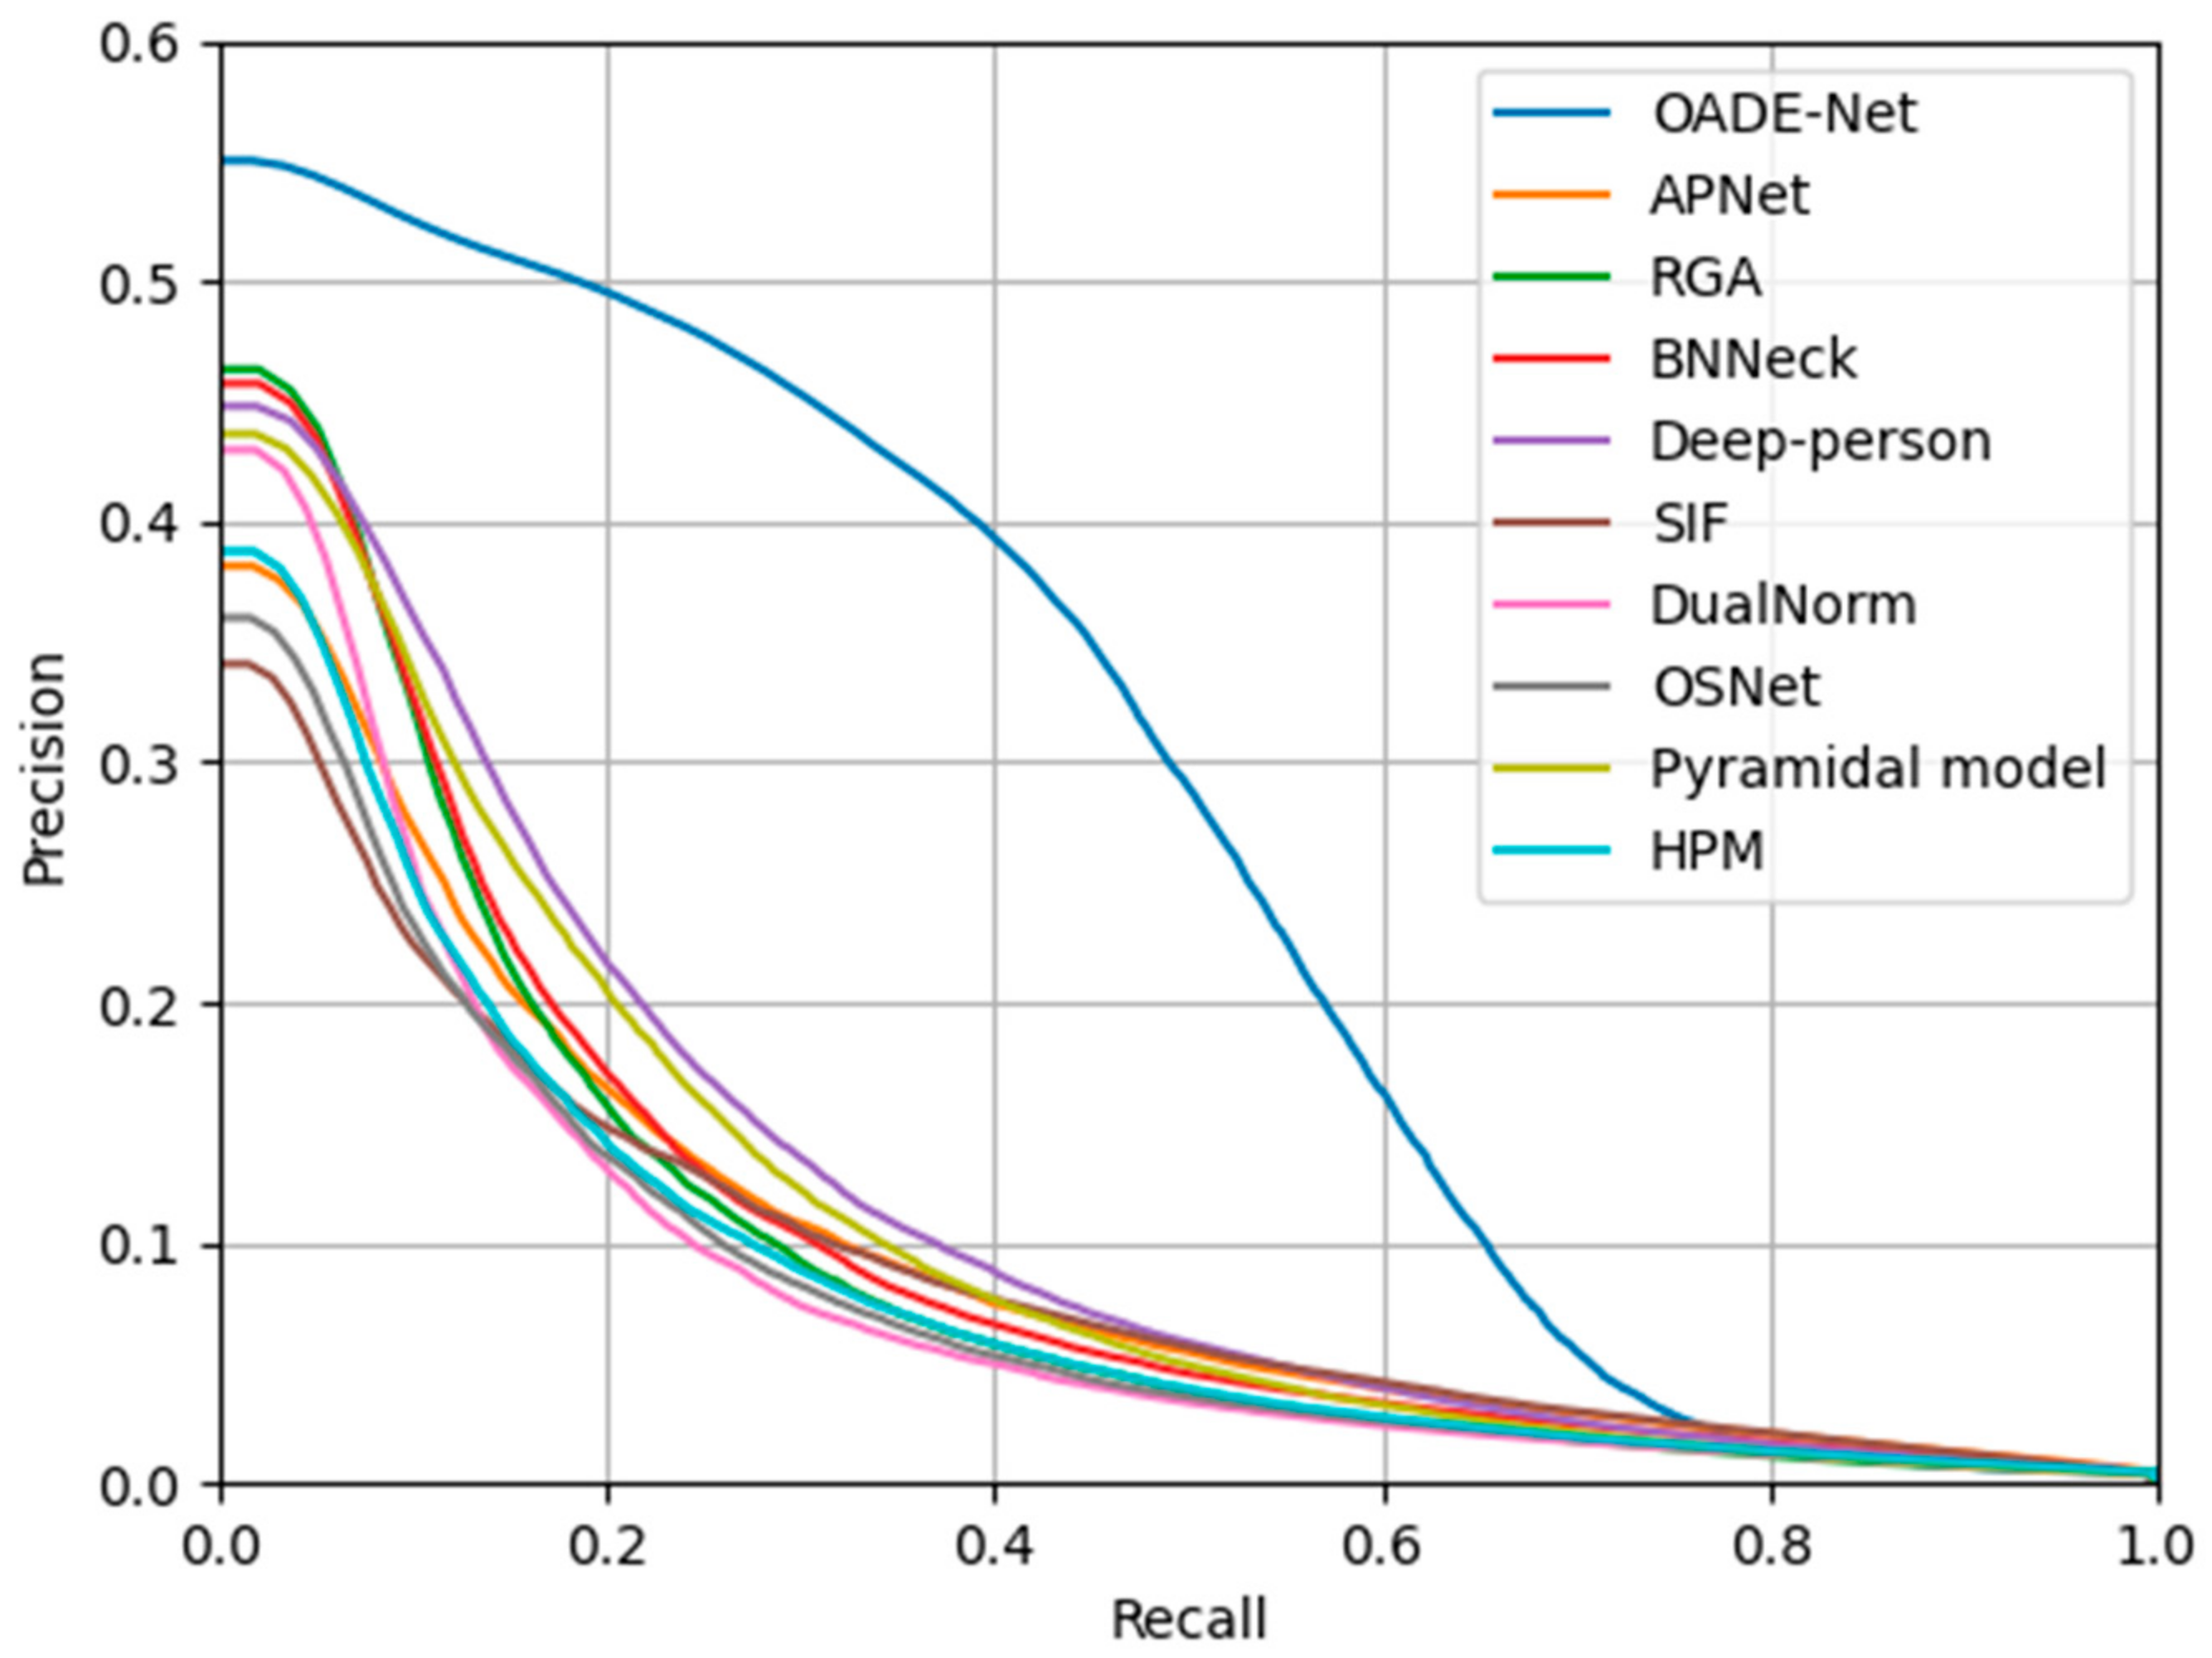
4.3.3. Comparisons of Proposed Method with State-of-the-Art Methods

Table 6 presents the comparisons of the ReID accuracies of the proposed and state-of-the-art methods. The methods compared in the experiment are omni-scale network (OSNet) [41], DualNorm [42], attention pyramid networks (APNet) [43], self-inspirited feature learning (SIF) [44], Deep-person [9], relation-aware global attention (RGA) [45], batch normalization neck (BNNeck) [46], horizontal pyramid matching (HPM) [47], and pyramidal model [48]. The experimental results showed that the proposed OADE-Net demonstrated the highest ReID accuracy in which the OADE-Net was 6.25% higher in rank 1, while the OADE-Net in mAP was 8.78% higher than the pyramidal model. Other models compared in this study, including OSNet, produced excellent results as they were trained while they extracted various features when they received visible images as an input. In this study, however, the ReID performance was low when IR images were input because the features required for ReID were not detected adequately as IR images do not include color and detailed texture information as visible images. Furthermore, OSNet uses multiscale features extracted from high- to low-resolution. Considering the low-image resolution and the low quality of IR images, the important features for ReID obtained by numerous convolution layers are much lost compared with the case in which visible images were used, and this decreased accuracy. Figure 11 shows the graphs of precision versus recall for the proposed and state-of-the-art methods. Figure 11 also illustrates how the proposed OADE-Net produced the highest ReID accuracy.
Table 6. Comparisons of the ReID accuracies by the proposed method and state-of-the-art methods with DBPerson-Recog-DB1 (unit: %).
Figure 11. Graphs of precision versus recall of the proposed and state-of-the-art methods with DBPerson-Recog-DB1.

4.4. Testing of Proposed Method with SYSU-MM01

4.4.1. Ablation Studies

In the first experiment, the accuracy of various image compositions explained in Section 3.1 was evaluated. As shown in Table 7, both original DenseNet and attention-guided DenseNet yielded the best performances in IPVT2.
Table 7. Comparisons of ReID accuracies according to various input image compositions with SYSU-MM01 (unit: %).
Subsequently, the comparisons of ReID accuracies by original DenseNet, attention-guided DenseNet, and proposed OADE-Net were performed. As shown in Table 8, the highest accuracy was obtained when the original DenseNet, attention-guided DenseNet, and SCE-Net were all used. To evaluate the performance of the SCE-Net, its accuracy was also compared with that of WS, WP, and SVM. Table 9 presents the comparisons of ReID accuracies by the proposed method and various score-level fusions in which the proposed SCE-Net demonstrates the highest accuracy.
Table 8. Comparisons on the ReID accuracies of the original DenseNet, attention-guided DenseNet, and proposed OADE-Net with SYSU-MM01 (unit: %).
Table 9. Comparisons of ReID accuracies of the proposed method and various score-level fusions with SYSU-MM01 (unit: %).

4.4.2. Comparisons of Proposed Method with State-of-the-Art Methods

Table 10 presents the comparisons of the ReID accuracies of the proposed and state-of-the-art methods. The experimental results showed that the OADE-Net demonstrated higher accuracy than the state-of-the-art methods regarding the most important metrics, rank 1 and mAP. Specifically, 57.30% was achieved in rank 1, while mAP achieved 41.50%. The proposed model outperformed the second-best model of RGA in rank 1 by 2.62% and the second-best model of Deep-person in mAP by 24.03%. The performances of the state-of-the-art methods were relatively low because the features required for ReID were not adequately detected as IR images do not contain color and detailed texture information in comparison to visible images. In addition, as shown in Table 10, the proposed OADE-Net performed poorer than the state-of-the-art methods in rank 10 and rank 20, whereas OADE-Net shows the highest accuracies in rank 1 and mAP, which are the more important metrics for measuring the performance of person ReID.
Table 10. Comparisons of the ReID accuracies by the proposed and state-of-the-art methods with SYSU-MM01 (unit: %).
Figure 12 shows the graphs of precision versus recall by the proposed and state-of-the-art methods. It illustrates how the proposed OADE-Net produced the highest ReID accuracy. In rank 1, there is no large difference between other state-of-the-art methods and OADE-Net, but in the mAP, there is a large difference because rank is calculated by 1:N matching, whereas mAP is by 1:1 matching.
Figure 12. Graphs of precision versus recall of the proposed and state-of-the-art methods with SYSU-MM01.

4.5. Analysis of Proposed Method

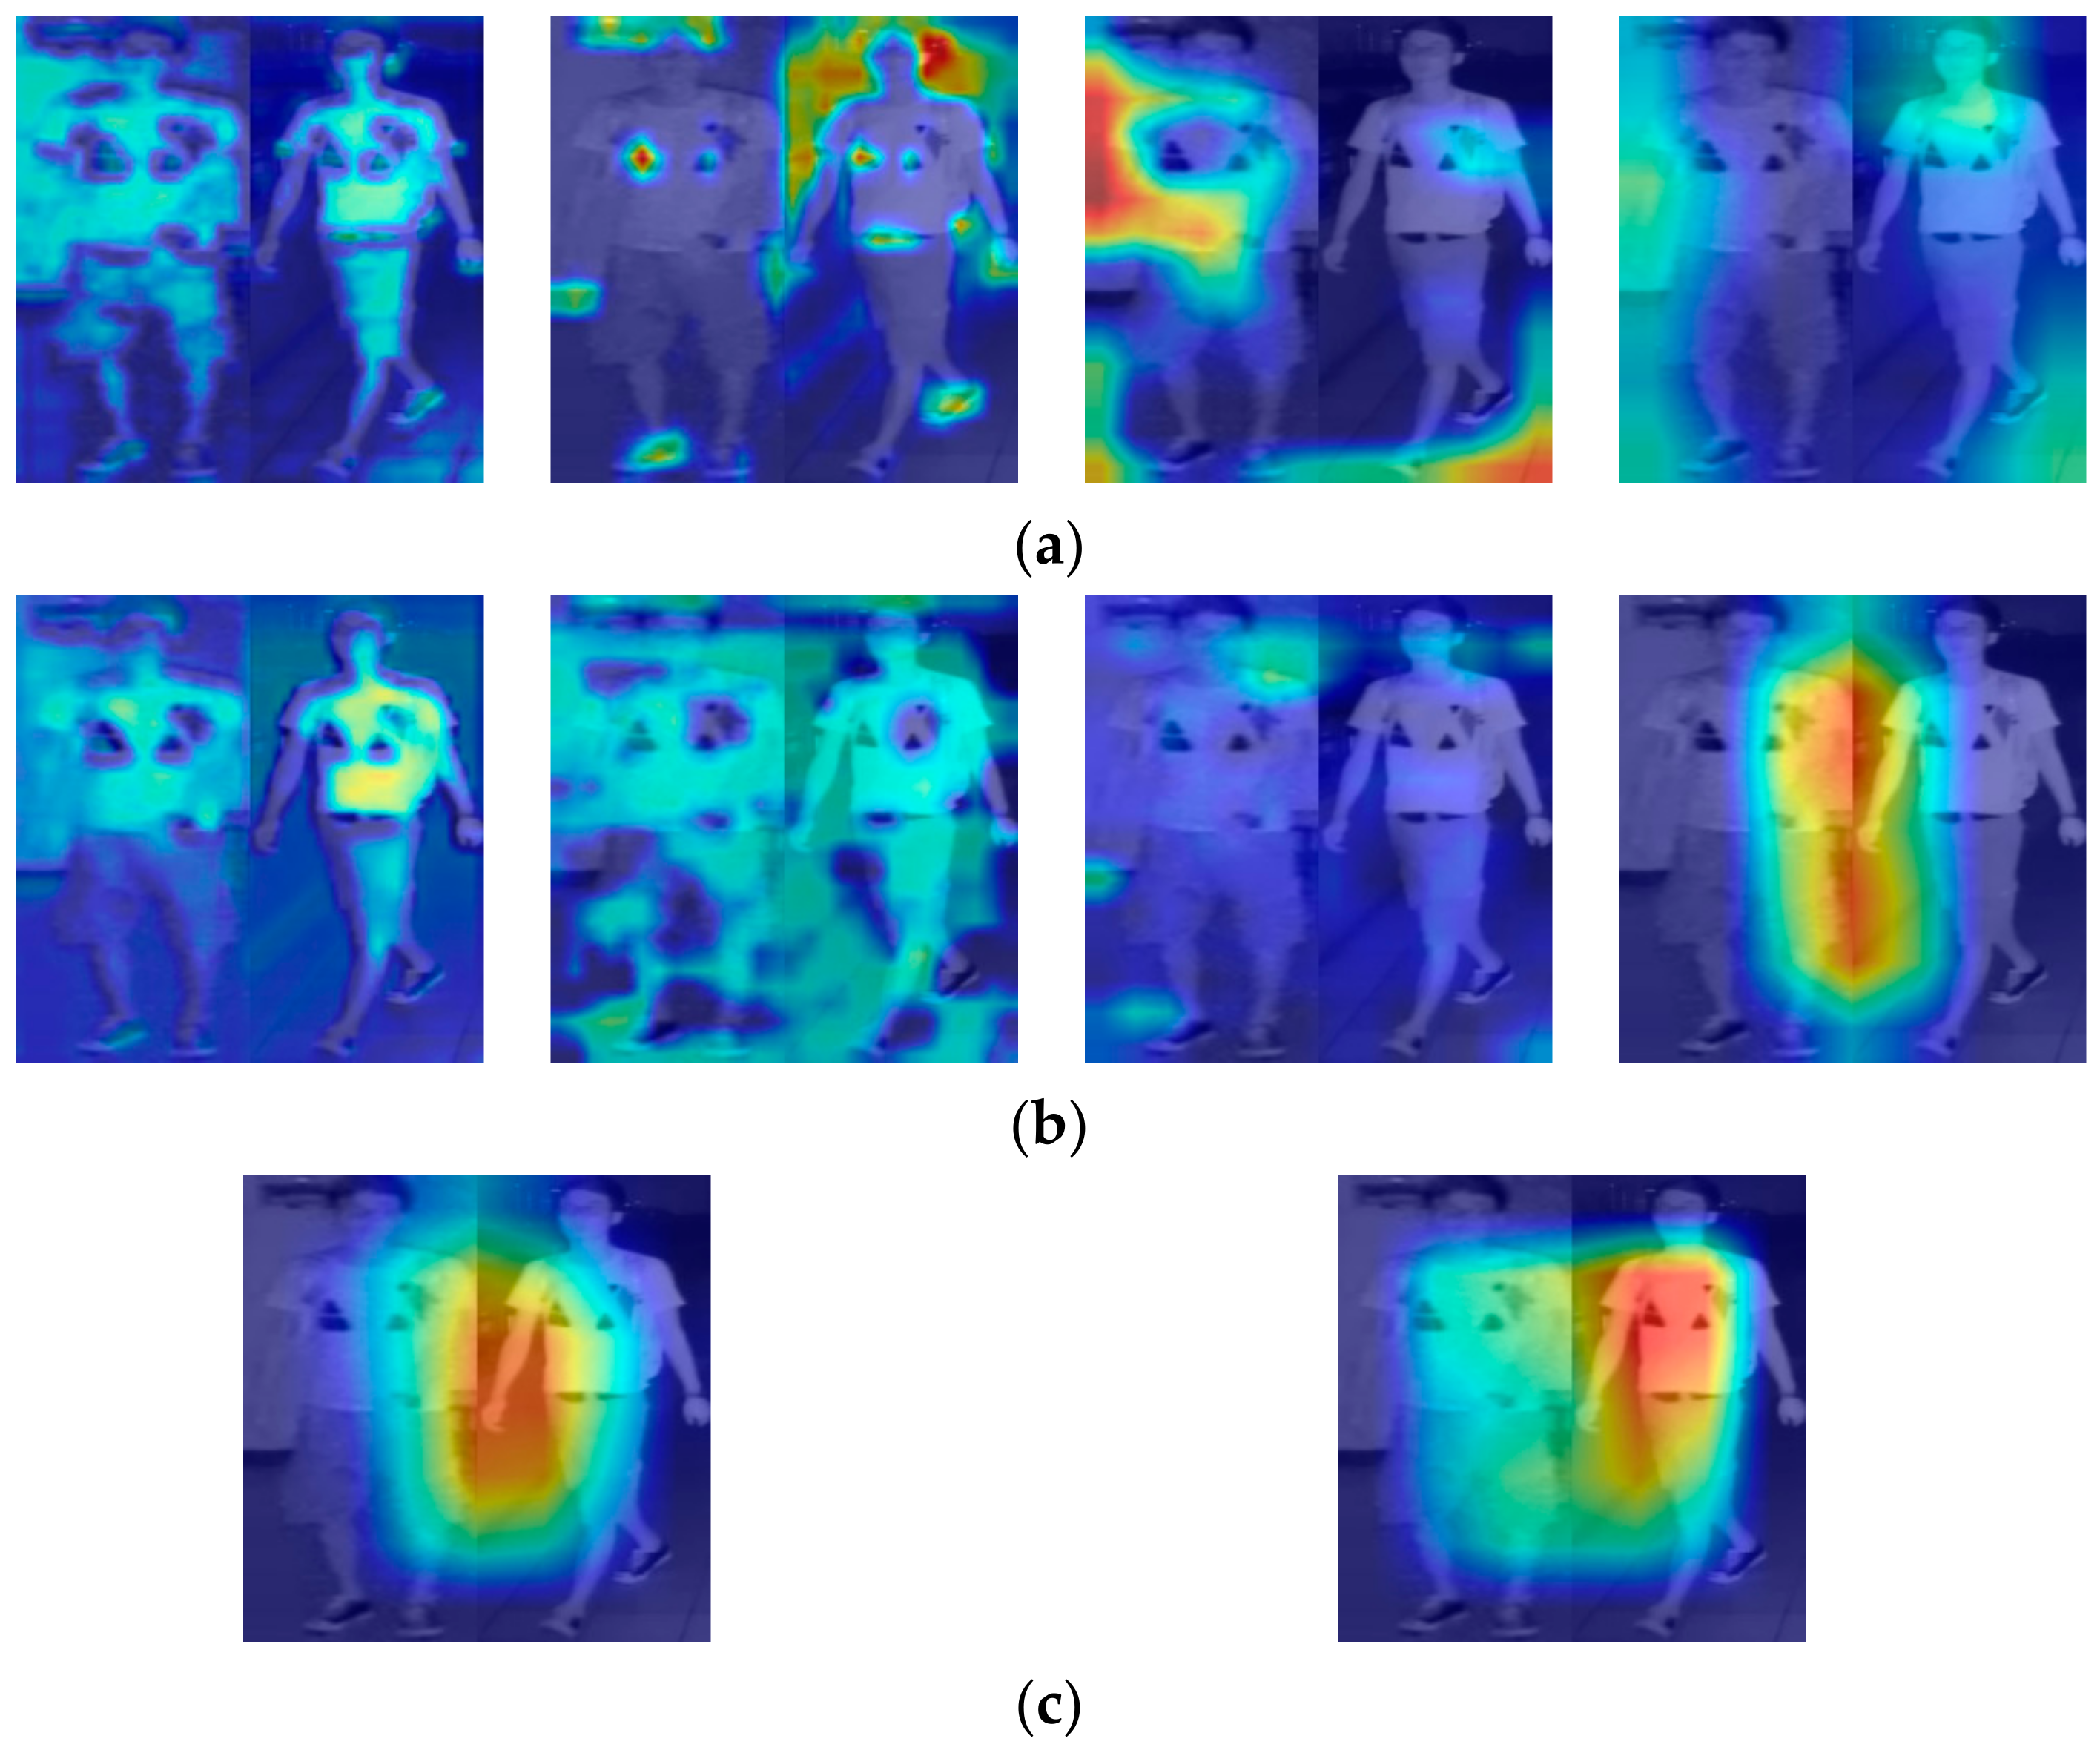
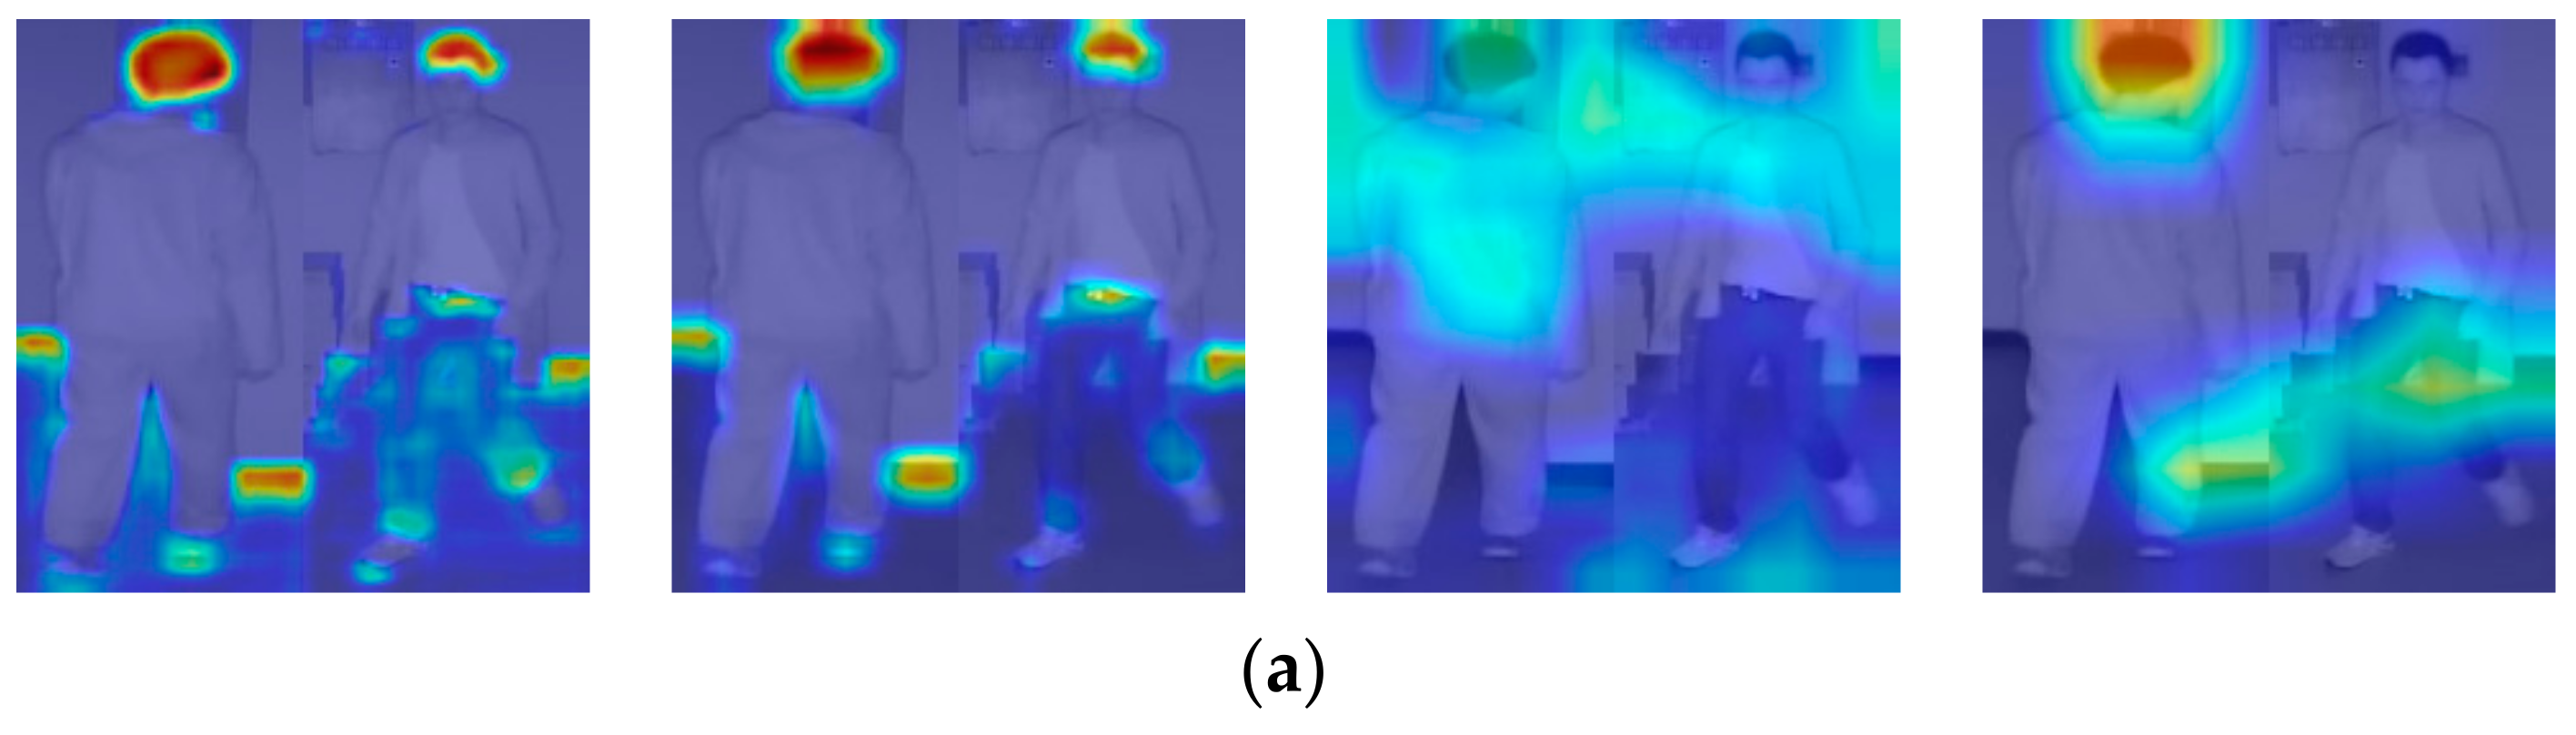
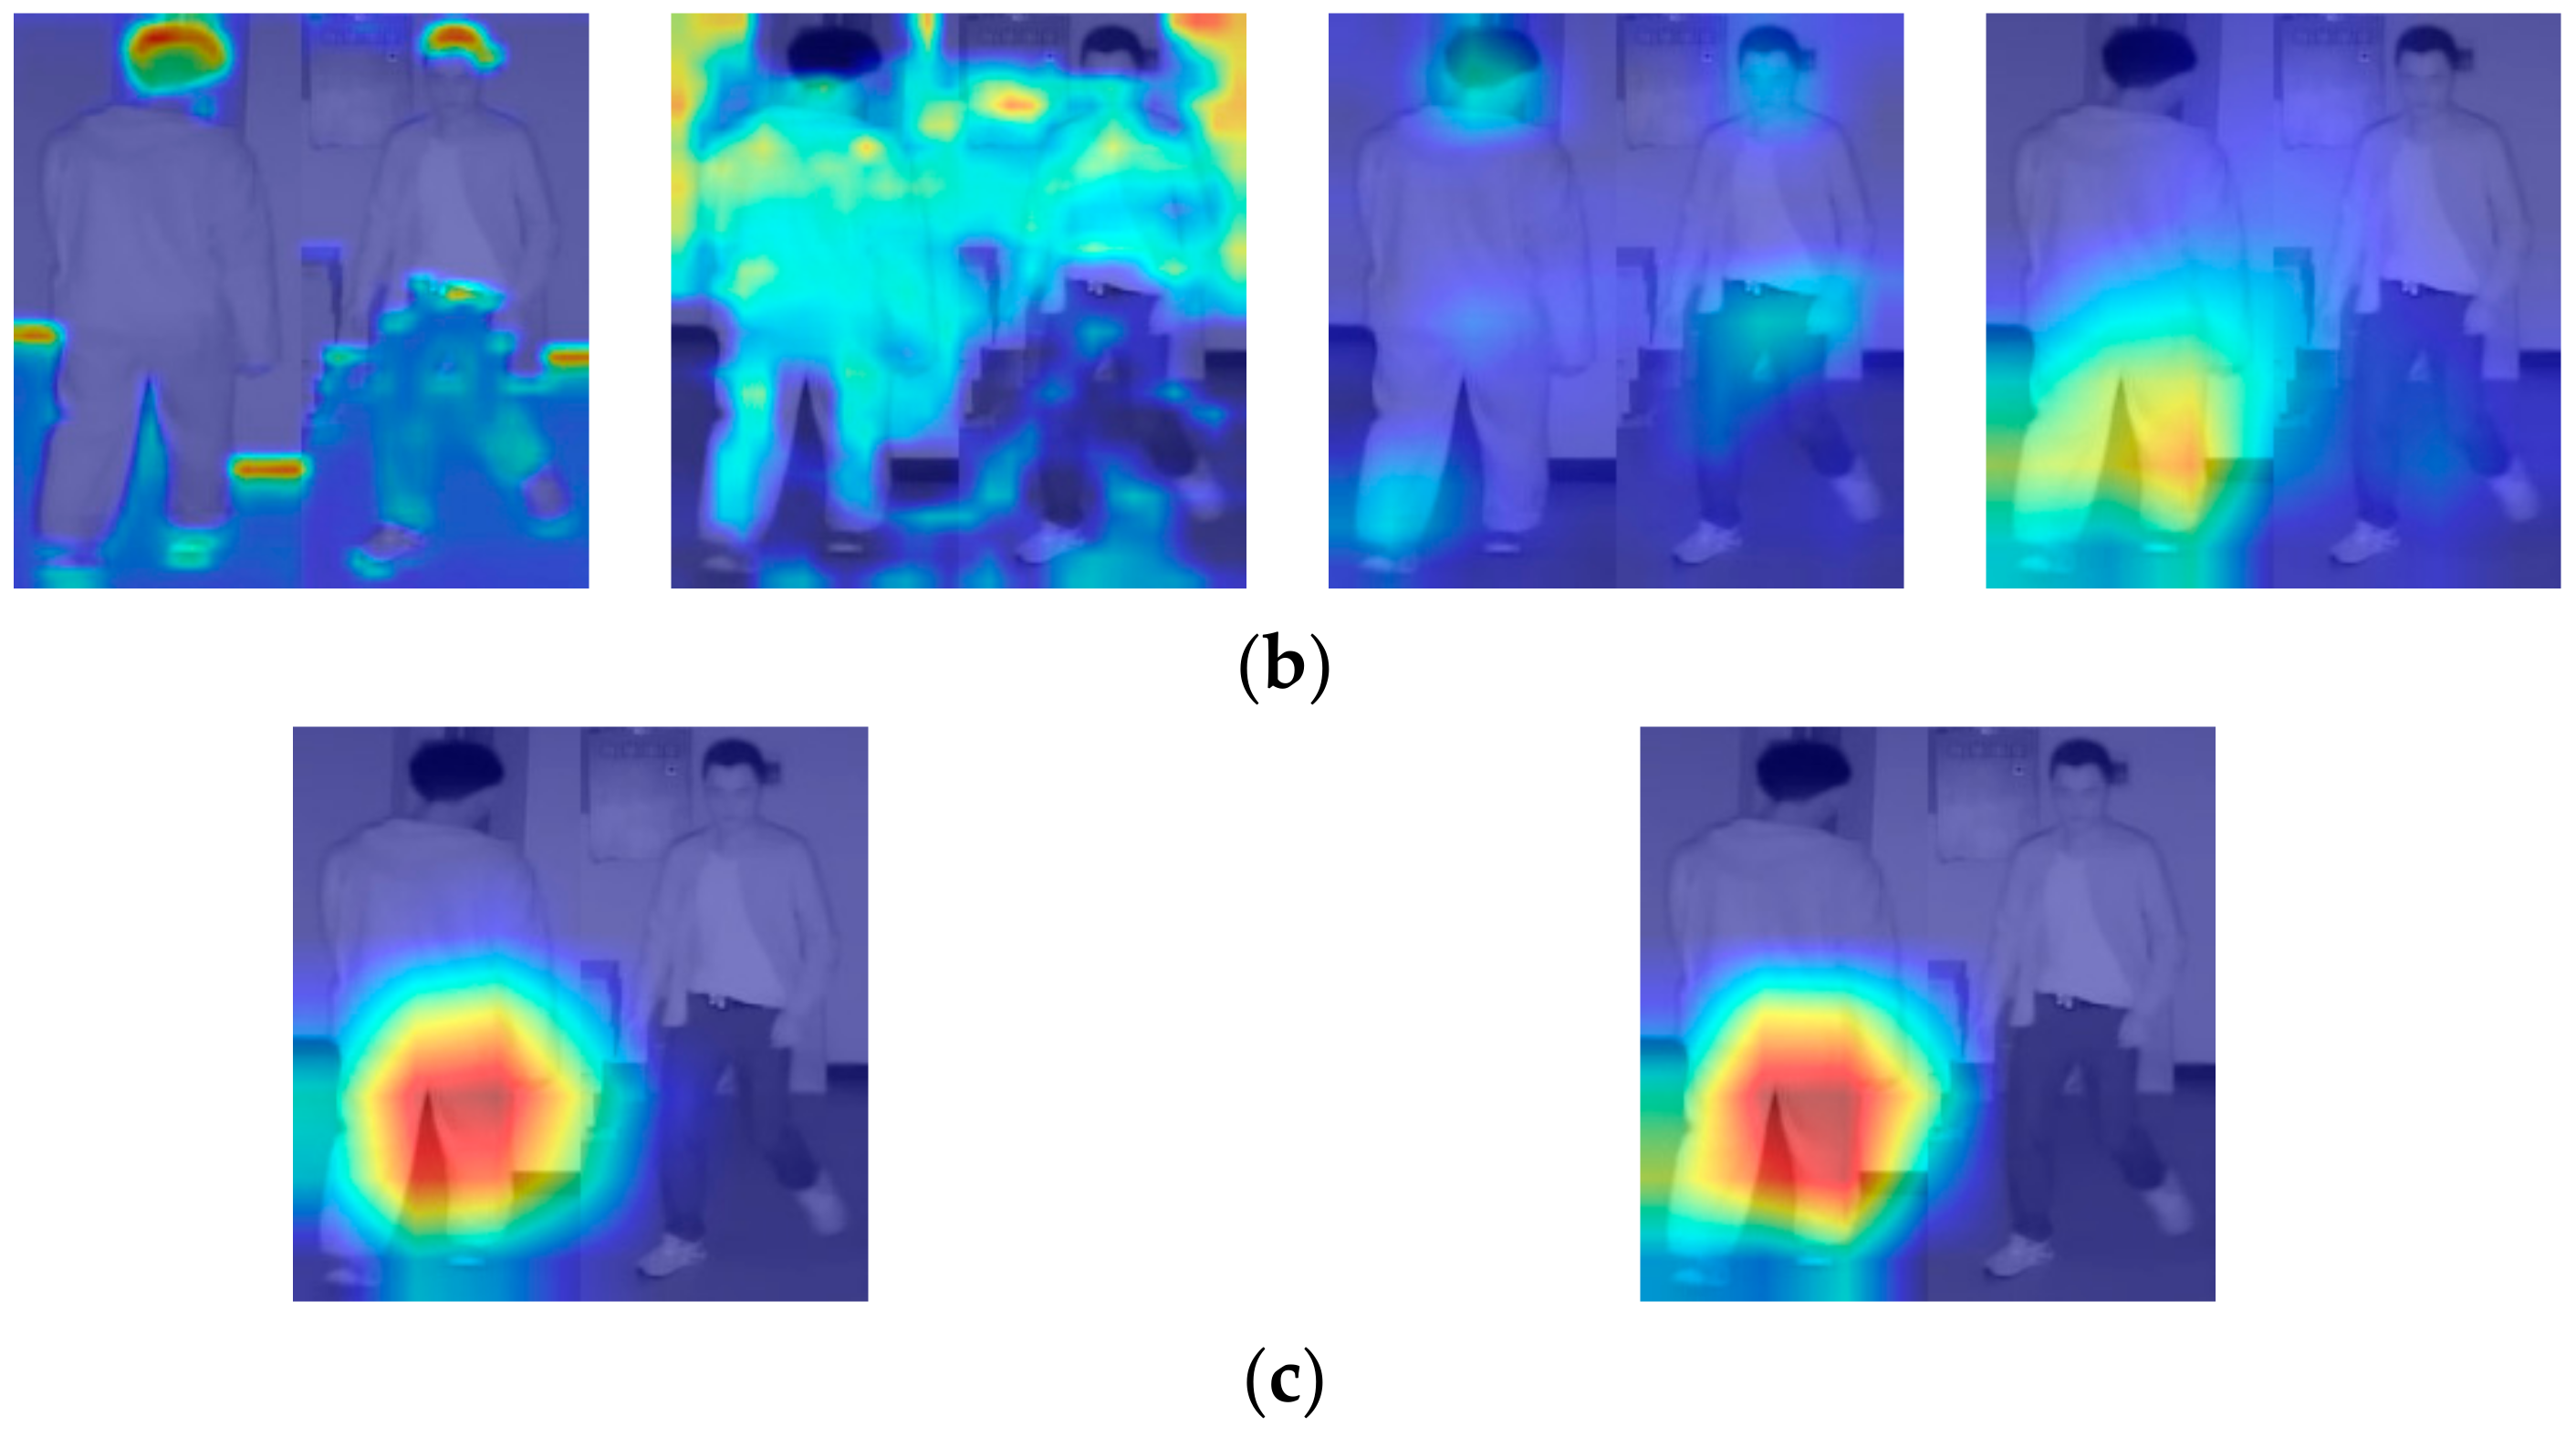
4.5.1. Visual Inspection of Extracted Features by Gradient-Weighted Class Activation Mapping (Grad-Cam) and Analyses of Correct and Incorrect Matching Cases

In this subsection, visual inspections of extracted features were performed based on Grad-cam [49] to examine whether important features for ReID were extracted from the original DenseNet, attention-guided DenseNet, and SCE-Net. In Grad-cam images, important features are marked in red color, while unimportant features are marked in blue color.
Figure 13 shows Grad-cam images obtained by the original DenseNet, attention-guided DenseNet, and SCE-Net, in the case of genuine matching. Figure 13a shows the Grad-cam images extracted from the original DenseNet, while Figure 13b shows the Grad-cam images extracted from the attention-guided DenseNet. In Figure 13a,b, Grad-cam images extracted from dense blocks 1 to 4 in Table A1 and Table A2 (Appendix A) are arranged from left to right. Figure 13c shows Grad-cam images extracted from the SCE-Net in which the left-side images were extracted from conv layer 1 of Table A3 (Appendix A), while the right-side images were extracted from conv layer 2. Figure 14 shows Grad-cam images obtained by the original DenseNet, attention-guided DenseNet, and SCE-Net in the case of imposter matching. When Figure 13 and Figure 14 are compared, a genuine matching of Figure 13 is achieved when the objects in the enrolled and input query images are of the same person. In this case, important features for ReID were extracted from similar body part regions. Furthermore, imposter matching in Figure 14 is achieved when the objects in the enrolled and input query images are of different classes. In this case, important features for ReID are extracted from different body part regions (especially from the legs). Based on genuine matching and imposter matching shown in Figure 13 and Figure 14, it can be considered that important features for ReID are extracted adequately based on the proposed model from the body part regions instead of the background.
Figure 13. Grad-cam images obtained by the original DenseNet, attention-guided DenseNet, and SCE-Net in case of genuine matching. Grad-cam images extracted from (a) the original DenseNet, and (b) the attention-guided DenseNet. Grad-cam images extracted from dense blocks 1 to 4 in Table A1 and Table A2 (Appendix A) are arranged from left to right in (a,b). (c) Grad-cam images extracted from the SCE-Net where the left-side images were extracted from conv layer 1 of Table A3 (Appendix A), while the right-side images were extracted from conv layer 2. In (ac), the left-hand side of the composition image is the enrolled image, while the right-hand side is the input query image.
Figure 14. Grad-cam images obtained by the original DenseNet, attention-guided DenseNet, and SCE-Net, in the case of imposter matching. Grad-cam images extracted from (a) the original DenseNet and (b) the attention-guided DenseNet. Grad-cam images extracted from dense blocks 1 to 4 in Table A1 and Table A2 (Appendix A) are arranged from left to right in (a,b). (c) Grad-cam images extracted from the SCE-Net in which the left-side images were extracted from conv layer 1 of Table A3 (Appendix A), while the right-side images were extracted from conv layer 2. In (ac), the left-hand side of the composition image is the enrolled image, while the right-hand side is the input query image.
Figure 15 shows examples of correct acceptance and correct rejection as determined based on the proposed method. As shown in genuine matching in Figure 15a, even the objects that have different shapes or views in the enrolled and input query images resulted in correct acceptance. As shown in the imposter matching in Figure 15b, even the objects which had similar shapes or views between the enrolled and input query images resulted in correct rejection.
Figure 15. Examples of (a) correct acceptance from genuine matching and (b) correct rejection from imposter matching.
In addition, Figure 16 shows the examples of incorrect acceptance and incorrect rejection determined based on the proposed method. As shown in the case of genuine matching in Figure 16a, the objects in the enrolled and input query images are different in view. As shown in imposter matching in Figure 16b, the objects in the enrolled and input query images are very similar to each other in terms of shape and appearance, therefore resulting in incorrect acceptance.
Figure 16. Examples of (a) incorrect rejection from genuine matching and (b) incorrect acceptance from imposter matching.

4.5.2. Computational Cost and Processing Time

The computational cost of the models used in the OADE-Net was measured using floating-point operations (FLOPs) and a number of parameters. For measurements, the ptflops [50] of Python were used. When FLOPs and the number of parameters of each model were measured, the FLOPs of the original DenseNet, attention-guided DenseNet, and SCE-Net were 15.64   × 10 9 , 15.64   × 10 9 , and 17.22   × 10 9 , respectively, as indicated in Table 11. The number of parameters of the three models were 26.48 M, 26.64 M, and 175.82 M. SCE-Net has larger numbers of FLOPs and parameters compared with the original DenseNet and attention-guided DenseNet because the number of input channels of SCE-Net is considerably greater than those of the original DenseNet and attention-guided DenseNet in Table A1 and Table A2 (Appendix A).
Table 11. Comparison of the FLOPs and number of parameters of the original DenseNet, attention-guided DenseNet, and SCE-Net.
In the following experiment, the average processing time per image of the proposed model was measured. The measurements were saved on a desktop computer (specifications are listed in Section 4.1) and a Jetson TX2 embedded system (NVIDIA Pascal™-family CPU including 256 compute unified device architecture (CUDA) cores) shown in Figure 17 [51]. The reason for acquiring the measurements on the Jetson TX2 embedded system is that most scenarios for an intelligent surveillance camera system to which the proposed method is applied involve embedded systems at the camera end (on-board computing) instead of the server end (server computing) owing to communication failures.
Figure 17. Jetson TX2 embedded system.
As shown in the experimental results in Table 12, the original DenseNet required 158.42 ms when measured on the Jetson TX2 embedded system; this is 118.07 ms longer than that obtained by the desktop computer. The attention-guided DenseNet required 160.06 ms when measured on the Jetson TX2 embedded systems; this is 116.89 ms longer than that obtained by the desktop computer. The SCE-Net required 155.07 ms when measured on the Jetson TX2 embedded system, which is 136.98 ms longer than that obtained by the desktop computer. The SCE-Net showed a large difference in required time between the desktop computer and Jetson TX2 because the SCE-Net model has a fewer number of layers but a greater number of parameters (Table 11), thus requiring a longer processing time on the Jetson TX2 embedded system with fewer cores compared to the desktop computer. In addition, when the processing times on the desktop computer are compared, as shown in Table 12, the SCE-Net with larger FLOPs and parameters yielded shorter processing times than those obtained by the other two models. This is because the amount of memory access has a greater impact than FLOPs when measuring the model’s inference time. In addition, the skip connection of ResNet has a relatively high inference time due to high memory access, and DenseNet also has a similar dense connection, resulting in a higher inference time [52]. Therefore, the difference in processing time in Table 12 is due to the differences in memory access. As shown in Table 12, the processing times of the proposed method, including all the three models, were 101.61 ms and 473.55 ms on the desktop computer and the Jetson TX2 embedded system, respectively, which represent processing speeds of 9.84 and 2.11 frames per second, respectively. Therefore, it can be considered that the proposed method can be executed on an embedded system with limited resources.
Table 12. Comparison of the processing time among the original DenseNet, attention-guided DenseNet, and SCE-Net (unit: ms).

5. Conclusions

This study proposed the OADE-Net—a ReID model that recognizes pedestrians using day- and night-time IR images. The OADE-Net consisted of the original and attention-guided DenseNets as well as SCE-Net. The optimal construction of our OADE-Net was experimentally made based on the ReID accuracies of ablation studies in Section 4.3.2 and Section 4.4.1. The open databases used in the experiment were DBPerson-Recog-DB1 and SYSU-MM01, and the person ReID performance was measured using only IR images in terms of rank 1, rank 10, rank 20, and mAP. The experimental results showed that the highest performance was demonstrated when the proposed OADE-Net was used compared with the case where only the original DenseNet and attention-guided DenseNet were used. Additionally, the proposed SCE-Net outperformed other existing score-level fusion methods. When compared with the state-of-the-art methods, the proposed OADE-Net demonstrated an outstanding ReID accuracy. Analyzing the features based on Grad-cam confirmed that the proposed model adequately extracted important features for person ReID. Its execution on a desktop computer as well as an embedded system with limited resources was verified. However, it was confirmed that the proposed method caused ReID errors in cases of different views in genuine matching or similar shape and appearance in imposter matching.
In future studies, more sophisticated models and ensemble model-based methods will be examined to improve the correct recognition of ReID robust to different views in genuine matching or similar shape and appearance in imposter matching. Furthermore, the applicability of the proposed model in other image recognition fields (e.g., facial, iris recognition, etc.) will be studied.

Author Contributions

Methodology, M.S.J.; Conceptualization, S.I.J.; Validations, S.J.K. and K.B.R.; Supervision, K.R.P.; Writing—original draft, M.S.J.; Writing—review and editing, K.R.P. All authors have read and agreed to the published version of the manuscript.

Funding

This research was supported in part by the National Research Foundation of Korea (NRF) funded by the Ministry of Science and ICT (MSIT) through the Basic Science Research Program (NRF-2021R1F1A1045587), in part by the NRF funded by the MSIT through the Basic Science Research Program (NRF-2022R1F1A1064291), and in part by the NRF funded by the MSIT through the Basic Science Research Program (NRF-2020R1A2C1006179).

Data Availability Statement

Not applicable.

Conflicts of Interest

The authors declare no conflict of interest.

Appendix A

Table A1. Structure of original DenseNet.
LayerFilter
(Number of Filters, Size, Stride)
PaddingInputOutput
Input layer 224 × 224 × 3224 × 224 × 3
Convolution (Conv) block96, 7 × 7 × 3, 23 × 3224 × 224 × 3112 × 112 × 96
Maximum (Max) pooling96, 3 × 3 × 96, 21 × 1112 × 112 × 9656 × 56 × 96
Dense block 16 × 192, 1 × 1 × 96, 1
6 × 48, 3 × 3 × 192, 1
1 × 156 × 56 × 9656 × 56 × 384
Transition block 1192, 1 × 1 × 384, 1
192, 2 × 2 × 192, 2
56 × 56 × 38428 × 28 × 192
Dense block 212 × 192, 1 × 1 × 192, 1
12 × 48, 3 × 3 × 48, 1
1 × 128 × 28 × 19228 × 28 × 768
Transition block 2384, 1 × 1 × 768, 1
384, 2 × 2 × 384, 2
28 × 28 × 76814 × 14 × 384
Dense block 336 × 192, 1 × 1 × 384, 1
36 × 48, 3 × 3 × 192, 1
1 × 114 × 14 × 38414 × 14 × 2112
Transition block 31056, 1 × 1 × 2112, 1
1056, 2 × 2 × 1056, 2
14 × 14 × 21127 × 7 × 1056
Dense block 424 × 192, 1 × 1 × 1056, 1
24 × 48, 3 × 3 × 192, 1
1 × 17 × 7 × 10567 × 7 × 2208
Global average pooling2208, 7 × 7 × 2208, 1 7 × 7 × 22081 × 1 × 2208
Fully connected layer 1 × 1 × 22081 × 1 × 2
Softmax 1 × 1 × 21 × 1 × 2
Table A2. Structure of attention-guided DenseNet.
LayerFilter
(Number of Filters, Size, Stride)
PaddingInputOutput
Input layer 224 × 224 × 3 224 × 224 × 3
Conv block96, 7 × 7 × 3, 23 × 3224 × 224 × 3112 × 112 × 96
Max pooling96, 3 × 3 × 96, 21 × 1112 × 112 × 9656 × 56 × 96
Dense block 16 × 192, 1 × 1 × 96, 1
6 × 48, 3 × 3 × 192, 1
1 × 156 × 56 × 9656 × 56 × 384
Transition block 1192, 1 × 1 × 384, 1
192, 2 × 2 × 192, 2
56 × 56 × 38428 × 28 × 192
Convolutional block attention module (CBAM) 12, 28 × 28 × 192, 28
1, 7 × 7 × 2, 1
3 × 328 × 28 × 19228 × 28 × 192
Dense block 212 × 192, 1 × 1 × 192, 1
12 × 48, 3 × 3 × 48, 1
1 × 128 × 28 × 19228 × 28 × 768
Transition block 2384, 1 × 1 × 768, 1
384, 2 × 2 × 384, 2
28 × 28 × 76814 × 14 × 384
CBAM 22, 14 × 14 × 384, 14
1, 7 × 7 × 2, 1
3 × 314 × 14 × 38414 × 14 × 384
Dense block 336 × 192, 1 × 1 × 384, 1
36 × 48, 3 × 3 × 192, 1
1 × 114 × 14 × 38414 × 14 × 2112
Transition block 31056, 1 × 1 × 2112, 1
1056, 2 × 2 × 1056, 2
14 × 14 × 21127 × 7 × 1056
CBAM 32, 7 × 7 × 1056, 7
1, 7 × 7 × 2, 1
3 × 37 × 7 × 10567 × 7 × 1056
Dense block 424 × 192, 1 × 1 × 1056, 1
24 × 48, 3 × 3 × 192, 1
1 × 17 × 7 × 10567 × 7 × 2208
Global average pooling2208, 7 × 7× 2208, 1 7 × 7 × 22081 × 1 × 2208
Fully connected layer 1 × 1 × 22081 × 1 × 2
Softmax 1 × 1 × 21 × 1 × 2
Table A3. Structure of SCE-Net.
LayerFilter
(Number of Filters, Size, Stride)
PaddingInputOutput
Input layer 7 × 7 × 44197 × 7 × 4419
Conv layer 12210, 3 × 3 × 4419, 11 × 17 × 7 × 44197 × 7 × 2210
Conv layer 24419, 3 × 3 × 2210, 11 × 17 × 7 × 22107 × 7 × 4419
Global average pooling4419, 7 × 7 × 4419, 1 7×7 × 44191 × 1 × 4419
Fully connected layer 1 × 1 × 44191 × 1 × 2
Softmax 1 × 1 × 21 × 1 × 2

References

  1. Huang, T.; Russell, S. Object identification in a Bayesian context. In Proceedings of the International Joint Conference on Artificial Intelligence, Nagoyam, Japan, 23–29 August 1997; pp. 1276–1282. [Google Scholar]
  2. Li, W.; Zhao, R.; Xiao, T.; Wang, X. Deepreid: Deep filter pairing neural network for person re-identification. In Proceedings of the IEEE Conference on Computer Vision and Pattern Recognition, Columbus, OH, USA, 23–28 June 2014; pp. 152–159. [Google Scholar]
  3. Ye, M.; Shen, J.; Lin, G.; Xiang, T.; Shao, L.; Hoi, S.C. Deep learning for person re-identification: A survey and outlook. IEEE Trans. Pattern Anal. Mach. Intell. 2021, 44, 2872–2893. [Google Scholar] [CrossRef] [PubMed]
  4. Yaghoubi, E.; Kumar, A.; Proença, H. SSS-PR: A short survey of surveys in person re-identification. Pattern Recognit. Lett. 2021, 143, 50–57. [Google Scholar] [CrossRef]
  5. Zheng, H.; Zhong, X.; Huang, W.; Jiang, K.; Liu, W.; Wang, Z. Visible-infrared person re-identification: A comprehensive survey and a new setting. Electronics 2022, 11, 454. [Google Scholar] [CrossRef]
  6. Zhang, J.A.; Yuan, Y.; Wang, Q. Night person re-identification and a benchmark. IEEE Access 2019, 7, 95496–95504. [Google Scholar] [CrossRef]
  7. Wu, A.; Zheng, W.-S.; Yu, H.-X.; Gong, S.; Lai, J. RGB-infrared cross-modality person re-identification. In Proceedings of the IEEE International Conference on Computer Vision, Venice, Italy, 22–29 October 2017; pp. 5380–5389. [Google Scholar]
  8. OADE-Net for Person Re-Identification Using Infrared Light Images with Algorithm. Available online: https://github.com/MinsuJeong95/OADE (accessed on 19 July 2022).
  9. Bai, X.; Yang, M.; Huang, T.; Dou, Z.; Yu, R.; Xu, Y. Deep-person: Learning discriminative deep features for person re-identification. Pattern Recognit. 2020, 98, 107036. [Google Scholar] [CrossRef]
  10. Lin, Y.; Zheng, L.; Zheng, Z.; Wu, Y.; Hu, Z.; Yan, C.; Yang, Y. Improving person re-identification by attribute and identity learning. Pattern Recognit. 2019, 95, 151–161. [Google Scholar] [CrossRef]
  11. Zheng, Z.; Zheng, L.; Yang, Y. Pedestrian alignment network for large-scale person re-identification. IEEE Trans. Circuits Syst. Video Technol. 2018, 29, 3037–3045. [Google Scholar] [CrossRef]
  12. Zheng, L.; Huang, Y.; Lu, H.; Yang, Y. Pose-invariant embedding for deep person re-identification. IEEE Trans. Image Process. 2019, 28, 4500–4509. [Google Scholar] [CrossRef] [PubMed]
  13. Song, L.; Wang, C.; Zhang, L.; Du, B.; Zhang, Q.; Huang, C.; Wang, X. Unsupervised domain adaptive re-identification: Theory and practice. Pattern Recognit. 2020, 102, 107173. [Google Scholar] [CrossRef]
  14. Wu, L.; Wang, Y.; Gao, J.; Li, X. Where-and-when to look: Deep Siamese attention networks for video-based person re-identification. IEEE Trans. Multimed. 2018, 21, 1412–1424. [Google Scholar] [CrossRef]
  15. Zheng, Z.; Zheng, L.; Yang, Y. A discriminatively learned CNN embedding for person reidentification. ACM Trans. Multimed. Comput. Commun. Appl. 2017, 14, 1–20. [Google Scholar] [CrossRef]
  16. Wu, A.; Zheng, W.-S.; Gong, S.; Lai, J. RGB-IR person re-identification by cross-modality similarity preservation. Int. J. Comput. Vis. 2020, 128, 1765–1785. [Google Scholar] [CrossRef]
  17. Kang, J.K.; Hoang, T.M.; Park, K.R. Person re-identification between visible and thermal camera images based on deep residual CNN using single input. IEEE Access 2019, 7, 57972–57984. [Google Scholar] [CrossRef]
  18. Kang, J.K.; Lee, M.B.; Yoon, H.S.; Park, K.R. AS-RIG: Adaptive selection of reconstructed input by generator or interpolation for person re-identification in cross-modality visible and thermal images. IEEE Access 2021, 9, 12055–12066. [Google Scholar] [CrossRef]
  19. Liu, H.; Cheng, J.; Wang, W.; Su, Y.; Bai, H. Enhancing the discriminative feature learning for visible-thermal cross-modality person re-identification. Neurocomputing 2020, 398, 11–19. [Google Scholar] [CrossRef]
  20. Wang, G.A.; Zhang, T.; Cheng, J.; Liu, S.; Yang, Y.; Hou, Z. RGB-infrared cross-modality person re-identification via joint pixel and feature alignment. In Proceedings of the IEEE/CVF International Conference on Computer Vision, Seoul, Korea, 27 October–2 November 2019; pp. 3623–3632. [Google Scholar]
  21. Huang, G.; Liu, Z.; Van Der Maaten, L.; Weinberger, K.Q. Densely connected convolutional networks. In Proceedings of the IEEE Conference on Computer Vision and Pattern Recognition, Honolulu, HI, USA, 21–26 July 2017; pp. 4700–4708. [Google Scholar]
  22. Ioffe, S.; Szegedy, C. Batch normalization: Accelerating deep network training by reducing internal covariate shift. In Proceedings of the International Conference on Machine Learning, Lille, France, 6–11 July 2015; pp. 448–456. [Google Scholar]
  23. Xu, K.; Ba, J.; Kiros, R.; Cho, K.; Courville, A.; Salakhudinov, R.; Zemel, R.; Bengio, Y. Show, attend and tell: Neural image caption generation with visual attention. In Proceedings of the International Conference on Machine Learning, Lille, France, 6–11 July 2015; pp. 2048–2057. [Google Scholar]
  24. Vaswani, A.; Shazeer, N.; Parmar, N.; Uszkoreit, J.; Jones, L.; Gomez, A.N.; Kaiser, Ł.; Polosukhin, I. Attention is all you need. In Proceedings of the Advances in Neural Information Processing Systems, Long Beach, CA, USA, 4–9 December 2017; pp. 5998–6008. [Google Scholar]
  25. Woo, S.; Park, J.; Lee, J.-Y.; Kweon, I.S. CBAM: Convolutional block attention module. In Proceedings of the European Conference on Computer Vision, Munich, Germany, 8–14 September 2018; pp. 3–19. [Google Scholar]
  26. Zheng, L.; Shen, L.; Tian, L.; Wang, S.; Wang, J.; Tian, Q. Scalable person re-identification: A benchmark. In Proceedings of the IEEE International Conference on Computer Vision, Santiago, Chile, 7–13 December 2015; pp. 1116–1124. [Google Scholar]
  27. Ristani, E.; Solera, F.; Zou, R.; Cucchiara, R.; Tomasi, C. Performance measures and a data set for multi-target, multi-camera tracking. In Proceedings of the European Conference on Computer Vision, Amsterdam, The Netherlands, 8–16 October 2016; pp. 17–35. [Google Scholar]
  28. Wei, L.; Zhang, S.; Gao, W.; Tian, Q. Person transfer GAN to bridge domain gap for person re-identification. In Proceedings of the IEEE/CVF Conference on Computer Vision and Pattern Recognition, Salt Lake City, UT, USA, 18–23 June 2018; pp. 79–88. [Google Scholar]
  29. Nguyen, D.T.; Hong, H.G.; Kim, K.W.; Park, K.R. Person recognition system based on a combination of body images from visible light and thermal cameras. Sensors 2017, 17, 605. [Google Scholar] [CrossRef] [PubMed]
  30. C600 Webcam Camera. Available online: https://support.logitech.com/en_us/product/5869 (accessed on 10 June 2022).
  31. Tau2 Thermal Imaging Camera. Available online: http://www.flir.com/cores/display/?id=54717 (accessed on 10 June 2022).
  32. NVIDIA GeForce GTX 1070 Card. Available online: https://www.nvidia.com/en-in/geforce/products/10series/geforce-gtx-1070/ (accessed on 10 June 2022).
  33. Pytorch. Available online: https://pytorch.org/get-started/previous-versions (accessed on 19 June 2022).
  34. Kingma, D.P.; Ba, J. Adam: A method for stochastic optimization. In Proceedings of the International Conference on Learning Representations, San Diego, CA, USA, 7–9 May 2015. [Google Scholar]
  35. Softmax Function. Available online: https://en.wikipedia.org/wiki/Softmax_function (accessed on 9 August 2022).
  36. Cross Entropy. Available online: https://en.wikipedia.org/wiki/Cross_entropy (accessed on 9 August 2022).
  37. mAP. Available online: https://en.wikipedia.org/wiki/Evaluation_measures_(information_retrieval)#Mean_average_precision (accessed on 10 June 2022).
  38. Sensitivity and Specificity. Available online: https://en.wikipedia.org/wiki/Sensitivity_and_specificity (accessed on 10 June 2022).
  39. Mateo, J.R.S.C. Weighted sum method and weighted product method. In Multi Criteria Analysis in the Renewable Energy Industry; Springer: London, UK, 2012; pp. 19–22. [Google Scholar]
  40. Vapnik, V. The Nature of Statistical Learning Theory; Springer Science & Business Media: New York, NY, USA, 1999. [Google Scholar]
  41. Zhou, K.; Yang, Y.; Cavallaro, A.; Xiang, T. Omni-scale feature learning for person re-identification. In Proceedings of the IEEE/CVF International Conference on Computer Vision, Seoul, Korea, 27 October–2 November 2019; pp. 3702–3712. [Google Scholar]
  42. Jia, J.; Ruan, Q.; Hospedales, T.M. Frustratingly easy person re-identification: Generalizing person re-id in practice. In Proceedings of the British Machine Vision Conference, Cardiff, UK, 9–12 September 2019. [Google Scholar]
  43. Chen, G.; Gu, T.; Lu, J.; Bao, J.-A.; Zhou, J. Person re-identification via attention pyramid. IEEE Trans. Image Process. 2021, 30, 7663–7676. [Google Scholar] [CrossRef] [PubMed]
  44. Wei, L.; Wei, Z.; Jin, Z.; Yu, Z.; Huang, J.; Cai, D.; He, X.; Hua, X.-S. SIF: Self-inspirited feature learning for person re-identification. IEEE Trans. Image Process. 2020, 29, 4942–4951. [Google Scholar] [CrossRef] [PubMed]
  45. Zhang, Z.; Lan, C.; Zeng, W.; Jin, X.; Chen, Z. Relation-aware global attention for person re-identification. In Proceedings of the IEEE/CVF Conference on Computer Vision and Pattern Recognition, Seattle, WA, USA, 13–19 June 2020; pp. 3186–3195. [Google Scholar]
  46. Luo, H.; Jiang, W.; Gu, Y.; Liu, F.; Liao, X.; Lai, S.; Gu, J. A strong baseline and batch normalization neck for deep person re-identification. IEEE Trans. Multimed. 2019, 22, 2597–2609. [Google Scholar] [CrossRef]
  47. Fu, Y.; Wei, Y.; Zhou, Y.; Shi, H.; Huang, G.; Wang, X.; Yao, Z.; Huang, T. Horizontal pyramid matching for person re-identification. In Proceedings of the Thirty-Third AAAI Conference on Artificial Intelligence, Honolulu, HI, USA, 27 January–1 February 2019; pp. 8295–8302. [Google Scholar]
  48. Zheng, F.; Deng, C.; Sun, X.; Jiang, X.; Guo, X.; Yu, Z.; Huang, F.; Ji, R. Pyramidal person re-identification via multi-loss dynamic training. In Proceedings of the IEEE/CVF Conference on Computer Vision and Pattern Recognition, Long Beach, CA, USA, 15–20 June 2019; pp. 8514–8522. [Google Scholar]
  49. Selvaraju, R.R.; Cogswell, M.; Das, A.; Vedantam, R.; Parikh, D.; Batra, D. Grad-cam: Visual explanations from deep networks via gradient-based localization. In Proceedings of the IEEE International Conference on Computer Vision, Venice, Italy, 22–29 October 2017; pp. 618–626. [Google Scholar]
  50. Ptflops. Available online: https://github.com/sovrasov/flops-counter.pytorch (accessed on 19 June 2022).
  51. Jetson TX2 Module. Available online: https://developer.nvidia.com/embedded/jetson-tx2 (accessed on 29 April 2022).
  52. Ma, N.; Zhang, X.; Zheng, H.-T.; Sun, J. Shufflenet v2: Practical guidelines for efficient CNN architecture design. In Proceedings of the European Conference on Computer Vision, Munich, Germany, 8–14 September 2018; pp. 116–131. [Google Scholar]
Publisher’s Note: MDPI stays neutral with regard to jurisdictional claims in published maps and institutional affiliations.

Article Metrics

Citations

Article Access Statistics

Multiple requests from the same IP address are counted as one view.