Article

Identification of Review Helpfulness Using Novel Textual and Language-Context Features

by
Muhammad Shehrayar Khan
1,
Atif Rizwan
2,
Muhammad Shahzad Faisal
1,
Tahir Ahmad
1,
Muhammad Saleem Khan
1 and
Ghada Atteia
3,*
1
Department of Computer Science, COMSATS University Islamabad, Attock Campus, Islamabad 43600, Pakistan
2
Department of Computer Engineering, Jeju National University, Jeju-si 63243, Korea
3
Department of Information Technology, College of Computer and Information Sciences, Princess Nourah bint Abdulrahman University, P.O. Box 84428, Riyadh 11671, Saudi Arabia
*
Author to whom correspondence should be addressed.
Mathematics 2022, 10(18), 3260; https://doi.org/10.3390/math10183260
Submission received: 15 August 2022 / Revised: 2 September 2022 / Accepted: 5 September 2022 / Published: 7 September 2022

Abstract

:
With the increase in users of social media websites such as IMDb, a movie website, and the rise of publicly available data, opinion mining is more accessible than ever. In the research field of language understanding, categorization of movie reviews can be challenging because human language is complex, leading to scenarios where connotation words exist. Connotation words have a different meaning than their literal meanings. While representing a word, the context in which the word is used changes the semantics of words. In this research work, categorizing movie reviews with good F-Measure scores has been investigated with Word2Vec and three different aspects of proposed features have been inspected. First, psychological features are extracted from reviews positive emotion, negative emotion, anger, sadness, clout (confidence level) and dictionary words. Second, readablility features are extracted; the Automated Readability Index (ARI), the Coleman Liau Index (CLI) and Word Count (WC) are calculated to measure the review’s understandability score and their impact on review classification performance is measured. Lastly, linguistic features are also extracted from reviews adjectives and adverbs. The Word2Vec model is trained on collecting 50,000 reviews related to movies. A self-trained Word2Vec model is used for the contextualized embedding of words into vectors with 50, 100, 150 and 300 dimensions.The pretrained Word2Vec model converts words into vectors with 150 and 300 dimensions. Traditional and advanced machine-learning (ML) algorithms are applied and evaluated according to performance measures: accuracy, precision, recall and F-Measure. The results indicate Support Vector Machine (SVM) using self-trained Word2Vec achieved 86% F-Measure and using psychological, linguistic and readability features with concatenation of Word2Vec features SVM achieved 87.93% F-Measure.

1. Introduction

Sentiment analysis is also known as opinion mining. The Natural Language Processing (NLP) technique is used to identify the sentiment polarity of textual data. It is one of the famous research areas in NLP topics. People’s attitudes and thoughts about any movie, events or issue are analyzed with sentiment analysis of reviews. Sentiment analysis of reviews classifies the review as having a positive or negative polarity that helps the user decide about a product or any movie. While large volumes of opinion data can provide an in-depth understanding of overall sentiment, they require a lot of time to process. Not only is it time-consuming and challenging to review large quantities of texts, but some texts might also be long and complex, expressing reasoning for different sentiments, making it challenging to understand overall sentiment quickly once a new kind of communication has been started between a customer and a service provider. People share their opinion about services through websites. Usually, online products have thousands of reviews, and it is very difficult for the customers to read every review. Excessive and improper use of sentiment in reviews makes them unclear concerning a product and it becomes difficult for customers to make the right decision. This entailed a Few-Shot Learner novel approach applied for NLP tasks, including review sentiments, but focusing less on the impact of influential textual features [1]. In this scenario, sentiment-based review classification is a challenging research problem. Sentiment analysis is a hot topic due to its applications: quality improvement in products or services, recommendation systems, decision making and marketing research [2]. The major contributions in the research are as follows:
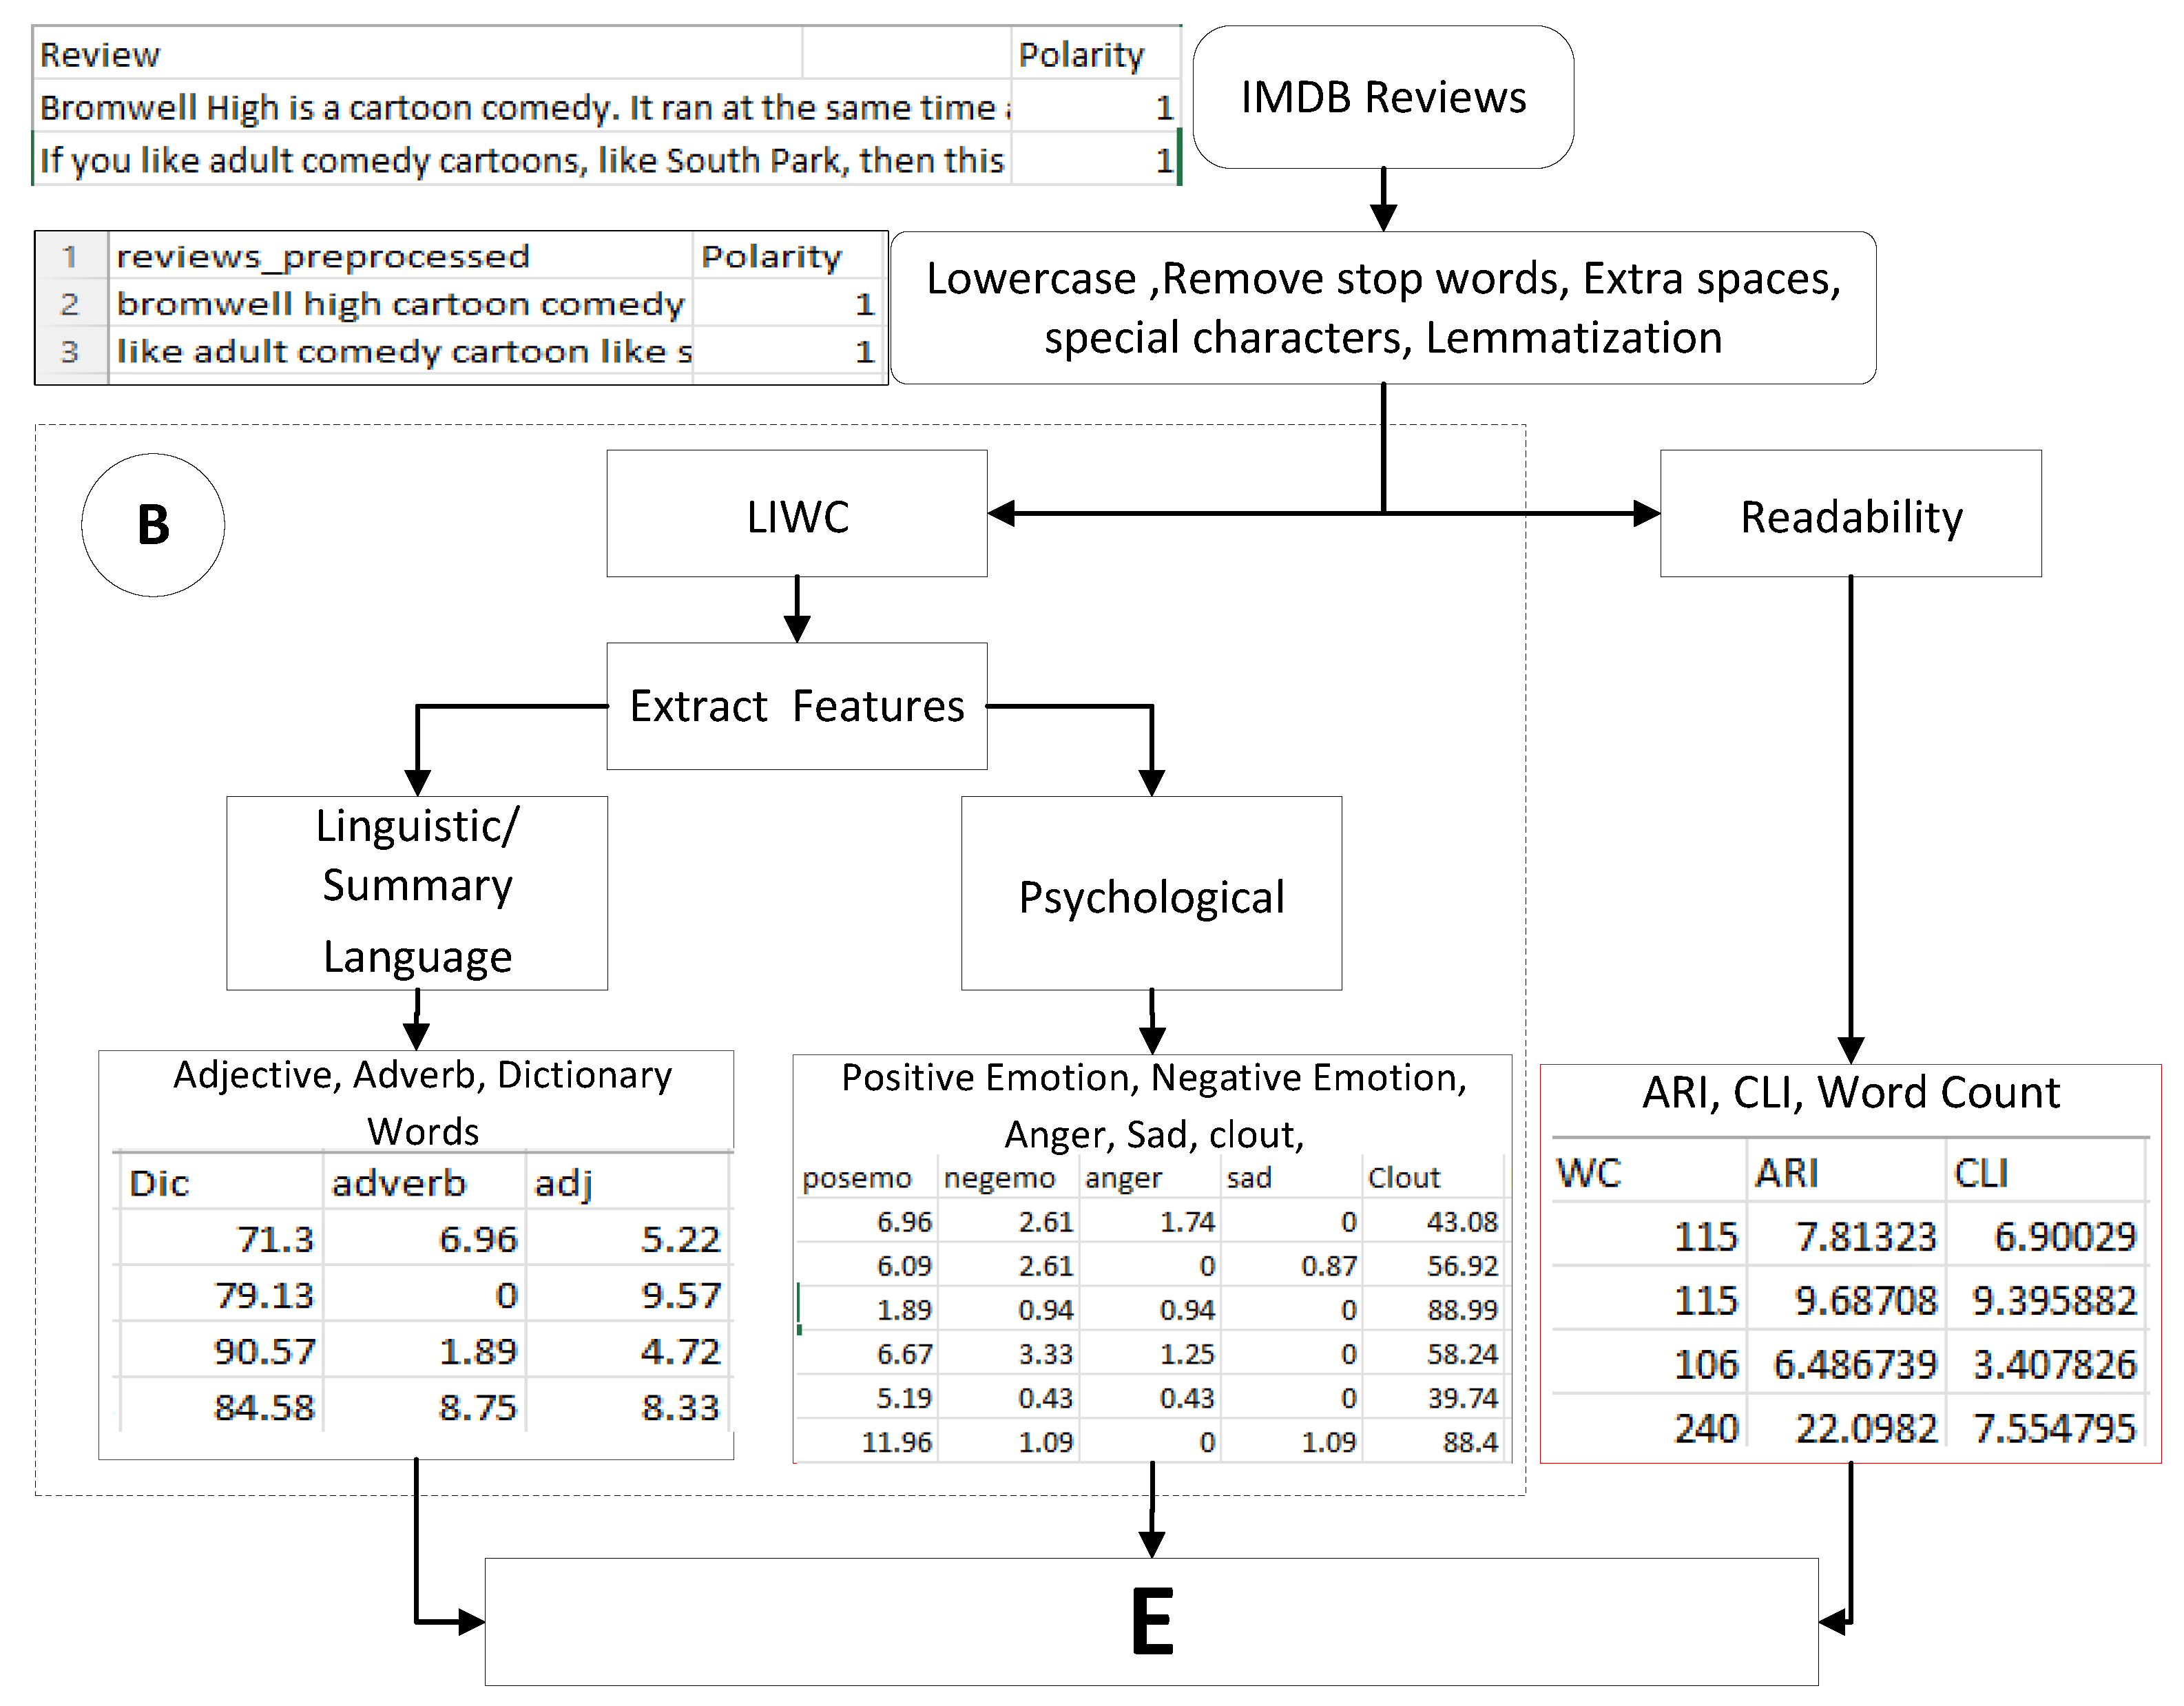
  • The proposed psychological features are positive emotion, negative emotion, anger, sadness, clout (confidence level) and dictionary words.
  • The readability features extracted according to Automated Readability Index (ARI), Coleman Liau Index (CLI) and Word Count (WC) are calculated to measure the review’s understandability score.
  • The linguistic features extracted are adjectives and adverbs.
  • The psychological, readability and linguistic features are concatenated with Word2Vec features to train the machine-learning models.
Different methods have been used to investigate data and convert raw data into valuable data. One of the applications of computing is NLP [3,4]. Many advanced algorithms and novel approaches have improved sentiment classification performance, but more productive results can be achieved if helpful textual reviews are used for sentiment classification. New features are adverbs and adjectives in terms of sentiment classification [5,6], describing the author’s sentiments. The clout feature defines the confidence of the review written by the author. The review length feature determines the information that a review has and the readability feature defines how much information can be understood or absorbed by the user. The readability feature also determines the complexity of any review for the user.
Most reviews are short in length, representing opinions about products or movies. However, a review given by a user has an important role in the promotion of a movie [7]. Most people generally search for information about a movie on famous websites such as IMDb, a collection of thousands of movies that stores data about a movie’s crew, reviews by different users, cast and ratings. Hence, surely it is not the only way to bring people to cinemas. In this regard, reviews also have an important role.
Sentiment analysis makes opinion summary in movie reviews easier by extracting sentiment given in the review by the reviewer [8]. Sentiment analysis of movie reviews normally includes preprocessing [9] and the feature-extraction method with appropriate selection [10], classification and evaluation of results. Preprocessing includes converting all the capitalized words into lower-case words due to case sensitivity, stopping word removal and removing special characters that are preprocessed for classification. Different feature-extraction methods are used to extract features from the review of a movie or product [11]. Most feature-extraction methods are related to lexicon and statistical-based approaches. In statistical feature-extraction methods, the multiple words that exist in reviews represent a feature by measuring the different weighing calculations like Inverse Document Frequency (IDF), Term Frequency (TF) and Term Frequency–Inverse Document Frequency (TF-IDF) [12,13]. In the feature- extraction method lexicon, the extraction of textual features from the pattern derived among the words is derived from the parts of speech of words tag [14]. The method based on lexicon extracts the semantics from the review by focusing on text ordering in sentiment analysis, short text and keyword classification. The emotions using short text are written on social networking sites which have become popular. Emotions used in the review on social networking sites include anxiety, happiness, fear, etc.
Sentiment analysis of the IMDb movie review website finds the general perspective of review for emotions exhibited by a reviewer concerning a movie. Most researchers are working on differentiating positive and negative reviews. In the proposed work, a contextualized word-embedding technique is used Word2Vec. It is trained on fifty thousand reviews given by IMDb movie users. The qualitative features extracted using Word2Vec that involves pretraining and the quantitative features are extracted from LIWC without pretraining. Experiments on vector features with different dimensions using the Skip-Gram Method are performed and LIWC extracts the quantitative linguistic features and psychological features. The psychological features include positive emotion, negative emotion, anger, sadness and clout, which measure confidence level from the reviews. The readability features include ARI, CLI and WC. Linguistic features include adjectives and adverbs.
The statistical and lexicon-based methods extract features to increase the model’s accuracy. When the features are extracted from the reviews, different feature selection techniques are applied to the features that help extract helpful features and eliminate the features that do not contribute to the effectiveness of the classification of sentiment analysis of reviews [15,16]. The classification of sentiments of reviews defines the polarity of reviews and classifies them as positive or negative. ML and lexical-based methods were used for sentiment analysis. ML methods have achieved high performance in academia as well as in industry. It is a fact that ML algorithms make the classification performance able to achieve high performance, but data quality is important as well. Data quality can limit the performance of any ML algorithm regardless of how much data are used to train the model of the ML classifiers [17].

2. Related Work

There are two types of user reviews: high-quality and low-quality. A high-quality review helps to participate in decision making, while a low-quality one reduces helpfulness concerning serving users. That is the reason it is necessary to consider the quality of reviews for large data analysis.
To identify the quality of reviews, many researchers consider high-quality reviews and their helpfulness. Ordinal Logistic Regression (OLR) is applied to application reviews from Amazon and Google Play with the feature of review length [18]. The Tobit regression analysis model has been applied to the dataset of TripAdvisor and Amazon book reviews using features of review length and word count [19]. The IMDb movie review dataset is selected for this research and serves as the dataset for sentiment classification. Multiple textual features are extracted using the Word2Vec model trained on reviews and LIWC in this research helps to improve the classification performance of reviews.
The performance of sentiment analysis has been improved gradually with time by focusing on advanced ML algorithms, novel approaches and DL algorithms. Details are given in brief in Table 1, describing the number of papers that achieved the best performance concerning review sentiments using advanced approaches.
The DL algorithm CNN-BLSTM was applied to the dataset of IMDb reviews and compared with experiments on single CNN and BLSTM performance. In the dataset, words were converted into vectors and passed to the DL model [20]. Linear discriminant analysis on Naive Bayes (NB) was implemented and achieved less accuracy 75.2 using only the feature of sentiwords [21].
The Maximum Entropy algorithm was applied to the movie review dataset and features extracted by the hybrid feature-extraction method and achieved the highest accuracy 83.9% compared to K Nearest Neighbor (KNN) and Naive Bayes (NB). The features used are just lexicon features: positive word count and negative word count [22]. The highest accuracy achieved for the IMDb dataset of online movie reviews was 89% because fewer data were used 250 movie reviews concerning text documents for training purposes and 100 movie reviews for testing purposes.
Heterogeneous features were extracted from the movie review to achieve the best performance for Naive Bayes [23]. There are also some other Amazon datasets publicly available with many non-textual features. Furthermore, many researchers have also worked on an Amazon dataset, analysing reviews using non-textual features, which include product features, user features and ratings [27,28]. The above literature concludes that to improve the performance of the model features, the size of the dataset plays a more important role; only the use of an efficient algorithm is not sufficient to improve the performance of the model.
In this experimentation dataset of 5331 positive and 5331 negative processed snippets or sentences, the sentences are labelled according to their polarity. The total number of sentences used for training purposes is 9595 sentences or snippets and 1067 sentences are used to test the model. First, the pretrained Word2Vec is used for feature extraction and then Convolutional Neural Network (CNN) is applied to these features extracted from Word2Vec. The Google News dataset contains 3 million words on which Word2Vec is trained to achieve the embedding of words into vectors. Testing accuracy is achieved on the test dataset and is 82.19% [24].
In this paper, three datasets are used; the first dataset consists of 50 thousand reviews 25 thousand are positive, and 25 thousand are negative. The data are already separated in the form of training and testing reviews in which the ratio of positive and negative numbers of reviews is the same. The first drawback of this experimentation is that the dataset is not selected for training and testing of randomized models, which bringsbias to this paper. The second dataset used in the experiments is 200 movies, each having ten categories in Douban Movies. The rating of movies was from 0 to 5. A movie rating of 1 to 2 was considered a negative review and a 3 to 5 movie rating is considered a positive review of the movie. The comments that had a rating of 3 were ignored. So, there were 6000 used as training and the other 6000 were used to test the dataset. The total number of comments achieved after removing neutral reviews was 12,000. The second drawback is that in this paper, the ratio is 50:50 and most of the references show that 80:20 or 70:30 is the best ratio for splitting the dataset. For evaluating the classification performance, three classifiers are used for sentiment classification. One is NB, an extreme learning machine and LSTM is conducted before that dataset is passed through Word2Vec for word embedding. The word vectors were sent to LSTM for classification and the results show that LSTM performed better than other classifiers. The LSTM F-Measure was 84.7% [25]. The last reference mentioned in Table 1, shows that the accuracy achieved by NN is 86% using lexicon features. This also applies to neural networks. In the IMDb dataset of movie reviews used in this research, reviews are normalized using the following steps: All the words of reviews are converted to lower case from upper case words or characters. Secondly, numbers are removed, special characters, punctuational marks and other diacritics are removed. White spaces included in the review were also removed. Finally, abbreviations are expanded and stop words in reviews are also removed. All the processing of reviews involved in the referred paper is described above [26].

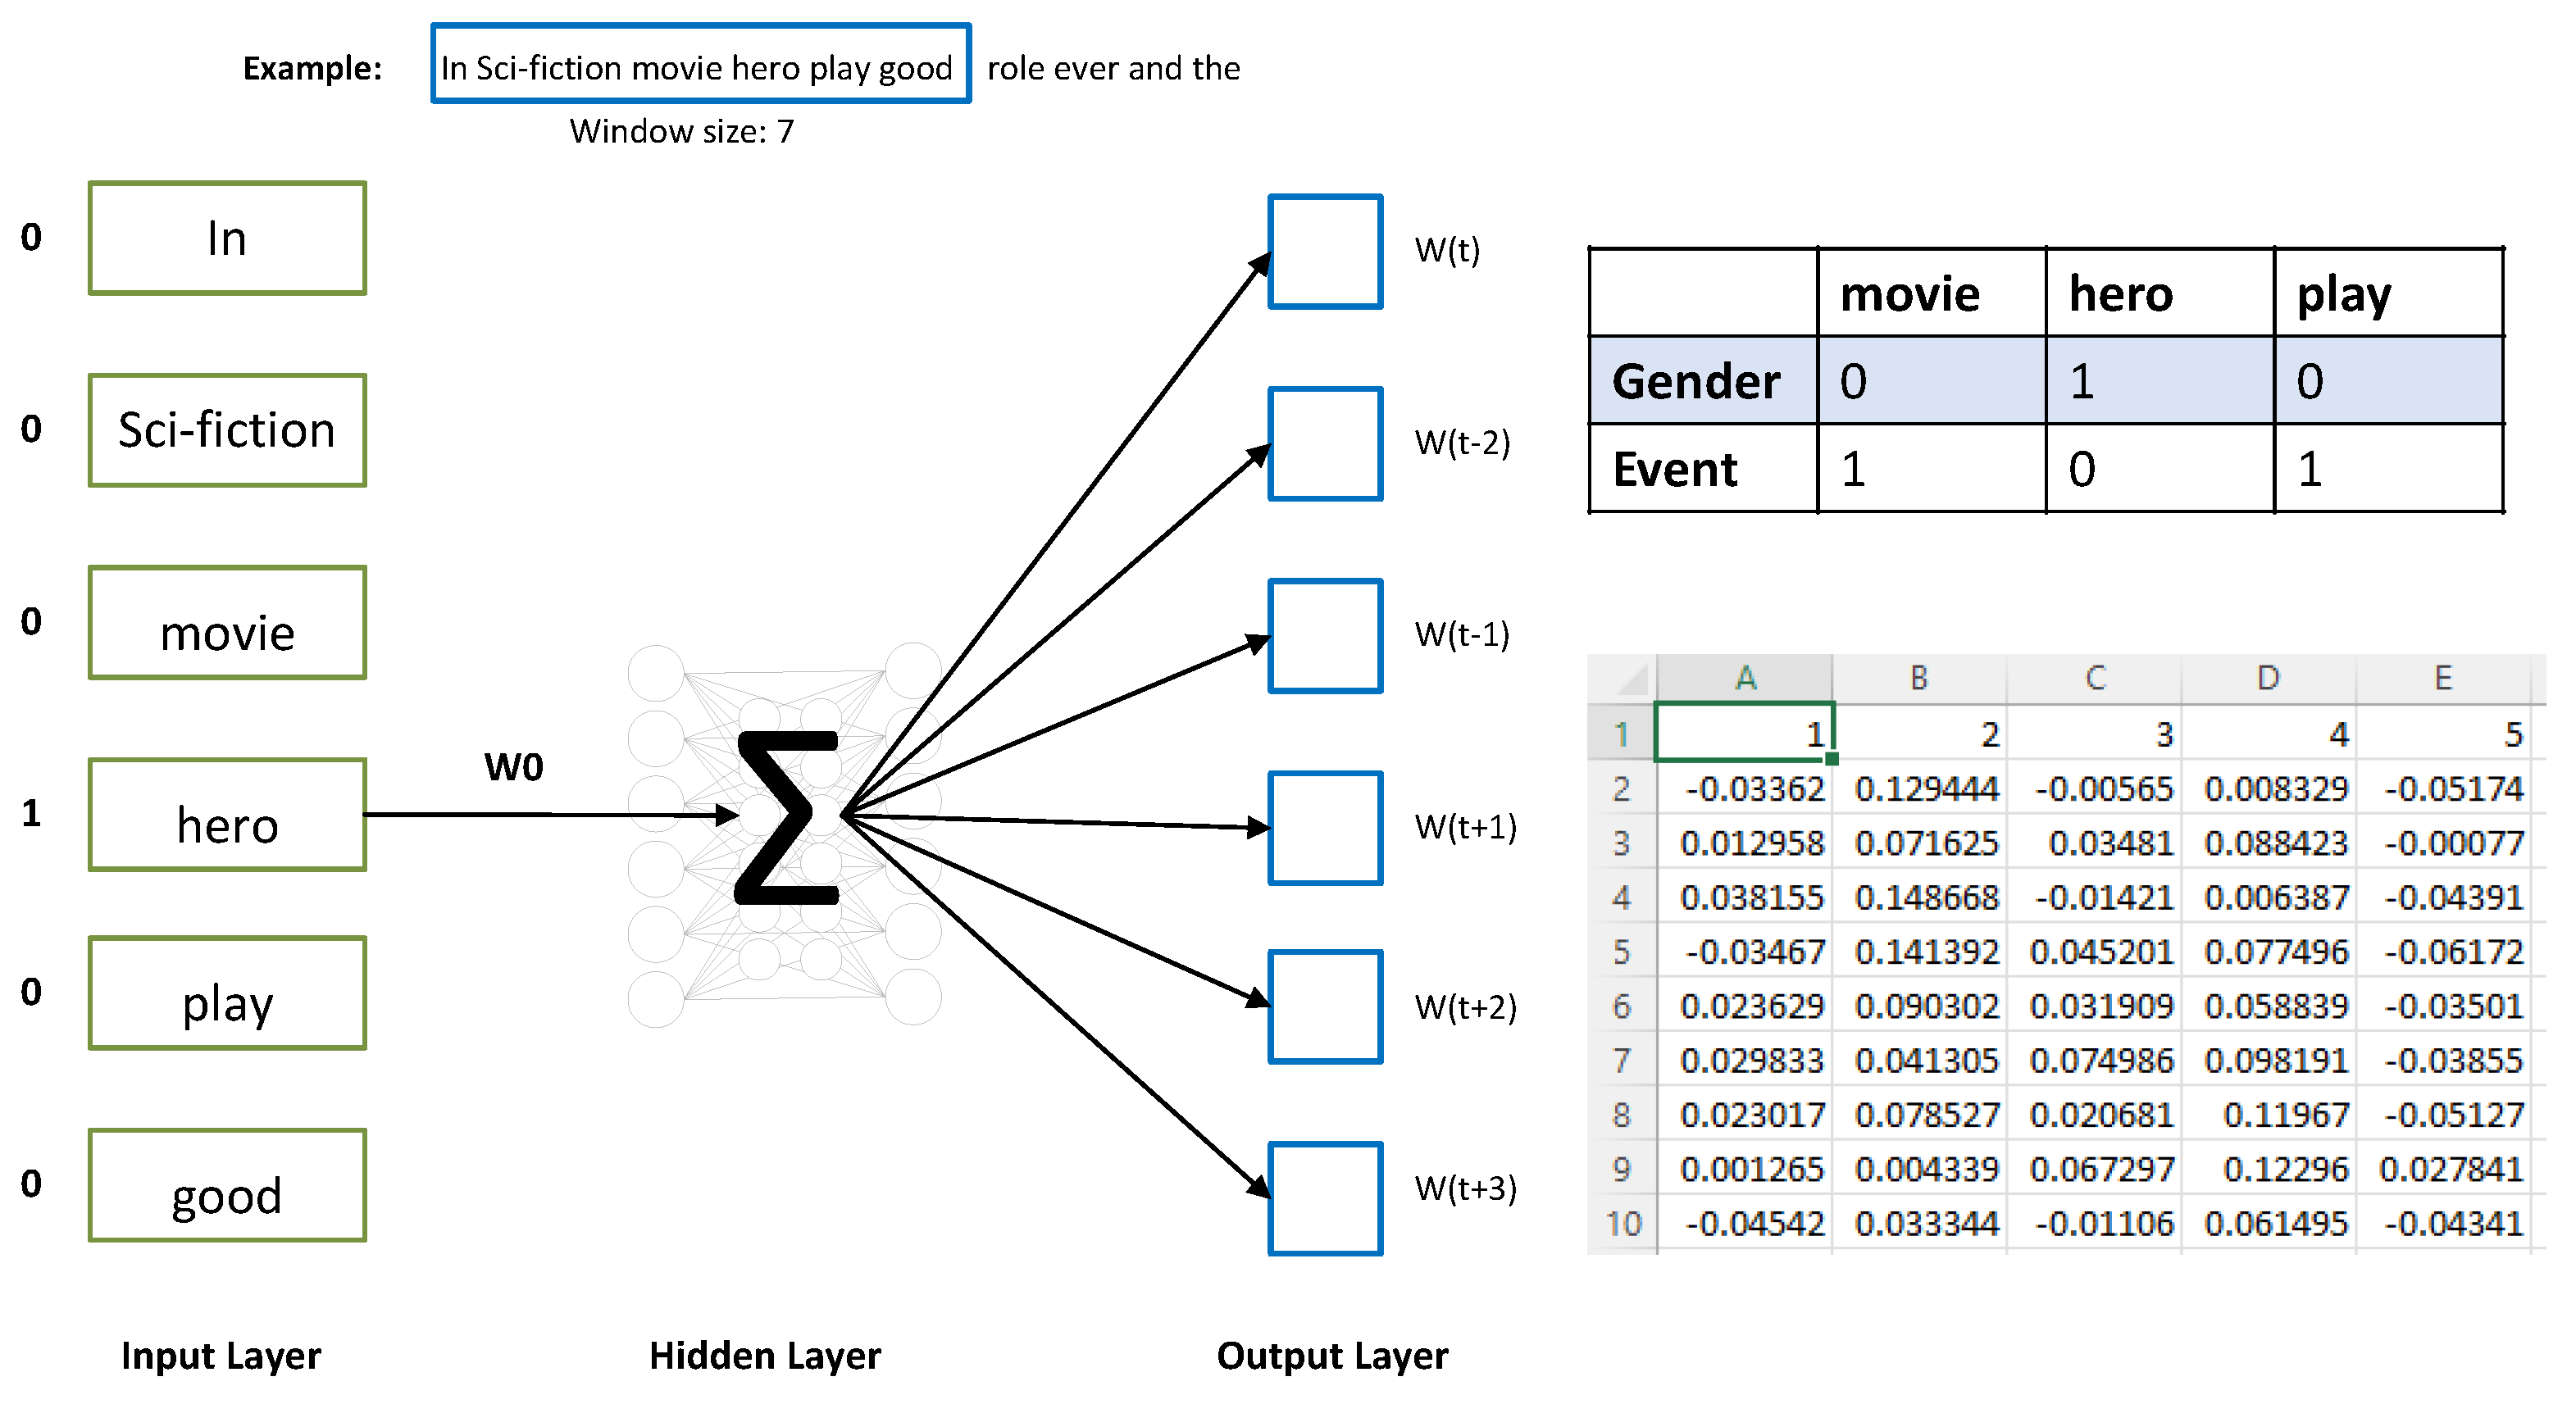
Word Embedding Using the Word2Vec Approach

While representing a word, the context in which the word is used matters a lot because it changes the semantics of words. For example, consider the word ’bank’. One meaning of the word bank is a financial place, and another is land alongside water. If the word ’bank’ is used in a sentence with words such as treasury, government, interest rates, money, etc., we can understand by its context words its actual meaning. In contrast, if the context words are water, river, etc., the actual meaning in this case of context word is land. One of the emerging and best techniques we know for word embedding is used in many fields such NLP, biosciences, image processing, etc., to denote text using different models. The results using word embedding are shown in Table 2 below.
Word embedding is most important and efficient nowadays in terms of representing a text in vectors without losing its semantics. Word2Vec can capture the context of a word, semantic and syntactic similarity, relation with other words, etc. Word2Vec was presented by Tomas Mikolov in 2013 at Google [35]. Word2Vec shows words in a vector space. The words in the review are represented in the form of vectors and placement is carried out so that dissimilar words are located far away and similar meaning words appear together in vector space.

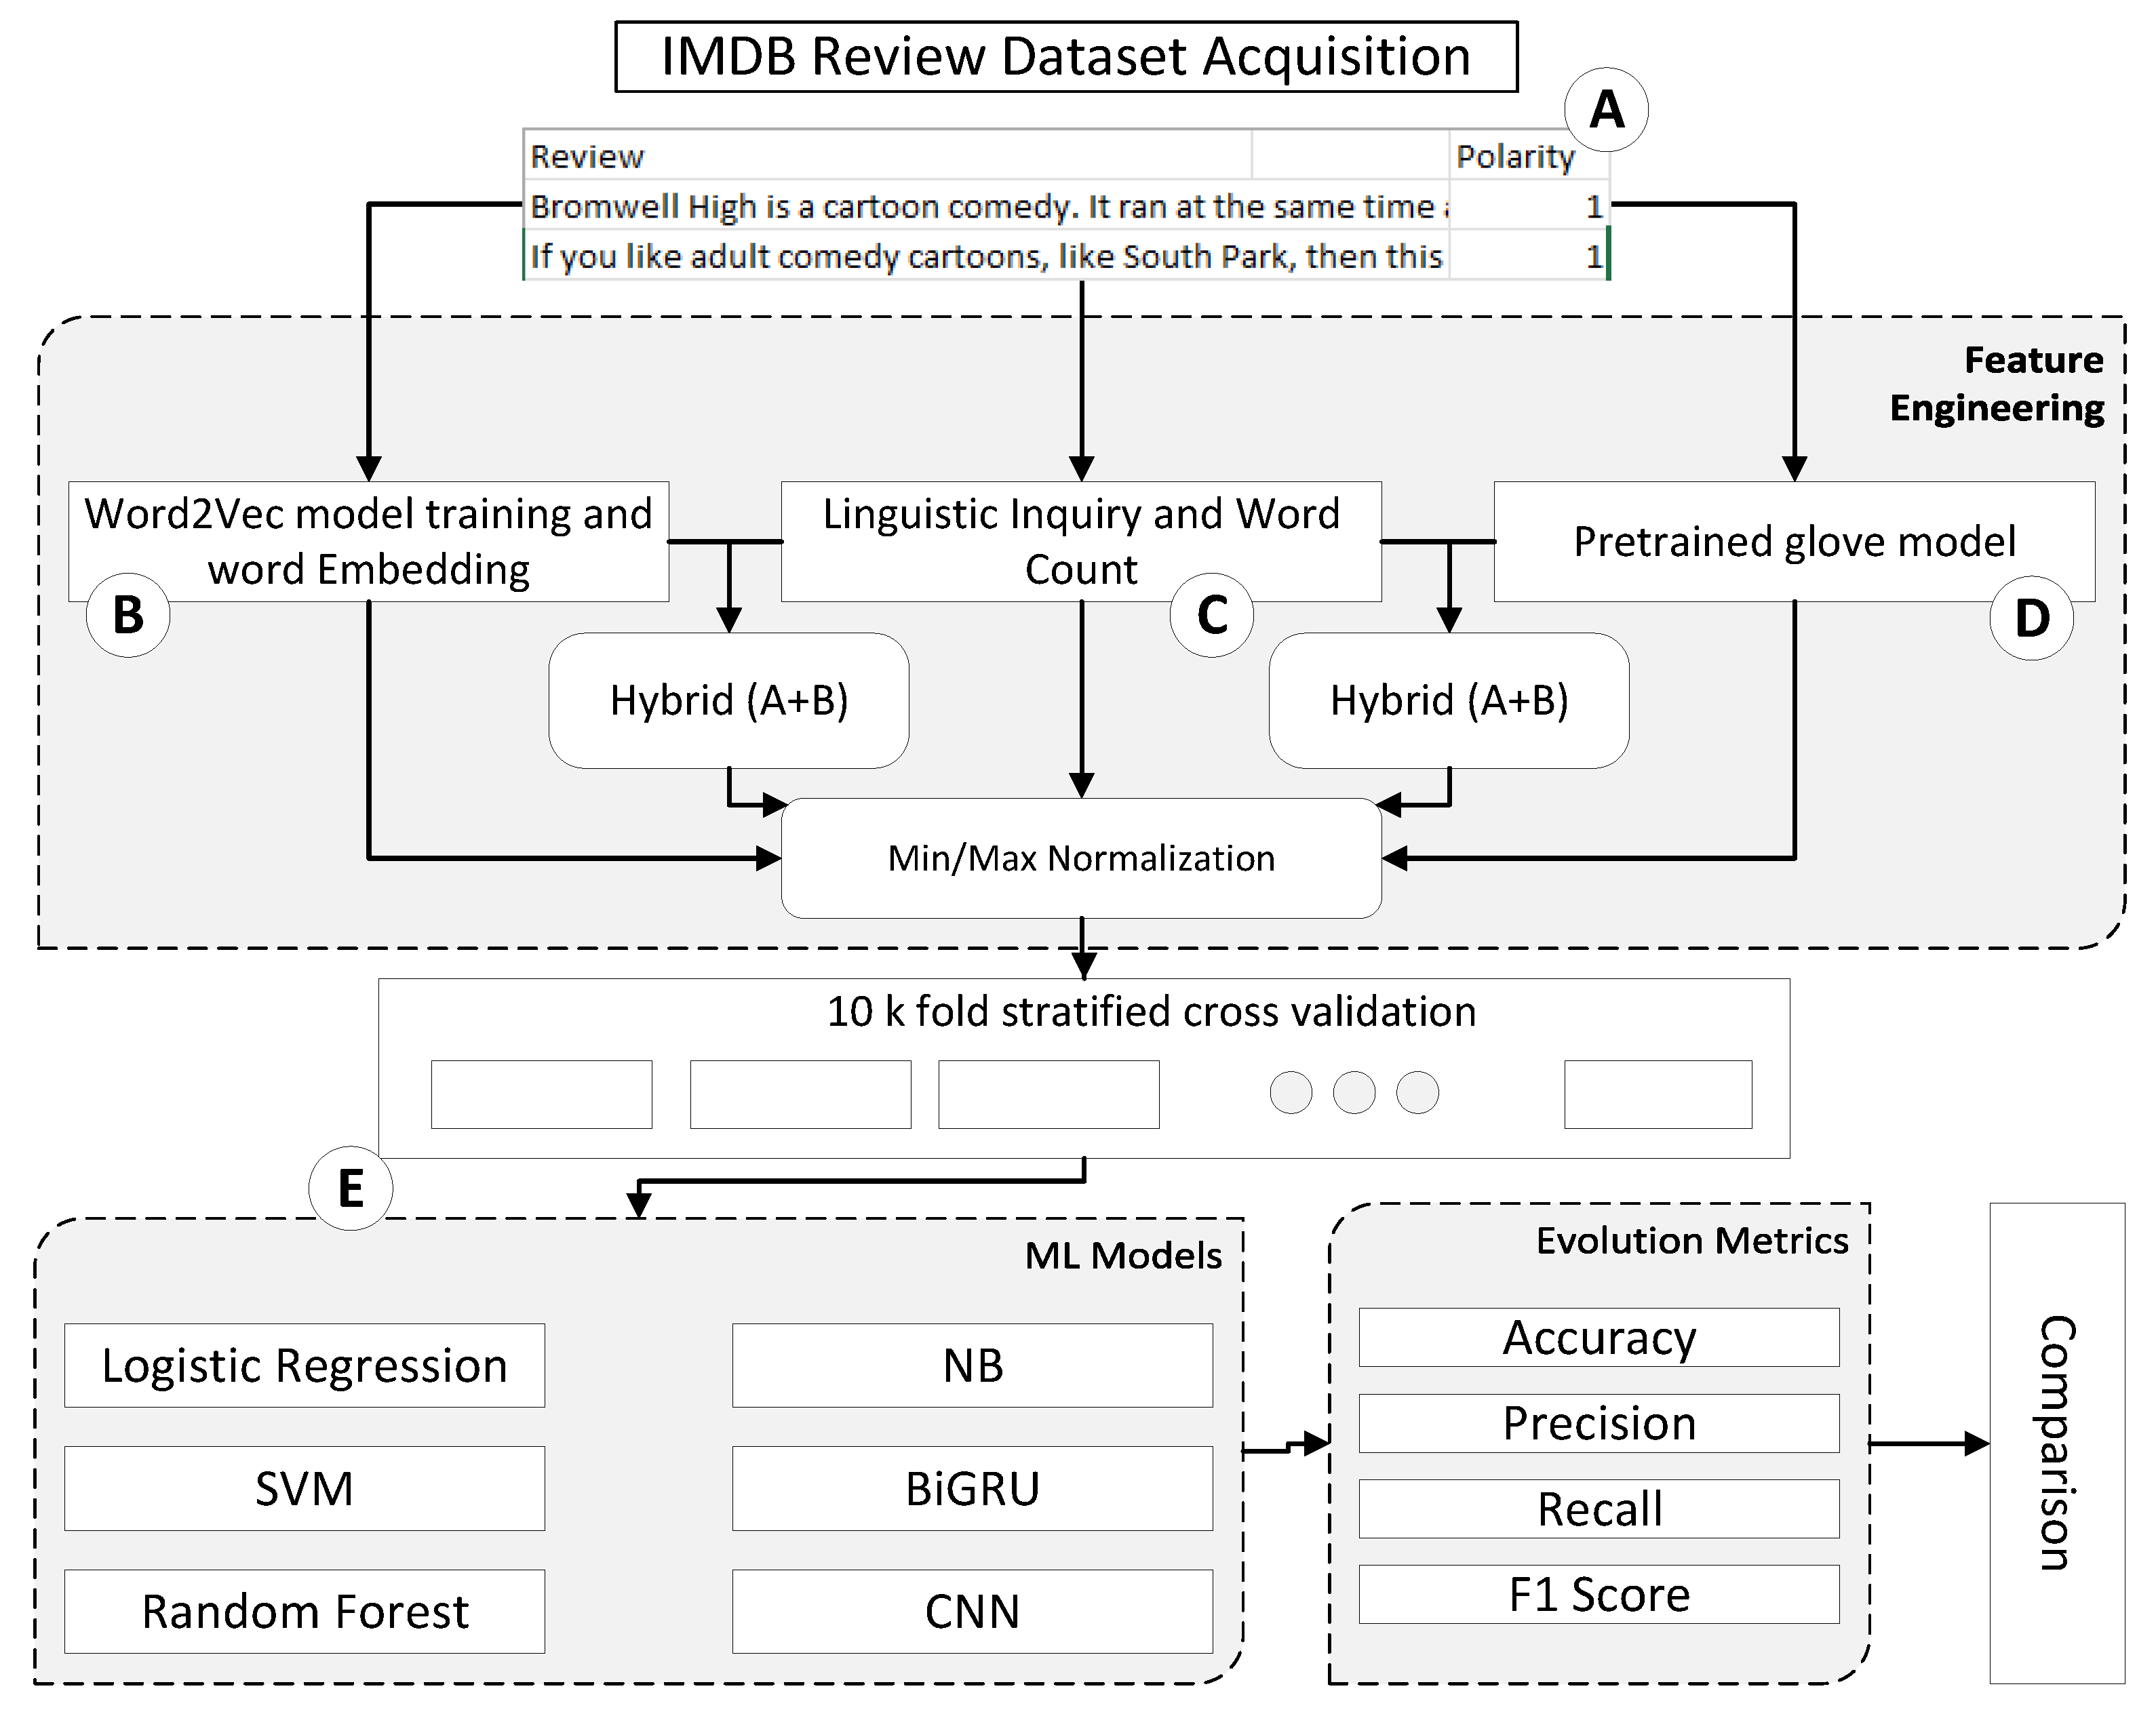
3. Proposed Methodology

The proposed methodology, the environment of hardware and software was set as needed to perform experiments. The hp laptop core i5 4th generation having 8 GB RAM is used for experimentation. The Google Colab software is used and is the Integrated Development Environment for the Python language in which we peformed our experiments. All the latest libraries of Python are used for experiments. The research methodology consisted of four steps. The steps are dataset acquisition, feature engineering, models and evaluation, shown in Figure 1 below. Figure 1 defines that after preprocessing of data acquisition from the IMDb movie review website, it is passed for feature engineering, which consists of three blocks B, C and D. B, C and D blocks are used independently as well as in hybrid; B and C, and B and D blocks are named Hybrid-1 and Hybrid-2, respectively. Block E consists of 10-fold cross-validation, training and testing of different ML models and the last one is the evaluation process of models. After extraction of features, each feature is normalized using the Min/Max Normalization technique. On the normalized feature, 10-fold cross-validation is applied to remove the bias. Machine-learning (ML) and deep-learning (DL) models are trained and tested; these are Support Vector Machine (SVM), Naive Bayes (NB), Random Forest (RF), Logistic Regression (LR), Multi-Layer Perceptron (MLP), Convolution Neural Network (CNN) and Bidirectional Gated Recurrent Unit (Bi-GRU). The results were achieved after implementing models on features and were then evaluated.

3.1. Dataset Acquisition

The benchmark of the movie review dataset from IMDb is collected and available publicly. The main dataset exists of 50,000 reviews with polarity levels. The ground rating is also available according to the 10-star rating from different customers. A review with a rating of less than 4 is a negative review, and a review with a score of more than seven is a positive review. All the reviews are equally pre-divided into 25,000 positive reviews and the other 25,000 negative. Each review is available in the text document. Fifty-thousand text documents containing reviews were downloaded.

3.1.1. Preprocessing for Feature Extraction

After downloading, each text document including reviews is preprocessed by using PYCHARM IDE. In two columns, all the reviews and their polarity are read and written in the Comma Separated Value (CSV) file. One column indicates the reviews and the second column indicates the polarity. Firstly, the reviews in sentences tokenized into words and then all the special characters, stop words and extra spaces are removed from the review using the NLP tool kit library available in Python. The preprocess reviews are written up in the preprocess column of the CSV file for future use.

3.1.2. Data Preprocessing Tool

For data preprocessing, we use the tool PYCHARM 2018 IDE and Python version 3.8.2. The Natural Language Tool Kit (NLTK) is used for text processing such as tokenization and stop word removal. Google Colab is used for implementing DL algorithms because it provides GPU and TPU for fast processing.

3.2. Feature Engineering

3.2.1. Feature Extraction Using LIWC

The LIWC consists of multiple dictionaries to analyze and extract the features. To extract psychological, textual and linguistic features from the movie review dataset, LIWC is used. First, the reviews are preprocessed and then used to extract features, as described in Figure 2. The diagram flow is defined as the preprocessed reviews passing sent to LIWC for extraction of the feature. LIWC compares each word of review from its dictionaries to check which category the given review word belongs to. It calculates the percentage by counting the number of words in the review that belong to a specific category and divides by the total number of reviews. The division result is multiplied by 100 to obtain a percentage as described in Equation (1).
x = C o u n t t h e n u m b e r o f w o r d s i n r e v i e w t h a t b e l o n g t o s p e c i f i c c a t e g o r y T o t a l n u m b e r o f w o r d s i n r e v i e w s × 100
x denotes the specific subcategory of features in LIWC. The features calculated by LIWC are positive emotion ( P E ) , negative emotion ( N E ) , anger ( A n g ) , sadness, clout, dictionary words ( D i c ) , adverbs ( A d v ) and adjectives ( A d j ) . P E , N E , A n g , S a d and C l o u t are categorized by L I W C as psychological features. D i c , A d v and A d j are categorized as linguistic features.
Figure 3 shows that after the extraction of features, Min/Max Normalization is applied and then passes through block E for further implementation, including 10-fold cross-validation, training of ML models, testing of ML models and last is evaluation.

3.2.2. Readability Feature Extraction

The readability score of reviews defines the effort required to understand the text of reviews. The three readability features are calculated on the preprocessed reviews: ARI, CLI and word count.
ARI is used for measuring the readability of English text and it is calculated by using the formula given in Equation (2).
A R I = 4.71 × C W + 0.5 × W S 21.43
where C represents characters that counts letters and numbers in review, W represents words and the number of spaces in review. S represents sentences that is the number of sentences in review.
C L I scores define how difficult text is to understand and it is calculated by using the formula given in Equation (3).
C L I = 0.0588 L 0.296 S 15.8
where L represents the average number of letters per 100 words and S represents the average number of sentences per 100 words to measure the understandability of a text.
Word count (WC) is calculated by linguistic inquiry word count which consists of multiple dictionaries and is calculated with Equation (4).
W o r d C o u n t = N a l l w o r d s N p u n c t u a t i o n N s t o p w o r d s N n o n a l p h a
where Nallwords represents the total number of words in the review text, Npunctuation represents the number of punctuation characters in the review text, Nstopwords represents the number of stop words in the review text and Nnonalpha represents the number of non-alphabetic terms in the review text.
After the extraction, each readability feature of Min/Max Normalization is applied, as described in the next section.

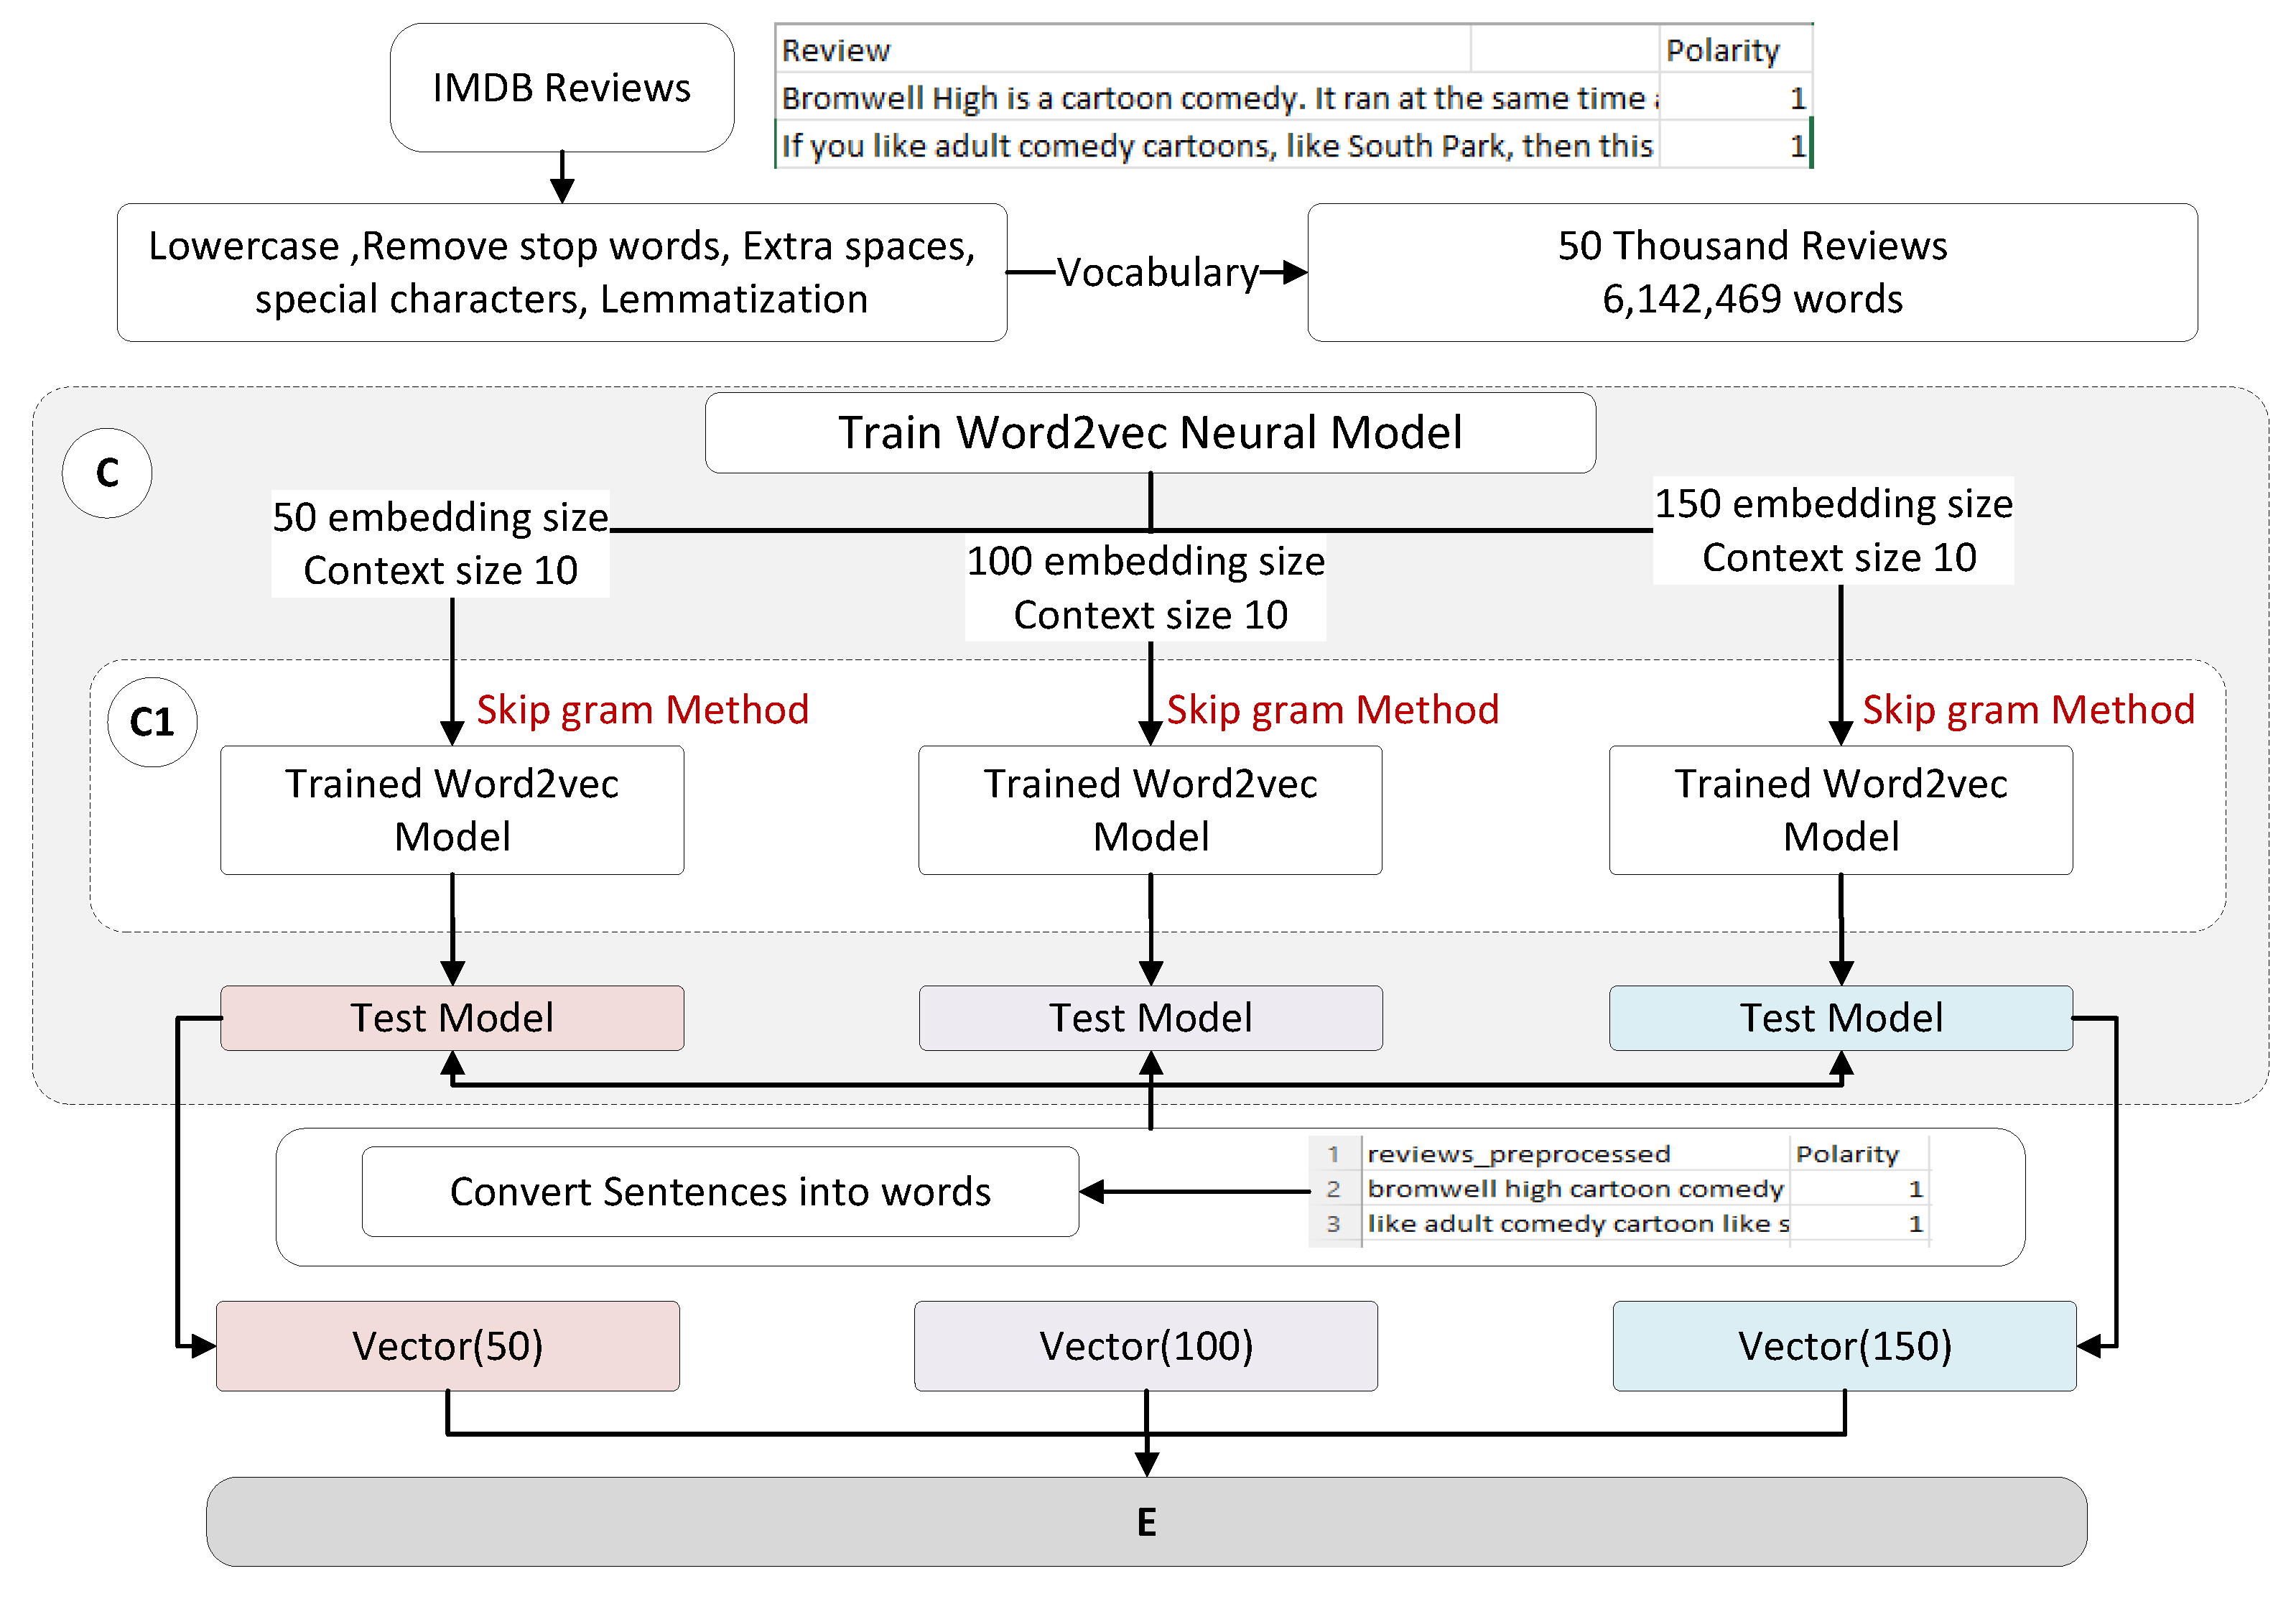
3.3. Word Embedding by Review-Based Training of Word2Vec Model

The features of movie reviews are extracted by training the Word2Vec neural model. The sequence of the feature-extraction process is given in Figure 4 below. Firstly, for training, the neural model of Word2Vec data is prepared using the dataset of IMDb movie reviews with 50 thousand reviews. The total number of words included in this dataset is 6 million.
Each review was used in the training of the Word2Vec neural model and three different embedding sizes were used in experiments, 50, 100 and 150, with a context size of 10. There are two methods for training the Word2Vec neural model; one is the COBOW context of the bag of words and the second one is the Skip-Gram Method. We used the Skip-Gram Method, which focuses on less frequent words and gives good results concerning word embeddings of less frequent words. Skip-Gram Method operations are given in Figure 3.
Figure 3 defines that the model is trained by defining the window size 10 and Skip-Gram computes word embedding. Instead of using context words as input to predict the center word like a context bag of words, it used the center word as input and predicts the center word’s context words. For example, “In Sci-fiction movie hero play good role” with context size 7. Training instances are created such as “In” is the target word which is the input and the context word “Sci-fiction movie hero play the good role” is the output word. The training instances are given in Table 3. Using training samples defined above in the table used for training the neural network, the result of word embedding is generated for each word given in the vocabulary. The trained model is saved and movie reviews pass to these models for converting words into vectors. Three different types of vectors having sizes of 50, 100 and 150 are created. For classification, Word2Vector features are used measured by Skip-Gram Method passed to block E.

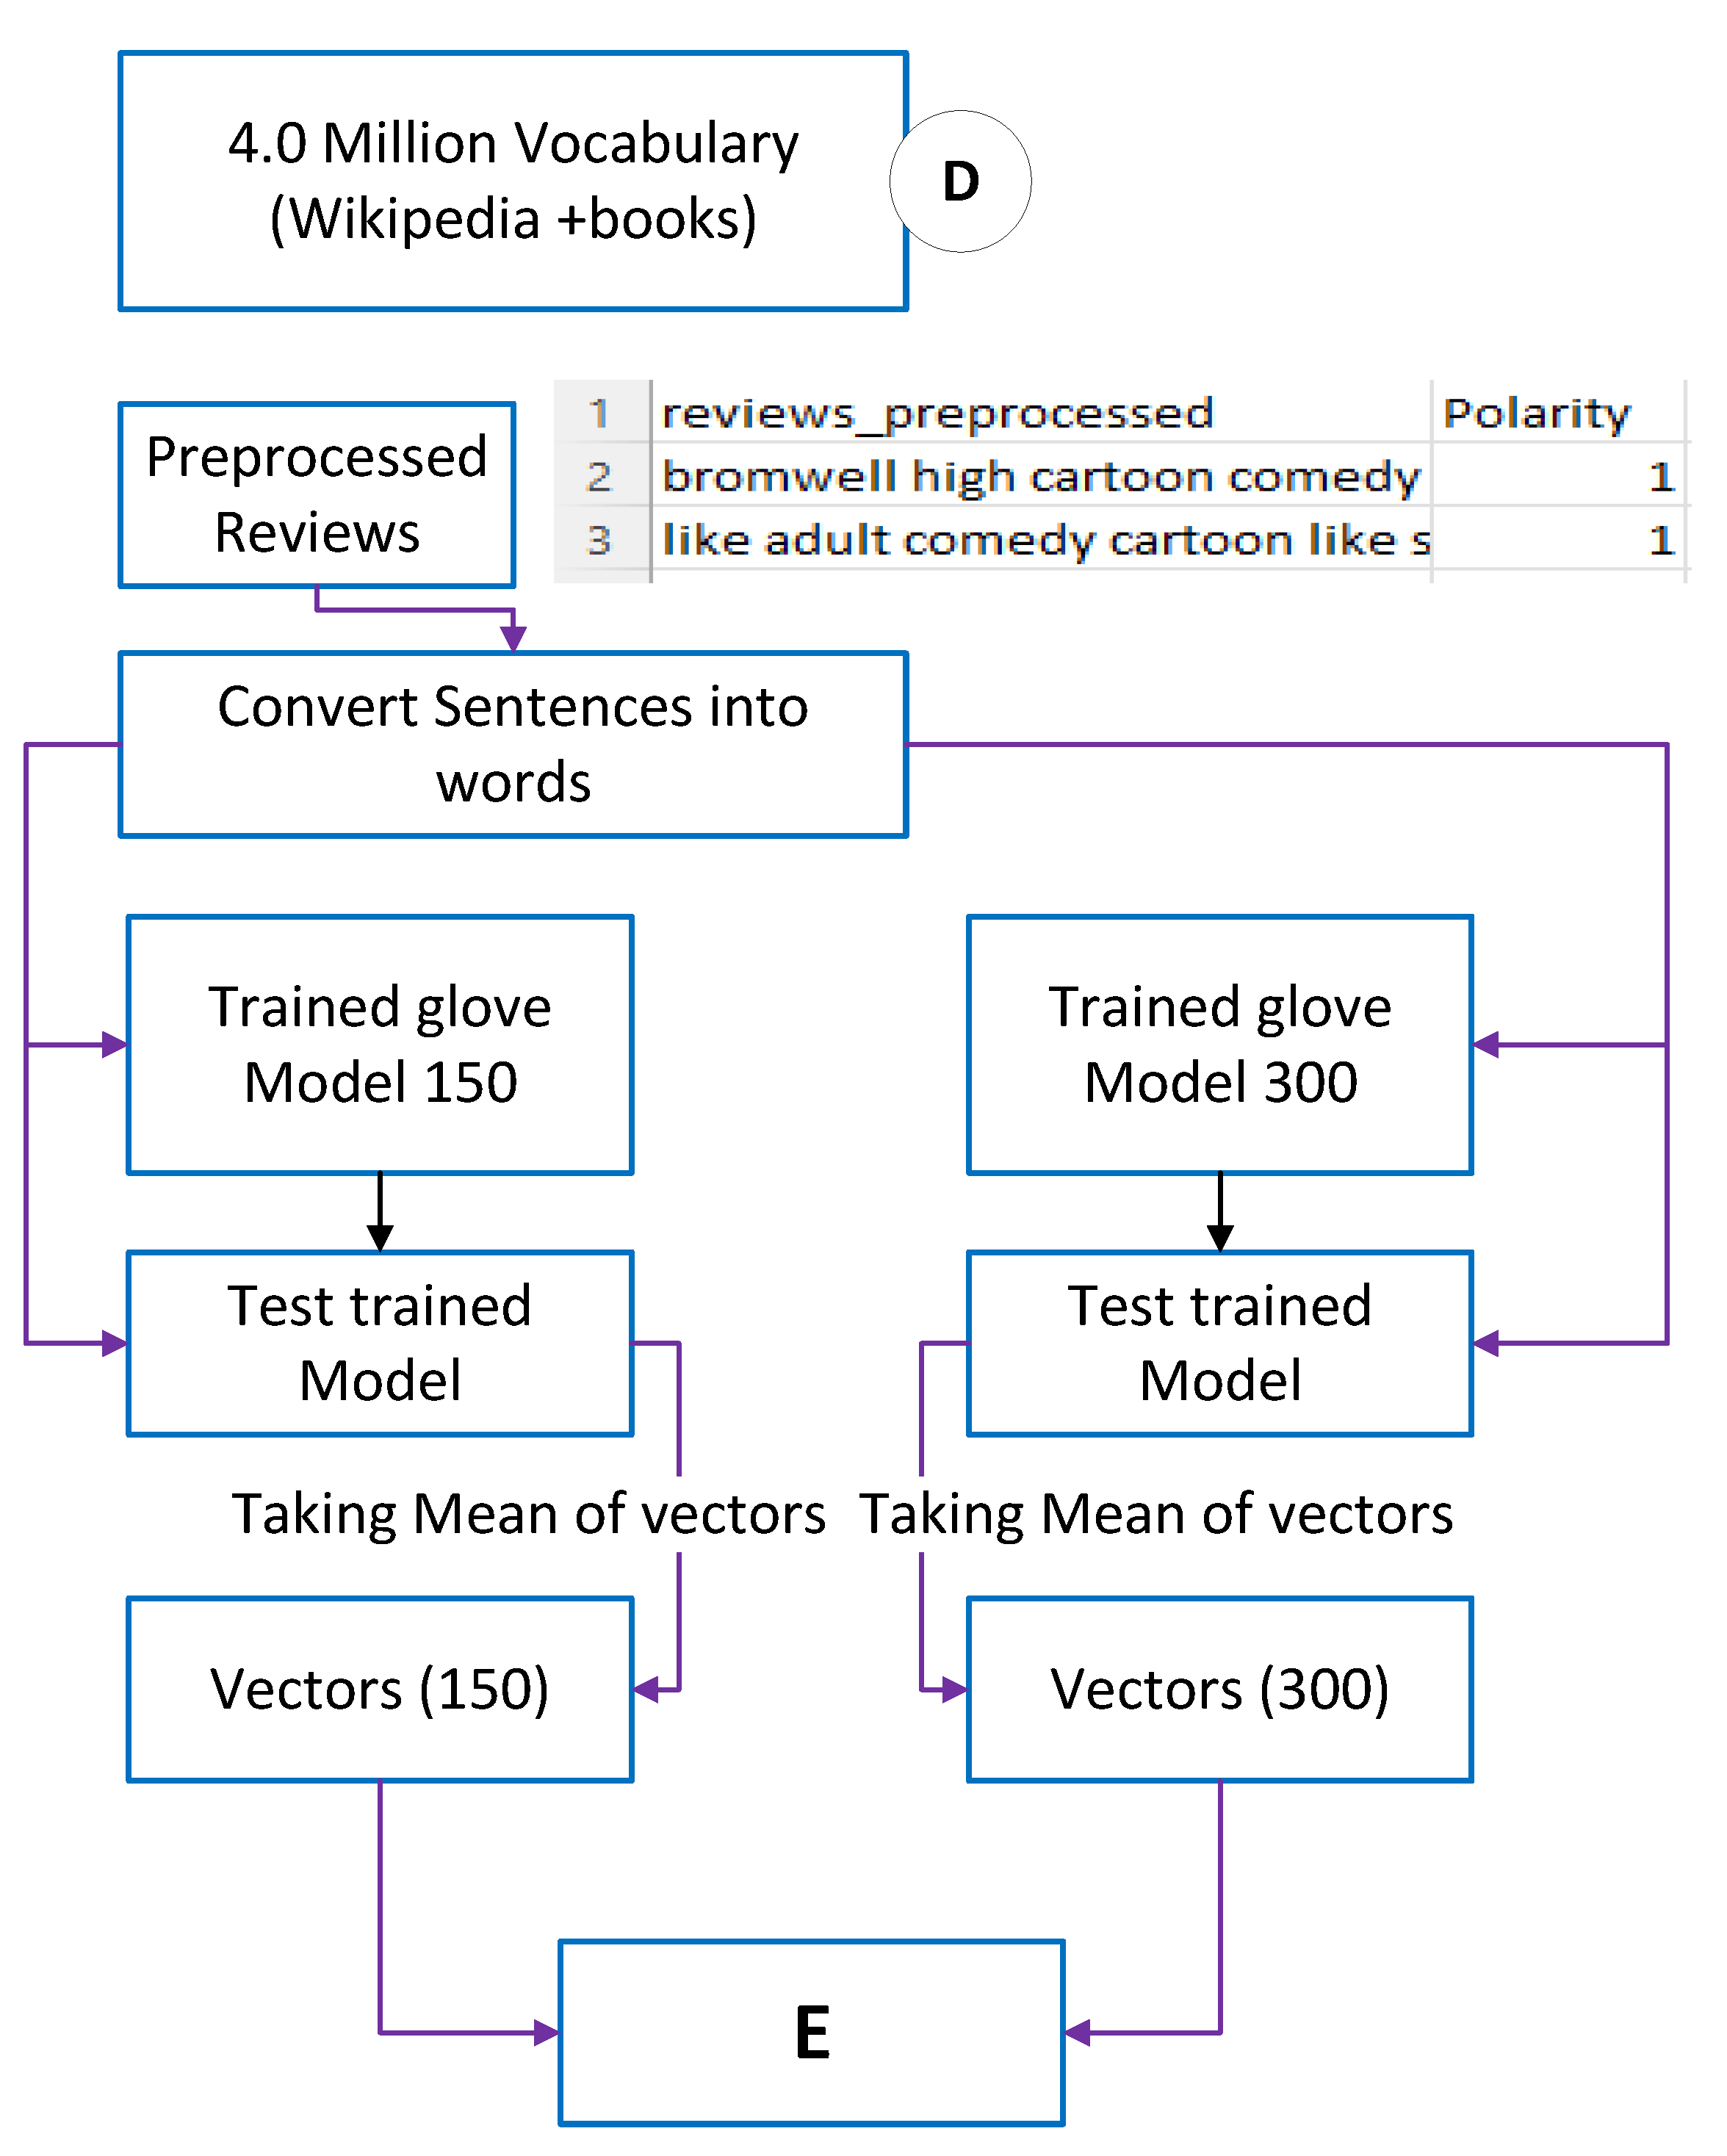
3.4. Word Embedding by Pretrained Word2Vec Model

The Glove Model is an unsupervised learning algorithm used for vector representation of words. Training samples are taken from Wikipedia and different books. The Glove Model uses a generalized kind of text on which it is trained. Figure 5 describes the steps for word embedding into vectors.
The first step is to download the Glove Model in the zip file with 150 vectors and 300 vectors. The pretrained Glove Model is loaded and passed for test on the preprocessed reviews. Each preprocess review consists of words and is passed to the test model as input and output are received as the vector of each review by taking the average of vectors. Each review vectors has 150 and 300 numbers in review vectors. The output of the vector is passed to the E block for further implementation, which includes 10-fold cross-validation, training ML models, testing ML models and evaluation.

4. Evaluation and Results

4.1. Dataset

The dataset selected for the experiment is IMDb movie reviews, consisting of 50,000 reviews of different movies with sentiment polarity. The reason for this dataset selection is that it is the largest number of reviews compared to the previously uploaded dataset of movie reviews on the website https://ai.stanford.edu/~amaas/data/sentiment/ (accessed on 4 April 2022). A total of 25,000 reviews are positive and the other 25,000 thousand reviews are negative. Each review is in the text file so in the zip file 50,000 text files are included with their rating value from 1 to 10 as text filename.

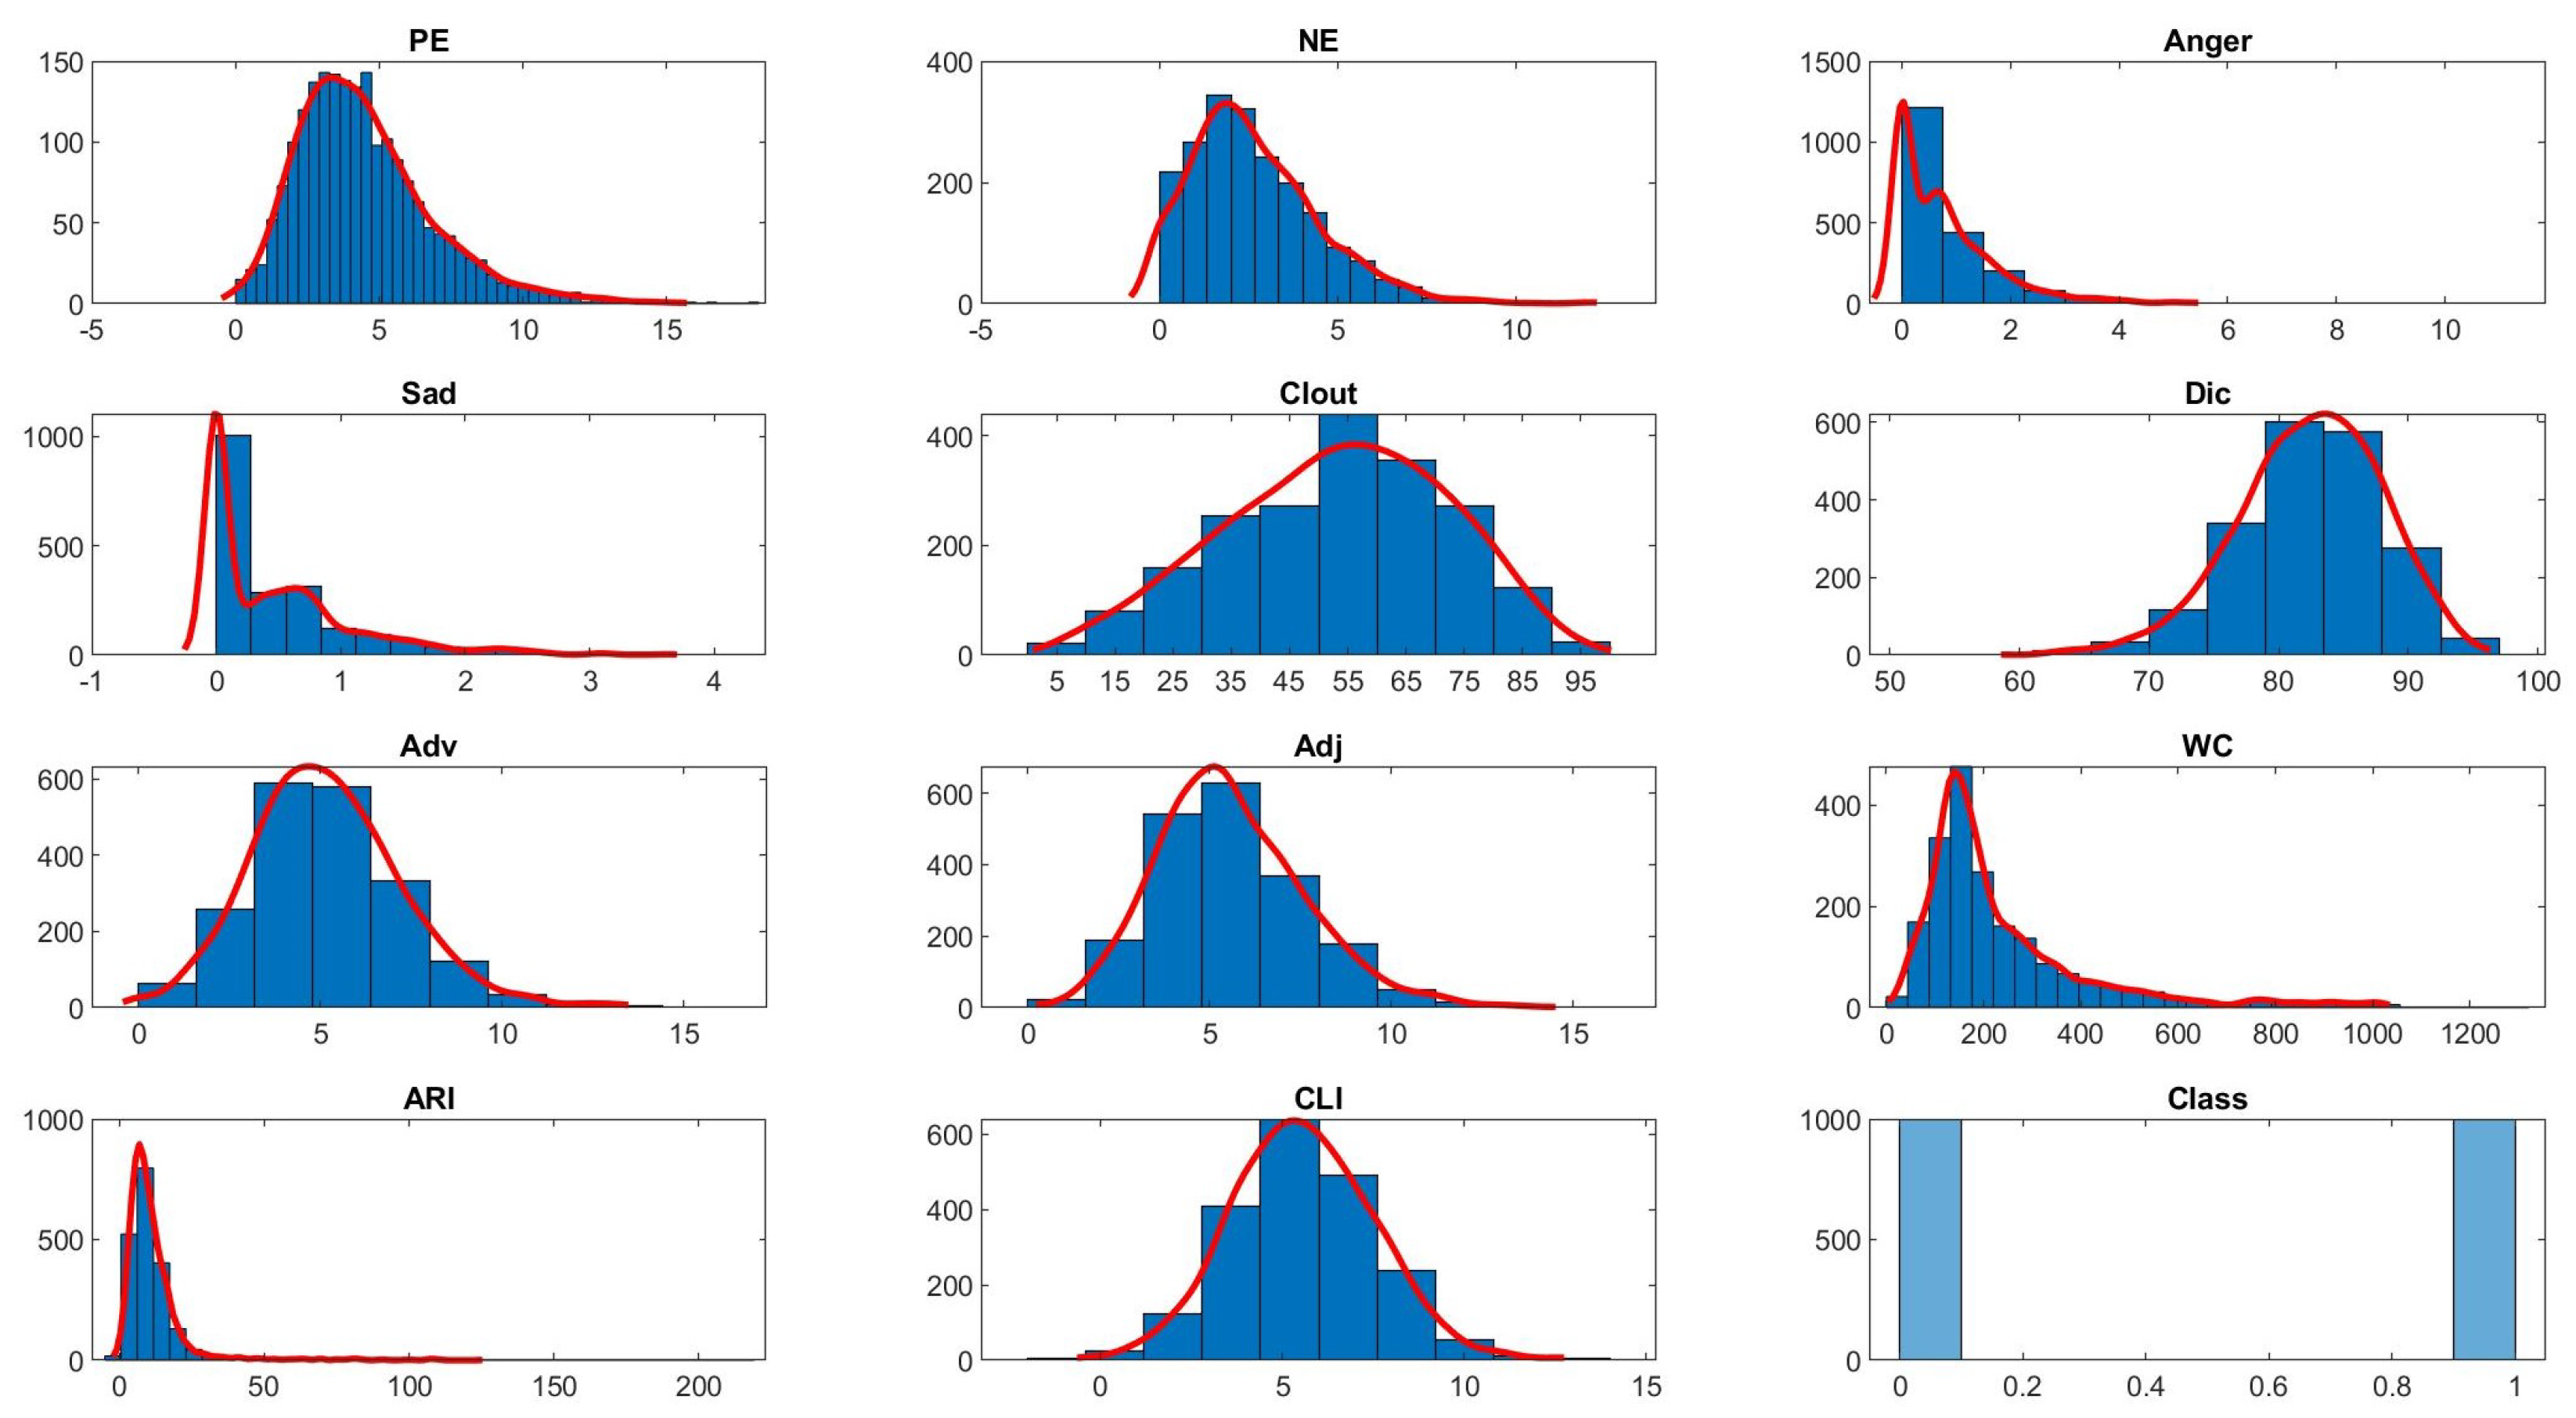
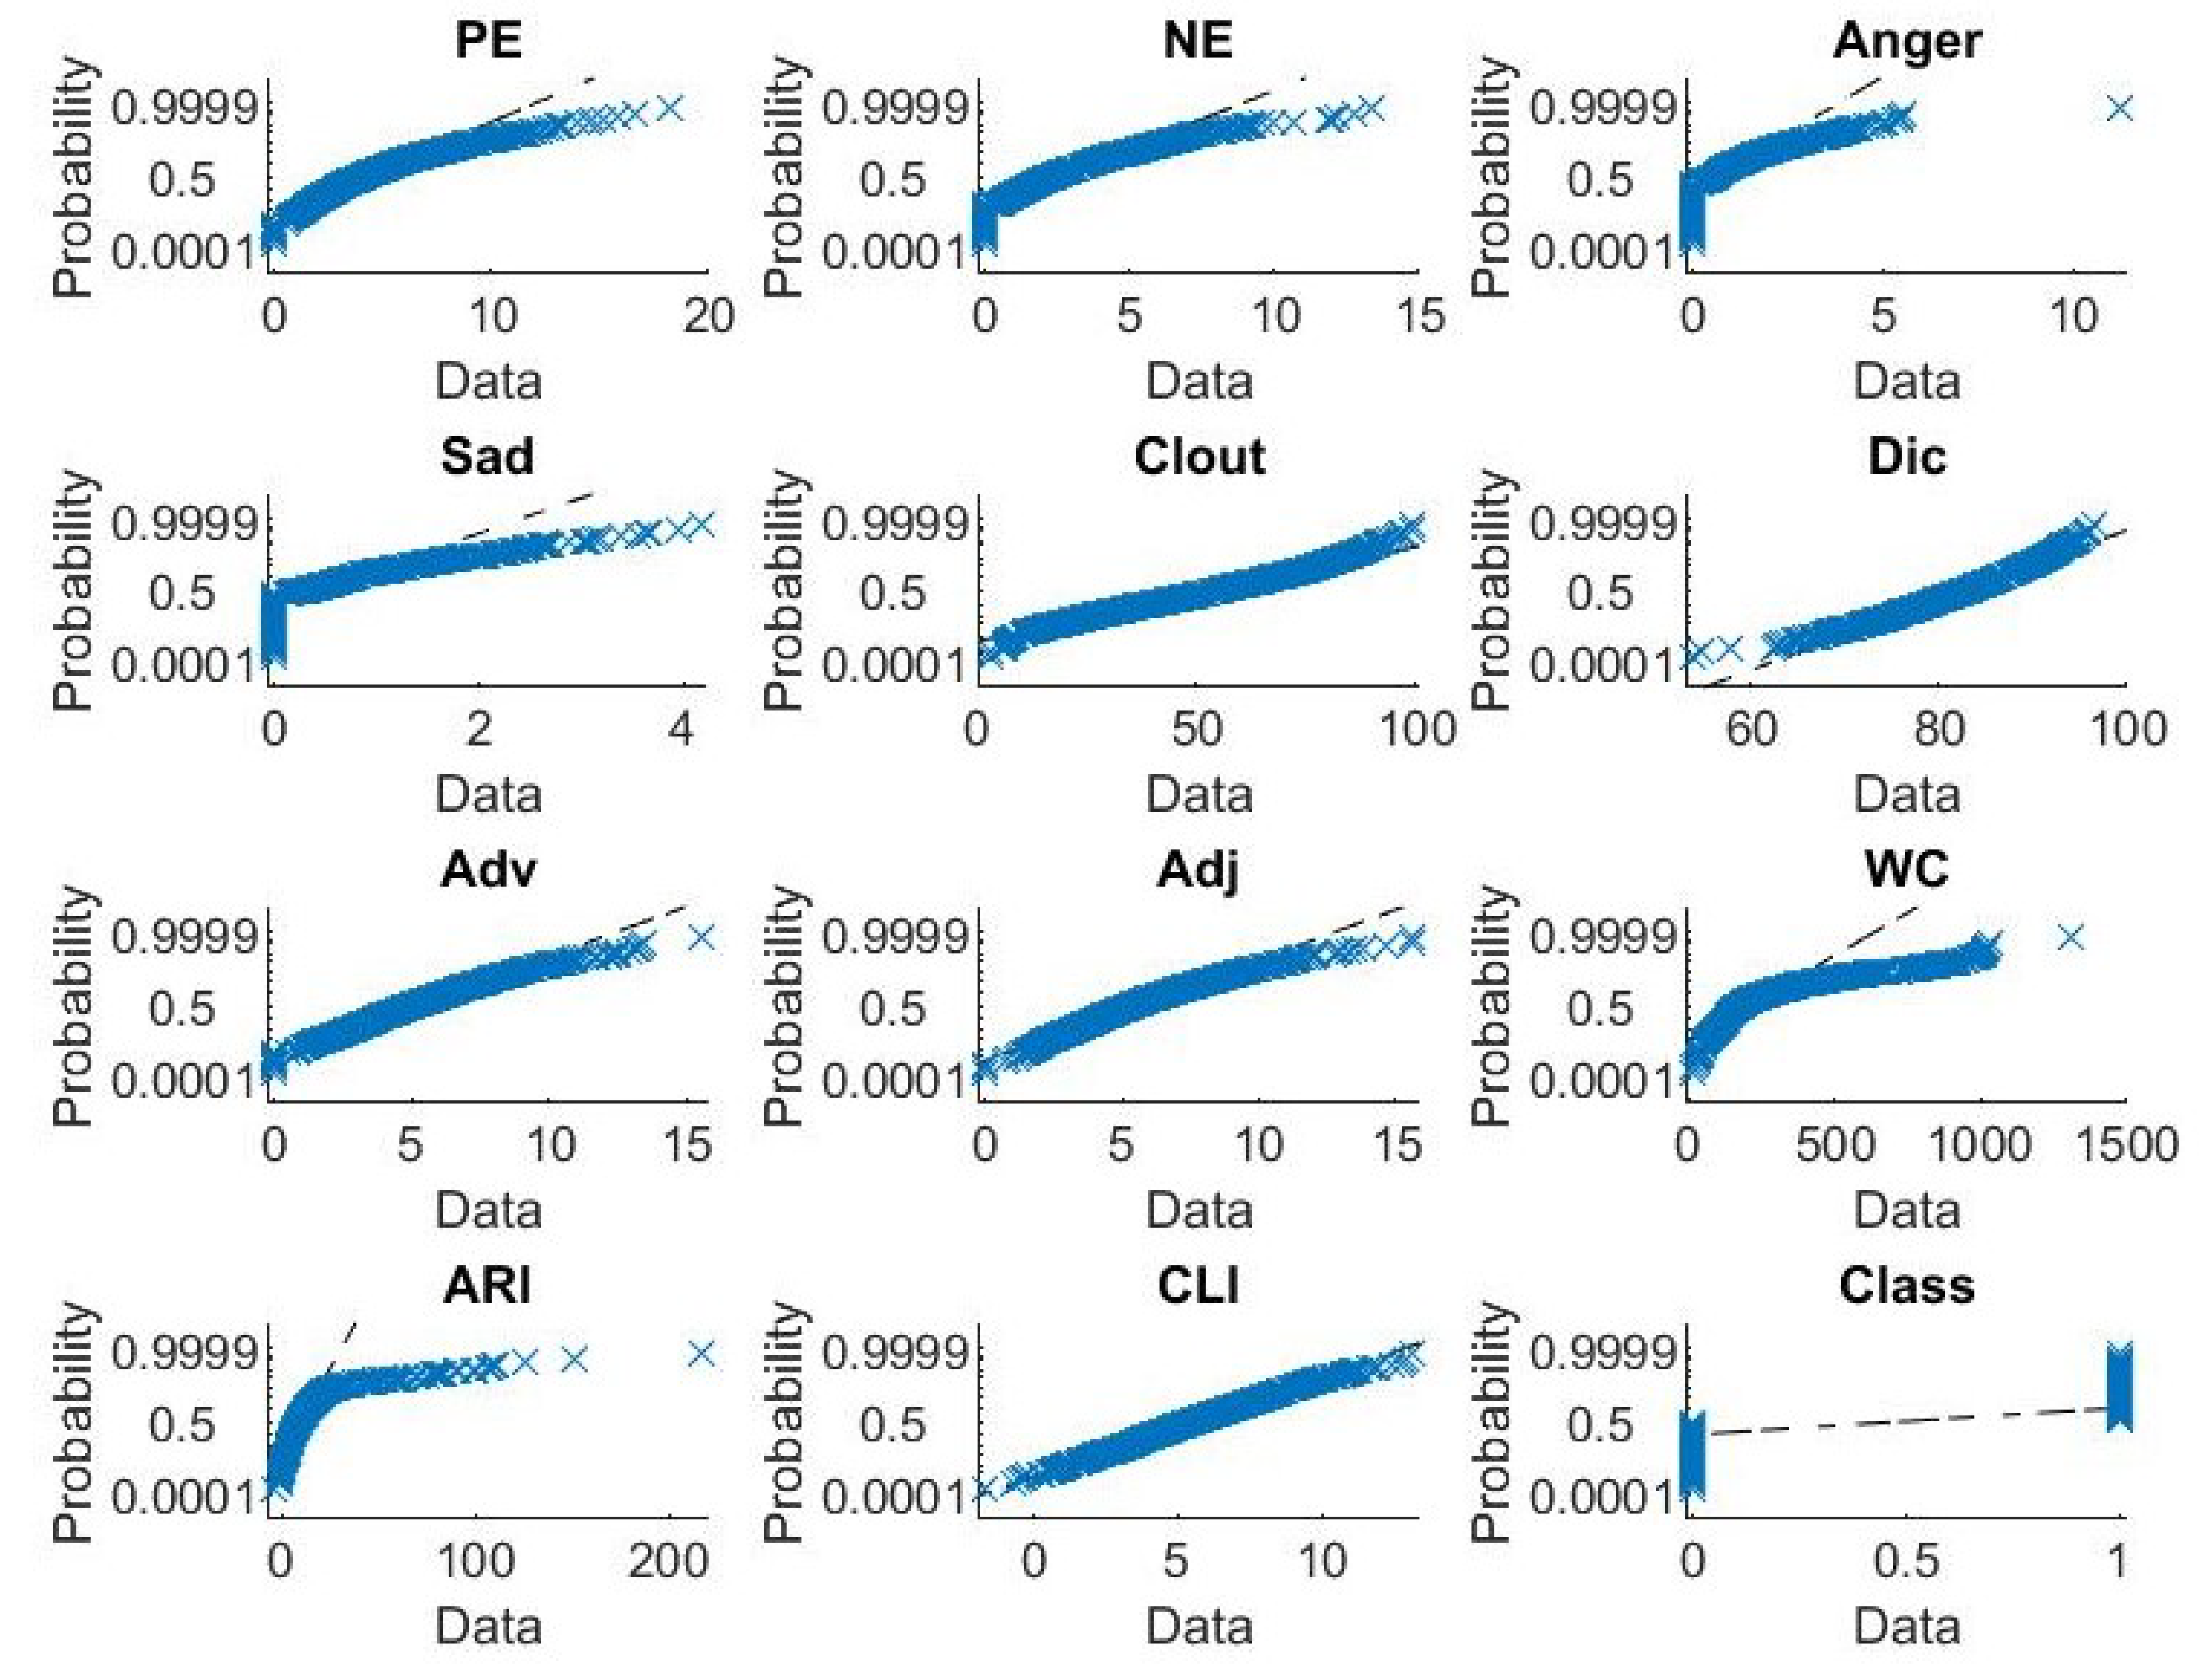
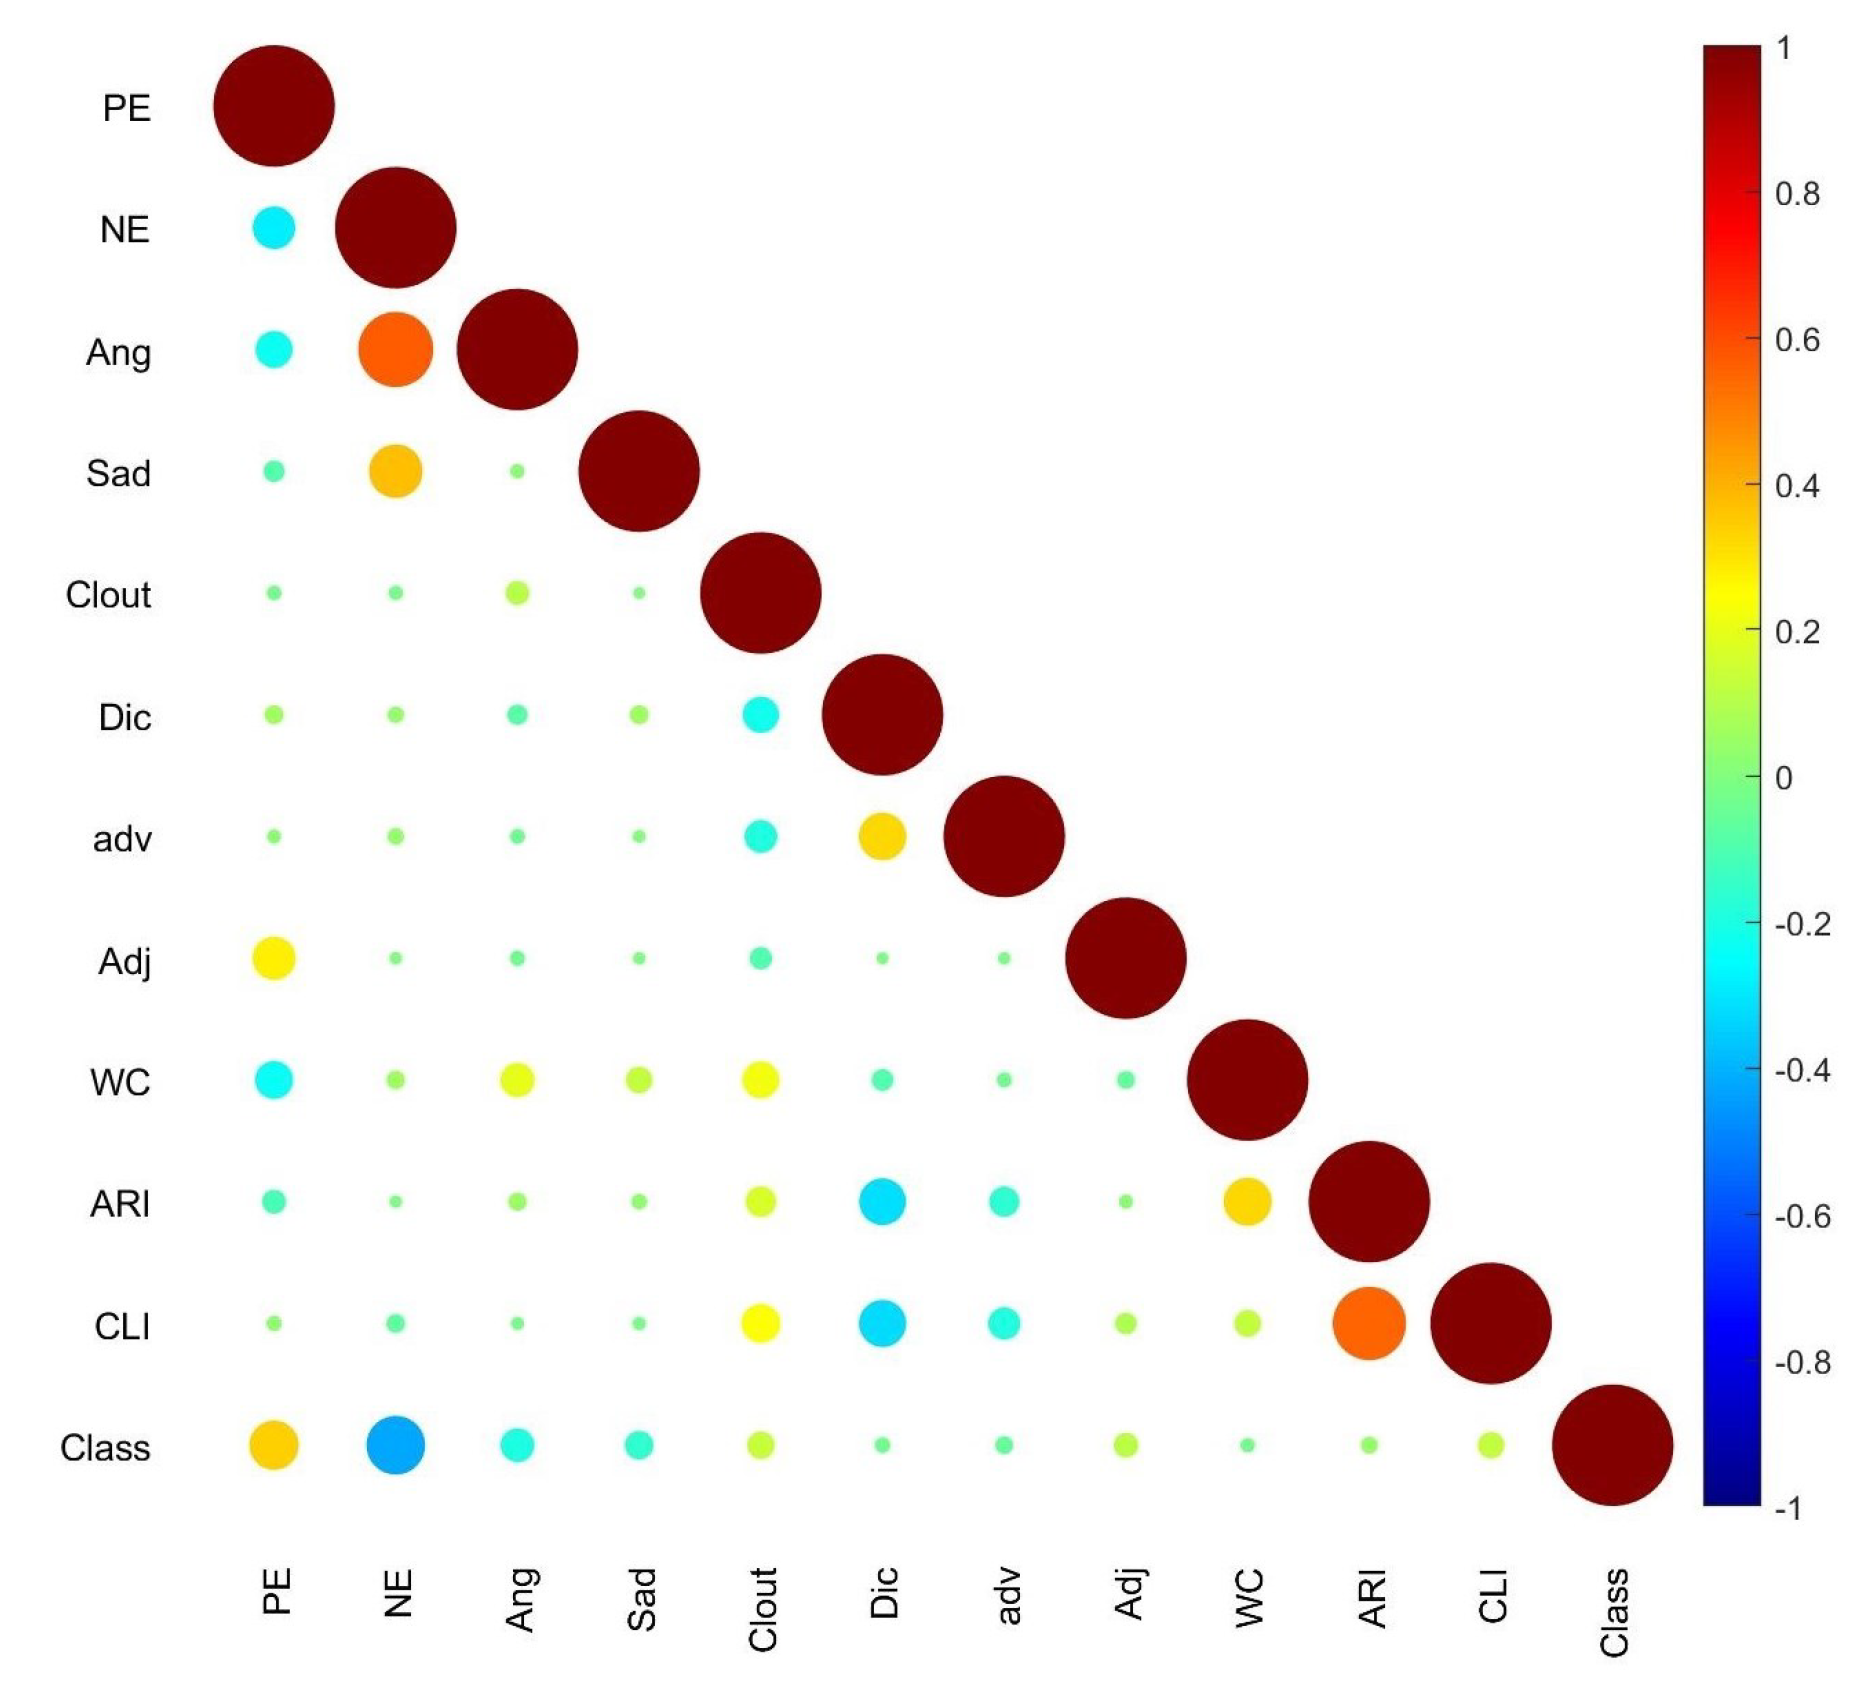
4.2. Feature Exploration and Hypothesis Testing

In this subsection, the linguistic, psychological and readability features extracted from the reviews and used in the sentiment-based review classification are explored. A summary of the descriptive statistics of the features under each category (linguistic, psychological and readability) are provided in Table 4. This summary includes the number of data records (N), mean, median, standard deviation (SD), maximum (Max) and minimum (Min) values of the features under each category. Moreover, the significance of the features related to the three categories is examined using hypothesis testing. In order to select the right significance test, the normality of the features is examined. To obtain a sense of the distributions of features and outcome variable, histograms and associated distribution curves are plotted as depicted in Figure 6. It is noteworthy that only CLI has a well behaved bell-shaped distribution curve while all other features are not. To confirm this observation, normal probability plots for all features are provided in Figure 7. A normal probability plot demonstrates the deviation of record distribution from normality. It has been observed that the Adv, Adj and Clout distributions deviate slightly from normal distribution. However, all other feature distributions except CLI are not normally distributed.
To investigate the association between input features, a correlation matrix is computed. As the probability distributions of most features are not Gaussian, it is not possible to use Pearson correlation to check the relationship between features. In contrast, the Spearman correlation coefficient is an efficient tool to quantify the linear relationship between continuous variables that are not normally distributed [36]. As this is the case of our input features, Spearman correlation has been adopted in this study to quantify the association between the features. A heat map of the Spearman correlation coefficient is created and presented in Figure 8. The circle’s size is indicative of the strength of bivariate correlation. The correlation map of Figure 8 reveals a strong relationship between anger and negative emotions and between ARI and CLI features, and a moderate association between NE and sadness and between Dic and ARI and CLI. However, the map shows weaker association between the other input features. As the outcome, polarity class, is a categorical variable, the correlation coefficient is not an adequate tool to measure its association with the input features. Therefore, Binomial Logistic Regression (LR) has been adopted to investigate this association. Logistic Regression assesses the likelihood of an input feature being linked to a discrete target variable [37]. The input features do not exhibit high multicollinearity, as deducted from the correlation matrix plot of Figure 8, which makes the LR a suitable test of association for our problem. Table 5 displays the output of a Binomial Logistic Regression model that was fitted to predict the outcome based of the linguistic, psychological and readability feature values. The p-values and significance levels for each of the regression model’s coefficients are listed in Table 5. The asterisks denote the level of the feature’s significance; more asterisks imply a higher level of importance. If the associated p-value is less than 0.001, three asterisks are used to denote significance, two asterisks are used to represent significance if the corresponding p-value is in the range [0.001–0.01], one asterisk reflects a p-value between 0.01 and 0.05 and no asterisk is for p-values larger than 0.05. As shown in Table 5, the p-values for PE, NE, Ang, Sad, Clout, Adj and CLI indicate that these features are statistically significant to the polarity class.
A Chi-square hypothesis test is conducted to verify the sufficiency of the LR model to test a feature’s significance. The null hypothesis of the test, H0, assumes that there is no relationship between the response variable, the polarity and any of the input features, i.e., all model coefficients except the intercept are zero. On the other hand, the alternative hypothesis, H1, implies that if any of the predictor’s coefficients is not zero, then the learning model is called efficient. The p-value of the Chi-square test of the model was recorded as 2.66 × 10 129 with 1988 degrees of freedom on 2000 observations for all features. This indicates that the LR model differs statistically from a constant model with only the intercept term and can be considered as an adequate test of feature significance. As a result, the null hypothesis can be rejected, and the association between the input features in predicting the polarity of a review is confirmed. As depicted in Table 4, the binomial LR reveals that all psychological features are significant. However, only Adj from the linguistic features and CLI from the readability features are significant. Therefore, only significant features are used for review classification in this study.

4.3. Evaluation Measure and Performance Comparison

The evaluation of the deep-learning and conventional models is carried out by calculating the performance measures accuracy, precision, recall and F-Measure. These performance measures are calculated on the basis of a confusion matrix. The details of confusion matrixes are given below.

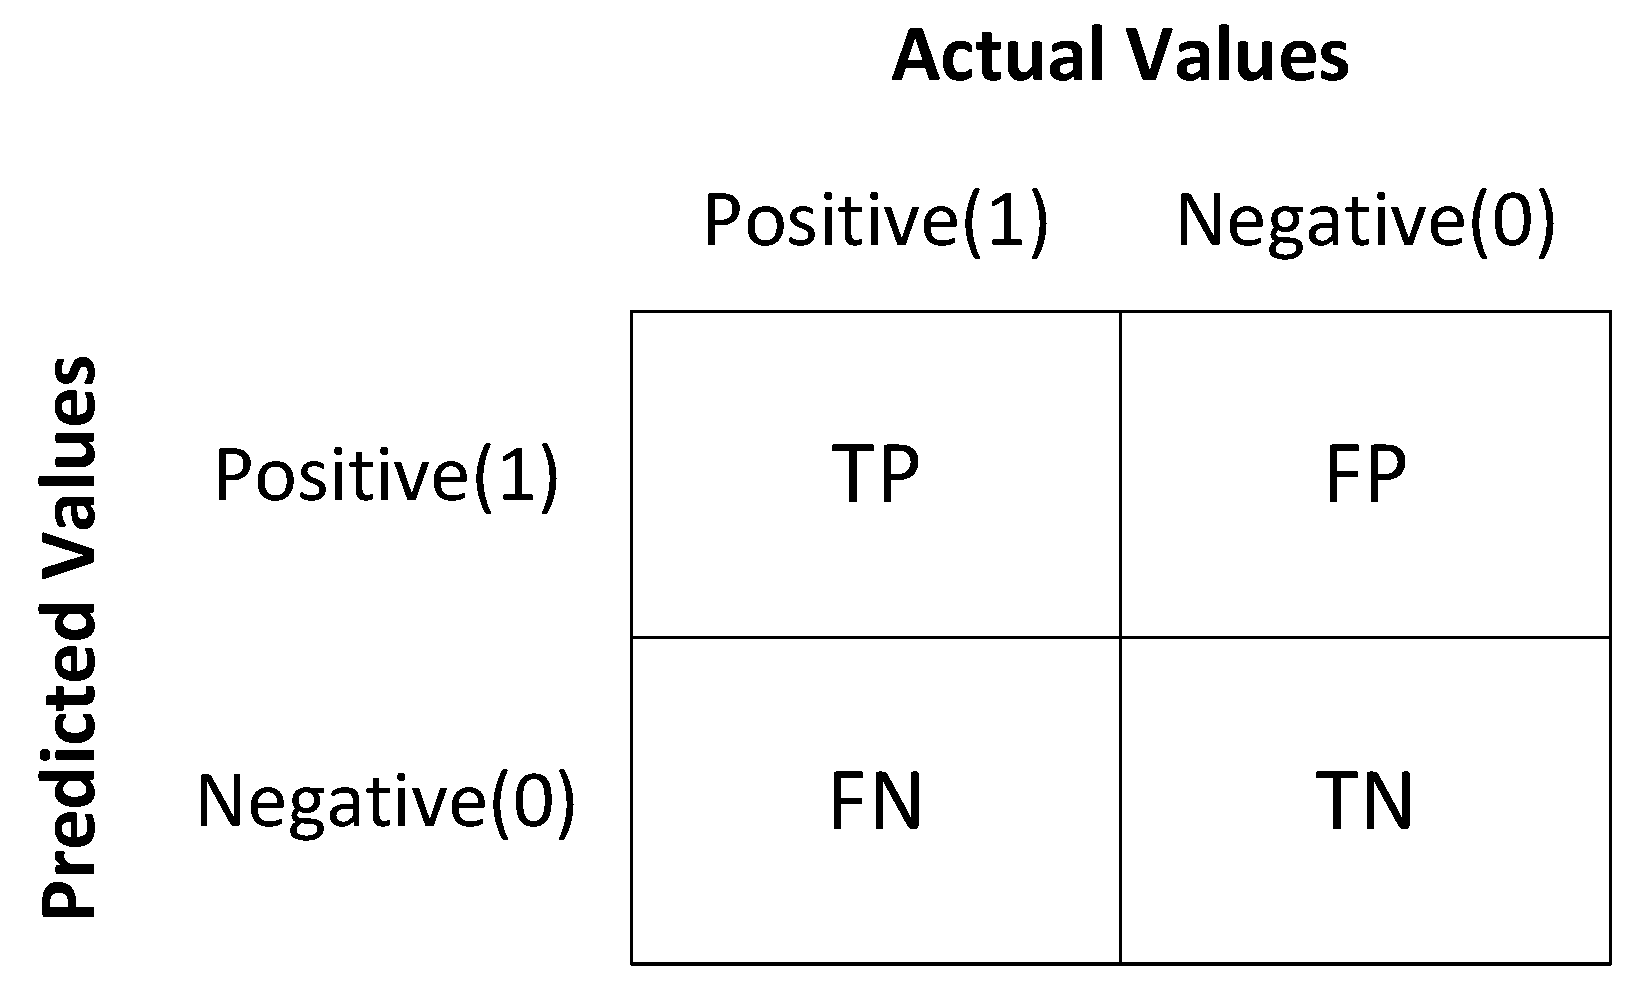
4.3.1. Confusion Matrix

A confusion matrix is also known as an error matrix and is used for measuring the performance of a classification model. A confusion matrix is represented in Figure 9 below.
When a review is an actual negative, and the model is predicted as positive it is called false positive (FP). When a review is an actual positive, and the model is predicted to be positive, it is called true positive (TP). When a review is an actual positive, and the model is predicted as negative, it is called false negative (FN). When a review is an actual negative, and the model is predicted as negative, it is called true negative (TN).

4.3.2. Pretrained Word Embedding

The pretrained word embedding Glove experimented with two different words embedding word vector dimensions 150 and 300. The 6 ML classifiers are used with 150 word vector dimensions and each word vector is tested. The experiments with 150 and 300 word vector dimension and their results are shown in Table 6 and Table 7.
After the movie review dataset preprocessing, it is passed to the 10-fold stratified cross-validation for the unbiased splitting of the dataset. The Glove pretrained model for feature engineering process is used. The 150 dimensions of the Glove pretrained model are used as a feature for ML models. The six ML algorithms are applied and SVM achieves the best results concerning other algorithms: NB, RF, LR, KNN and MLP on the evaluation measures of accuracy, precision, recall and F-Measure. The highest F-Measure score achieved is 84.6% using SVM, which is the impact of the pretrained Glove Model with 150 dimensions of feature vectors. The ML algorithm performs better on the 150 dimension vector of reviews. In MLP, three layers are used with 20 neurons at each layer to predict review polarity.
The impact of the pretrained Glove Model having 300 dimensions is represented in Table 7. The two DL models are applied to features having a vector dimension of 300. The used models are CNN and Bi-GRU and the best results are achieved with Bi-GRU with 84.3% testing accuracy. The lowest dimension of the pretrained model is 150, which leaves a higher impact on the results using the traditional ML algorithm compared to the 300 dimensions using the DL algorithm.

4.3.3. Review-Based Trained Word2Vec Model Word Embedding

The reviews are embedded into vectors with three different word vector size dimensions, 50, 100 and 150. Then, the ML and DL algorithms are applied to varying sizes of vectors of 28 dimensions independently and evaluated. Finally, the results are shown in Table 8 based on the evaluation.
The 50 dimensions of the Word2Vec model are self-trained on movie reviews. After that self-trained model, it is used for word embedding of the movie reviews into vectors representing the meaning of that word. Then, the six ML algorithms are applied. The SVM achieves the best results compared to other algorithms, NB, RF, LR, KNN and MLP, on the evaluation measures accuracy, precision, recall and F-Measure. The highest F Measure score achieved is 81.7% using SVM with 50 word embedding dimension, which is the impact of the self-trained model with a smaller number of dimensions. In Table 9, the 100 dimension parameter of the self-trained model is evaluated using a confusion matrix.
The 100 dimensions of the Word2Vec model are self-trained on movie reviews. After that model is self-trained, it is used for word embedding of the movie reviews into vectors representing the meaning of that word. Then, the six ML algorithms are applied. The SVM achieves the best results compared to other algorithms, NB, RF, LR, KNN and MLP on the evaluation measures accuracy, precision, recall and F-Measure. The highest F-Measure score achieved is 85.0% using SVM with 100 word embedding dimensions, which is the impact of the self-trained model with a higher number of dimensions than previous results. In Table 10, the impact of 150 dimensions of the self-trained model is defined.
The 150 dimensions of the Word2Vec model are self-trained on movie reviews. First, the context size of the model is set to 10 and the Skip-Gram Method is used to train the Word2Vec model. After that model is self-trained, it is used for word embedding of the movie reviews into vectors representing the meaning of that word. Then, the six ML algorithms are applied. The SVM achieves the best results compared to other algorithms, NB, RF, LR, KNN and MLP on the evaluation measures accuracy, precision, recall and F-Measure. The highest F-Measure score achieved is 86.1% using SVM with 150 word embedding dimensions, which is the impact of the self-trained model with a higher number of dimensions than the previous 50 and 100 dimension results. In Table 11, the impact of 150 dimensions of the self-trained model in addition to psychological, linguistic and readability features is defined. The 150 dimension self-trained model with proposed features is considered because it shows better results than the pretrained Glove Model. First, psychological features are extracted using LIWC. Next, the psychological features used in this experiment are positive emotion, negative emotion, anger, sadness, clout and dictionary words. CLI’s readability feature is used because it gave a better result in the previous experiment.
Then, the six ML algorithms are applied. The SVM achieves the best results with respect to other algorithms, NB, RF, LR, KNN and MLP, on the accuracy, precision, recall and F-Measure evaluation measures. The highest F-Measure score achieved is 87.9% using SVM. The psychological, linguistic and readability features improve the evaluation performance. Table 12 shows the impact of 300 dimensions of the self-trained model concerning accuracy.
The evaluation result of two DL algorithms applied to 300 dimension vectors without psychological and readability features. The impact on accuracy of 300 dimensions of the self-trained model is higher than the 300 dimensions of the pretrained model. The results show that the method of embedding that is context-based gives higher results with respect to global based embedding. The applied models are CNN with two layers with 32 and 64 neurons, respectively. Bi-GRU is used, which has two gates; one is an updated gate and the other is a reset gate. The update gate is used to the retain memory and the reset gate is used to forget memory. The best results are achieved with Bi-GRU with 84.5% testing accuracy as compared to the pretrained Glove Model.
The evaluation results of two DL algorithms applied on 300 word vectors with psychological and readability features are given in Table 13.
First, the psychological features are extracted using LIWC. The psychological features used in this experiment are positive emotion, negative emotion, anger, sadness, clout and dictionary words. CLI’s readability feature gave a better result in the previous experiment.
The applied models are CNN with two layers with 32 and 64 neurons, respectively. The Bi-GRU has two gates; one is an updated gate and the other is a reset gate. The updated gate is used to retain the memory and the reset gate is used to forget the memory. Bi-GRU achieves the best results with 87.1% testing accuracy compared to the pretrained Glove Model. In Table 14, a comparison is given between the proposed work and the previous work based on evaluation measures.
An analysis of the results following the experiment is given below.
  • The self-trained Word2Vec model on movie reviews with 150 dimension parameter has a higher impact on performance than the pretrained Glove Model.
  • The CLI readability achieved the highest score compared to ARI and WC.
  • The SVM algorithm performs better than the applied algorithms: NB, LR, RF, CNN, KNN and MLP.
  • The use of the psychological and readability feature CLI to classify reviews with self-trained embedding improves the performance from 86% to 87.93%.
  • The smaller number of words embedding dimension 150 performs better concerning the traditional ML algorithm and for the DL algorithm 300 dimensions gives a better result.

5. Conclusions

Classification of opinion mining of reviews is open research due to the continuous increase in available data. Many approaches have been proposed to achieve classification of movie reviews. After a critical analysis of the literature, we observe that words are converted into vectors for sentiment classification of movie reviews by different approaches, including TF-IDF and Word2Vec. The pretrain model of Word2Vec is commonly used for word embedding into vectors. Mostly generalized data are used to train the Word2Vec model for extracting features from reviews. We extract features by training the Word2Vec model on specific data related to 50 thousand reviews. For review classification, the Word2Vec model is trained on reviews. Most researchers used a generalized trained model for review classification as an alternative. This research work extracts features from movie reviews using a review-based trained Word2Vec model and LIWC. The review-based trained data have some characteristics. They include 6 million vocabularies of the word and are specific to movie reviews related to the task of sentiment classification of reviews. The six ML algorithms are applied, and SVM achieves the best result of 87.93% F-Measure with respect to other algorithms: NB, RF, LR, KNN and MLP.
Two DL algorithms are also applied. One is CNN and the other is Bi-GRU. Bi-GRU achieved 87.1%, which is greater than the results CNN achieved. The results conclude that the data used for model training perform better than the model trained on generalized data. Concerning the ML algorithm,150 features perform better than 50 and 100 features for the used movie review dataset. The DL model 300 feature vectors perform better classifications than the 150 feature vectors. Significant psychological, linguistic and readability features aided in improving the classification performance of the used classifiers. SVM achieved an 87.93% F-Measure with 150 word vector size and BiGRU achieved the same F-Measure score using 300 word vector size. We applied both traditional ML and DL algorithms for the classification of reviews. Both achieved nearly the same results on a performance measure that proves that the dataset of IMDb movie reviews having 50,000 is not enough for applying a DL algorithm. In future work, a larger dataset is needed to apply the DL algorithm to increase the classification performance of reviews.

Author Contributions

Conceptualization, M.S.K. (Muhammad Shehrayar Khan), G.A., M.S.F. (Muhammad Saleem Khan), M.S.K. (Muhammad Shehrayar Khan), A.R. and T.A.; methodology, M.S.K. (Muhammad Shehrayar Khan), G.A., M.S.F., M.S.K. (Muhammad Saleem Khan), A.R. and T.A.; software M.S.K. (Muhammad Shehrayar Khan), G.A., M.S.F., M.S.K. (Muhammad Saleem Khan), A.R. and T.A.; validation, M.S.K. (Muhammad Shehrayar Khan), G.A., M.S.F., M.S.K. (Muhammad Saleem Khan), A.R. and T.A.; formal analysis, M.S.K. (Muhammad Shehrayar Khan), G.A., M.S.F., A.R. and T.A.; investigation, M.S.K. (Muhammad Shehrayar Khan), G.A., M.S.F., M.S.K. (Muhammad Saleem Khan), A.R. and T.A.; resources, M.S.K. (Muhammad Shehrayar Khan); data curation, M.S.K. (Muhammad Saleem Khan); writing original draft preparation, M.S.K. (Muhammad Shehrayar Khan), G.A., M.S.F., M.S.K. (Muhammad Saleem Khan), A.R. and T.A.; writing review and editing, M.S.K. (Muhammad Shehrayar Khan), G.A., M.S.F., M.S.K. (Muhammad Saleem Khan), A.R. and T.A.; visualization, M.S.K. (Muhammad Shehrayar Khan), G.A., M.S.F., M.S.K. (Muhammad Saleem Khan), A.R. and T.A.; supervision, M.S.F.; project administration, G.A.; funding acquisition, G.A. and A.R. All authors have read and agreed to the published version of the manuscript.

Funding

This research received no external funding.

Data Availability Statement

I declare that the data considered for this research is original and collected by the authors for generating insights. Moreover, the data mining & ML tools considered for this research are freely available and built the models in accordance with our own scenario.

Conflicts of Interest

The authors declare that there is no conflict of interest related to this publication.

References

  1. Wang, S.; Fang, H.; Khabsa, M.; Mao, H.; Ma, H. Entailment as Few-Shot Learner. arXiv 2021, arXiv:2104.14690. [Google Scholar]
  2. Tran, D.D.; Nguyen, T.T.S.; Dao, T.H.C. Sentiment Analysis of Movie Reviews Using Machine Learning Techniques. In Proceedings of the Sixth International Congress on Information and Communication Technology, London, UK, 25–26 February 2021; Springer: Berlin, Germany, 2022; pp. 361–369. [Google Scholar]
  3. Khan, U.; Khan, S.; Rizwan, A.; Atteia, G.; Jamjoom, M.M.; Samee, N.A. Aggression Detection in Social Media from Textual Data Using Deep Learning Models. Appl. Sci. 2022, 12, 5083. [Google Scholar] [CrossRef]
  4. Ahmad, T.; Faisal, M.S.; Rizwan, A.; Alkanhel, R.; Khan, P.W.; Muthanna, A. Efficient Fake News Detection Mechanism Using Enhanced Deep Learning Model. Appl. Sci. 2022, 12, 1743. [Google Scholar] [CrossRef]
  5. Faisal, M.S.; Rizwan, A.; Iqbal, K.; Fasihuddin, H.; Banjar, A.; Daud, A. Prediction of Movie Quality via Adaptive Voting Classifier. IEEE Access 2022, 10, 81581–81596. [Google Scholar] [CrossRef]
  6. Nawaz, A.; Abbas, Y.; Ahmad, T.; Mahmoud, N.F.; Rizwan, A.; Samee, N.A. A Healthcare Paradigm for Deriving Knowledge Using Online Consumers’ Feedback. Healthcare 2022, 10, 1592. [Google Scholar] [CrossRef]
  7. Tripathy, A.; Agrawal, A.; Rath, S.K. Classification of sentiment reviews using n-gram machine learning approach. Expert Syst. Appl. 2016, 57, 117–126. [Google Scholar] [CrossRef]
  8. Moussa, M.E.; Mohamed, E.H.; Haggag, M.H. A survey on opinion summarization techniques for social media. Future Comput. Inform. J. 2018, 3, 82–109. [Google Scholar] [CrossRef]
  9. Hemalatha, I.; Varma, G.S.; Govardhan, A. Preprocessing the informal text for efficient sentiment analysis. Int. J. Emerg. Trends Technol. Comput. Sci. (IJETTCS) 2012, 1, 58–61. [Google Scholar]
  10. Manek, A.S.; Shenoy, P.D.; Mohan, M.C. Aspect term extraction for sentiment analysis in large movie reviews using Gini Index feature selection method and SVM classifier. World Wide Web 2017, 20, 135–154. [Google Scholar] [CrossRef]
  11. Pang, B.; Lee, L.; Vaithyanathan, S. Thumbs up? Sentiment classification using machine learning techniques. arXiv 2002, arXiv:cs/0205070. [Google Scholar]
  12. Ahmad, S.R.; Bakar, A.A.; Yaakub, M.R. A review of feature selection techniques in sentiment analysis. Intell. Data Anal. 2019, 23, 159–189. [Google Scholar] [CrossRef]
  13. Revanasiddappa, M.; Harish, B. A New Feature Selection Method based on Intuitionistic Fuzzy Entropy to Categorize Text Documents. Int. J. Interact. Multimed. Artif. Intell. 2018, 5, 106. [Google Scholar] [CrossRef]
  14. Taboada, M.; Brooke, J.; Tofiloski, M.; Voll, K.; Stede, M. Lexicon-based methods for sentiment analysis. Comput. Linguist. 2011, 37, 267–307. [Google Scholar] [CrossRef]
  15. Mudinas, A.; Zhang, D.; Levene, M. Combining lexicon and learning based approaches for concept-level sentiment analysis. In Proceedings of the First International Workshop on Issues of Sentiment Discovery and Opinion Mining, Beijing, China, 12 August 2012; pp. 1–8. [Google Scholar]
  16. Zheng, L.; Wang, H.; Gao, S. Sentiment feature selection for sentiment analysis of Chinese online reviews. Int. J. Mach. Learn. Cybern. 2018, 9, 75–84. [Google Scholar] [CrossRef]
  17. Gupta, S.; Kar, A.K.; Baabdullah, A.; Al-Khowaiter, W.A. Big data with cognitive computing: A review for the future. Int. J. Inf. Manag. 2018, 42, 78–89. [Google Scholar] [CrossRef]
  18. Fink, L.; Rosenfeld, L.; Ravid, G. Longer online reviews are not necessarily better. Int. J. Inf. Manag. 2018, 39, 30–37. [Google Scholar] [CrossRef]
  19. Li, L.; Goh, T.T.; Jin, D. How textual quality of online reviews affect classification performance: A case of deep learning sentiment analysis. Neural Comput. Appl. 2020, 32, 4387–4415. [Google Scholar] [CrossRef]
  20. Yang, Z. Sentiment Analysis of Movie Reviews based on Machine Learning. In Proceedings of the 2020 2nd International Workshop on Artificial Intelligence and Education, Montreal, QC, Canada, 6–8 November 2020; pp. 1–4. [Google Scholar]
  21. Karim, M.; Das, S. Sentiment analysis on textual reviews. IOP Conf. Ser. Mater. Sci. Eng. 2018, 396, 012020. [Google Scholar] [CrossRef]
  22. Kumar, H.; Harish, B.; Darshan, H. Sentiment Analysis on IMDb Movie Reviews Using Hybrid Feature Extraction Method. Int. J. Interact. Multimed. Artif. Intell. 2019, 5, 109–114. [Google Scholar] [CrossRef]
  23. Bandana, R. Sentiment analysis of movie reviews using heterogeneous features. In Proceedings of the 2018 2nd International Conference on Electronics, Materials Engineering & Nano-Technology (IEMENTech), Kolkata, India, 4–5 May 2018; pp. 1–4. [Google Scholar]
  24. Sharma, A.K.; Chaurasia, S.; Srivastava, D.K. Sentiment short sentences classification by using CNN deep learning model with fine tuned Word2Vec. Procedia Comput. Sci. 2020, 167, 1139–1147. [Google Scholar] [CrossRef]
  25. Wang, J.H.; Liu, T.W.; Luo, X.; Wang, L. An LSTM approach to short text sentiment classification with word embeddings. In Proceedings of the 30th conference on computational linguistics and speech processing (ROCLING 2018), Hsinchu, Taiwan, 4–5 October 2018; pp. 214–223. [Google Scholar]
  26. Shaukat, Z.; Zulfiqar, A.A.; Xiao, C.; Azeem, M.; Mahmood, T. Sentiment analysis on IMDB using lexicon and neural networks. SN Appl. Sci. 2020, 2, 1–10. [Google Scholar] [CrossRef]
  27. Mukherjee, A.; Mukhopadhyay, S.; Panigrahi, P.K.; Goswami, S. Utilization of oversampling for multiclass sentiment analysis on Amazon review dataset. In Proceedings of the 2019 IEEE 10th International Conference on Awareness Science and Technology (iCAST), Morioka, Japan, 23–25 October 2019; pp. 1–6. [Google Scholar]
  28. Krishna, A.; Akhilesh, V.; Aich, A.; Hegde, C. Sentiment analysis of restaurant reviews using machine learning techniques. In Emerging Research in Electronics, Computer Science and Technology; Springer: Berlin, Germany, 2019; pp. 687–696. [Google Scholar]
  29. Dey, A.U.; Ghosh, S.K.; Valveny, E.; Harit, G. Beyond visual semantics: Exploring the role of scene text in image understanding. Pattern Recognit. Lett. 2021, 149, 164–171. [Google Scholar] [CrossRef]
  30. Xiao, L.; Wang, G.; Zuo, Y. Research on patent text classification based on Word2Vec and LSTM. In Proceedings of the 2018 11th International Symposium on Computational Intelligence and Design (ISCID), Hangzhou, China, 8–9 December 2018; Volume 1, pp. 71–74. [Google Scholar]
  31. Pan, Q.; Dong, H.; Wang, Y.; Cai, Z.; Zhang, L. Recommendation of crowdsourcing tasks based on Word2Vec semantic tags. Wirel. Commun. Mob. Comput. 2019, 2019, 2121850. [Google Scholar] [CrossRef]
  32. Soriano, I.M.; Peña, J.L.C.; Breis, J.T.F.; San Román, I.; Barriuso, A.A.; Baraza, D.G. Snomed2Vec: Representation of SNOMED CT terms with Word2Vec. In Proceedings of the 2019 IEEE 32nd International Symposium on Computer-Based Medical Systems (CBMS), Cordoba, Spain, 5–7 June 2019; pp. 678–683. [Google Scholar]
  33. Khatua, A.; Khatua, A.; Cambria, E. A tale of two epidemics: Contextual Word2Vec for classifying twitter streams during outbreaks. Inf. Process. Manag. 2019, 56, 247–257. [Google Scholar] [CrossRef]
  34. Chen, T.; Mao, Q.; Lv, M.; Cheng, H.; Li, Y. Droidvecdeep: Android malware detection based on Word2Vec and deep belief network. KSII Trans. Internet Inf. Syst. (TIIS) 2019, 13, 2180–2197. [Google Scholar]
  35. Mikolov, T.; Chen, K.; Corrado, G.; Dean, J. Efficient estimation of word representations in vector space. arXiv 2013, arXiv:1301.3781. [Google Scholar]
  36. Croux, C.; Dehon, C. Influence functions of the Spearman and Kendall correlation measures. Stat. Methods Appl. 2010, 19, 497–515. [Google Scholar] [CrossRef] [Green Version]
  37. Collett, D. Modelling Binary Data; CRC Press: Boca Raton, FL, USA, 2002. [Google Scholar]
Figure 1. General Diagram of working flow of Research Methodology.
Mathematics 10 03260 g001
Figure 2. Feature Engineering with LIWC.
Mathematics 10 03260 g002
Figure 3. General Diagram of working flow of Research Methodology.
Mathematics 10 03260 g003
Figure 4. Feature Extraction Process with self Pretrained Word2Vec Model.
Mathematics 10 03260 g004
Figure 5. Feature Extraction Process with Pretrained Word2Vec Model.
Mathematics 10 03260 g005
Figure 6. Histograms and probability distribution curves for linguistic, physiological, readability features and polarity class variables.
Mathematics 10 03260 g006
Figure 7. Normal probability plots for linguistic, physiological, readability features and polarity class variables.
Mathematics 10 03260 g007
Figure 8. Spearman Correlation coefficient matrix of linguistic, psychological and readability features.
Mathematics 10 03260 g008
Figure 9. Confusion Matrix.
Mathematics 10 03260 g009
Table 1. Summary of Accuracy achieved on the dataset of IMDb reviews.
Serial
Number
Models/ApproachFeaturesDatasetAccuracy
1CNN
BLSTM
CNN-BLSTM
Hybrid [20]
Word embedding into vectorsIMDb reviews84.5% Pre train model
82% without the Pre train model
2LDA on Naive Bayes [21]Sentiword NetIMDb reviews75.2%
3Maximum Entropy [22]Sentiment words with TF IDFIMDb reviews83.9%
4Naive Bayes [23]Heterogeneous FeaturesMovie review89%
5Naive Bayes, KNN [2]Word vector (sentiword)Movie reviews81.4%
6Entailment as Few
Shot Learner [1]Word embedding into vectorsIMDb reviews87.4% pretrain
model
7Deep Convolution
Neural Network [24]Vector FeaturesIMDb Movie Reviews82.19%
8LSTM [25]Vector FeaturesIMDb Movie Reviews84.7%
9Neural Network [26]Lexicon FeaturesIMDb reviews86%
Table 2. Word2Vec results in other fields results.
FieldsResults
Image Processing [29]90% accuracy
Natural Language Processing Tasks [30]More than 90% accuracy
Recommendation Tasks [31]Up to 95% accuracy
Biosciences [32]More than 90% accuracy
Semantics Task [33]More than 90% accuracy
Malware Detection Tasks [34]Up to 99% accuracy
Table 3. Word2Vec Results in other fields’ results.
InputOutput
Insci-fiction
Inmovie
Inhero
Inplay
Ingood
Inrole
Inever
Table 4. Descriptive statistics summary of linguistic, psychological, readability features and polarity class.
PENEAngSadCloutDicAdvAdjWCARICLIPolarity
Mean4.4808452.6613350.7666450.47206553.1324482.391255.1635.582745238.08511.735985.5628980.5
Median4.112.350.5550.2754.41582.755.0355.361759.0850065.4960830.5
SD2.3915821.834510.9422920.62522219.126755.646222.08762.07515181.070212.711271.9889480.500125
Min00002.6653.950012−3.15818−1.667880
Max18.1813.411.24.179996.615.515.561304215.794813.07321
N200020002000200020002000200020002000200020002000
Table 5. Statistical significance of linguistic, psychological and readability features using Binomial Logistic Regression.
EstimateS-Errort-Statisticsp-ValueQuality
PE−2.70140.95065−2.84170.000449**
NE0.290910.02845710.2231.57E-24***
Ang0.425880.0838145.08123.75E-07***
Sad0.232620.1012.30310.021273*
Clout0.0158150.0030535.18092.21E-07***
Dic0.0103140.0102771.00353.16E-01
Adv0.0025050.0279590.0896029.29E-01
Adj0.082030.0281512.91393.57E-03**
WC0.0003060.0002941.04282.97E-01
ARI−0.001960.004221−0.465276.42E-01
CLI0.110890.0304213.64522.67E-04***
Table 6. Results of pretrained model of vector dimension of 150 words.
ModelAccuracyPrecisionRecallF Score
Multi-Layer
Perceptron
0.83460.84240.82420.8326
“Logistic
Regression”
0.83160.82930.83500.832
“K Nearest
Neighbor”
0.7920.8290.73600.779
Random Forest0.7880.7910.78390.7879
Naive Bayes0.75520.75250.76050.7565
Support Vector
Machine
0.84540.84190.85060.8462
Table 7. Pretrained model of vector dimension 300 Results.
ModelTraining Accuracy AverageTesting Accuracy Average
CNN0.8280.813
Bi-GRU0.8690.843
Table 8. Trained Model on reviews with 50 word vector dimension evaluation results.
ModelAccuracyPrecisionRecallF Score
Naive Bayes0.6900.6900.6920.691
Logistic
Regression
0.792140.7910.7930.792
KNN0.7560.8100.6700.733
Random Forest0.7660.7610.7750.768
Multi-Layer
Perceptron
0.8010.7970.8100.802
Support Vector
Machine
0.8160.8130.8220.817
Table 9. Without the pretrained model with a 100 word vector dimension evaluation results.
ModelAccuracyPrecisionRecallF Score
Naive Bayes0.7360.7350.7400.737
Logistic
Regression
0.8360.8320.8410.837
K Nearest
Neighbor
0.7950.8390.7300.781
Random Forest0.8020.7980.8070.803
Multi-Layer
Perceptron
0.8390.8290.8560.842
Support Vector
Machine
0.8560.8500.8650.850
Table 10. Model trained on reviews of 150 word vector dimension without psychological, linguistic and readability features evaluation result.
ModelAccuracyPrecisionRecallF Score
Naive Bayes0.77270.76550.7860.775
Logistic
Regression
0.8440.8410.8480.844
K Nearest
Neighbor
0.81640.8470.7720.805
Random Forest0.8180.8150.8220.818
Multi-Layer
Perceptron
0.8490.8470.8530.859
Support Vector
Machine
0.8600.8550.8660.861
Table 11. Model trained on reviews of 150 word vector dimension with psychological, linguistic and readability features evaluation result.
ModelAccuracyPrecisionRecallF Score
Naive Bayes0.78100.7750.7910.783
Logistic
Regression
0.86320.8590.8680.863
K Nearest
Neighbor
0.83230.87010.78120.823
Random Forest0.83080.82110.8450.833
Multi-Layer
Perceptron
0.8640.8540.88040.8669
Support Vector
Machine
0.87870.87430.88450.8793
Table 12. Evaluation results on word embedding 150 word vectors with psychological and readability features.
ModelTraining Average AccuracyTesting Accuracy
CNN (2 Layers)0.8530.840
Bi-GRU0.8610.845
Table 13. Evaluation results on word embedding 300 word vectors with psychological, linguistic and readability features.
ModelTraining Accuracy AverageTesting Accuracy Average
CNN0.8610.845
Bi-GRU0.9010.871
Table 14. Comparison of F-Measure of Proposed work with Previous work.
Word Embedding ModelClassifierF-Measure
Review based trained
Word2Vec
(Proposed)
Support Vector Machine0.8793
Pretrained Word2Vec [16]CNN-BLSTM0.84
Pretrained Word2Vec [22]LSTM0.847
TF-IDF [18]Maximum Entropy0.839
Publisher’s Note: MDPI stays neutral with regard to jurisdictional claims in published maps and institutional affiliations.

