1. Introduction
Stability of filtration flows with liquid/gas interfaces in rocks and soils has been studied both analytically and numerically in a large number of works. These problems are of great practical interest. Gas drainage is considered as an effective method to enhance oil recovery (see [
1,
2,
3,
4]). The efficiency of oil/water or oil/gas displacement depends on the stability of the interface between the oil-saturated region and the region containing displacement fluid (gas) [
5]. An increase in the concentration of impurities and contamination of groundwater occurs when groundwater evaporates, as well as when the boundary between fresh water and solutions is unstable [
6,
7,
8,
9]. Another example where this instability plays a significant role is geothermic systems. In many cases, their existence can be explained by convective heat transfer to the surface of the Earth due to the instability of the interfaces between regions saturated with water, steam, and a steam–water mixture inside high-temperature rocks [
10,
11,
12,
13,
14,
15]. The problem of the stability of the water layer in the soil located above the air-saturated region was studied in [
13,
16] in relation to artificial underground structures. The occurrence of instability of the oil–gas interface during oil extraction from a field with a gas cap was investigated in [
17].
These studies were provided by the use of the continual hydrodynamic approach. It was assumed that the filtration process is described by Darcy’s law, and there is a narrow region that separates the gas and liquid region determined by some surface equation. It was shown in the linear approximation within the use of the normal mode method that for a given amplitude of the interface perturbation there is a certain range of parameters where the rate of growth of the amplitude increases indefinitely with decreasing wavelength [
13,
14,
15,
16].
This fact casts doubt on the applicability of the Darcy equation in the context of studying the onset of instability, as well as determining geometric characteristics of the finger-like structures of a liquid or gas. In [
18] the stability of oil flow in a collector with a gas cap was studied under the assumption that oil motion obeys the Brinkman law. Within the normal mode analysis, it was established that the growth rate of short wave perturbations tends to zero with increasing wavenumber.
In recent times, pore-network modeling has been used increasingly to study water imbibition and drainage in porous media. Relative permeability studies conducted using the pore-scale network models have shown that the obtained results are in qualitative agreement with the data of laboratory measurements (e.g., see [
19,
20,
21,
22,
23,
24,
25]. In [
26], a network approach to the modeling of non-Newtonian rheology was used to understand some of the more detailed features of polymer flow in porous media. This approach provided a mathematical bridge between the behavior of the non-Newtonian fluid in a single capillary and the macroscopic behavior as deduced from the pressure drop–flow rate relation across the whole network model. In [
27], the network approach was presented which simulates 2-phase oil/water displacement during water imbibition. In [
28], a pore-network model of the shale matrix was developed and used to simulate CO
2 migration in organic-rich shale formations. The pore space is modeled as a set of pore bodies connected by pore throats. An imbibition efficiency calculation method was proposed in [
29]. The acyclic pore model was improved and was used to study how the pore structure affects imbibition performance. An analytical analysis of the relationship between the pore-scale forces and the Darcy-scale pressure drops was presented in [
30]. An extensive and detailed discussion of the application of network models can be found in [
31,
32,
33].
In this work, we study the evolution of perturbations of the gas/oil contact surface with a decrease in pressure in an oil-saturated region and compare the results obtained within continual and network models of a porous media. When a liquid is displaced by a gas in a porous medium, the gas–liquid interface is linearly unstable within the continuum model using Darcy’s law (see, for example, [
17]). The rate of growth of interface perturbations increases indefinitely with decreasing wavelength at a constant amplitude of the perturbation. Below, we show that linear analysis is not applicable in this case, and we will use the numerical solution. The results of the numerical solution also show that the perturbation growth rate increases without limit with decreasing wavelength. In this case, the use of the continuum model is impossible without modification, which requires studies using direct numerical simulation on the pore scale. Therefore, we use simple network models to identify the physical mechanisms that can help achieve successful modeling of the interface motion. This paper is organized as follows:
Section 2 contains the formulation of the problem within the framework of the continual model using Darcy’s law. We show that the linear approximation is inapplicable for determining the growth rate of short-wave perturbations. In
Section 3, we study the wavelength dependence of the growth rate of short-wave perturbations using a numerical approach in the framework of the continual model. In
Section 4, a similar problem is studied within the network model of porous media.
Section 5 contains a discussion of the obtained results and conclusion notes.
2. Formulation of the Problem
We consider the problem of oil extraction from the field with a gas cap. Assume that the gas cap is separated from the oil-saturated reservoir by a horizontal interface. When producing oil located under the gas zone, the pressure in the oil reservoir decreases, and the interface moves down. If the motion of the interface is unstable, gas breakdown may occur in the direction of the production well. In this case, regions saturated with immobile oil are formed. Thus, the study of the instability of filtration flows with a gas/liquid interface is an important issue when developing a field with a gas cap.
In recent years, gas gravity drainage technology has been widely used worldwide (see [
1,
2,
3,
4]). The flow diagram is shown in
Figure 1 and is a simplification of the real-life example with the horizontal interlayer. Let a horizontal layer of a porous homogeneous medium be located over a high-permeability layer with constant pressure
. This layer models a horizontal production well or a hydraulic fracture. For the considered problem of the evolution of interface perturbations, the pressure may be assumed to be constant, since the permeability of this layer is several orders of magnitude higher than the permeability at z > 0. The problem is solved in Cartesian coordinates
with the axis
z pointing upwards. In the low permeable layer at
(
region) there is a liquid, and the region
(
) is filled with gas with constant pressure
. Here,
t is time and
is the
z-coordinate of the interface. The horizontal coordinate
x varies in the range
.
At the gas/liquid interface, pressure jumps so that the pressure drop equals to the capillary pressure
Here, the capillary pressure
is negative if the rock is wettable and positive otherwise. Similar to [
17], we assume that capillary pressure depends on the vertical coordinate
z.
In the region
, the continuity equation is valid, and we assume that Darcy’s law is satisfied
Here,
is the average pore velocity,
m the ratio between the pores’ area and the total cross-sectional area,
k the permeability,
the viscosity of the liquid,
g the gravity, and
the density of the liquid. From Equation (
2), it follows that the pressure inside the region
satisies the Laplace equation
We neglect the evaporation of the liquid at the contact surface, so there is no mass flow through the gas/liquid interface. Therefore, the equation for the normal component of local velocity of the contact surface takes the form
Similar equations have been used in [
17].
Figure 1 presents the large-scale (Darcy scale) flow through porous media. The real gas/liquid interface is located in pores. If most of the moving interface are belonged to some narrow region between gas-dominated and liquid-dominated zones, this region may be approximated by the surface [
14,
15] as shown in
Figure 1. This surface has a radius of curvature, but this radius is not used to calculate surface tension.
We write the problem equations and boundary conditions
We introduce variable
L with the dimension of length so that
and define dimensionless variables
We transform the relations (
5) to the form
If the contact surface is flat and perpendicular to the axis
, then problem (
6)–(
9) has the solution independent of the coordinate
where
is the coordinate of the flat gas/liquid interface.
In [
16,
17], the evolution of the infinitesimal harmonic perturbations of the solution (
10)–(
11) was studied by the normal mode method, and expression is obtained for the growth rate of the amplitude of the perturbation of the interface
where
K is the wavenumber of perturbation,
is its amplitude, and
is given by
If
, then the amplitude of perturbations increases. In the case
, we obtain
In the limit
we obtain
The relationship (
15) predicts an arbitrarily large growth rate with increasing
K for any given amplitude. This result contradicts the physical essence of the process under consideration. This problem has been repeatedly pointed out in [
13,
17] and others.
The relation (
15) is obtained under the assumption that
Since
and
the condition (
16) leads to
From inequality (
17) and relation (
15), we then obtain that in the limit
From expression (
18), it follows that the growth rate of the amplitude is limited when condition (
15) is valid. Inequality (
18) is the condition for the applicability of the linear approximation. Thus, in the range of applicability of linear approximation, Darcy’s law does not lead to unphysical values of the growth rate of the perturbation and the filtration rate.
Since the linear analysis of stability is inapplicable when the amplitude of the perturbations and wave length are of the same order of magnitude, we will study the evolution of the perturbation numerically.
3. The Rate of Change of the Amplitude of the Harmonic Disturbance in the Nonlinear Case
We consider the wavelength dependence of the rate of change of the amplitude of the harmonic perturbation without using the linear approximation. We will use the system of Equation (
5) assuming that the capillary pressure is constant. In this case, in all relations used, the value
enters only in combination
. Hence, without loss of generality, we can set
. In [
16], it has been shown that gravity does not affect the evolution of perturbations, so in what follows we will consider the system of equations
where
. Consider the evolution of the perturbations of the main flow. The main flow is described by the equations
Here,
is the coordinate of the flat gas/liquid interface.
In [
34], a numerical–analytical method was proposed for evaluation of the filtration flow with gas/liquid interface under the assumption that the contact surface is infinitely thin, i.e., is a discontinuity. The Laplace Equation (
3) for pressure is solved using the boundary element method. In a numerical calculation, the gas/liquid interface is a broken line composed of segments. The numerical method is described in detail in [
34]. This method allows accurate and robust computation of the evolution of a multiply connected boundary of a water-saturated region in a porous media (see, e.g., [
16,
35,
36,
37]).
We set
,
,
and
and
. Then, we set the coordinate of the perturbed gas/liquid interface according to the expression
The pressure on the interface is assumed constant, so the liquid velocity is directed along the normal to this surface and is equal to the normal component of this surface’s velocity. In the absence of perturbations, the flat interface would remain flat and move along the axis
z with velocity
. We denote by
the normal velocity of the interface in the reference frame moving along axis
z with velocity
. For the velocity of the surface at the vertices of perturbations, we introduce notations
and
so that
as shown in
Figure 1.
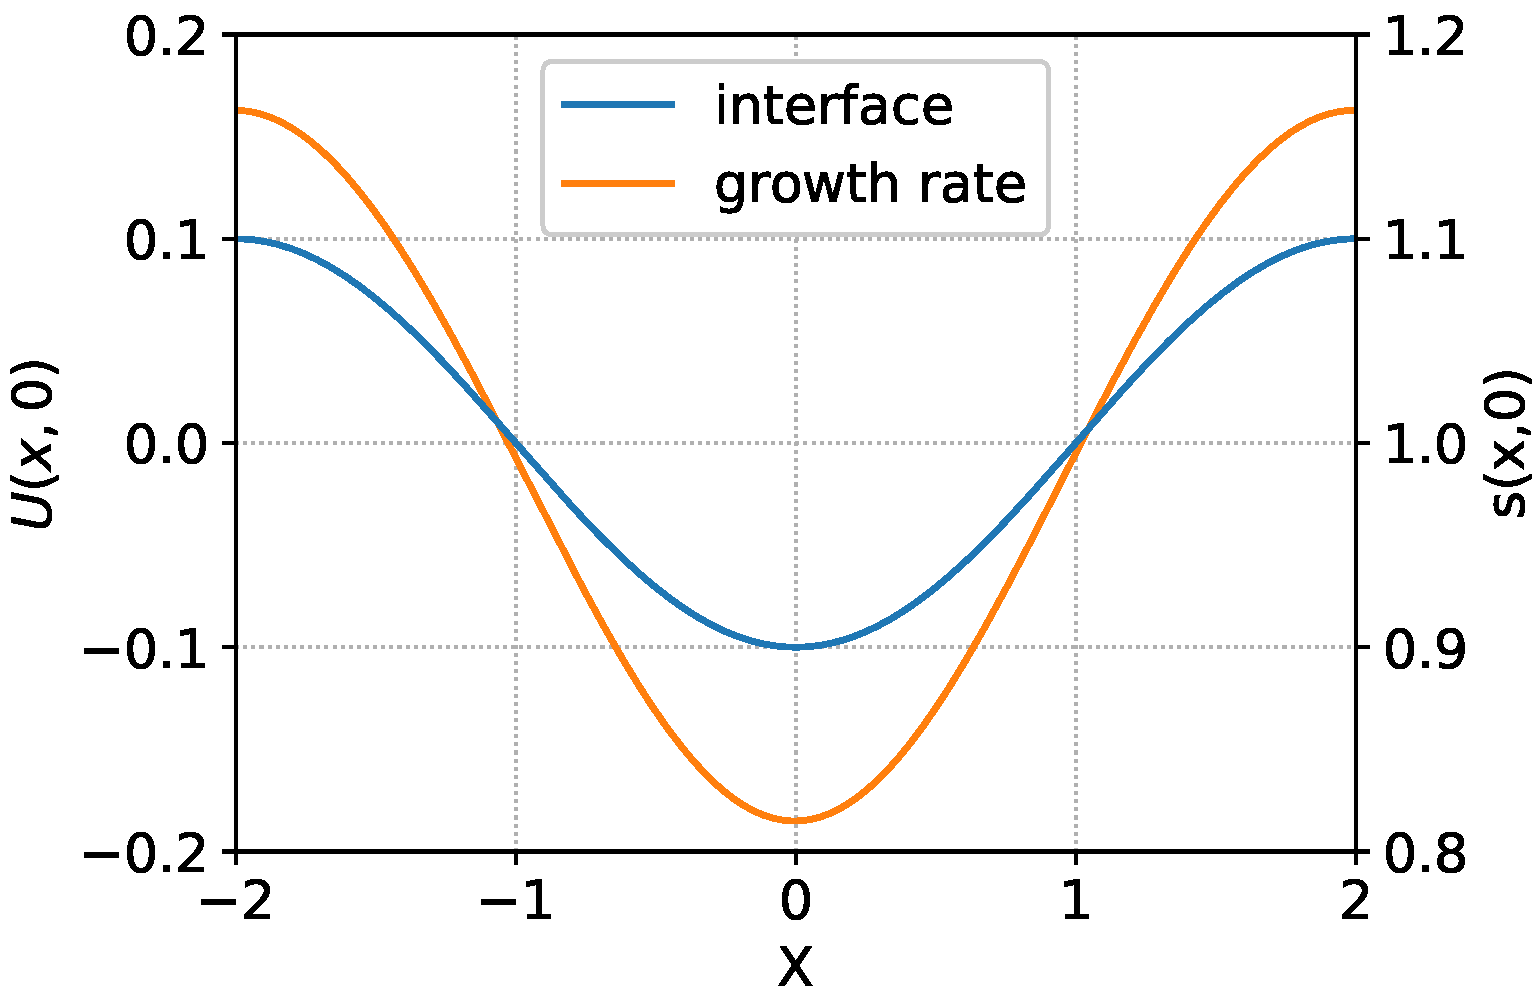
Figure 2 and
Figure 3 show the normal velocity of various points of the contact surface
for the wave lengths
and
. The results in
Figure 2 were obtained for the amplitude value
, so that condition (
17) is satisfied. In this case, the dependency of velocity on the coordinate
x can be approximately described by the linear result
. The growth rates of the amplitudes upwards
and downwards
differ insignificantly.
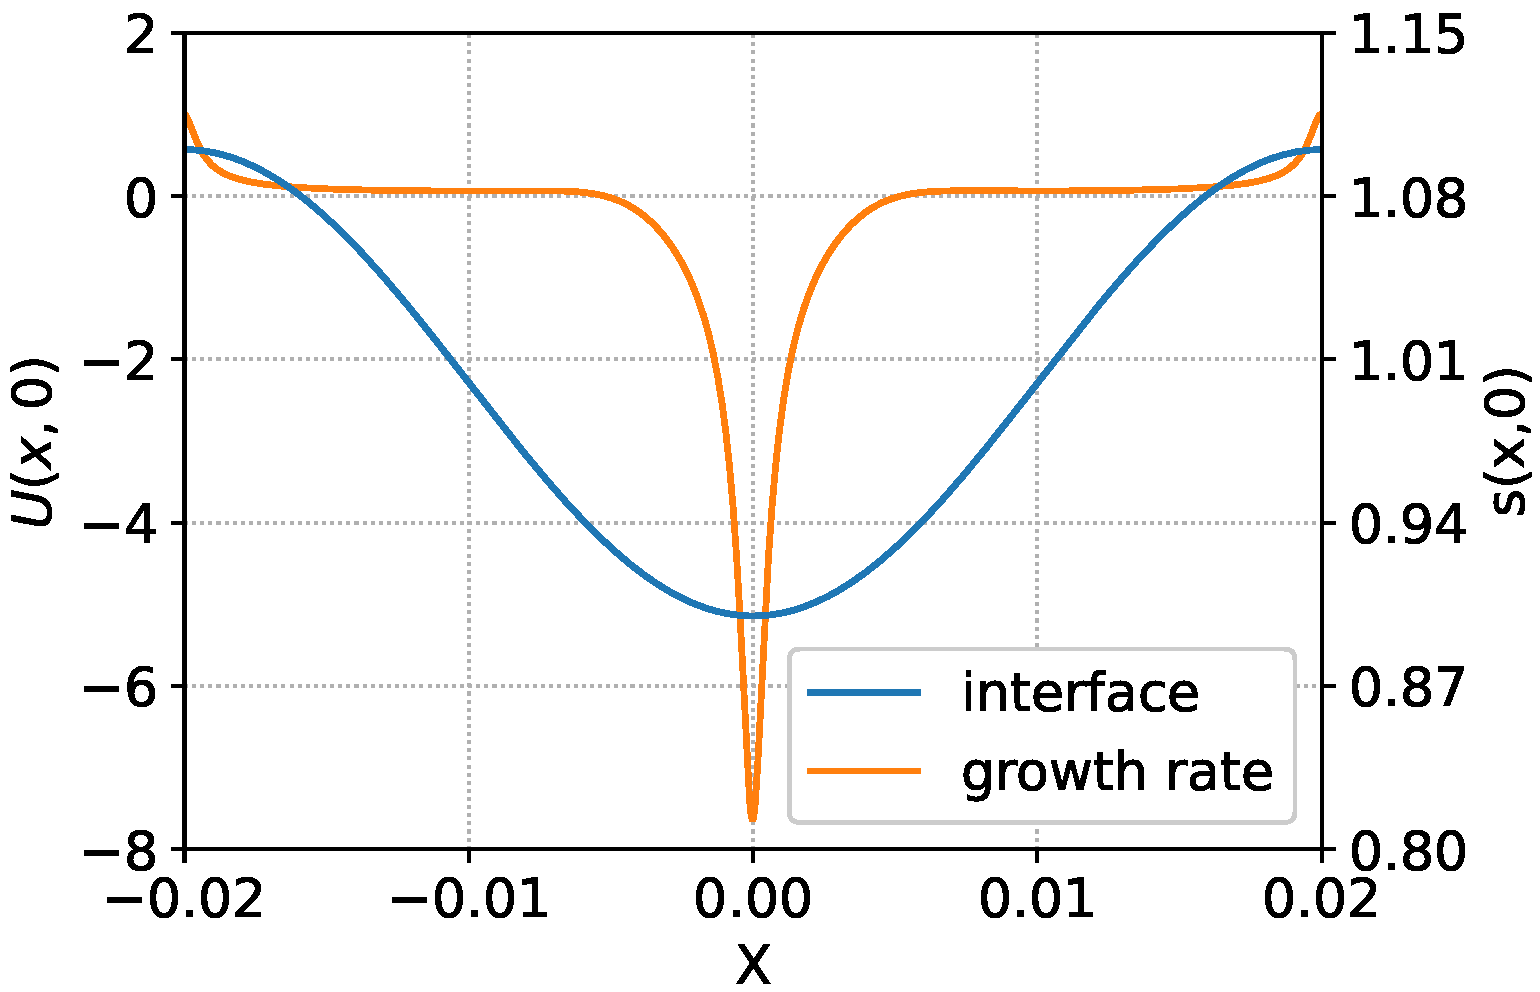
Figure 3 corresponds to
, so condition (
17) is violated. In this case, the dependency of velocity on the coordinate
x differ significantly from the dependency shown in
Figure 2. The growth rate of the amplitude upwards
and downwards
differ by more than seven times, and the velocity of the surface
is close to zero outside the narrow regions in the vicinity of maximum and minimum points of the perturbation profile.
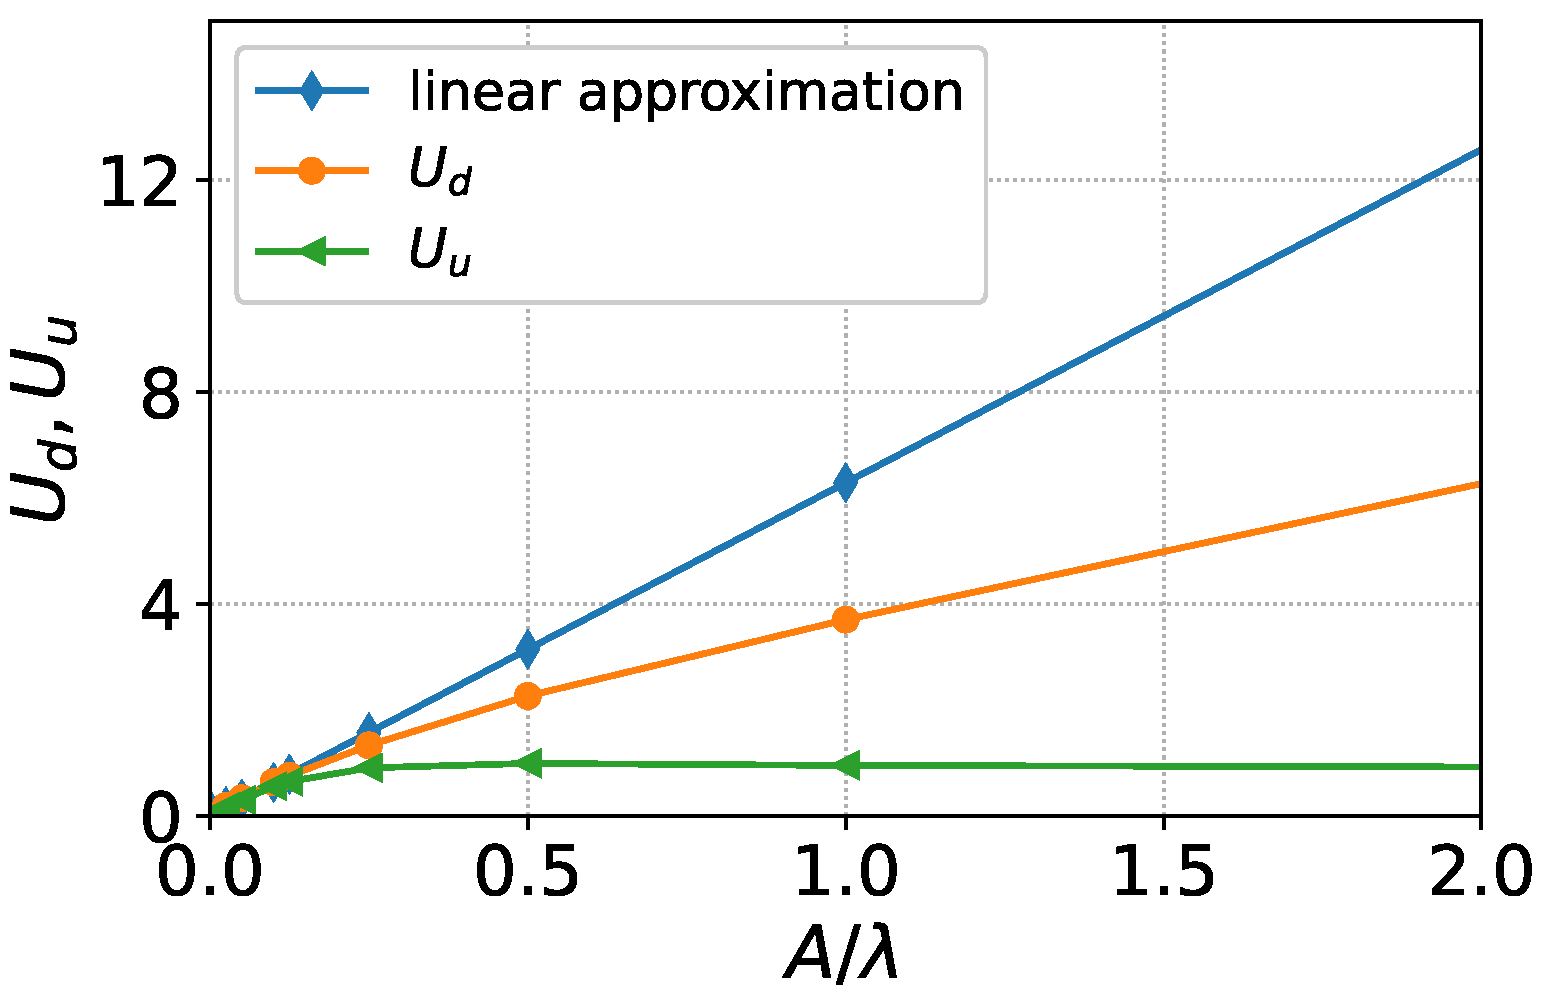
Figure 4 and
Figure 5 show the dependencies of the growth rate of perturbations amplitude
and
on the ratio
. It can be seen from
Figure 4 that for
the calculated values of the amplitude growth rate upwards
and downwards
differ insignificantly and are in good agreement with the results obtained in the linear approximation. If
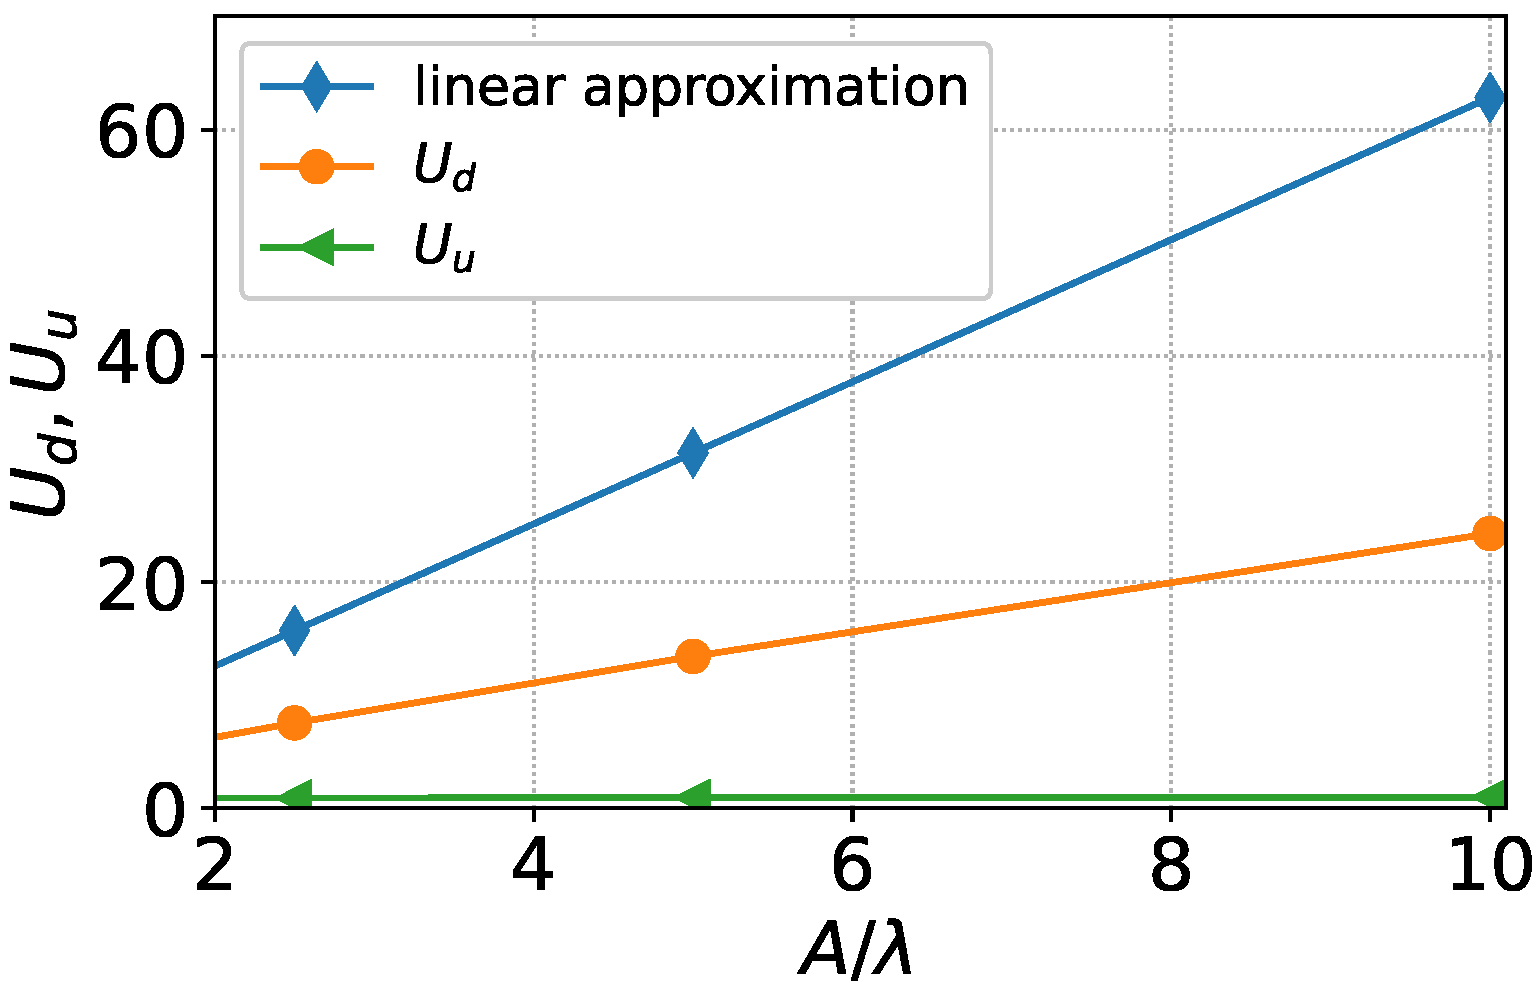
(see
Figure 5), the growth rate
is close to one. This means that the upper vertex of the perturbation profile stops, since the velocity of the interface
as a whole is equal to −1. The downwards growth rate
(blue line) increases linearly with
, although significantly slower than linear analysis predicts (green line).
From these results, it is clearly seen that the anomalous growth of short-wave perturbations is preserved in the nonlinear case.
If we introduce surface tension at the gas/liquid interface, then in the linear approximation, perturbations with a wavelength less than a certain threshold value decay, and the instability is not anomalous. In a porous medium at the pore scale, the gas / liquid interface cannot be represented as a smooth surface, since the movement occurs within individual capillaries. In this case, effective surface tension related to the curvature of the interfacial surface can only be introduced formally. Consider whether there is an unlimited increase in the growth rate of the perturbation amplitude with reduction of the wavelength, taking into account the microscopic features of the gas/liquid interface movement. To analyze the fundamental physical effects arising in this case, we will use the network model of porous media.
4. The Network Model of a Porous Medium
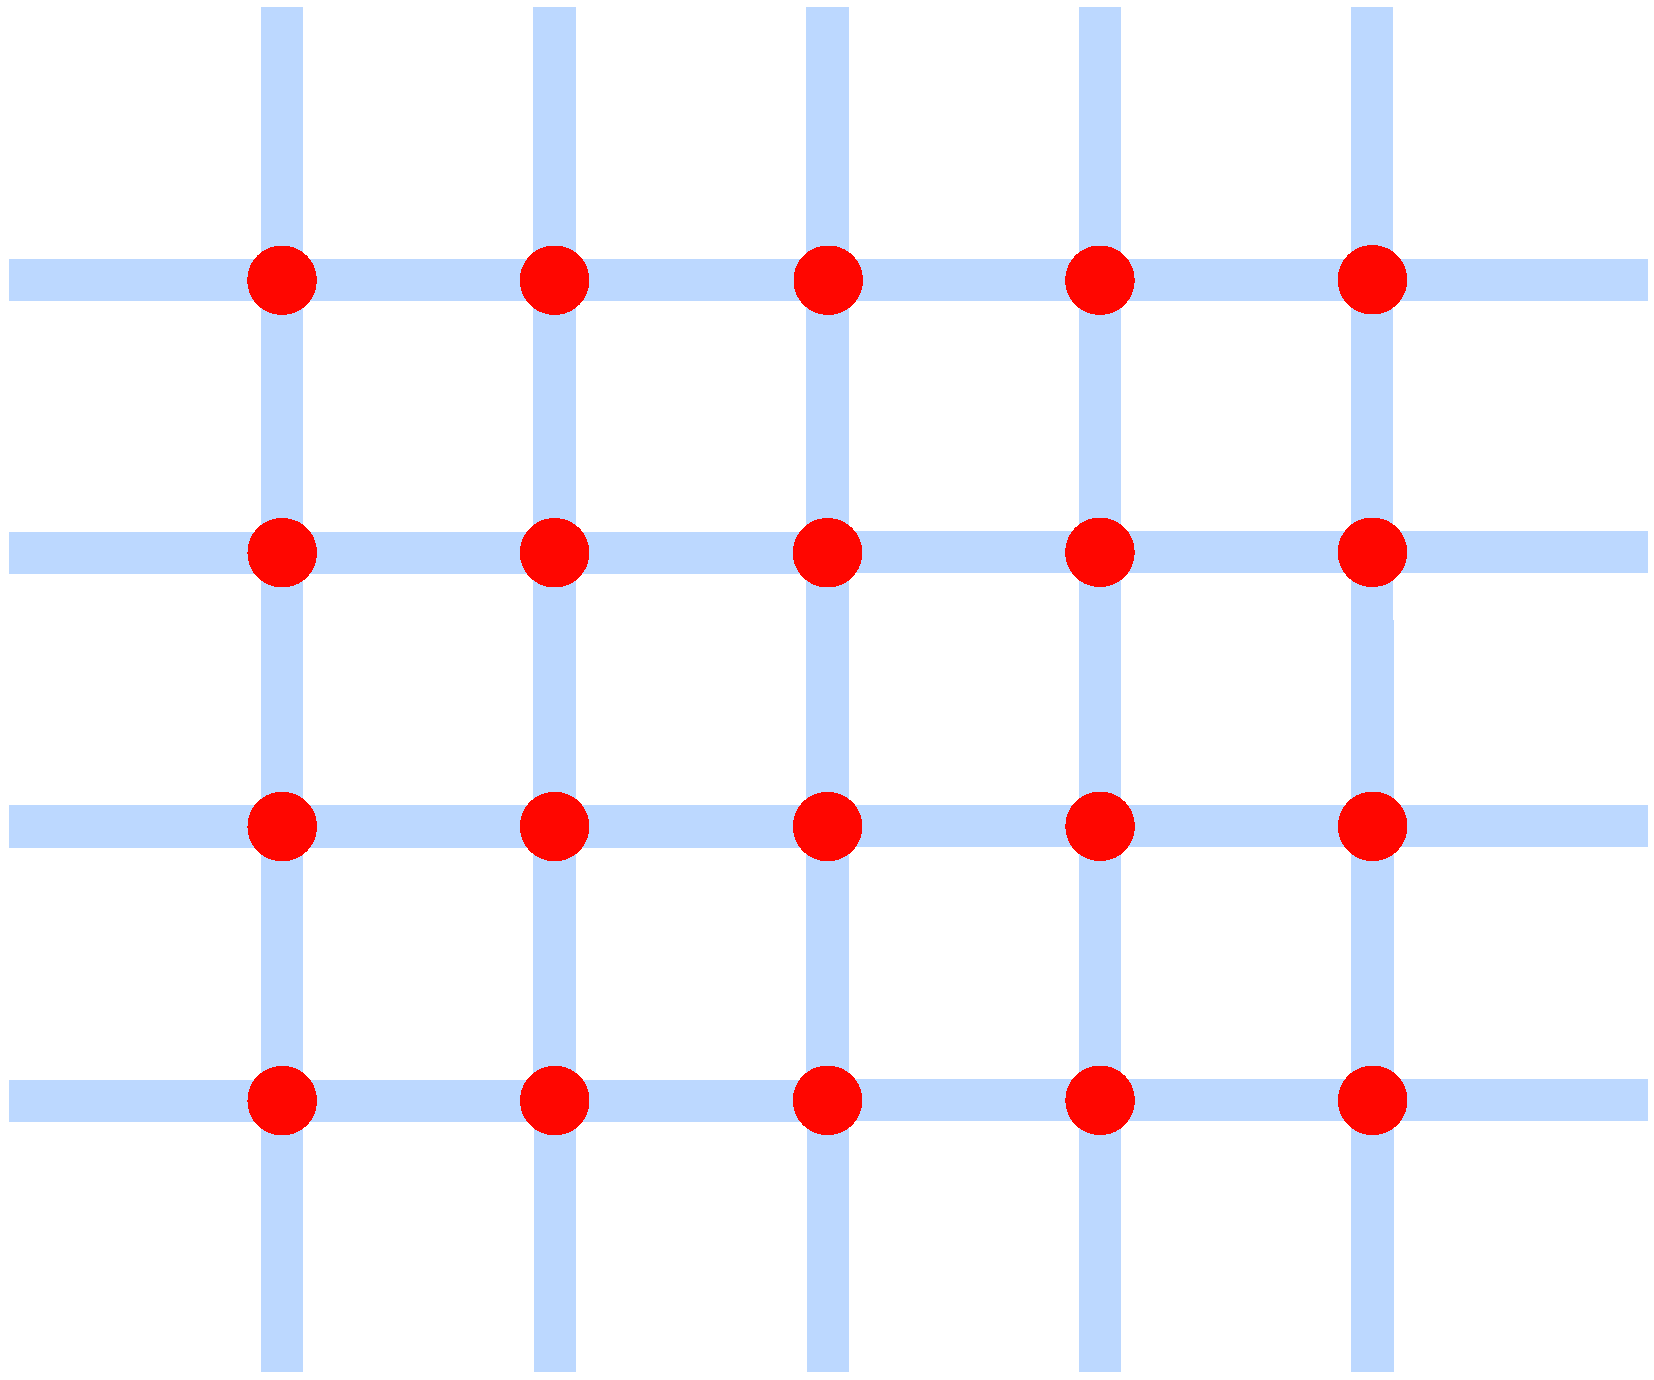
We represent a porous medium as a system of intersecting capillaries, as shown in
Figure 6. Such a two-dimensional structure was proposed in [
26] and used in [
27] to calculate oil displacement by water. We assume that the gas–liquid interface in a pore throat is a simply connected surface. There is no the liquid behind the interface in a pore throat. All capillaries of the structure in each of the direction have the same length
. We assign indices
to each node so that its coordinate can be evaluated from relations
and
. Assume that the velocity of the liquid depends on the length of the capillary, the pressure on its ends and a parameter
. The latter is determined via the diameter and other properties of the capillary. There is a drop of pressure on the gas–liquid interface. This pressure drop equals the capillary pressure (see Equation (
1)). If capillary pressure is constant, we may add the capillary pressure to the gas pressure Pa and ignore for the sake of simplicity.
We introduce the variable that equals one if the node is filled with liquid, and zero if it is filled with gas. In what follows, we will assume that each node filled with gas is connected to the gas cap by capillaries (also filled with gas). In this case, the pressure in each such node is .
The velocity of the liquid in the vertical capillary connecting nodes
and
is given by the relation
where
is the
z-coordinate of the gas/liquid interface inside the capillary connecting nodes
and
.
Similarly, we calculate the velocity of the liquid in the horizontal capillary connecting nodes
and
with relations
Here,
is the
x-coordinate of the gas/liquid interface inside the capillary connecting nodes
and
.
We assume that the liquid does not accumulate inside the nodes. Hence, we obtain the conservation relation
Substituting the expressions for
v and
u (
23), (
24) into Equation (
25) with
we obtain
The continuous analog of Equation (
26) is
Equation (
27) is equivalent to Equation (
3), so the latter is approximated by Equation (
26).
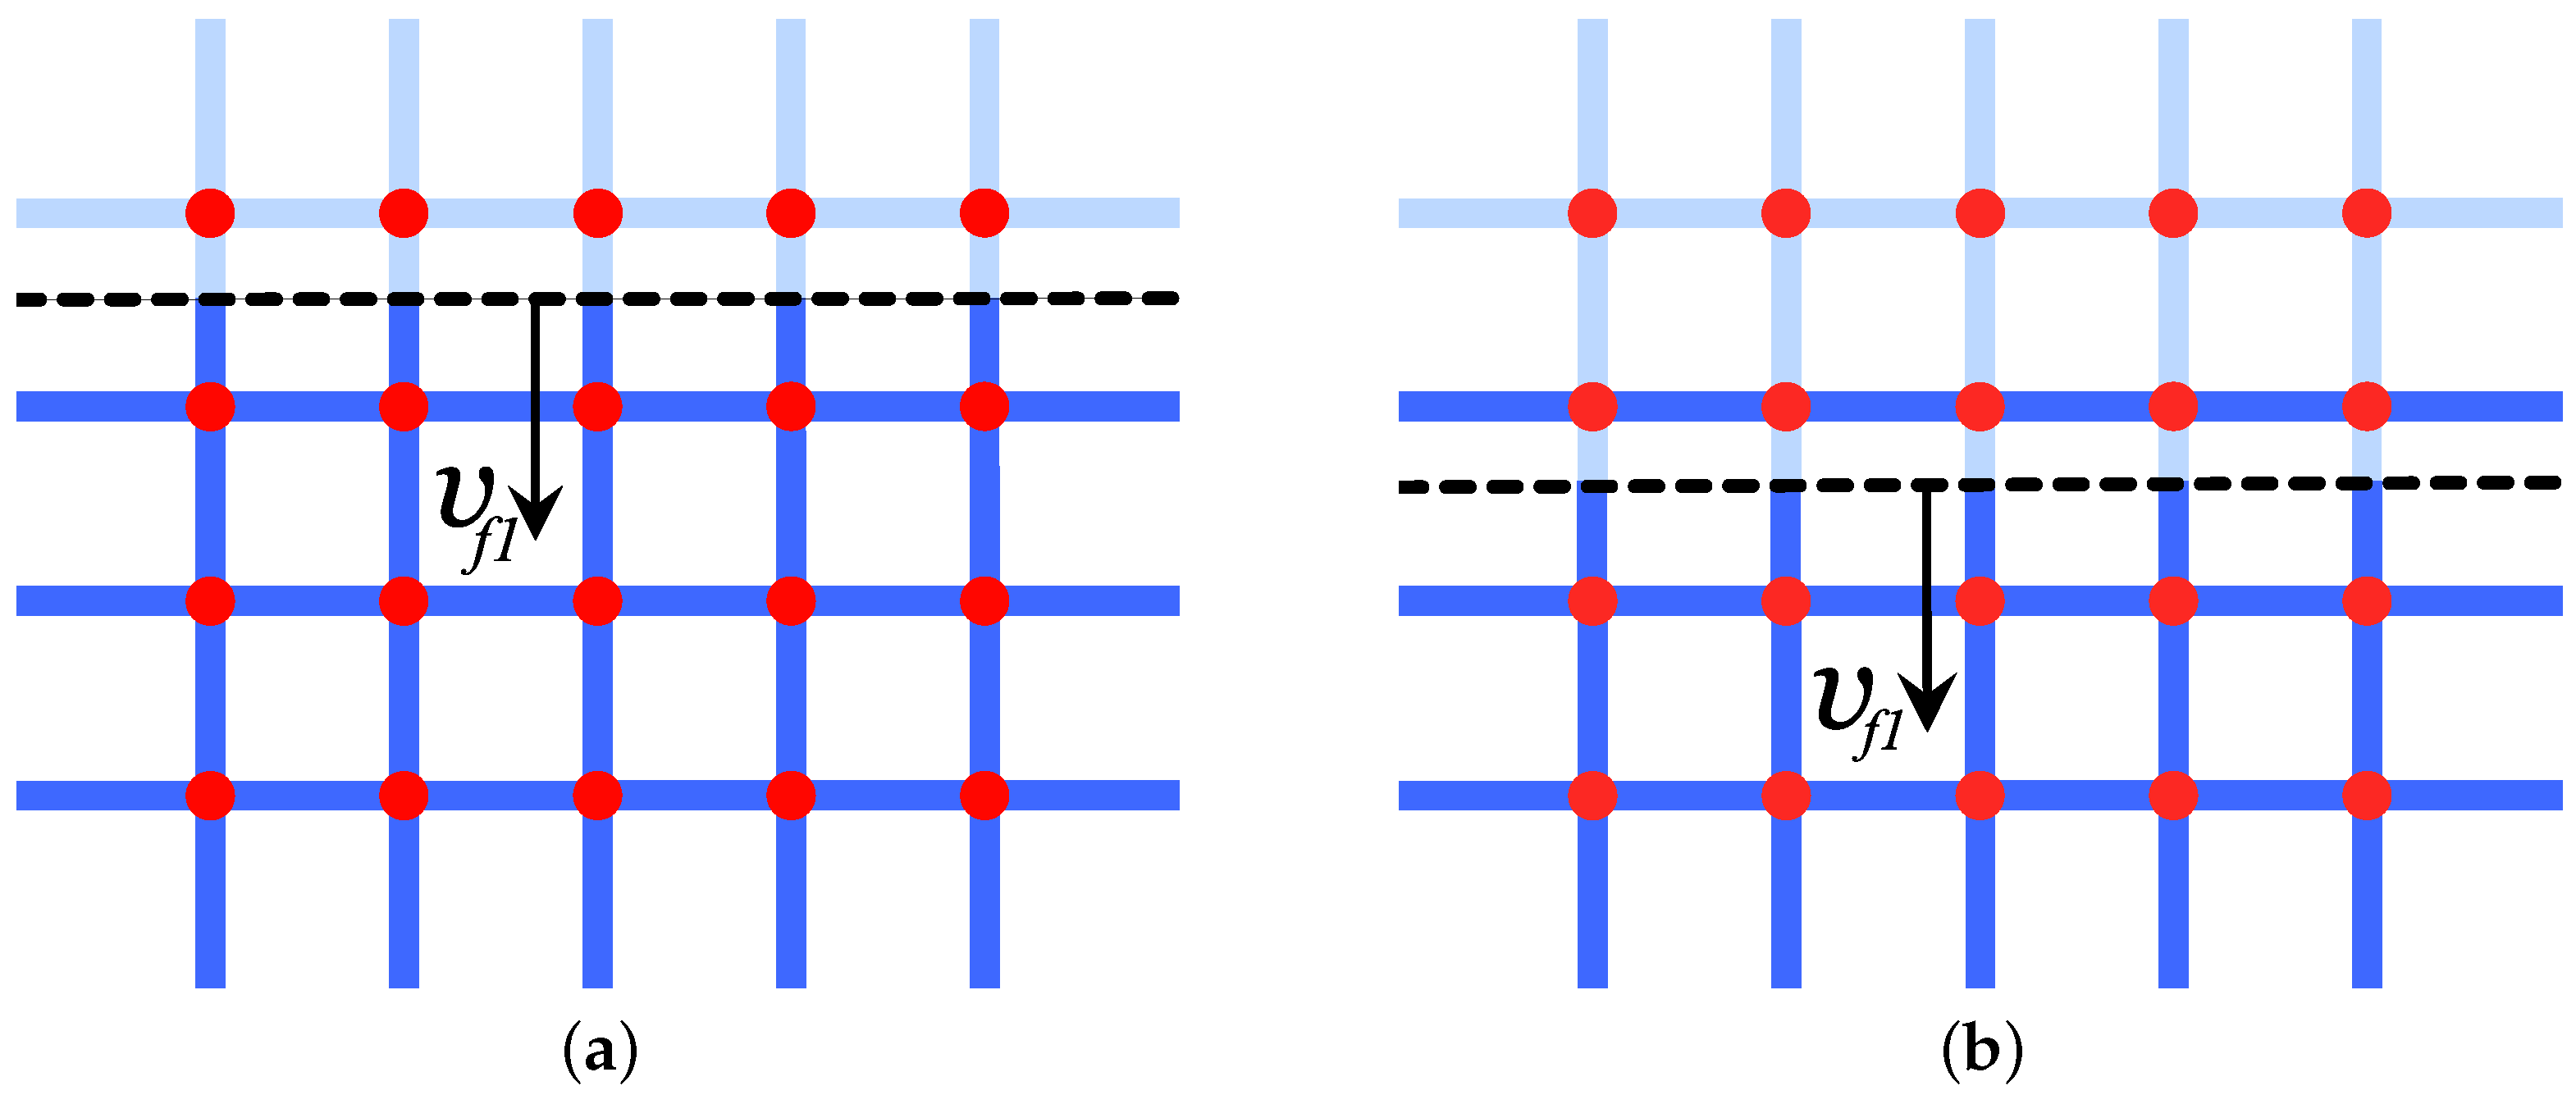
To determine the velocity of the gas/liquid interface, we need to calculate the liquid velocities in those capillaries that are not completely filled with liquid, as shown in
Figure 7.
Inside the capillary, connecting nodes
and
, shown in
Figure 7, liquid between points
A and
B have the velocity
where
is the distance between points
A and
B. Similarly, the gas/liquid interface at the point
C between nodes
and
has the velocity
where
is the distance between points
A and
C.
If the stencil shown in
Figure 7 is used to solve the continual model system (
19) numerically, then the last equation of this system implies that the normal velocity of the interface
is determined by the expression
where
The intersection point of the
segment with the vertical capillary connecting nodes
and
moves with velocity
and the similar point on the horizontal capillary connecting nodes
and
moves with velocity
From these expressions, it follows that
so the network model under consideration predicts a lower interface propagation velocity than the continual model does.
The exception is when the interface is parallel to the capillaries, as shown in
Figure 8. In this case, both of the models give the same value of the interface velocity
However, significant differences between the network and continual models remain. Within the network model, the velocity of the liquid in vertical capillaries is
, while in horizontal capillaries the liquid is at rest. The liquid inside horizontal capillaries is not displaced by gas when the contact surface moves, as shown in
Figure 8. On the other hand, the continual model assumes complete liquid displacement.
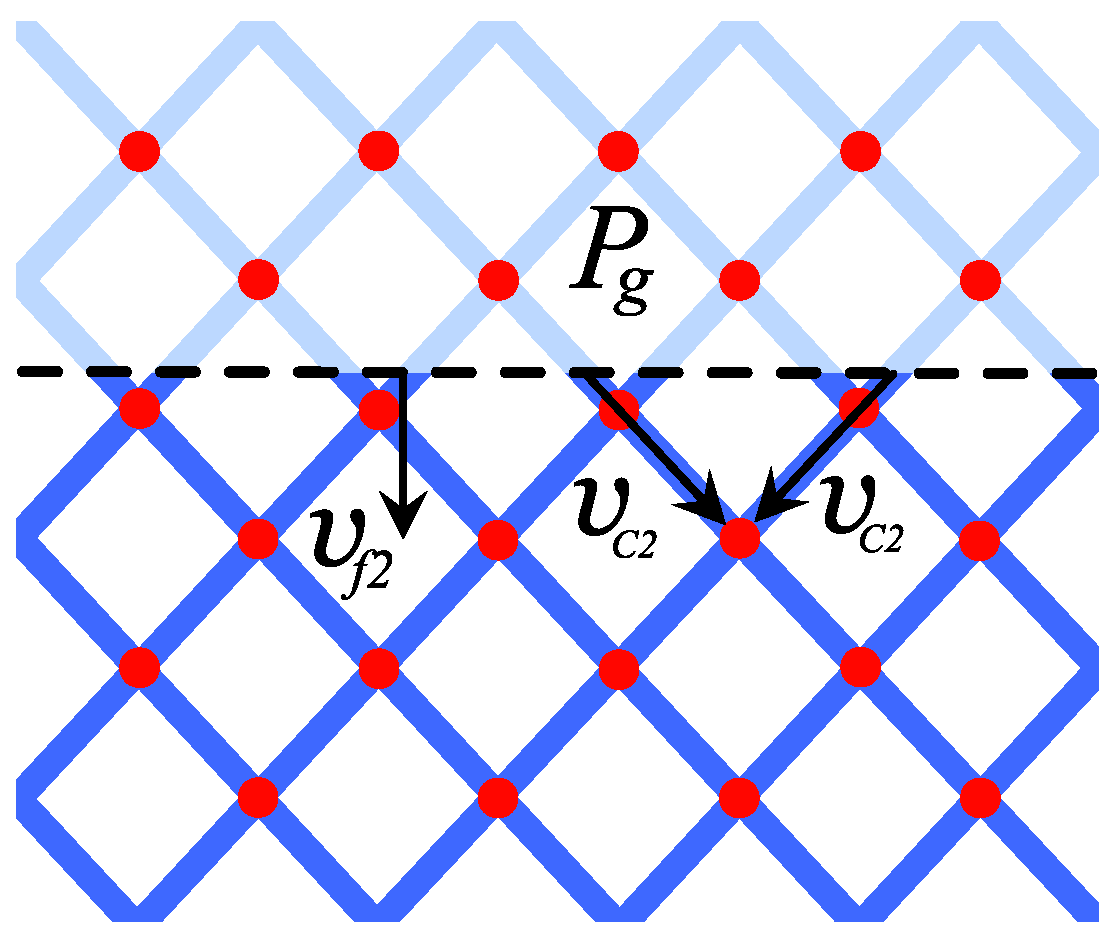
If the flat contact surface is located relative to the capillaries, as shown in
Figure 9, then the liquid velocity in any capillary is
The
z-component of this velocity, i.e., normal velocity of the line segment connecting the interface points, is
In this case, the liquid is displaced from all capillaries located above this line.
Thus, the considered capillary model exhibits strong anisotropy. The velocity of the flat contact surface can vary by a factor of two depending on the angle between the direction of interface propagation and the capillaries. The average mass flux in the direction of the
z-axis is the same in both models. In this sense, the considered network model is isotropic. In the case shown in
Figure 8, the contact surface has twice the velocity as in the case shown in
Figure 9; however, in the first case, only half of the liquid is displaced.
When the shape of the gas/liquid interface is not flat, the problem reduces to the numerical solution of the system of the linear algebraic Equation (
26). The number of equations in the system is equal to the number of nodes with unknown pressure.
This system has a sparse band matrix with five non-zero elements in each row, three of which are on and on either side of the main diagonal. We use the library SuperLU to solve this system of linear algebraic equations (SLAE) numerically.
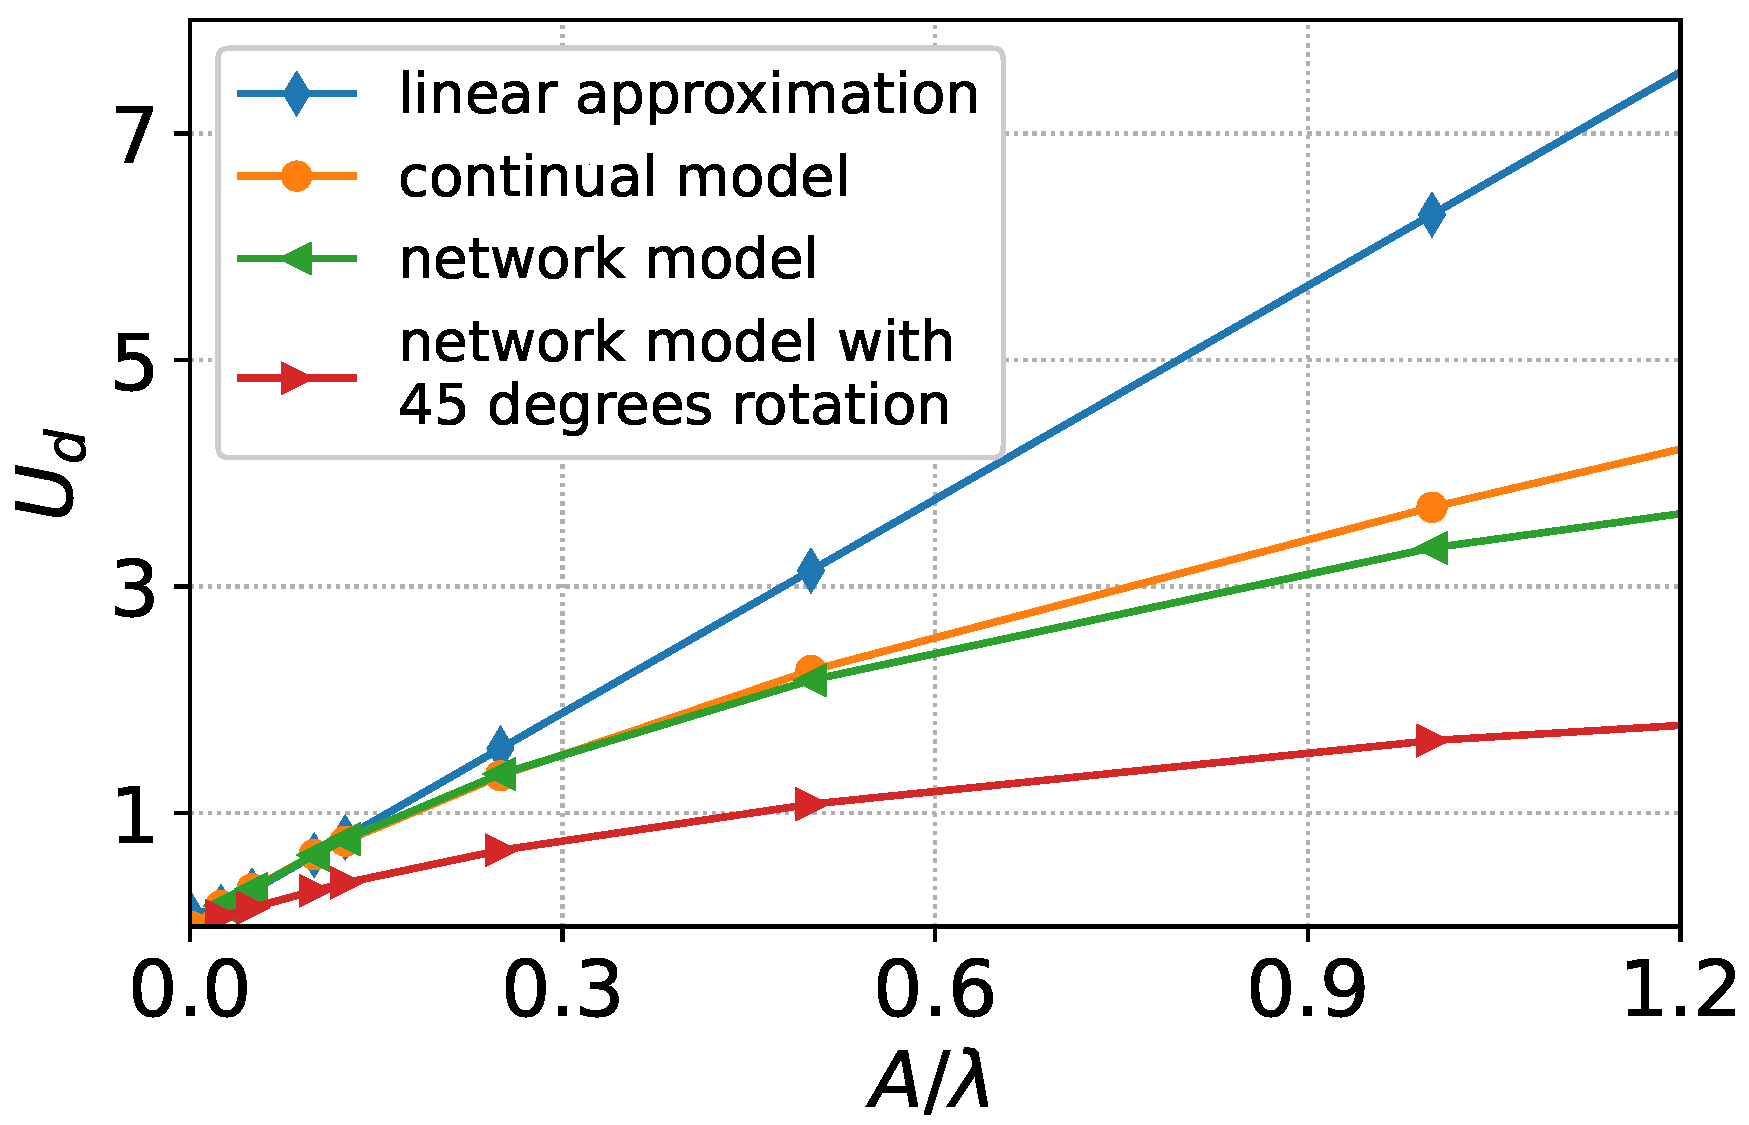
We consider the case
,
,
,
and
. Within the linear approximation, the growth rate of the perturbation amplitude can be evaluated by the formula (
14). In
Figure 10, we show the results of calculating the amplitude growth rate depending on the ratio
within the models mentioned above, as well as in linear approximation. The continual model predicts, as discussed above, lower velocity values.
We show that the network model has a discrete analogue of the anomalous shortwave instability. Consider the simplified network model shown in
Figure 11. The network consists of one row of nodes with vertical coordinate
, and each node is connected with an interlayer by capillaries of length
H. The pressure inside the interlayer is
. Inside the capillaries connected to nodes from above, the height of the liquid is
for the first node and
for the others. The pressure at the gas/liquid interface is constant and equal to
. The total number of nodes is
N.
For the first node, we have Equation (
26) in the form
For the
N-th node we have
and for intermediate nodes with
Equation (
26) gives
In the case of
from Equations (
28) and (
29) we obtain
If
and
, from (
31) we obtain
where
is the absolute value of the velocity of the gas/liquid interface inside the upper capillary of the first node. In the case
,
and
, we have
From (
32) and (
33), it follows that the liquid velocity inside the upper capillary of node 1 increases by 1.5 times with decreasing
from
to 0 if the liquid height in neighboring nodes is constant and equal
. The relative change of the liquid height is small compared to
h.
The shortwave perturbations occurs when
,
, and
. In this case, if
, we obtain
and the value
in this limiting case increases indefinetly with an increase in the number of nodes
N according to the expression
Thus, the considered simplified network model with one row of nodes predicts an unbound increase in the growth rate of perturbations with decreasing wavelength.
The sophistication of the model by adding another row of nodes (see
Figure 12) does not lead to a significant results change. For example, for the case shown in
Figure 11 we obtain
, and
for the case shown in
Figure 12. This estimate is made for
,
,
, and
. In the limiting case, when
,
, and
, the result (
35) stands.
If the perturbation curvature radius near the perturbation vertex is comparable to the capillary length
, then the height of the liquid column in neighboring vertical capillaries may vary significantly, as shown in
Figure 13b. The fewer capillaries used in the network model, the greater this change. The results obtained above predict that the smaller the ratio of the heights of the liquid column in the right vertical capillary and the neighboring one, the greater the liquid velocity in the right capillary. In
Figure 13a, the height of the liquid column in the right vertical capillary differs slightly from the height in the neighboring capillary. In
Figure 13b, the height of the liquid column in the right capillary is several times less than in neighboring capillaries. As shown below, the calculations confirm that the interface velocities in the right capillary are significantly different for the cases shown in
Figure 13a,b. We note that the positions of the perturbations differ only in the distance from the vertex to the nearest horizontal capillary filled with liquid.
In
Figure 14, we show the dependence of the perturbation vertex growth rate
on the number of capillaries per perturbation wavelength. The results are presented for two positions of the vertex of the perturbation relative to the capillaries shown in
Figure 13. When the number of capillaries exceeds 300, the difference in the velocity values turns out to be less than 10%, but when the number of capillaries is 40, the velocities differ by almost a factor of two.


 ,
, 