1. Introduction
In globally dispersed production economies, supply chain management systems have necessarily become more dynamic and complex [
1]. Enterprises today must compete using their supply chains as essential components of their strategies. However, such cooperation is not always continually successful or stable due to reasons attributable to what we can today see as lack of resilience [
2]. Moreover, the same enterprise may be involved in multiple supply chains, resulting in multi-level network structures.
Where most enterprises tend to implement a global purchasing and selling strategy and have supply chains that are distributed around the world, risks such as poor supplier financial health, supplier distortion of capabilities, and conflicting objectives (amongst other issues) can trigger serious supply, quality, performance, and inventory breaks [
3]. Following the Japanese magnitude 7.3 earthquake in 2016, the surrounding high-tech manufacturing industry was unable to provide parts to Toyota (Sony and Honda were other notable firms), causing the operation to suffer losses of up to USD 277 million [
4]. Schaeffler produces roller bearings and linear motion products and is the only needle roller supplier to numerous auto OEMs. During 2017, the company had to cut off its supply due to environmental protection factors and requested the relevant government department to give the supplier a three-month transition period to allow Schaeffler to switch its suppliers [
5]. The implication of this component stock-out potentially meant the full suspension of production of more than 200 models from 49 auto OEMs, with over 3 million vehicles not able to leave the factory. The outbreak of COVID-19 caused a sudden interruption of the global supply chain, which had a great impact on the profitability and sustainability of some supplier companies, especially in emerging economies [
6]. At the time of writing, in 2022, the COVID-19 pandemic is causing lockdown restrictions, including suspended production; the full global impact of this has yet to be fully realized.
Numerous studies have shown that risk propagation in the supply chain is mainly the process by which the behavior of a node enterprise is transmitted to its adjacent nodes [
7].
However, an important limitation of such studies is that they have performed the analyses only on the types of networks or on simple examples of supply chain networks, as pointed out by Ivanov and Sokolov [
8]. Of importance to practicing supply chain managers is a requirement for data in advance or dynamically about how many entities are infected by a potential risk and where it is in the supply network [
9]. Comparatively, risk propagation has attracted less attention in the literature. Varthini R et al. [
10] asserted the great value and significance in studying the mechanism of risk propagation and the control of supply chains and argued for an interdisciplinary approach to understand how supply networks behave and evolve. This study aims to bridge the above research gap.
More recently, various literature related to the SIR epidemic model with nonlinear incidence has been investigated; for example, Buonomo et al. [
11] investigated the global stability of the endemic equilibrium with the use of an appropriate Lyapunov. The risks in the supply chains have some similarities with the propagation development seen in infectious diseases.
Table 1 lists some similarities of the risk propagation between supply chains and infectious disease.
The simulations in this paper are calculated using R, where the fundamental unit of shareable code is the ‘package’. To facilitate sharing, the ‘R package’ bundles code, data, documents, and tests together. The data structure of the mathematical graphs in these packages is slightly different, and we build up our package based on the data structure of the package “network”. The “network” package stores a network as an edge list, which saves storage space for a network, compared with storing a large adjacency matrix. It is also flexible in that we can add attributes for the vertices and edges of the network, and this can facilitate the storage of additional information for a geometric graph and supply chain risks, such as the locations of vertices and the transition steps of the risks. It also provides a set of functions to visualize a network from which we also benefit in our package.
To date, no study of supply chain network analysis has captured risk propagation performance dynamically or discussed the control methods of networks using SIR. The existing static SIR model cannot describe the dynamic, complex interaction between nodes in the supply chain. The research presented in this paper addresses this problem.
The case focus in this study is a major Chinese car maker; in recent years, China’s automotive market has been gradually opening to foreign investment, and many automotive companies have chosen China to set up factories. According to the China Automotive Association, the average value of China’s automotive production and sales in the past five years was about 27 million [
12]. China’s automotive industry has now become the world’s largest automotive producing country. Due to the vast numbers of parts required and the high degree of industry collaboration, supply chain complexity introduces risks and disruptions. Supply chain managers can rely on the results of this study to dynamically predict and identify the risks and provide the corresponding measures to improve the supply chain resilience.
This paper combines complex network systems and epidemic SIR modeling approaches to construct models and analyze the risk propagation in an automotive supply chain. In this paper, we (i) conduct an in-depth exploration of the risk propagation mechanism, elucidating the key factors affecting risk propagation in auto supply chains, and visualize the change; (ii) extract key information from the simulated epidemics in order to understand how the number of different types of node enterprises changes and how the risks evolve; (iii) explore how control measures can ensure the healthy and orderly operation of the entire supply chain. We pursue these objectives using computational modeling with an R package and a network analysis approach.
The remainder of this article is organized as follows. Firstly, the theoretical foundations and hypotheses are presented. Secondly, our research design and methodology are described. Following that, the analysis, results, and implications of our findings are discussed. Furthermore, an application of the framework is shown with the case study on the automotive industry in China. Finally, conclusions and directions for future research are presented.
2. Literature Review
The development of supply chains is no longer a simple linear connection between node enterprises. There are extensive and intricate relationships in the network structure of supply chains, which can be abstracted into a complex network structure. If any node enterprise changes, the related enterprises are affected and may change accordingly, thus potentially affecting the stability of the whole supply chain network. This type of structure is represented by dynamic models, often employing agent-based (AB) modeling, which are used to examine real-world supply network structural dynamics. Complicated cause and effect, nonlinearity, entity heterogeneity, and supply network structure over an extended time range can be solved by agent-based models [
13]. Several enterprise levels can be captured by these models [
14], including firm- and network-level behaviors as well as sustainability-based metrics over time.
Risk propagation refers to the spread of both endogenous and exogenous risks from one organization to other organizations through the supply network [
15]. Work on the propagation of risk in supply chains has focused on the method or mode of risk transfer, and the process of risk itself [
16], whereas other scholars have studied the propagation mechanism of the supply chain risk [
17]. Some complex network evolution models of un-weighted, undirected, and weighted directed graphs are constructed in the agricultural product supply chain [
18]. Computational models based on multi-agent simulation or Petri net theory [
19] can also serve as valuable proxies in understanding possible risk propagation patterns using complex designs that mimic real-world supply networks. Ai Genyun et al. [
20] conducted relevant research on the evolution of the regulations of the supply chain risk, believing that response time and the convergence coefficient of each enterprise jointly determine the controllability of the supply chain. Considering the interdependence of the risks, some risk propagation models based on the Bayesian network can evaluate specific risks in the supply chain, and some corresponding control measures should be taken according to the different supply chain environments [
21].
The mathematical transmission model of the smallpox virus can be traced back to 1760 [
22]. In 1911, Ross [
23] laid the foundation for the study of the malaria transmission process to study the dynamics of infectious diseases in the future. As a solid foundation, epidemiology and evolutionary biology models play a crucial role in the study of risk diffusion in complex networks [
24]. Indeed, epidemiological models have been applied to simulate the spread of risk in complex network environments in previous studies. Examples include the spread of infectious diseases in biological systems, the spread of computer viruses in the internet, and grid failures in power systems [
25]. The risk spread of pandemic models is widely used in finance, with contagion caused by shocks to complex financial networks [
26]; how to use the SIR epidemic model to develop contracts that minimize procurement and social costs after disasters is considered [
27]. Despite the SIR epidemic model being well developed, it has not been used for the risk propagation mechanism in the automotive supply chain. The model can be used for risk analysis and forecasting due to the association with the nature of risk propagation.
The SIR model is the most classic model in epidemiology for studying the spread of infectious diseases. The hosts in a closed system are divided into three compartments: susceptible, infectious, and recovered. A susceptible host may be infected by infectious hosts, and the infectious hosts may also recover before infecting other hosts. The SIR model has been largely implemented in R, and there are well-built packages to implement it, such as EpiModel [
28] and EpiDynamics [
29]. However, the majority of the packages rely on the assumption that the hosts in the closed system are inter-connected with every other host, which is not true in the supply chain framework. Therefore, this paper contributes by generalizing this assumption. We allow node companies to only connect to the node companies with which they have a business relationship, through which the risk propagates. We put this connection in the network framework.
Most studies mainly use qualitative methods to study supply chain risk control, while a few quantitative studies on the risk control have been researched [
30]. The most relevant work has tended to identify the risks following an operational model of supply chains and then studied the risks caused by uncertain factors, evaluated them, and proposed corresponding risk control measures [
31]. In complex networks, random immunity, target immunity, acquaintance immunity, contact immunity, artificial immunity, and priority immunity are the common approaches to solving medical, computer network, and supply chain quality management problems [
32]. The immune strategies appearing in the risk propagation and the control of the supply chain are the research gap. This study not only studies the supply chain risk of the automotive manufacturing industry, but also explores its risk control and puts forward corresponding control measures.
3. Methodology
3.1. Complex Network Modelling
Erdos and Renyi (1960) proposed random graph theory for the first time in their research, and the study of complex networks was carried out accordingly. It has two main characteristics: node complexity and relationship complexity. In a complex network, the degree of a node
vi is the number of edges directly connected to it, denoted by
ki. Nodes with a degree of 0 are called outliers. Normally, the nodes with more degrees in the network are more important than the others. Because it is connected to a large number of nodes, there are many ways to infect other nodes. When the risk spreads in the network, it is very valuable to focus on the nodes with more degrees in the network. The average degree in the network refers to the average value of the degrees of all the nodes in the network, which is represented by <
k>.
where
zij indicates the connection relationship between two nodes, 0 means not connected, and 1 means connected.
3.2. SIR Modelling
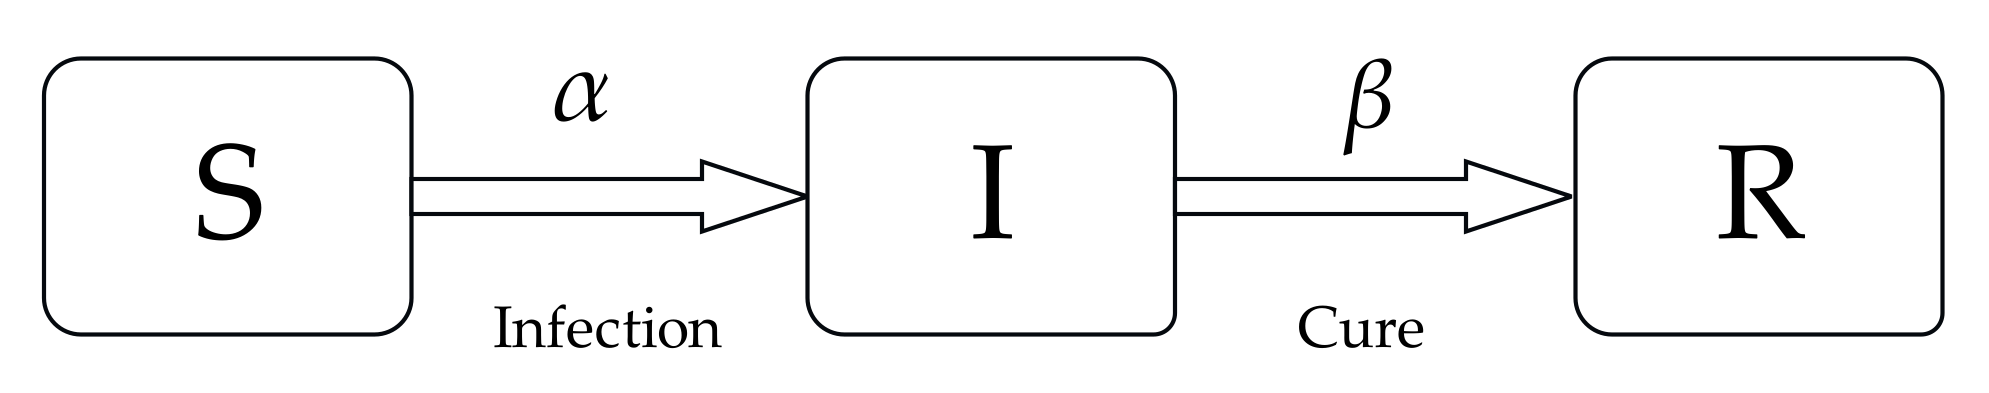
SIR modelling is a common model in investigating the dynamics of complex networks and propagation. The SIR model is often used to study diseases that will not be infectious after being cured, such as chicken pox. In this model, node states are divided into the following three categories:
S (Susceptible)—Susceptible state nodes, which are in a healthy state but have the possibility of being infected.
I (Infected)—Infected state nodes, which are in an infected state and can pass risk to their neighboring nodes.
R (Removed)—Immune state nodes. There are two states for this state node: one is that the node has recovered and is immune and will not be infected; the other is that the node is removed from the network due to death.
Each node must be one of the above three states, but the node in the immune state cannot infect other nodes, and it has also acquired permanent immunity. Some infected nodes acquire permanent immunity after being cured.
In the model below,
α represents the probability that a node in a susceptible state is infected and becomes an infected node,
β represents the probability of an infected node being cured and gaining immunity to become an immune node.
S(
t),
I(
t), and
R(
t), respectively, represent the proportion of nodes in susceptible, infected, and immune states at
t. The infection mechanism of the SIR model is shown in
Figure 1. The differential equation representation of the SIR model is:
3.3. Model Development
Based on the SIR model, this paper establishes a risk propagation model for the automotive manufacturing supply chain. Due to the fact that the anti-risk capabilities and business volume of each node enterprise are different, the automotive manufacturing supply chain network to be constructed is an undirected network with weights. When a certain node enterprise in the network encounters a risk, the risk will spread through the business transactions between the nodes, so that the node companies with which it has a business relationship will be infected first. As a result, it spreads to the surroundings, threatening the stability of the entire supply chain system. According to this basic propagation rule, this paper describes the propagation evolution of the supply chain risk in the automotive manufacturing industry.
3.3.1. Model Assumptions
- (1)
At the same time t, the node can only be in one of the three states. During the state change of a node, no node can directly change from a susceptible state to an immune state; it must go through an infected state. In addition, when risks spread in the automotive manufacturing supply chain, the risks faced by node companies in the supply chain can only come from one neighboring node at a time.
- (2)
All node companies in the supply chain are likely to be infected by neighboring nodes. However, the anti-risk capabilities of each node enterprise are different, and the edge weights between the connected nodes will be changed due to different business volumes. Therefore, it has an impact on the input and output of the risks.
3.3.2. Parameter Determination
- (1)
Determination of infectious rate parameters
The object of this paper is an undirected network with weight. The weights of the edges are mainly based on the business volume between nodes. When the risk is introduced, the risk infection rate will change dynamically due to the change of the edge weights. When selecting the next infected node, the amount of business transactions between the two nodes is mainly considered. The greater the amount of business transactions, the greater the possibility of infection. Where
i is the node at risk, node
i is connected to node
j, and the risk interference function of node
j is defined as
. The expressions are as follows [
33]:
in the formula:
—Initial risk value.
—The ratio of the edge weights of node i and node j to the sum of the edge weights of all nodes connected to node j.
y—Represents all nodes connected to node j.
- (2)
Determination of recovery rate parameters
In the process of risk propagation, enterprises have a certain capacity to resist risks. The vulnerability of a node is an important indicator of its ability to resist risks. Generally, the higher the node’s vulnerability, the weaker its ability to defend itself against risks, and vice versa. In this paper, the reciprocal of the degree of node vulnerability is used to indicate the ability of the node to defend itself against risks. It is mainly considered from two aspects: one is to consider the importance of the node in the network; the other is the connection relationship between one node enterprise and the others.
in the formula:
Ce(
i)—Node importance index;
θ—Main eigenvalues of the network adjacency matrix;
ej—The corresponding eigenvector;
aij—Represents whether there is business communication between nodes. The logical variable 1 means yes, 0 means no.
sk—Node enterprise weight, which is determined by the node degree and the total number of edges in the automotive manufacturing supply chain network;
k— Represents the degree of node enterprise;
di—The number of edges in the supply chain of the automotive manufacturing industry;
ω(i)—Comprehensive vulnerability evaluation value of node i.
During the process of risk propagation, if the infection rate of the transmitted node is lower than the recovery rate, the node will not be infected by the risk, and then vice versa. The risk interference state function
during the node output can be expressed as follows:
In the formula, represents the risk value of the incoming node i.
6. Discussion and Managerial Implications
Based on the analysis and simulation of the structure and characteristics of the automotive manufacturing supply chain, the risk control strategy proposed in this paper mainly includes three aspects: supply chain node companies, supply chain networks, and the social environment.
6.1. Supply Chain Node Enterprises
- (1)
Establish a risk precaution system and standardize corporate management
The node companies in the supply chain should comprehensively inspect the existing infrastructure and risk control system and effectively identify and evaluate potential risk factors. A sounder risk precaution system should be established to reduce the risks caused by unstable factors. In addition, enterprises should improve the corresponding regulations, operation guidebooks, etc., so that the management of the enterprise can be followed and the workers’ operations can be instructed. Regular training should be carried out within the enterprise to strengthen the employees’ risk awareness and regulate the workers’ operations processes to minimize the risks caused by human factors.
- (2)
Scientifically select risk control programs
The node enterprises can make reasonable use of the existing risk assessment models in combination with their own actual conditions and initially estimate the probability of risk occurrence and the loss caused by the risk. Based on their actual anti-risk capabilities, they can choose a risk control plan scientifically.
- (3)
Dynamic adjustment of risk control strategies
Due to the uncertainty and diversity of the risks in the supply chain of the automotive manufacturing industry, the node companies should adjust and update risk control measures in a timely manner in order to improve the continuous immunity to risks.
6.2. Supply Chain Network
- (1)
Reasonable selection of partners
Among the most essential tasks of supply chain management is to strengthen the relationship management of each node company in the supply chain network. It can comprehensively inspect the credit and operating conditions of the cooperative enterprises and select high-quality partners. For the companies that need to maintain long-term cooperation, they should establish strategic partnerships, make full use of the advantages of cooperative competition, and realize benefit sharing.
- (2)
Strengthen the sharing and transmission of information
In order to ensure that each enterprise has evidence to follow when making decisions, the enterprises must pass real and effective information in a timely manner. Information exchange and sharing among related companies in the network should be enhanced. This can effectively reduce the risk loss caused by information factors and thus enhance the overall strength of the supply chain.
- (3)
Improve supply chain resilience
The resilience of the supply chain refers to the ability of the supply chain to recover to the same level as before the supply chain was interrupted by risks. Due to the complexity of the automotive manufacturing supply chain network, risks can easily cause large fluctuations. In order to enable the automotive manufacturing supply chain to recover within a short time after encountering sudden risks, the overall supply chain can be improved by eliminating unreliable structures in the chain, optimizing supply–demand matching between enterprises, and reducing potential supply chain losses.
- (4)
Increase trust between enterprises
Due to the close cooperation between the various nodes in the automotive manufacturing supply chain, the supply chain system may not function properly due to the sudden withdrawal of a node. In order to effectively prevent such incidents, it is possible to increase the exit cost of the enterprise, increase the trust of each enterprise, and strengthen the control of the upstream and downstream node enterprises.
6.3. Social Environment
- (1)
Establish a credit evaluation system
In order to make an accurate assessment of the companies in the supply chain, it is possible to make full use of the existing social credit system and evaluate them in all directions. It can comprehensively consider the company’s operating mode, financial status, company size, etc. Therefore, it will be easier to make an objective evaluation and to establish corresponding credit files which are reasonably and effectively shared via the internet. This not only disciplines the company, but also provides a reference for other companies when selecting a quality partner.
- (2)
Establish a reward and punishment mechanism
A third-party industry platform can be established to reward credit-compliant businesses and punish those that fail to maintain compliance. In order to regulate the enterprise’s own behavior and reduce the risks caused by credit factors, the trustworthy enterprises will obtain corresponding competitive advantages and rewards.
7. Conclusions and Future Work
Owing to the complex and changeable market environment, modern enterprises are increasingly carrying out corresponding operation strategies, and the industrial competition has gradually developed into the competition between their supply chains. Accordingly, major enterprises have adopted a zero-inventory strategy and lean production to give full play to the advantages of the supply chain and to outsource a large number of non-core businesses to suppliers. This can effectively improve the competitiveness of enterprises. Meanwhile, they have to face various potential risks at the same time. Once the outbreak risk is not controlled in time and effectively, the whole industrial supply chain may stop running, and the enterprises in the supply chain will suffer huge losses. Obviously, it is crucial to study the supply chain risk and health control.
First, based on a complex network, the research on the supply chain network is transformed into an indirect network with weights. Then, based on the characteristics of infectious disease propagation, the SIR model was selected to model the complex interactions among the nodes to understand the risk propagation in a supply chain over time.
Second, this paper analyzed the dynamic changes of risk in the supply chain, effectively predicting which companies may be affected, and this achieves the goal of preventing problems before they occur. This study is the first to use the R package to model risk propagation in the supply chain. In addition, this paper also analyzed the dynamic changes of the infection rate and recovery rate, different numbers of the same initial risk sources, and how the changes affect the spread of risks.
Third, immunity strategies to control risks were introduced and effective control measures were proposed in this paper. Using a large, high volume automotive manufacturer as the case, the study reflects the model’s feasibility and applicability.
Finally, we made recommendations for how managers in organizations could utilize these models and simulations for the quantification and mitigation of risk. Using the proposed SIR model, managers can effectively use the dynamic chart of risk propagation and adjust their manufacturing system strategies, operations, and management while clearly knowing the risks of different times and how different node outbreaks spread. It is concluded that improving the firm’s ability to withstand the risks can effectively inhibit the spread of risk.
The limitations of this work are related to being able to confidently model a very complex system. The R package is used to represent the risk reduction view, which simplifies the supply chain model in this paper. It does not consider how risks are cross-transmitted when different types of risks occur simultaneously. Moreover, the risk is not identified and assessed and the business volume and the supply and demand relationship between the node enterprises are simply considered. According to the actual situation, the corresponding evaluation index system can be established by using quantitative methods to identify and evaluate the potential risks (e.g., FMEA) in order to make the research content more comprehensive and scientific. Future research opportunities include testing multiple models and forms of structural visibility (e.g., inverted-U).


