
Numerical Modelling and Experimental Validation of Novel Para Winglet Tape for Heat Transfer Enhancement

 , , , and
Abstract
:1. Introduction
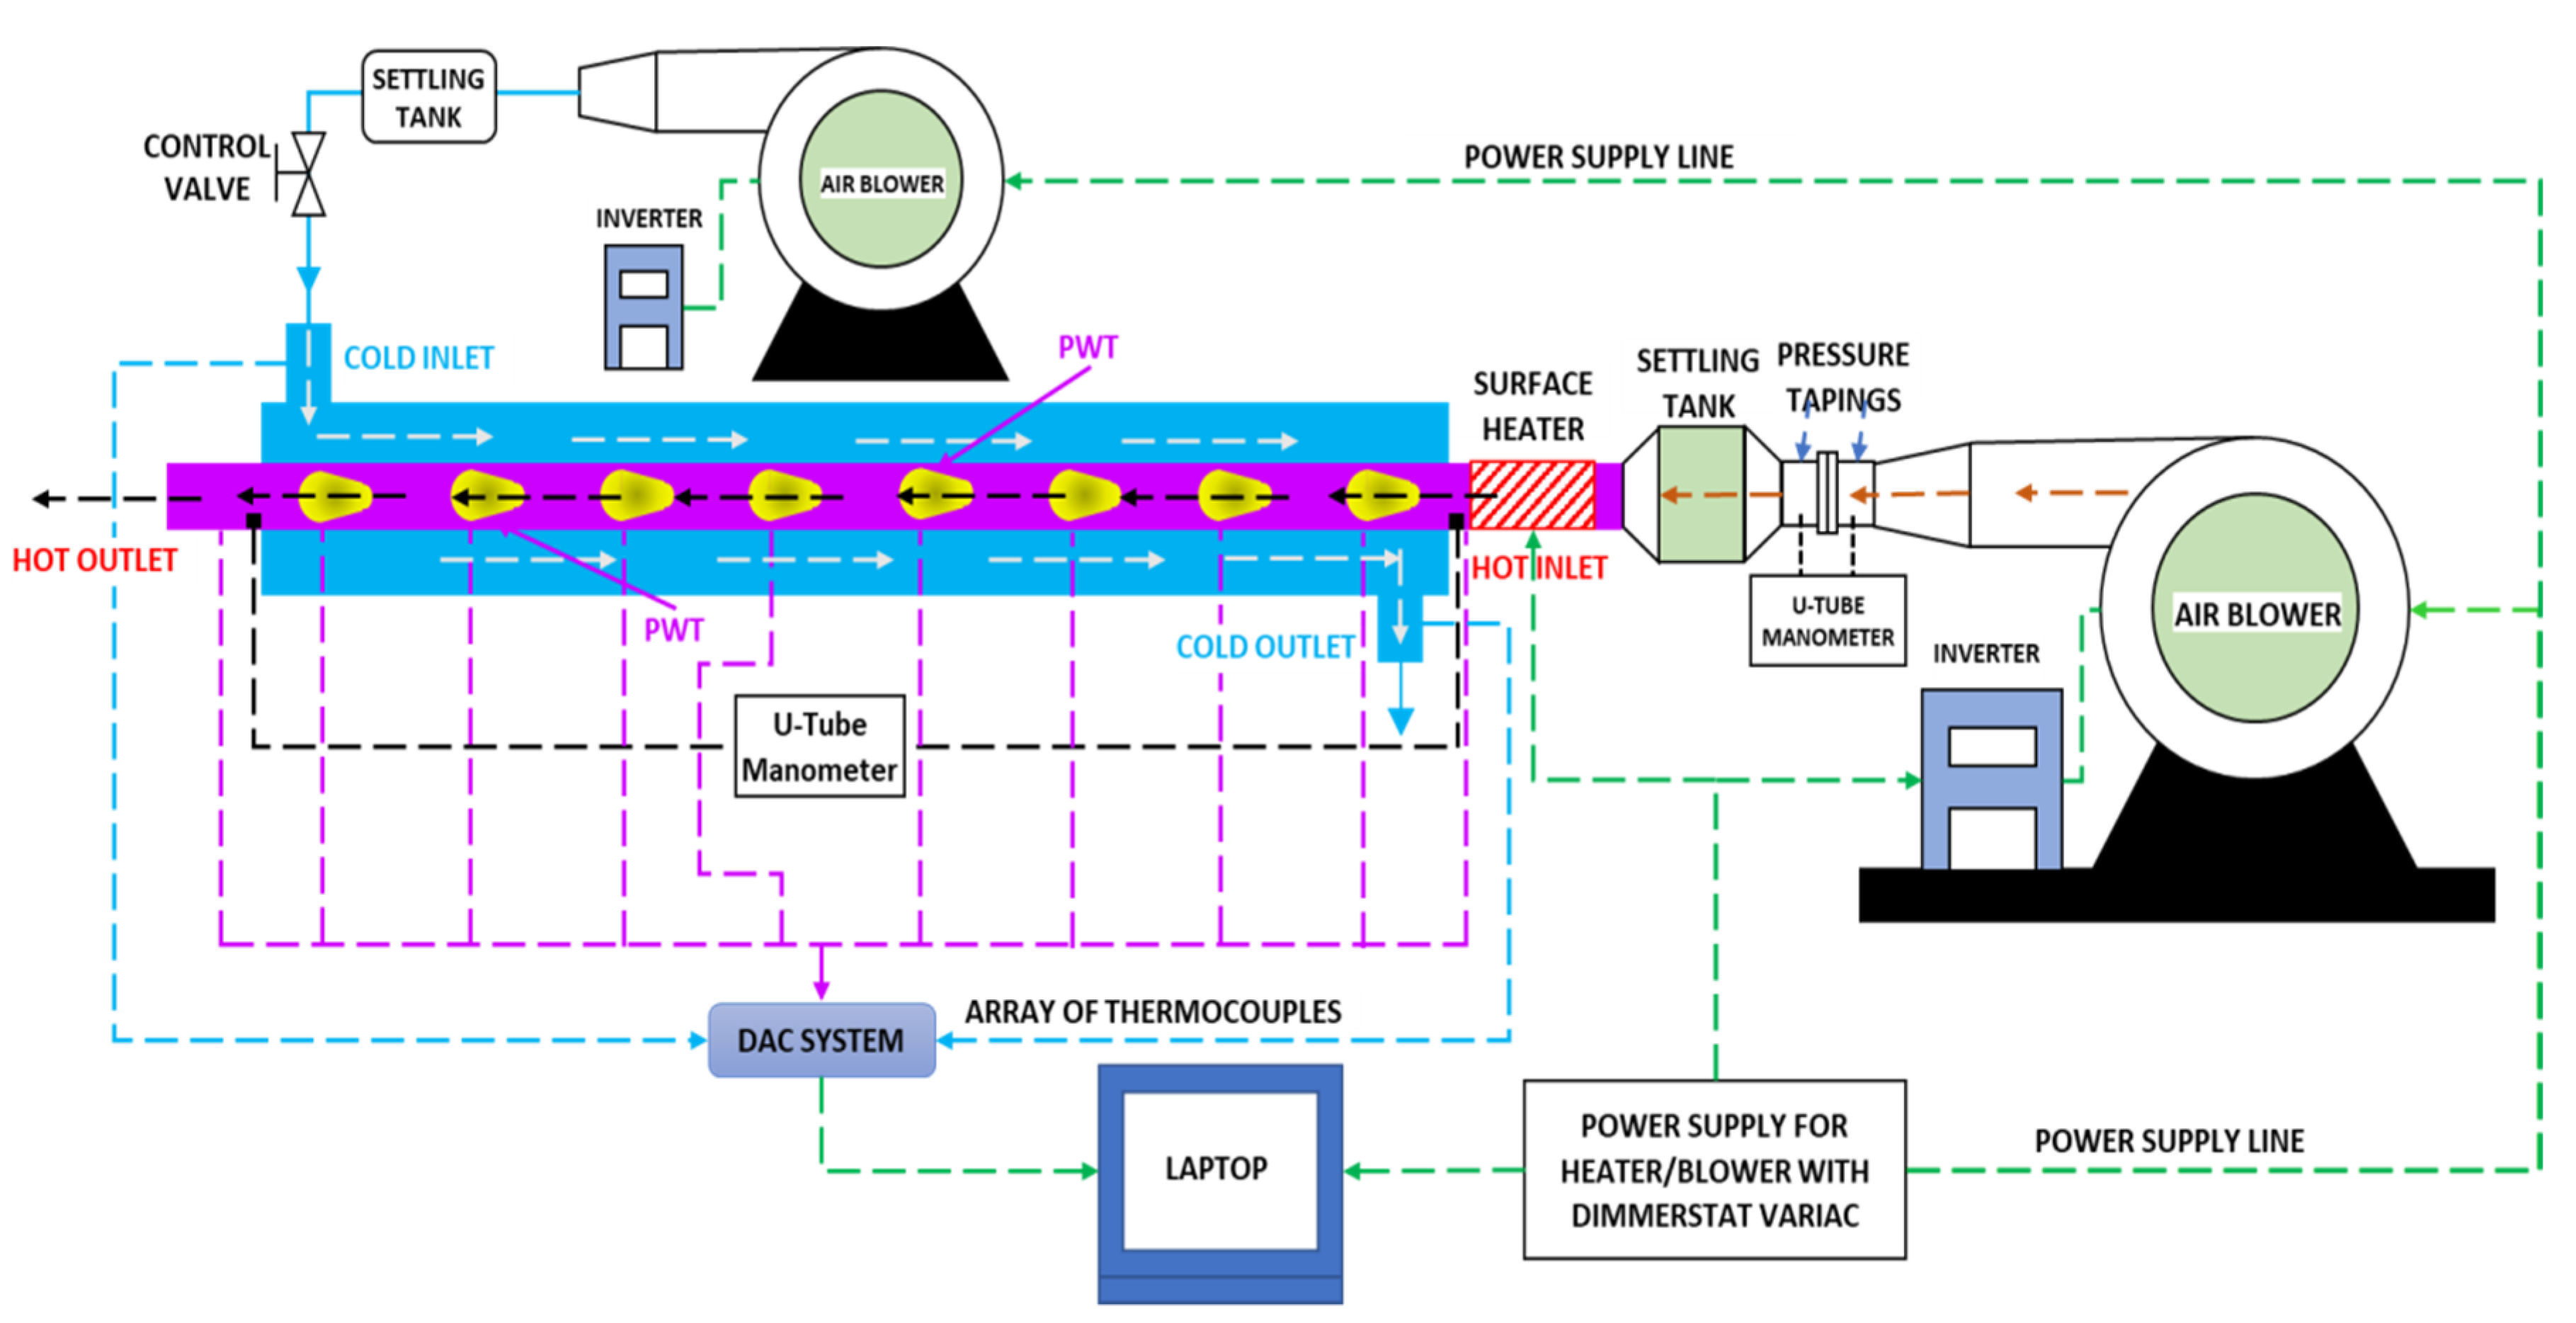
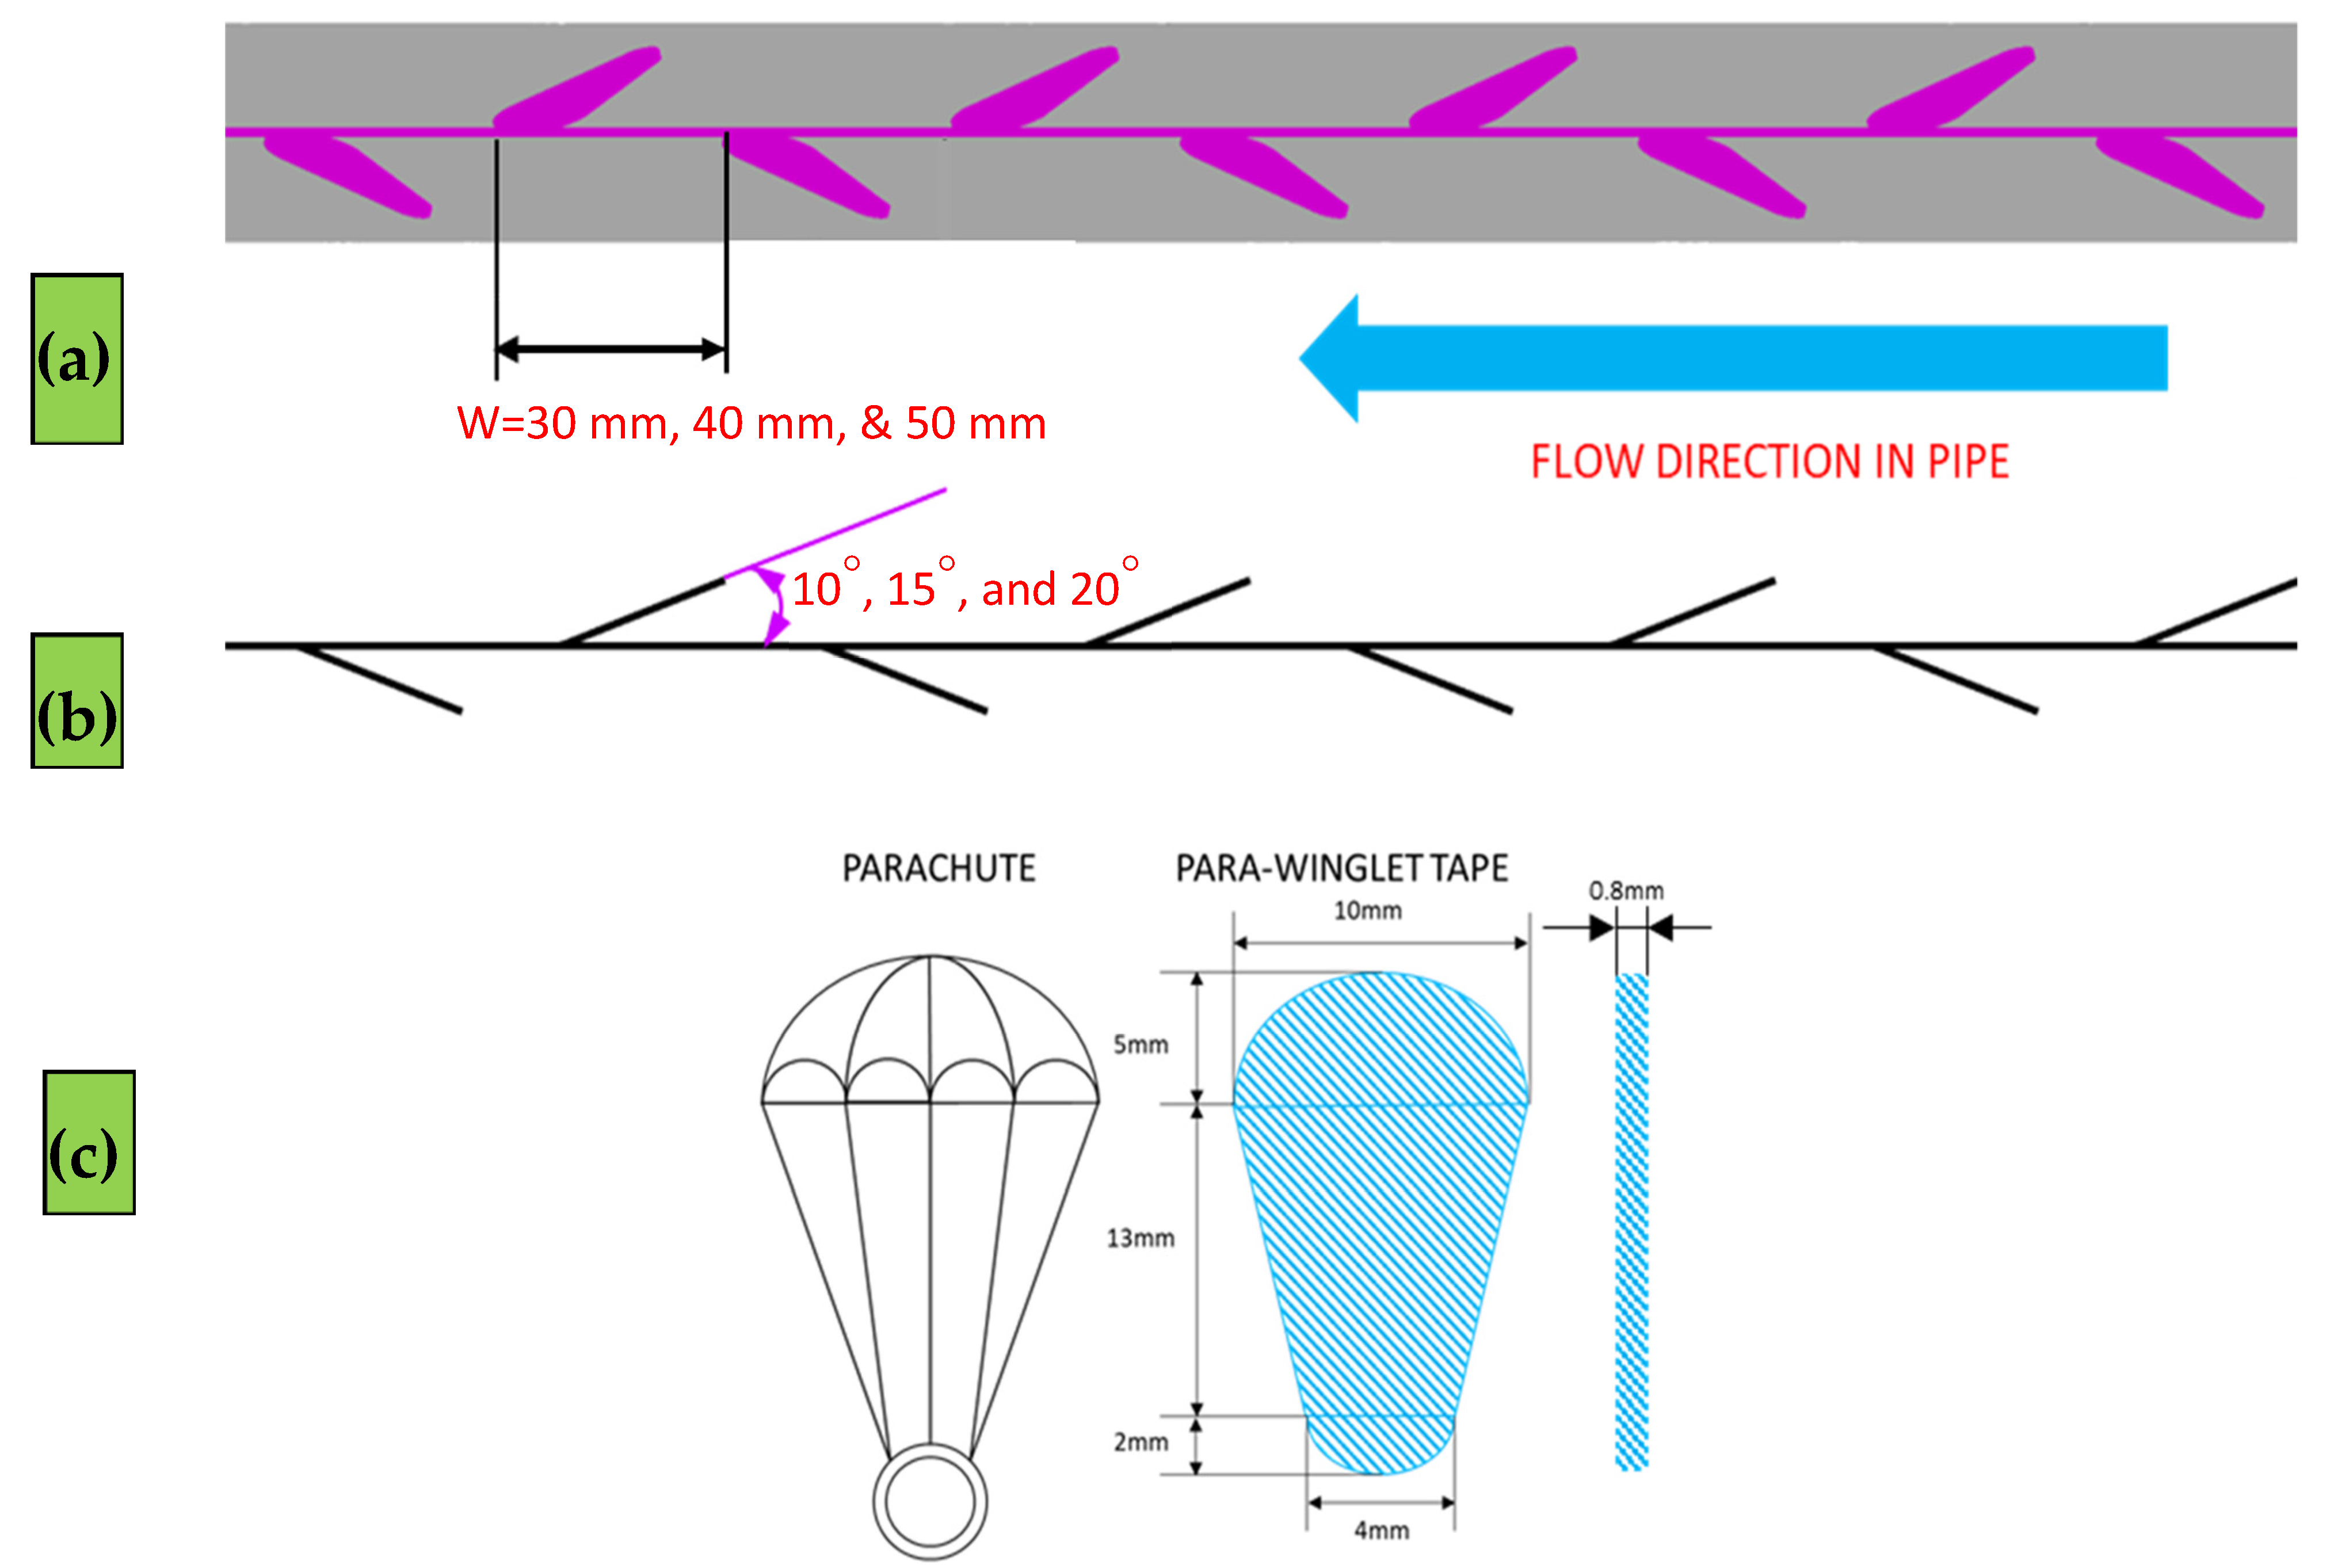
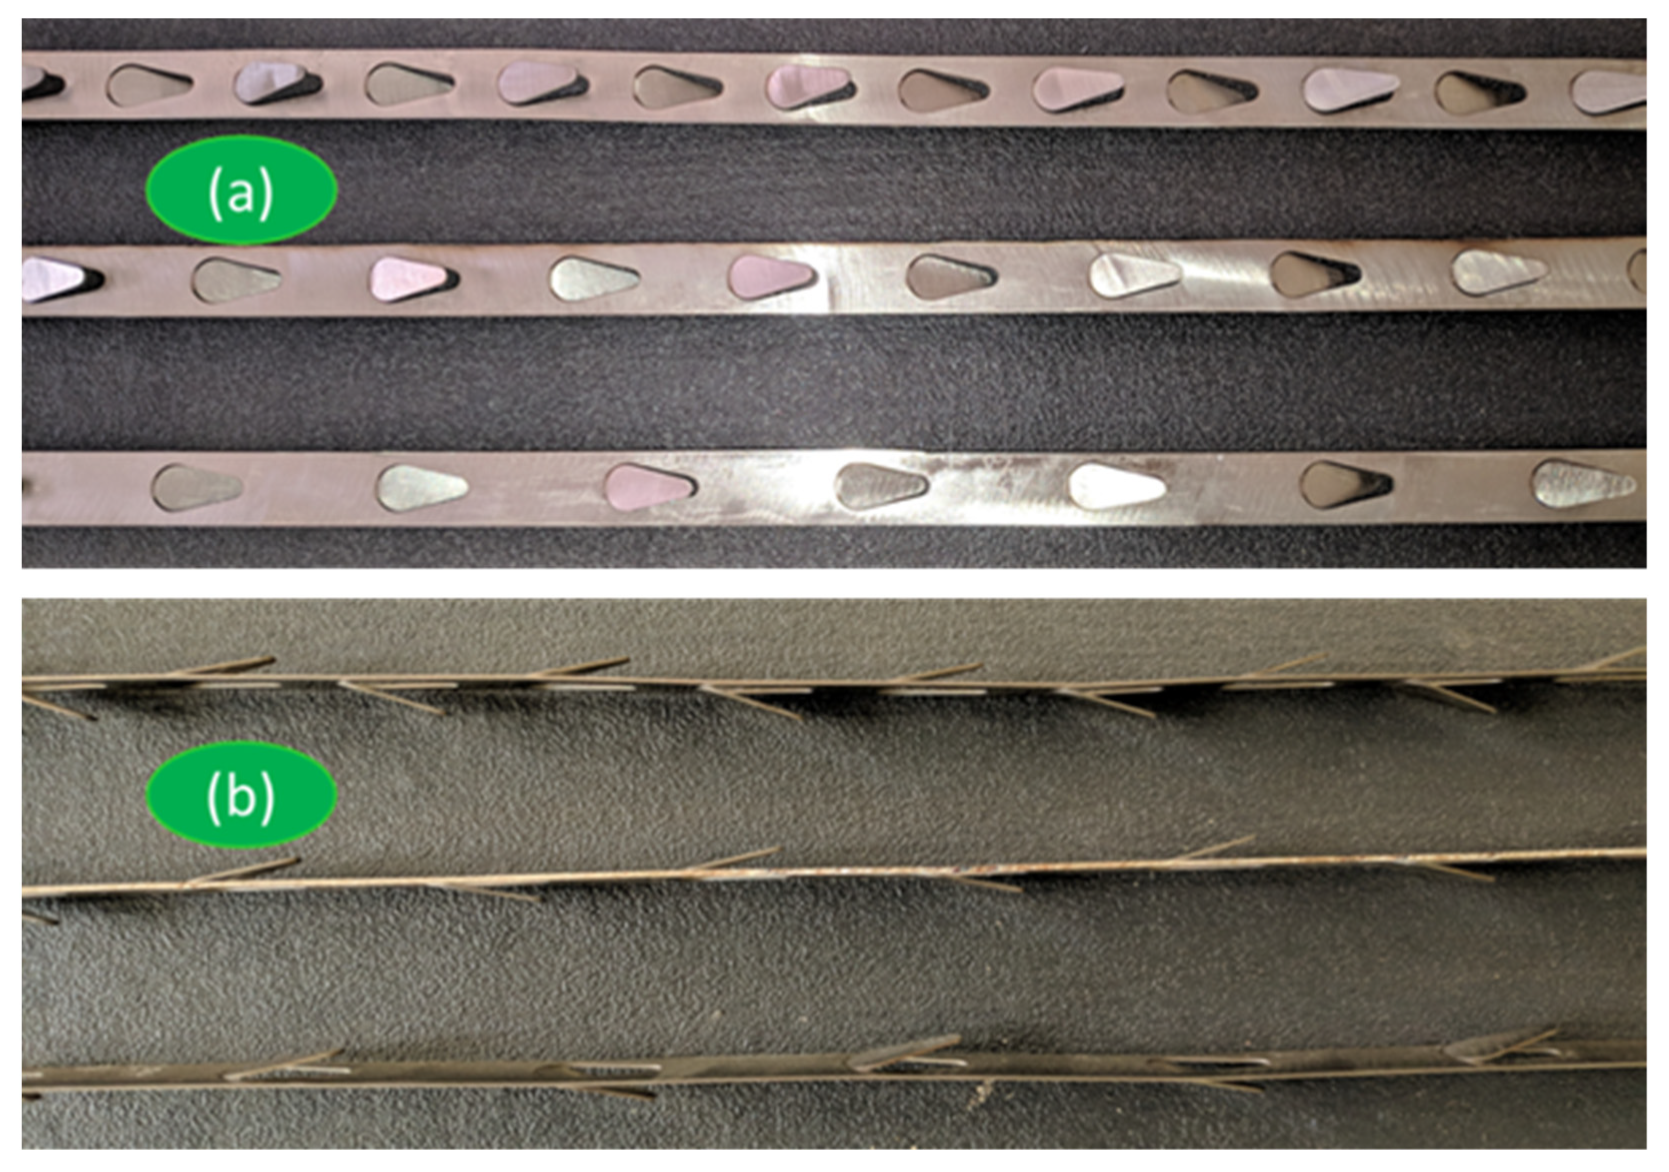
2. Investigation Details
3. Data Reduction
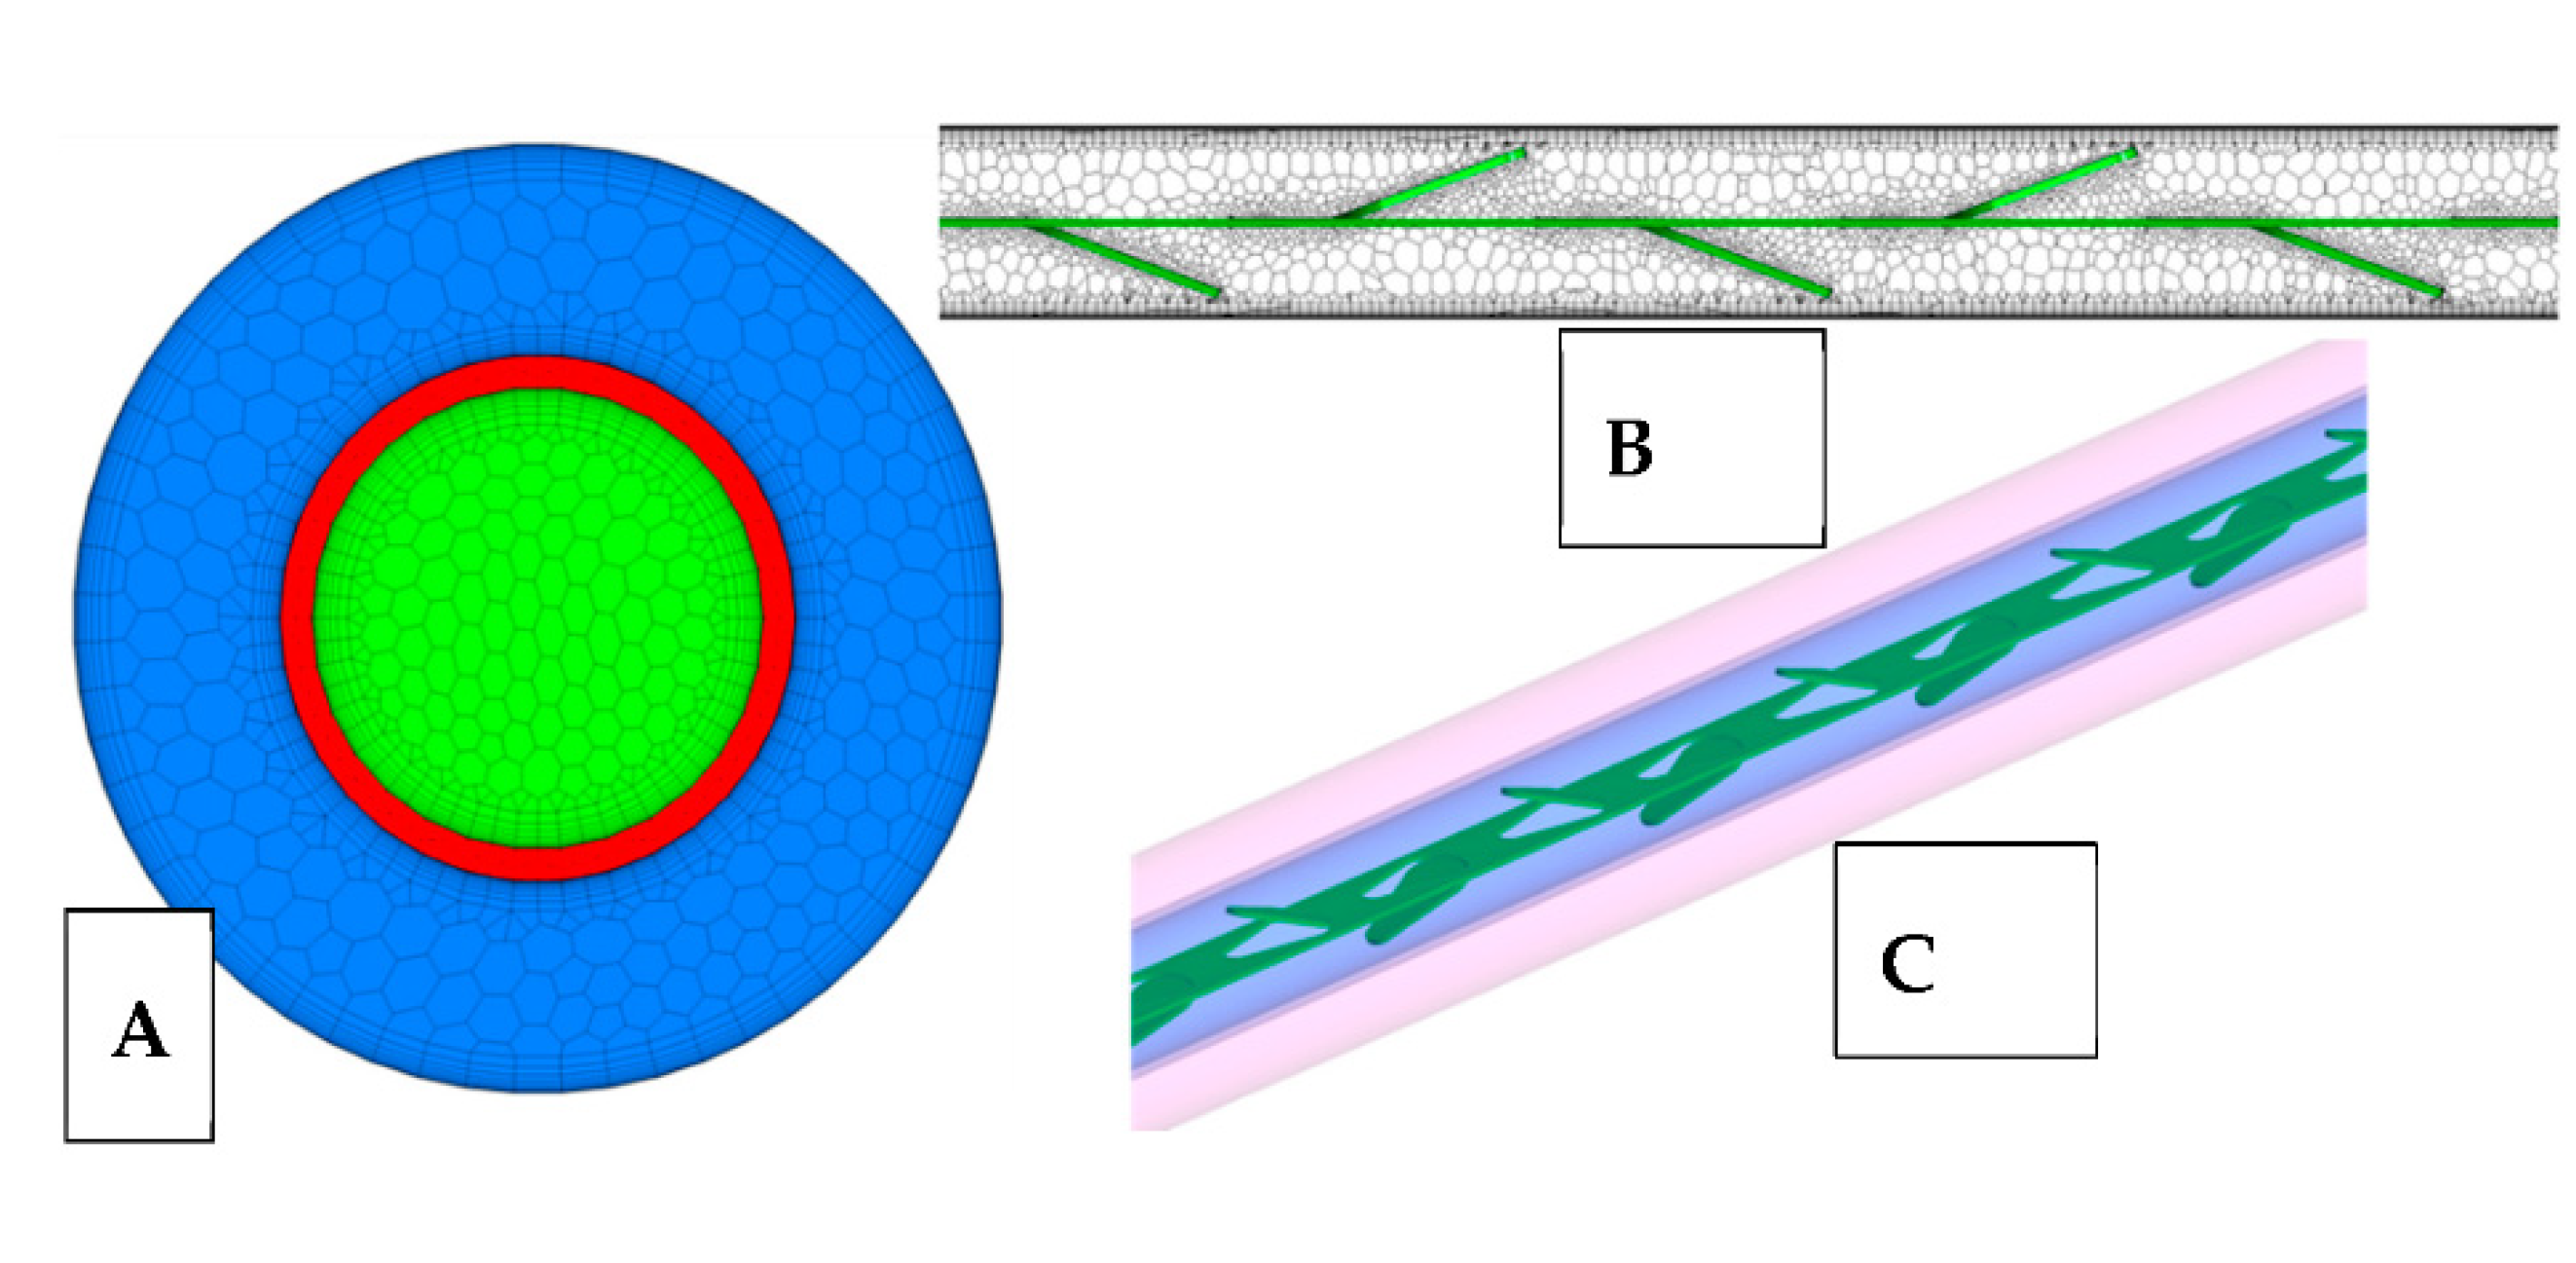
4. Governing Equations
5. Discussion of Results
6. Conclusions
Author Contributions
Funding
Institutional Review Board Statement
Informed Consent Statement
Data Availability Statement
Acknowledgments
Conflicts of Interest
References
- Shabgard, H.; Allen, M.J.; Sharifi, N.; Benn, S.P.; Faghri, A.; Bergman, T.L. Heat pipe heat exchangers and heat sinks: Opportunities, challenges, applications, analysis, and state of the art. Int. J. Heat Mass Transf. 2015, 89, 138–158. [Google Scholar] [CrossRef]
- Srimuang, W.; Amatachaya, P. A review of the applications of heat pipe heat exchangers for heat recovery. Renew. Sustain. Energy Rev. 2012, 16, 4303–4315. [Google Scholar] [CrossRef]
- Huminic, G.; Huminic, A. Hybrid nanofluids for heat transfer applications—A state-of-the-art review. Int. J. Heat Mass Transf. 2018, 125, 82–103. [Google Scholar] [CrossRef]
- Webb, R. Performance evaluation criteria for use of enhanced heat transfer surfaces in heat exchanger design. Int. J. Heat Mass Transf. 1981, 24, 715–726. [Google Scholar] [CrossRef]
- Karwa, R.; Sharma, C.; Karwa, N. Performance Evaluation Criterion at Equal Pumping Power for Enhanced Performance Heat Transfer Surfaces. J. Sol. Energy 2013, 2013, 370823. [Google Scholar] [CrossRef]
- Zimparov, V.D.; Vulchanov, N.L. Performance evaluation criteria for enhanced heat transfer surfaces. Int. J. Heat Mass Transf. 1994, 37, 1807–1816. [Google Scholar] [CrossRef]
- Liu, S.; Sakr, M. A comprehensive review on passive heat transfer enhancements in pipe exchangers. Renew. Sustain. Energy Rev. 2013, 19, 64–81. [Google Scholar] [CrossRef]
- Omidi, M.; Farhadi, M.; Jafari, M. A comprehensive review on double pipe heat exchangers. Appl. Therm. Eng. 2017, 110, 1075–1090. [Google Scholar] [CrossRef]
- Alam, T.; Kim, M.-H. A comprehensive review on single phase heat transfer enhancement techniques in heat exchanger applications. Renew. Sustain. Energy Rev. 2018, 81, 813–839. [Google Scholar] [CrossRef]
- Zheng, N.; Yan, F.; Zhang, K.; Zhou, T.; Sun, Z. A review on single-phase convective heat transfer enhancement based on multi-longitudinal vortices in heat exchanger tubes. Appl. Therm. Eng. 2019, 164, 114475. [Google Scholar] [CrossRef]
- Mozafarie, S.S.; Javaherdeh, K.; Ghanbari, O. Numerical simulation of nanofluid turbulent flow in a double-pipe heat exchanger equipped with circular fins. J. Therm. Anal. Calorim. 2020, 143, 4299–4311. [Google Scholar] [CrossRef]
- Liu, P.; Dong, Z.; Lv, J.; Shan, F.; Liu, Z.; Liu, W. Numerical study on thermal-hydraulic performance and exergy analysis of laminar oil flow in a circular tube with fluid exchanger inserts. Int. J. Therm. Sci. 2020, 153, 106365. [Google Scholar] [CrossRef]
- El Maakoul, A.E.; Laknizi, A.; Saadeddine, S.; Ben Abdellah, A.; Meziane, M.; El Metoui, M. Numerical design and investigation of heat transfer enhancement and performance for an annulus with continuous helical baffles in a double-pipe heat exchanger. Energy Convers. Manag. 2017, 133, 76–86. [Google Scholar] [CrossRef]
- Kumar, S.; Vasudev Karanth, K.; Murthy, K. Numerical study of heat transfer in a finned double pipe heat exchanger. World J. Model. Simul. 2015, 11, 43–54. [Google Scholar]
- Huang, S.; Zhu, H.; Zheng, Y.; Wan, Z.; Tang, Y. Compound thermal performance of an arc-shaped inner finned tube equipped with Y-branch inserts. Appl. Therm. Eng. 2019, 152, 475–481. [Google Scholar] [CrossRef]
- Wijayanta, A.T.; Yaningsih, I.; Aziz, M.; Miyazaki, T.; Koyama, S. Double-sided delta-wing tape inserts to enhance convective heat transfer and fluid flow characteristics of a double-pipe heat exchanger. Appl. Therm. Eng. 2018, 145, 27–37. [Google Scholar] [CrossRef]
- Salem, M.R.; Eltoukhey, M.B.; Ali, R.K.; Elshazly, K.M. Experimental investigation on the hydrothermal performance of a double-pipe heat exchanger using helical tape insert. Int. J. Therm. Sci. 2018, 124, 496–507. [Google Scholar] [CrossRef]
- Mashoofi, N.; Pourahmad, S.; Pesteei, S. Study the effect of axially perforated twisted tapes on the thermal performance enhancement factor of a double tube heat exchanger. Case Stud. Therm. Eng. 2017, 10, 161–168. [Google Scholar] [CrossRef]
- Pourahmad, S.; Pesteei, S. Effectiveness-NTU analyses in a double tube heat exchanger equipped with wavy strip considering various angles. Energy Convers. Manag. 2016, 123, 462–469. [Google Scholar] [CrossRef]
- Sheikholeslami, M.; Gorji-Bandpy, M.; Ganji, D. Effect of discontinuous helical turbulators on heat transfer characteristics of double pipe water to air heat exchanger. Energy Convers. Manag. 2016, 118, 75–87. [Google Scholar] [CrossRef]
- Sheikholeslami, M.; Gorji-Bandpy, M.; Ganji, D. Experimental study on turbulent flow and heat transfer in an air to water heat exchanger using perforated circular-ring. Exp. Therm. Fluid Sci. 2016, 70, 185–195. [Google Scholar] [CrossRef]
- Zohir, A.E.; Habib, M.A.; Nemitallah, M. Heat Transfer Characteristics in a Double-Pipe Heat Exchanger Equipped with Coiled Circular Wires. Exp. Heat Transf. 2014, 28, 531–545. [Google Scholar] [CrossRef]
- Naphon, P.; Suchana, T. Heat transfer enhancement and pressure drop of the horizontal concentric tube with twisted wires brush inserts. Int. Commun. Heat Mass Transf. 2011, 38, 236–241. [Google Scholar] [CrossRef]
- Zhang, L.; Guo, H.; Wu, J.; Du, W. Compound heat transfer enhancement for shell side of double-pipe heat exchanger by helical fins and vortex generators. Heat Mass Transf. 2012, 48, 1113–1124. [Google Scholar] [CrossRef]
- Abdelrazek, A.H.; Kazi, S.N.; Alawi, O.A.; Yusoff, N.; Oon, C.S.; Ali, H.M. Heat transfer and pressure drop investigation through pipe with different shapes using different types of nanofluids. J. Therm. Anal. 2019, 139, 1637–1653. [Google Scholar] [CrossRef]
- Afzal, A.; Islam, T.; Kaladgi, A.R.; Manokar, A.M.; Samuel, O.D.; Mujtaba, M.A.; Soudagar, M.E.M.; Fayaz, H.; Ali, H.M. Experimental investigation on the thermal performance of inserted helical tube three-fluid heat exchanger using graphene/water nanofluid. J. Therm. Anal. Calorim. 2021, 147, 5087–5100. [Google Scholar] [CrossRef]
- Noorbakhsh, M.; Zaboli, M.; Ajarostaghi, S.S.M. Numerical evaluation of the effect of using twisted tapes as turbulator with various geometries in both sides of a double-pipe heat exchanger. J. Therm. Anal. 2019, 140, 1341–1353. [Google Scholar] [CrossRef]
- Hosseinnejad, R.; Hosseini, M.; Farhadi, M. Turbulent heat transfer in tubular heat exchangers with twisted tape. J. Therm. Anal. 2018, 135, 1863–1869. [Google Scholar] [CrossRef]
- Thejaraju, R.; Girisha, K.B.; Manjunath, S.; Dayananda, B. Experimental investigation of turbulent flow behavior in an air to air double pipe heat exchanger using novel para winglet tape. Case Stud. Therm. Eng. 2020, 22, 100791. [Google Scholar] [CrossRef]
- Zolghadri, A.; Maddah, H.; Ahmadi, M.; Sharifpur, M. Predicting Parameters of Heat Transfer in a Shell and Tube Heat Exchanger Using Aluminum Oxide Nanofluid with Artificial Neural Network (ANN) and Self-Organizing Map (SOM). Sustainability 2021, 13, 8824. [Google Scholar] [CrossRef]
- Menni, Y.; Ameur, H.; Sharifpur, M.; Ahmadi, M.H. Effects of in-line deflectors on the overall performance of a channel heat exchanger. Eng. Appl. Comput. Fluid Mech. 2021, 15, 512–529. [Google Scholar] [CrossRef]
- Maddah, H.; Ghazvini, M.; Ahmadi, M.H.; Bui, D.T.; Bandarr Filho, E.P. Performance evaluation of a U-shaped heat exchanger containing hybrid Cu/CNTs nanofluids: Experimental data and modeling using regression and artificial neural network. J. Therm. Anal. Calorim. 2020, 143, 1503–1521. [Google Scholar] [CrossRef]
- Payambarpour, S.A.; Shokouhmand, H.; Ahmadi, M.H.; Assad, M.E.H.; Chen, L. Effect of wetness pattern on the fin-tube heat exchanger performance under partially wet-surface condition. Therm. Sci. Eng. Prog. 2020, 19, 100619. [Google Scholar] [CrossRef]
- Menni, Y.; Chamkha, A.J.; Ameur, H.; Ahmadi, M.H. Hydrodynamic Behavior in Solar Oil Heat Exchanger Ducts Fitted with Staggered Baffles and Fins. J. Appl. Comput. Mech. 2020, 8, 774–790. [Google Scholar] [CrossRef]
- Aghayari, R.; Maddah, H.; Pourkiaei, S.M.; Ahmadi, M.H.; Chen, L.; Ghazvini, M. Theoretical and experimental studies of heat transfer in a double-pipe heat exchanger equipped with twisted tape and nanofluid. Eur. Phys. J. Plus 2020, 135, 1–26. [Google Scholar] [CrossRef]
- Mirzaee, M.; Zare, R.; Sadeghzadeh, M.; Maddah, H.; Ahmadi, M.H.; Acıkkalp, E.; Chen, L. Thermodynamic analyses of different scenarios in a CCHP system with micro turbine–Absorption chiller, and heat exchanger. Energy Convers. Manag. 2019, 198, 111919. [Google Scholar] [CrossRef]
- Chopra, S. Performance study of the electronic and optical parameters of thermally activated delayed fluorescence nanosized emitters (CCX-I and CCX-II) via DFT, SCC-DFTB and B97-3c approaches. J. Nanostruct. Chem. 2020, 10, 115–124. [Google Scholar] [CrossRef]
- Najafi, F. Thermodynamic studies of carbon nanotube interaction with Gemcitabine anticancer drug: DFT calculations. J. Nanostruct. Chem. 2020, 10, 227–242. [Google Scholar] [CrossRef]
- Moffat, R.J. Describing the uncertainties in experimental results. Exp. Therm. Fluid Sci. 1988, 1, 3–17. [Google Scholar] [CrossRef]
- Kline, S.J. The Purposes of Uncertainty Analysis. J. Fluids Eng. 1985, 107, 153–160. [Google Scholar] [CrossRef]
- Kumar, R.S.V.; Saleh, B.; Sowmya, G.; Afzal, A.; Prasannakumara, B.C.; Gowda, R.J.P. Exploration of transient heat transfer through a moving plate with exponentially temperature-dependent thermal properties. Waves Random Complex Media 2022, 1–19. [Google Scholar] [CrossRef]
- Afzal, A.; Kumar, R.; Jilte, R.; Samee, M.; Shaik, S.; Razak, R.A.; Manokar, A.M.; Saleel, C.A. Numerical analysis and machine learning for battery thermal performance cooled with different fluids. Int. J. Energy Res. 2022, 35, 1048–1055. [Google Scholar] [CrossRef]
- Murugan, M.; Saravanan, A.; Elumalai, P.; Murali, G.; Dhineshbabu, N.; Kumar, P.; Afzal, A. Thermal management system of lithium-ion battery packs for electric vehicles: An insight based on bibliometric study. J. Energy Storage 2022, 52, 104723. [Google Scholar] [CrossRef]
- Mujtaba, M.; Cho, H.M.; Masjuki, H.; Kalam, M.; Farooq, M.; Soudagar, M.E.M.; Gul, M.; Ahmed, W.; Afzal, A.; Bashir, S.; et al. Effect of alcoholic and nano-particles additives on tribological properties of diesel–palm–sesame–biodiesel blends. Energy Rep. 2020, 7, 1162–1171. [Google Scholar] [CrossRef]
- Yaliwal, V.; Banapurmath, N.; Soudagar, M.E.M.; Afzal, A.; Ahmadi, P. Effect of manifold and port injection of hydrogen and exhaust gas recirculation (EGR) in dairy scum biodiesel—Low energy content gas-fueled CI engine operated on dual fuel mode. Int. J. Hydrog. Energy 2021, 47, 6873–6897. [Google Scholar] [CrossRef]
- Afzal, A.; Khan, S.A.; Saleel, C.A. Role of ultrasonication duration and surfactant on characteristics of ZnO and CuO nanofluids. Mater. Res. Express 2019, 6, 1150d8. [Google Scholar] [CrossRef]
- Sajadi, A.; Talebi, S. Experimental investigation of heat transfer, pressure drop, and efficiency of TiO2/Oil nanofluid in alternating flattened tubes. Energy Equip. Syst. 2022, 10, 123–136. [Google Scholar]
- Afzal, A.; Samee, M.; Razak, A. Experimental Investigation of Thermal Performance of Engine Coolant Oil and Water in Helical Coil Heat Exchanger. J. Eng. Res. 2019, 8, 333–351. [Google Scholar]
- Dhairiyasamy, R.; Saleh, B.; Govindasamy, M.; Aly, A.A.; Afzal, A.; Abdelrhman, Y. Effect of particle size on thermophysical and heat transfer properties of Ag nanofluid in a radiator—An experimental investigation. Inorg. Nano-Metal Chem. 2021, 1–15. [Google Scholar] [CrossRef]
- Felemban, B.F.; Essa, F.A.; Afzal, A.; Ahmed, M.H.; Saleh, B.; Panchal, H.; Shanmugan, S.; Elsheikh, A.; Omara, Z.M. Experimental investigation on dish solar distiller with modified absorber and phase change material under various operating conditions. Environ. Sci. Pollut. Res. 2022, 1–12. [Google Scholar] [CrossRef]
- Ziaee, O.; Zolfaghari, N.; Baghani, M.; Baniassadi, M.; Wang, K. A modified cellular automaton model for simulating ion dynamics in a Li-ion battery electrode. Energy Equip. Syst. 2022, 10, 41–49. [Google Scholar]
- Taslimi, M.S.; Dastjerdi, S.M.; Mousavi, S.B.; Ahmadi, P.; Ashjaee, M. Assessment and multi-objective optimization of an off-grid solar based energy system for a Conex. Energy Equip. Syst. 2021, 9, 127–143. [Google Scholar] [CrossRef]
- Sharifi, M.; Amidpour, M.; Mollaei, S. Investigating carbon emission abatement long-term plan with the aim of energy system modeling; case study of Iran. Energy Equip. Syst. 2018, 6, 337–349. [Google Scholar]
- Hajabdollahi, H.; Dehaj, M.S.; Hajabdollahi, H. Investigation of optimization algorithms and their operating parameters in different types of heat exchangers. Energy Equip. Syst. 2021, 9, 351–370. [Google Scholar]
- Sabzi, S.; Asadi, M.; Moghbelli, H. Review, analysis and simulation of different structures for hybrid electrical energy storages. Energy Equip. Syst. 2017, 5, 115–129. [Google Scholar] [CrossRef]


| Sl. No. | Author | Type of OT | Achievements |
|---|---|---|---|
| 1 | Zheng [10] | HEV vortices generator | Generates longitudinal vortices |
| 2 | Mozafarie [11] | Circular fin | Efficiency optimized to 15% |
| 3 | Liu [12] | Fluid exchange inserts | Efficiency optimized to 24% ≈ 64% |
| 4 | Maakoul [13] | helical baffle | Deficiency of 10 to 15% |
| 5 | Shiva Kumar [14] | parabolic fin and triangular fins | Pressure drop and fin effectiveness increased compared to plain tube |
| 6 | Huang [15] | Y-branch inserts | 17% to 122% was optimized in heat transfer |
| 7 | Wijayanta [16] | delta-wing tape inserts | A maximum of 15% enhancement was achieved |
| 8 | Salem [17] | helical tape insert | Efficiency optimized to 30% to 95% |
| 9 | Mashoofi [18] | axially perforated twisted tapes | A maximum of 7% enhancement was achieved |
| 10 | Pourahmad [19] | wavy strip | Effectiveness has increased from 15 to 70% |
| 11 | Sheikholeslami [20] | Discontinuous helical turbulators | Efficiency optimized to 5% to 50% |
| 12 | Sheikholeslami [21] | perforated circular-ring | Efficiency optimized to 10% to 20% |
| 13 | Zohir [22] | Coiled wires | Effectiveness has increased from 20 to 100% |
| 14 | Naphon [23] | Brush Inserts | Pressure drop and effectiveness increased compared to plain tube |
| 15 | Zhang [24] | Vortex generators | Heat transfer was enhanced to 1.34 to 1.46 times |
| Type | Temperature in [K] | CP in [J/KgK] | ρ in [Kg/m3] | µ in [Pa·S] | K in [W/mk] | Pr |
|---|---|---|---|---|---|---|
| Hot Fluid | 300 | 1007.07 | 1.16134 | 18.568 × 10⁻⁶ | 26.19 × 10⁻³ | 0.7138 |
| Cold Fluid | 353 | 1010.38 | 0.9869 | 21.037 × 10⁻⁶ | 29.99 × 10⁻³ | 0.7083 |
| Copper | ---- | 393.5 | 8910 | ---- | 391.1 | ---- |
| Sl. No. | Parameters | Notation | Equations |
|---|---|---|---|
| 1 | Temperature of the hot tube section | ||
| 2 | Temperature of cold tube section | ||
| 3 | heat transfer in cold fluid | ||
| 4 | Average wall temperature | ||
| 5 | heat transfer in hot fluid | ||
| 6 | Logarithmic mean temperature difference | ||
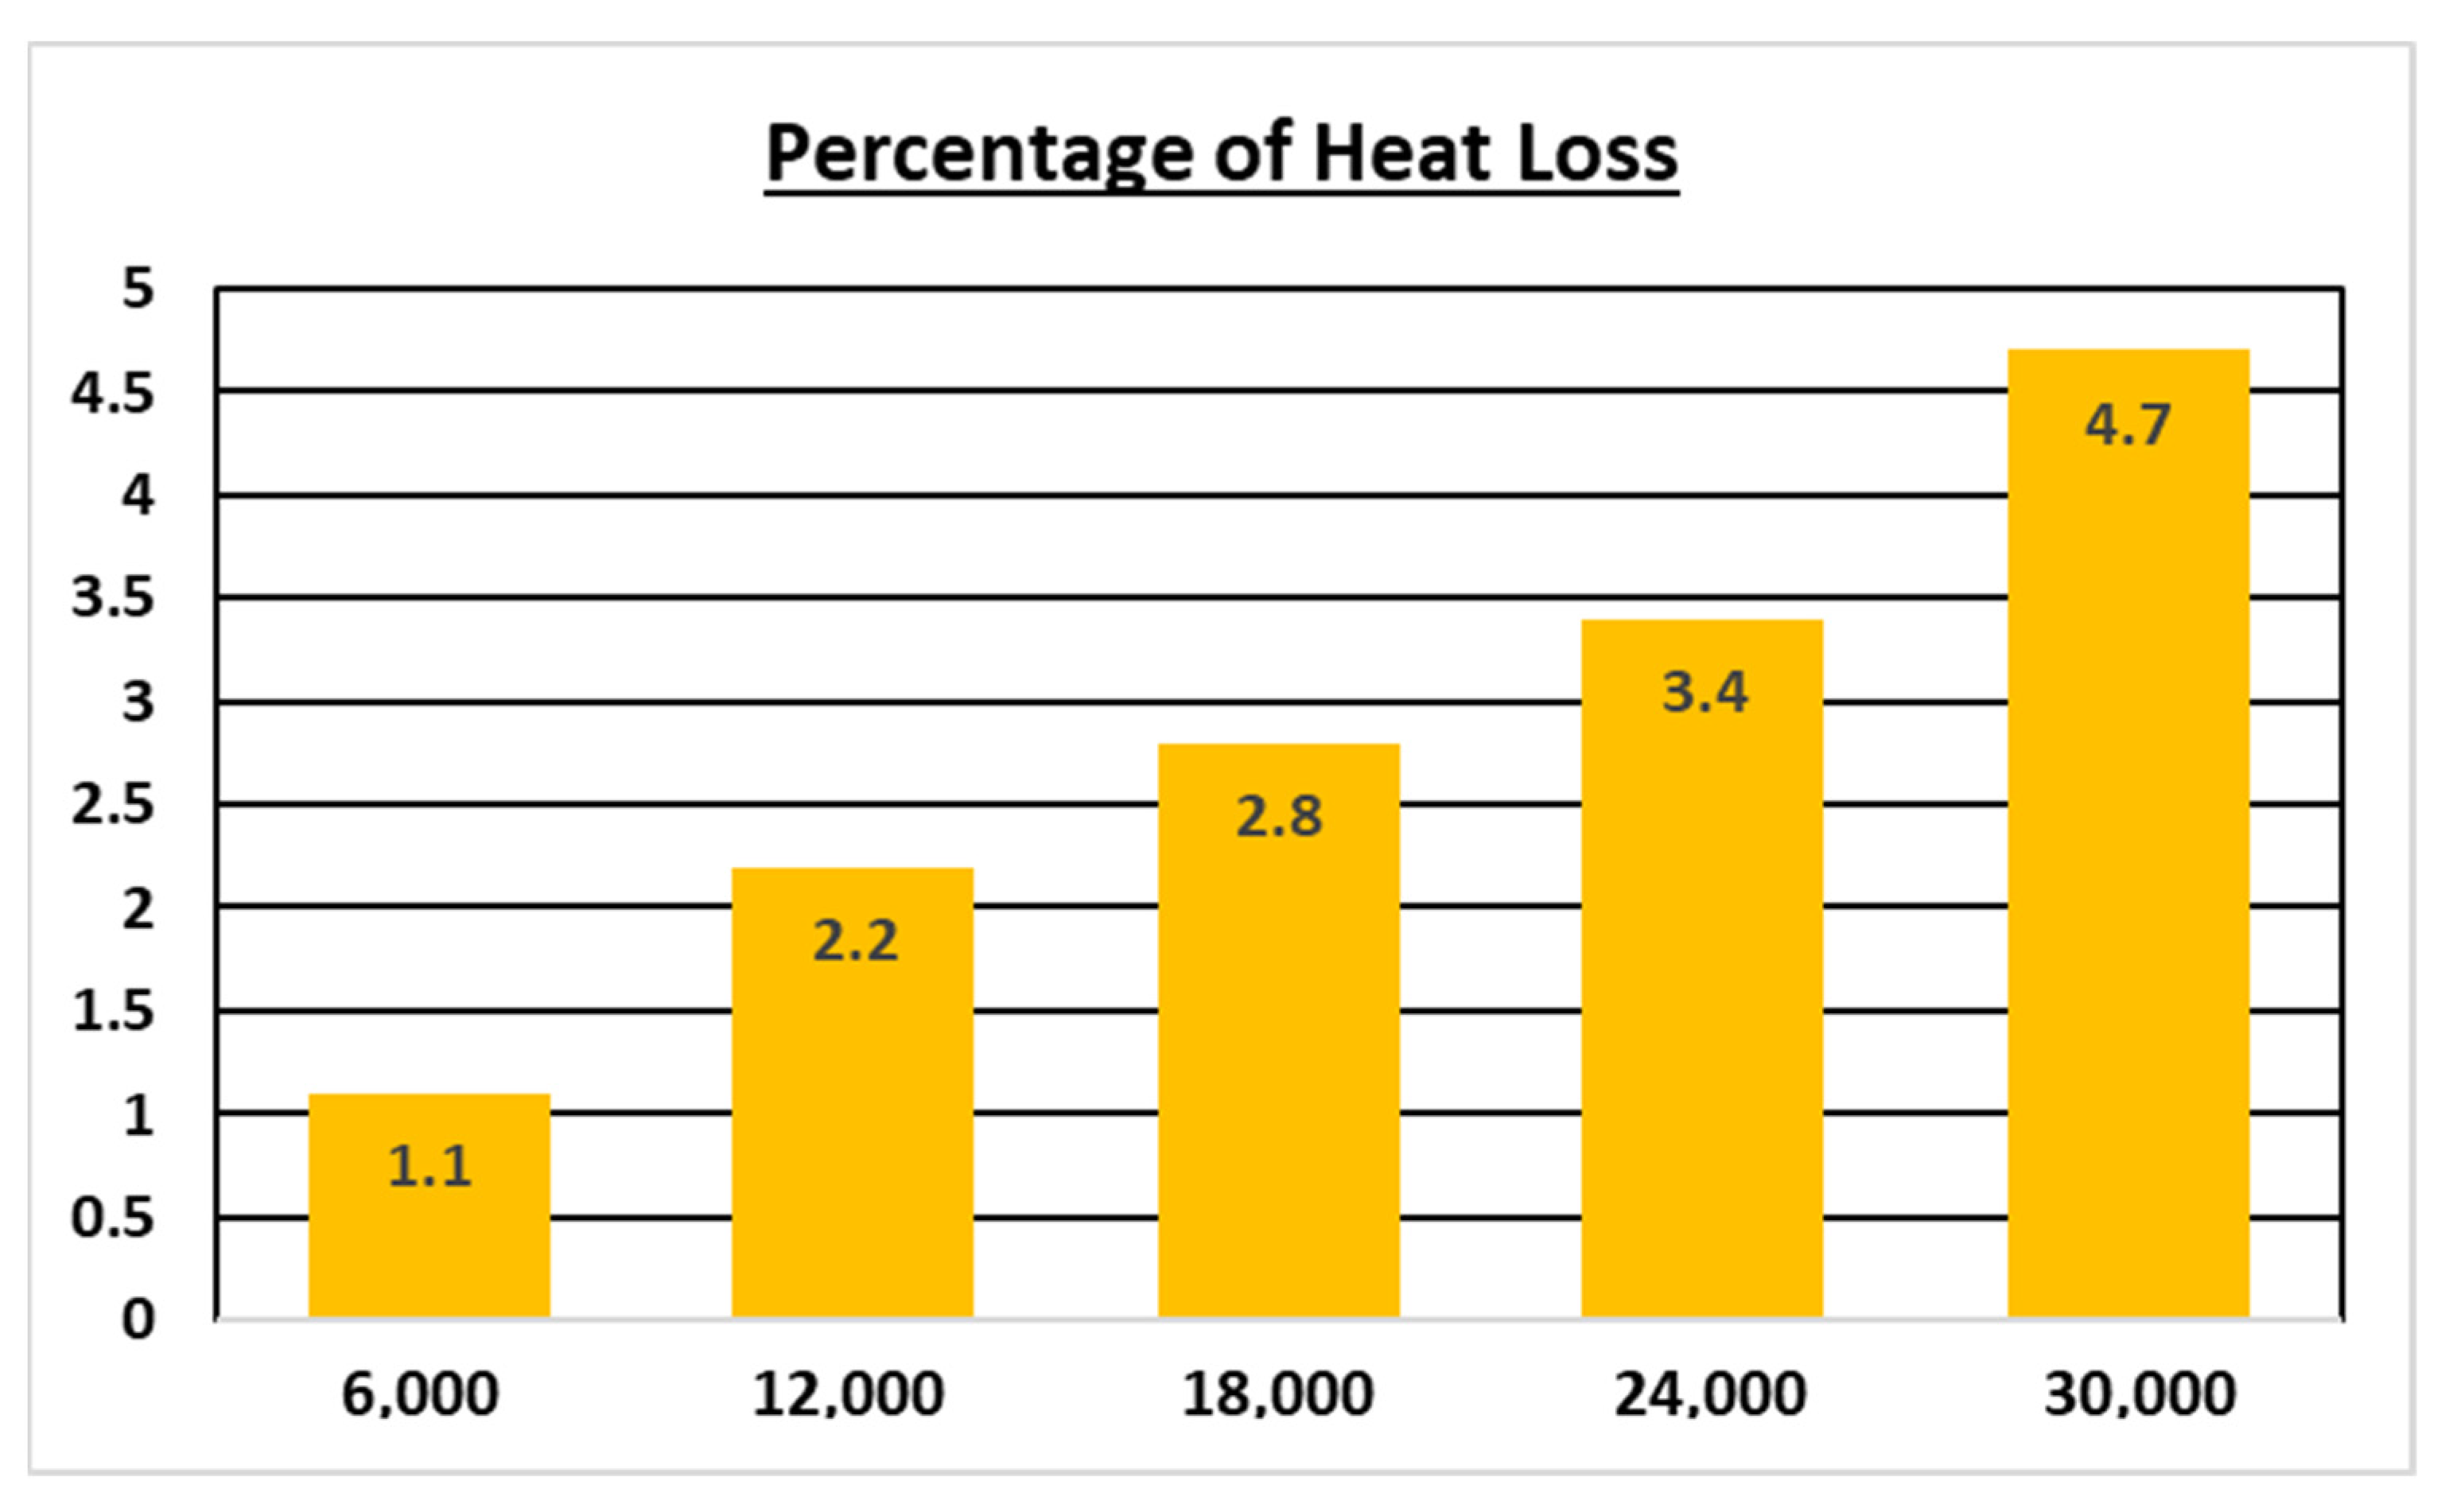
| 7 | Heat loss | ||
| 8 | Average heat transfer | ||
| 9 | overall heat transfer coefficient | ||
| 10 | heat transfer coefficient tube | ||
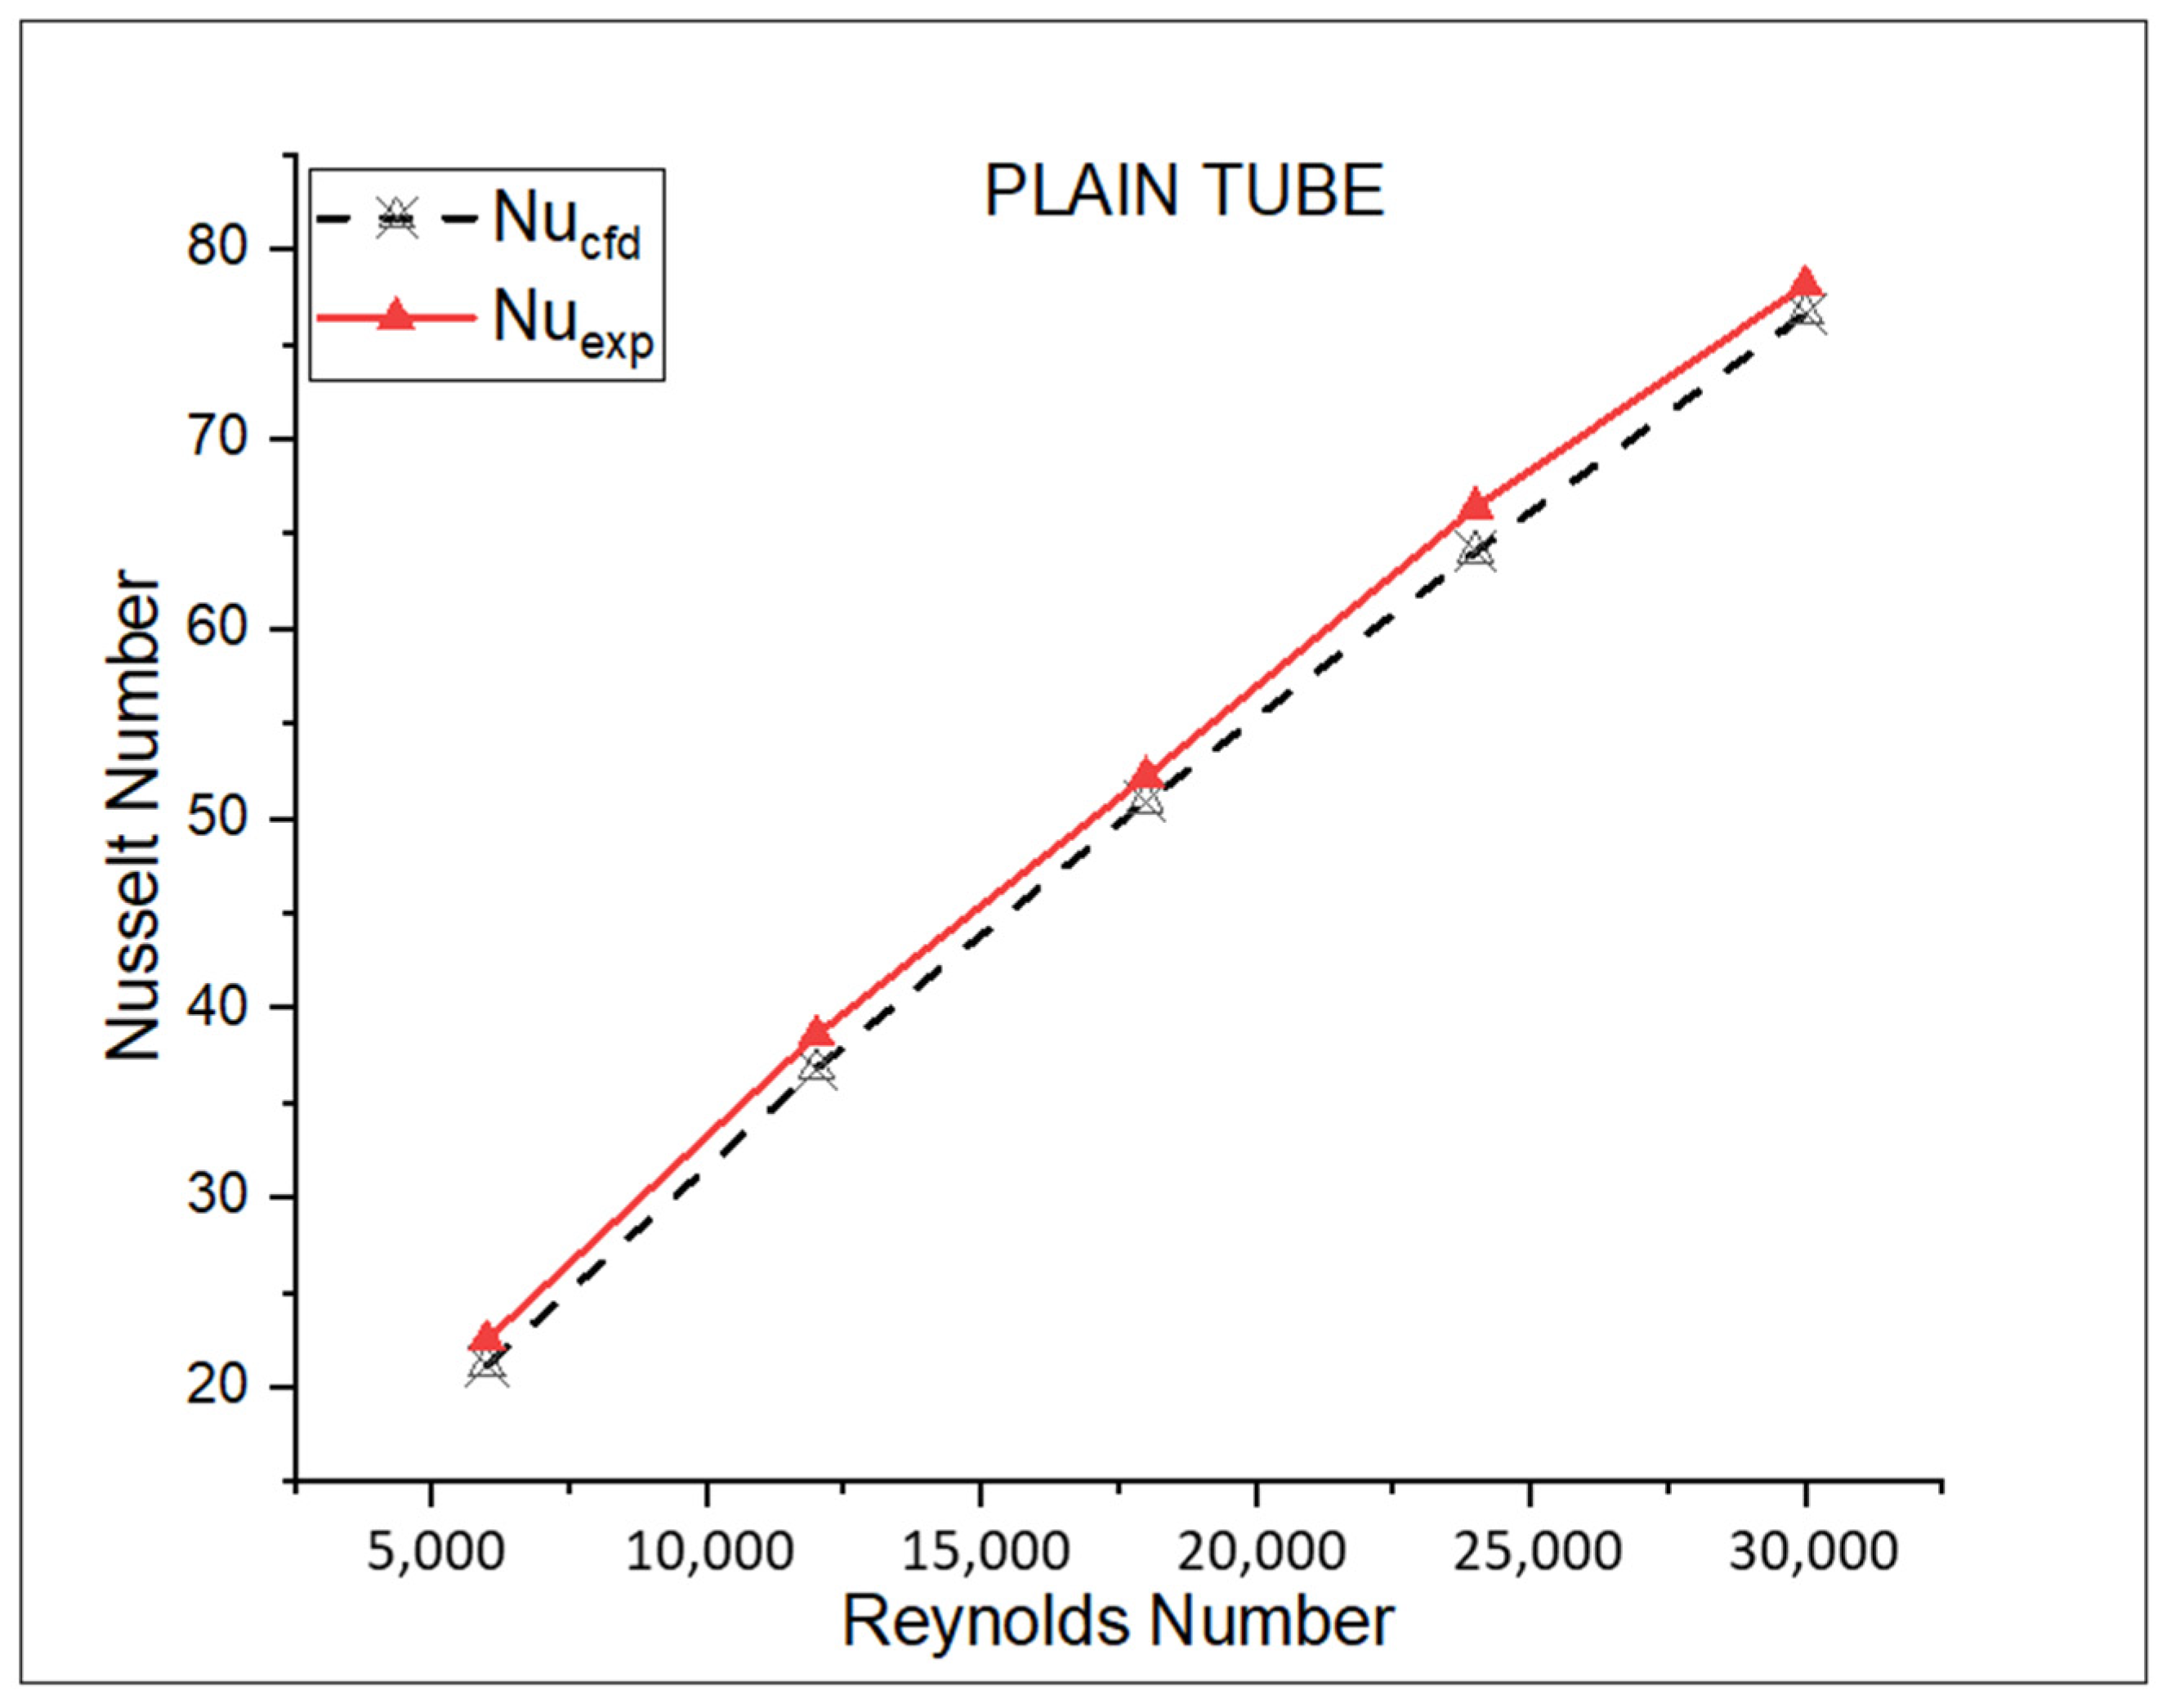
| 11 | Nusselt Number tube | ||
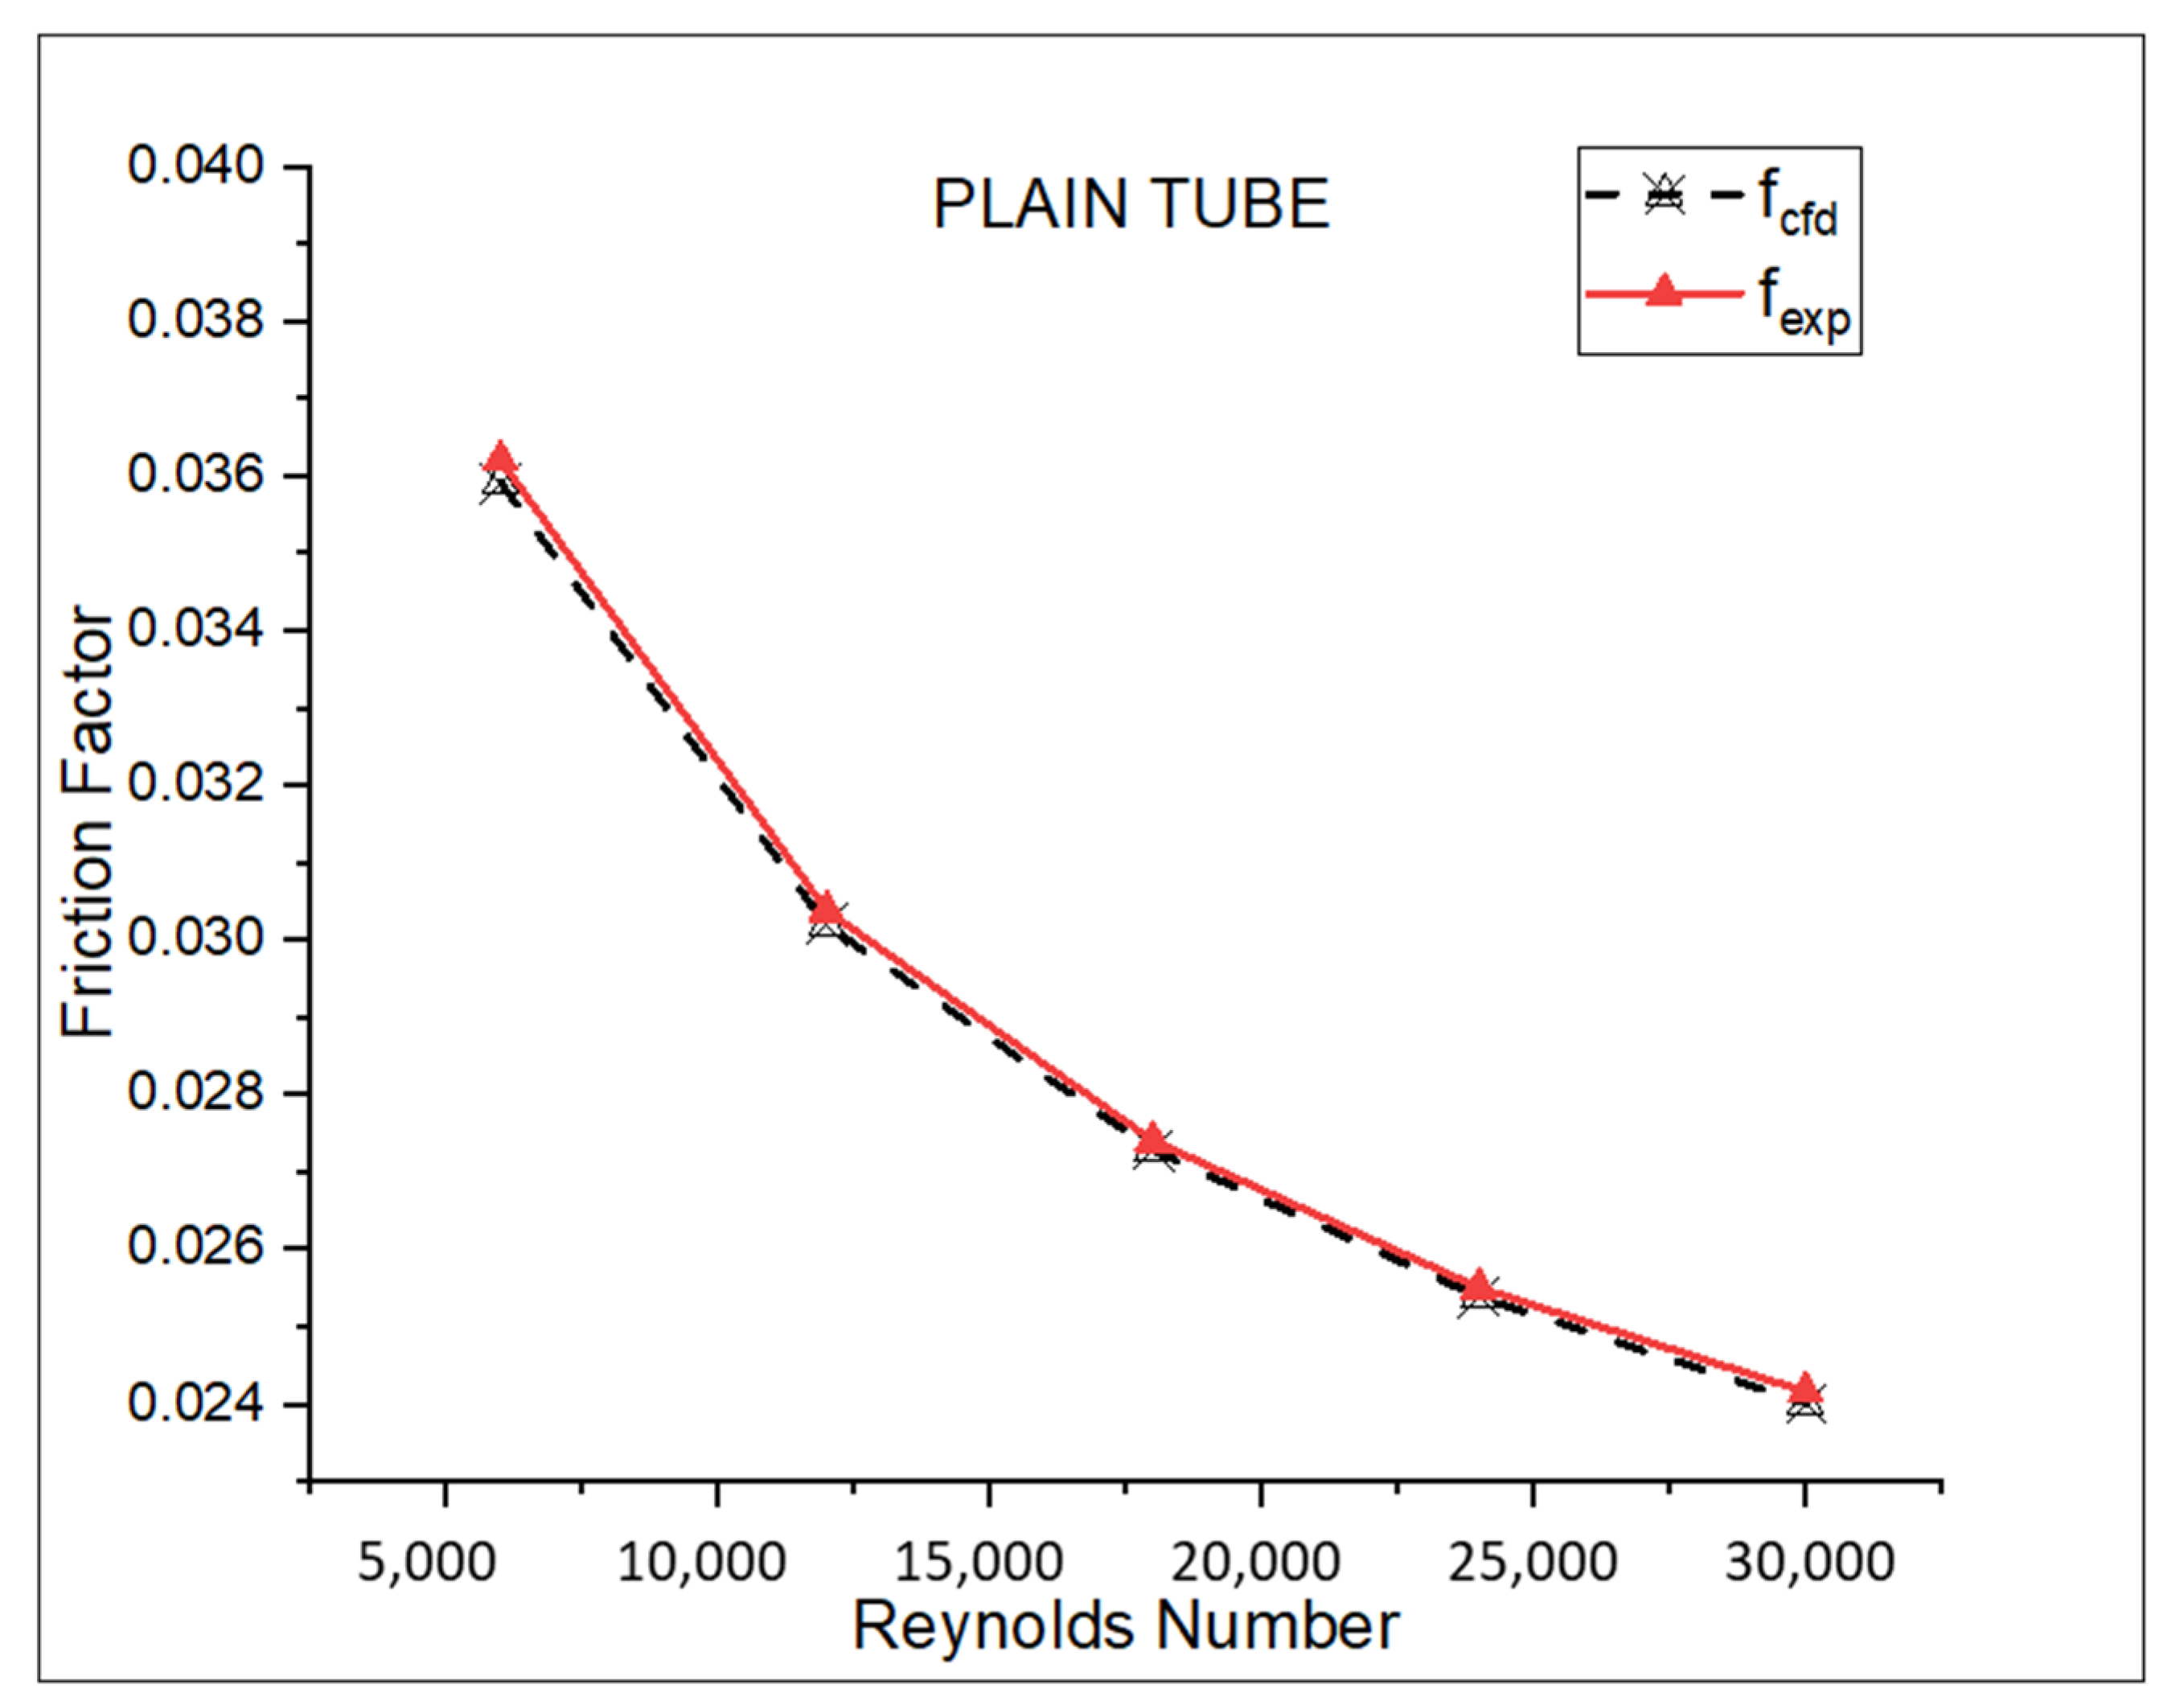
| 12 | Friction factor tube | ||
| 13 | Performance optimization index |
| Sl. No. | Parameters | Notation | Equations |
|---|---|---|---|
| 1 | Continuity Equation | - | |
| 2 | Momentum Equation | - | |
| 3 | Energy Equation | - | |
| 4 | Kinetic Energy | ||
| 5 | Dissipation |
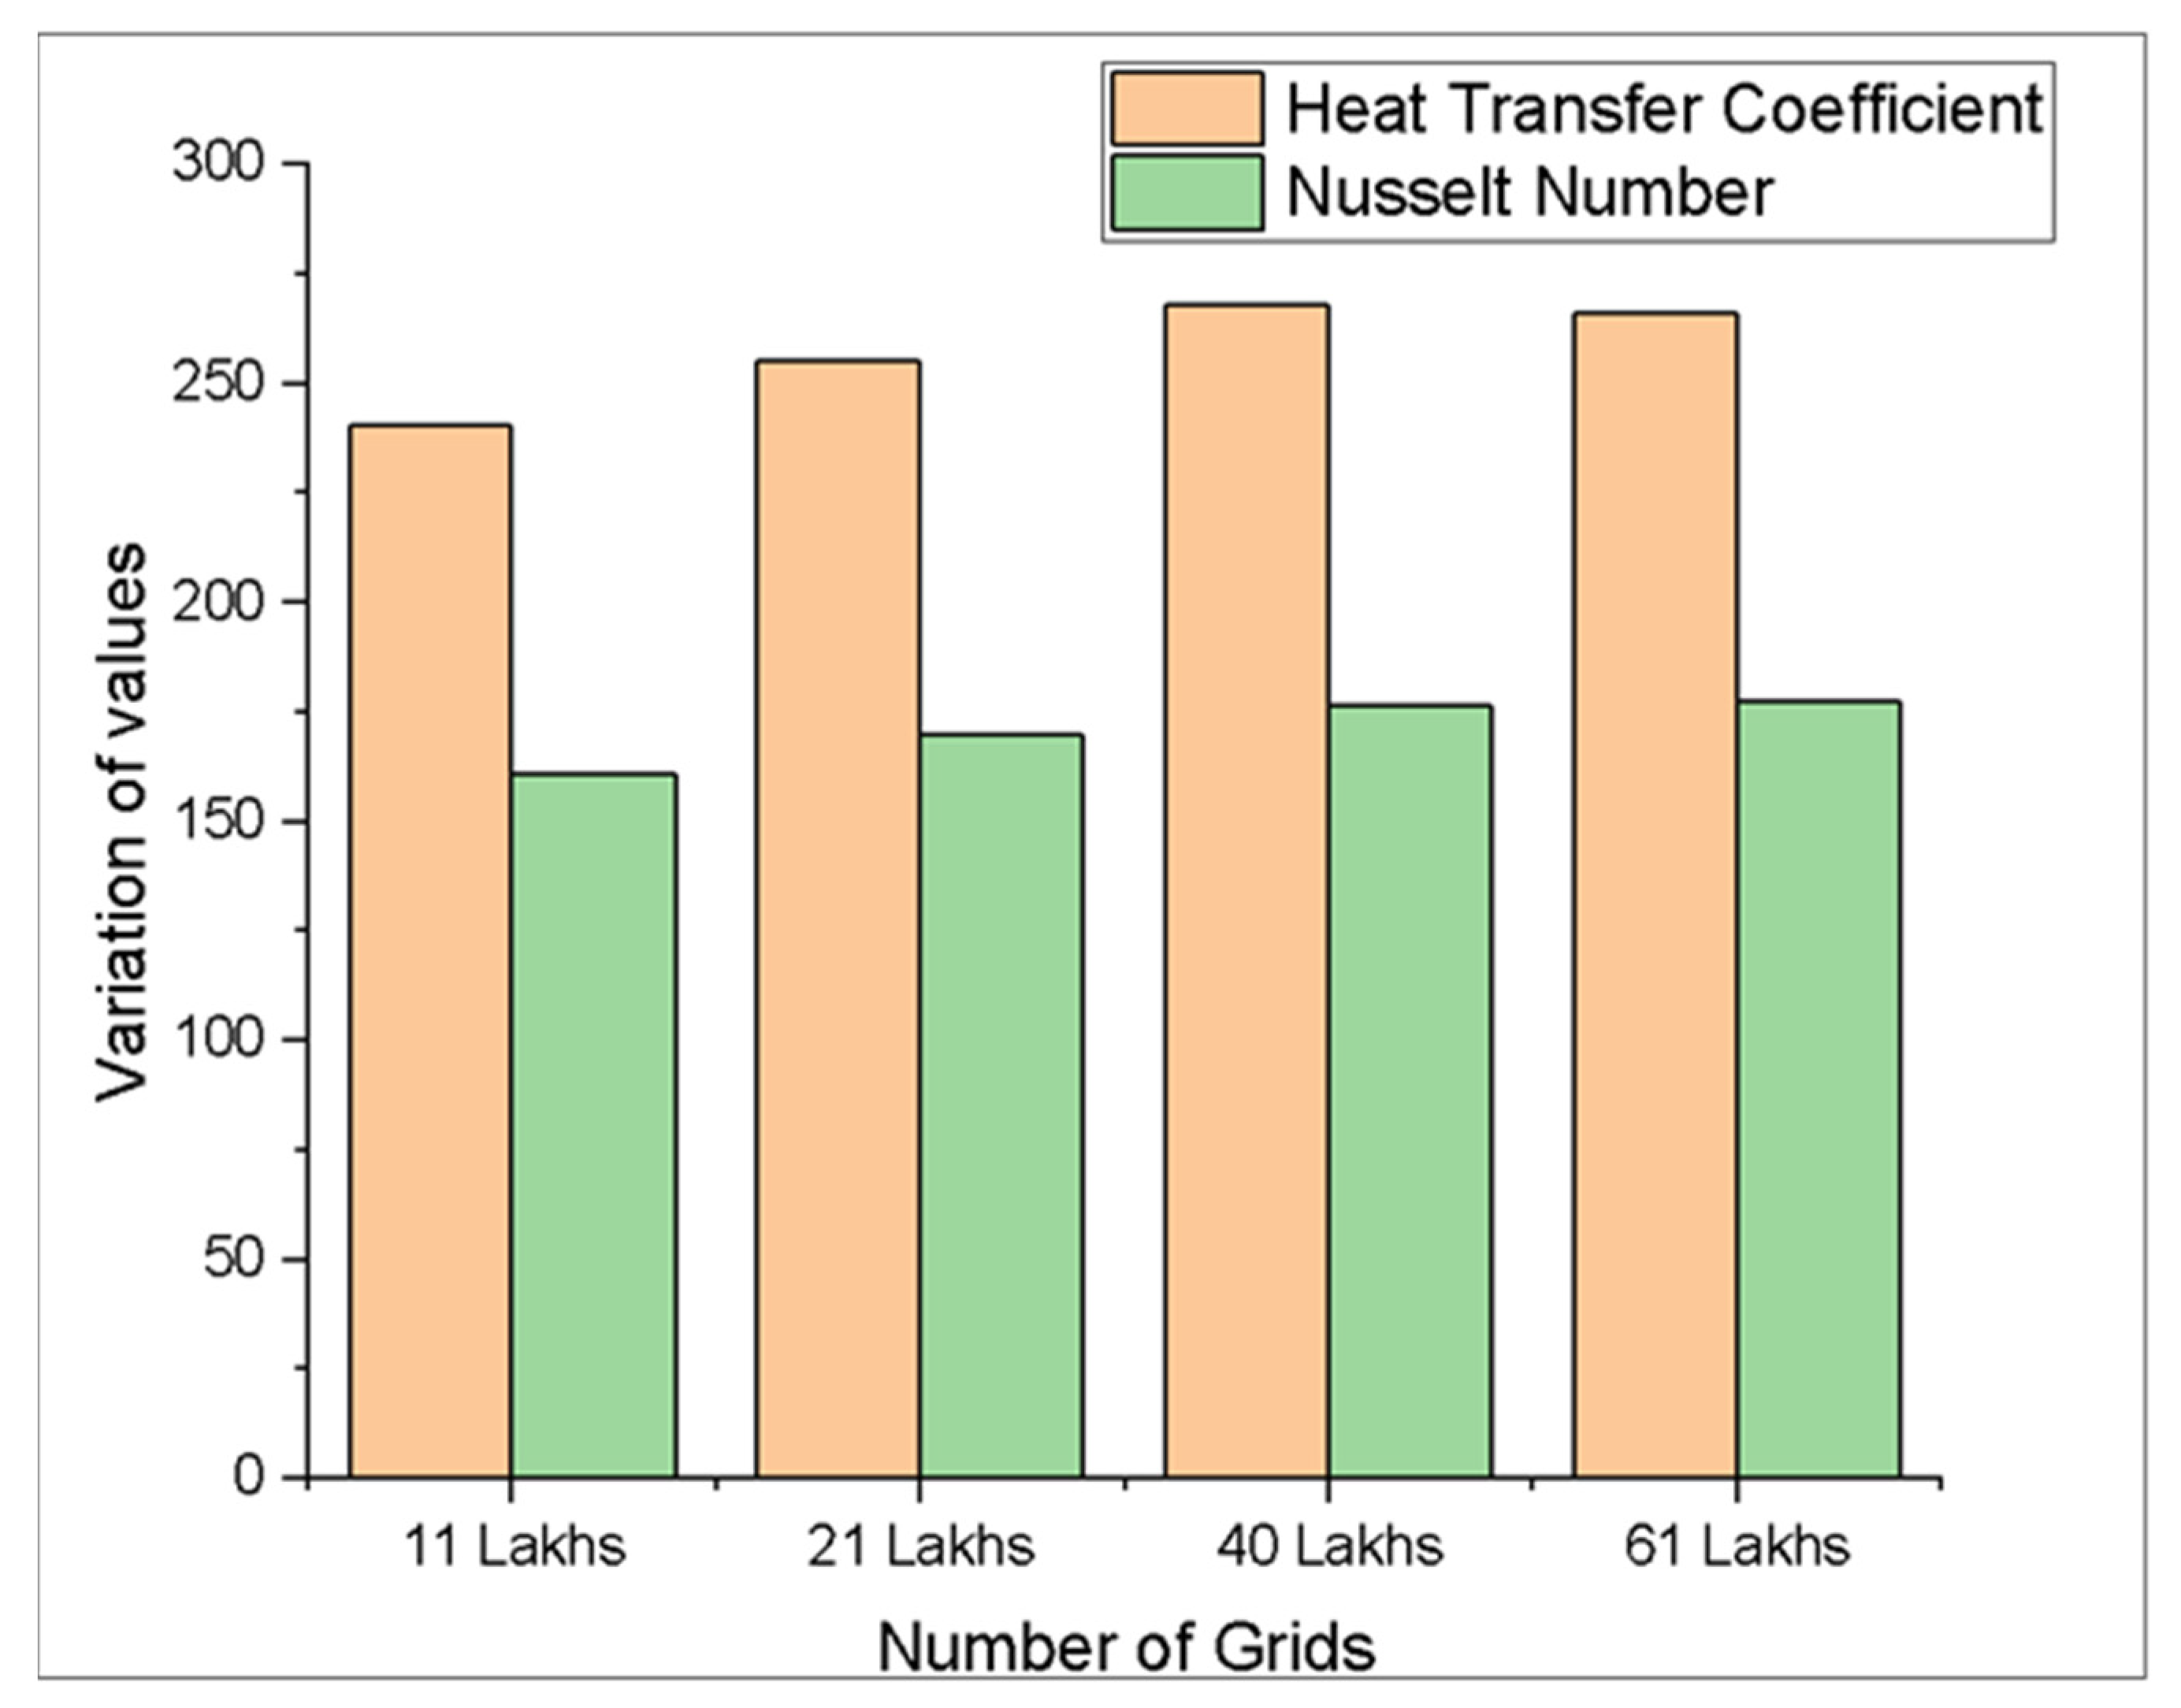
| Number of Cells | 1,134,031 | 2,155,673 | 4,045,608 | 6,107,308 |
|---|---|---|---|---|
| hi | 240.34 | 255.19 | 267.79 | 266.15 |
| Nup | 160.55 | 169.62 | 176.24 | 177.13 |
| Sl. No. | Designation | Pitch = P | Para-Inclination = PI |
|---|---|---|---|
| 1 | Plain | ---------- | ---------- |
| 2 | Case 1 | 30 mm = P1 | 10° PI |
| 3 | Case 2 | 30 mm = P1 | 15° PI |
| 4 | Case 3 | 30 mm = P1 | 20° PI |
| 5 | Case 4 | 40 mm = P2 | 10° PI |
| 6 | Case 5 | 40 mm = P2 | 15° PI |
| 7 | Case 6 | 40 mm = P2 | 20° PI |
| 8 | Case 7 | 50 mm = P3 | 10° PI |
| 9 | Case 8 | 50 mm = P3 | 15° PI |
| 10 | Case 9 | 50 mm = P3 | 20° PI |
| Case Study | a | b | c |
|---|---|---|---|
| at 10° PI | 3.618 | −0.2914 | −0.6076 |
| at 15° PI | 4.866 | −0.3004 | −0.6076 |
| at 20° PI | 4.085 | −0.2515 | −0.6298 |
| at 10° PI | 4.51 × 10⁻³ | 1.0637 | −0.1241 |
| at 15° PI | 1.07 × 10⁻³ | 1.2317 | −0.1448 |
| at 20° PI | 7.23 × 10⁻⁴ | 1.2748 | −0.0513 |
| Sl. No. | Parameters | Error Range (%) |
|---|---|---|
| 1 | Flow rate of hot fluid | 1.56–4.89 |
| 2 | Flow rate of cold fluid | 1.52–4.92 |
| 3 | Reynolds Number | 2.04–5.23 |
| 4 | Pressure drop | 1.08–2.03 |
| 5 | Heat transmission coefficient | 1.23–5.15 |
| 6 | Nusselt Number | 1.67–5.42 |
| 7 | Friction factor | 1.89–5.33 |
| 8 | Temperature | 1.04–2.45 |
Publisher’s Note: MDPI stays neutral with regard to jurisdictional claims in published maps and institutional affiliations. |
© 2022 by the authors. Licensee MDPI, Basel, Switzerland. This article is an open access article distributed under the terms and conditions of the Creative Commons Attribution (CC BY) license (https://creativecommons.org/licenses/by/4.0/).
Share and Cite
Rajashekaraiah, T.; Bettaiah, G.K.; Rajendran, P.; Abbas, M.; Khan, S.A.; Saleel, C.A. Numerical Modelling and Experimental Validation of Novel Para Winglet Tape for Heat Transfer Enhancement. Mathematics 2022, 10, 2893. https://doi.org/10.3390/math10162893
Rajashekaraiah T, Bettaiah GK, Rajendran P, Abbas M, Khan SA, Saleel CA. Numerical Modelling and Experimental Validation of Novel Para Winglet Tape for Heat Transfer Enhancement. Mathematics. 2022; 10(16):2893. https://doi.org/10.3390/math10162893
Chicago/Turabian StyleRajashekaraiah, Thejaraju, Girisha Kanuvanahalli Bettaiah, Parvathy Rajendran, Mohamed Abbas, Sher Afghan Khan, and C. Ahamed Saleel. 2022. "Numerical Modelling and Experimental Validation of Novel Para Winglet Tape for Heat Transfer Enhancement" Mathematics 10, no. 16: 2893. https://doi.org/10.3390/math10162893
APA StyleRajashekaraiah, T., Bettaiah, G. K., Rajendran, P., Abbas, M., Khan, S. A., & Saleel, C. A. (2022). Numerical Modelling and Experimental Validation of Novel Para Winglet Tape for Heat Transfer Enhancement. Mathematics, 10(16), 2893. https://doi.org/10.3390/math10162893