Article

Research on Dynamic Properties of Deep Marble Influenced by High Temperature

1
Faculty of Land Resources Engineering, Kunming University of Science and Technology, Kunming 650093, China
2
New Blasting Technology Engineering Research Center of Yunnan Provincial Education Department, Kunming 650093, China
3
Faculty of Mining Industry, Kunming Metallurgy College, Kunming 650033, China
*
Author to whom correspondence should be addressed.
Mathematics 2022, 10(15), 2603; https://doi.org/10.3390/math10152603
Submission received: 20 May 2022 / Revised: 10 July 2022 / Accepted: 12 July 2022 / Published: 26 July 2022
(This article belongs to the Special Issue Mathematical Problems in Rock Mechanics and Rock Engineering)

Abstract

:
Deep rock will be influenced by the excavation disturbances of different degrees, which seriously affects the safety production of underground mines. Considering that deep rock will be impacted by different temperatures and varied disturbance degrees, this work analyzes the effect of temperature on the dynamic properties of marble by means of the dynamic and static combined SHPB test device. The results reveal that as the temperature climbed, the diameter and height of the specimen increased and the mass and longitudinal wave velocity dropped. The variation laws of total stress–strain curves after varied high temperatures are substantially the same; the peak stress was negatively correlated with the action temperature. At 25 °C~400 °C, the failure mode of specimens is less affected by temperature. When the temperature is higher than 400 °C, the failure degree of specimens increases with the growth of temperature. At 25~400 °C, the above energy varies minimally. At 400~800 °C, with the increase in temperature, the incident energy, transmitted energy and absorption energy decrease, and the reflection energy increases gradually.

1. Introduction

With the depletion of shallow resources, the development of mineral resources has migrated to depth. The mining depth worldwide is more than 1000 m. In South Africa, the depth of gold mines greater than 5000 m is obtained [1,2,3,4]. Deep surrounding rock is in a specified temperature field in practical engineering. Its mechanical properties may alter under the influence of temperature field. This can have a significant impact on the development of underground mines [5,6,7,8,9,10]. Blasting or non-explosive mining disturbance is extremely vulnerable to the accumulation of brittle rock in a sudden release of elastic strain energy, which can produce a rock explosion, a loss of mine property, and endanger the staff safety. Therefore, the examination into marble properties and energy distribution law of rocks under different disturbance intensities after high temperature can provide a valuable reference for the identification of rock burst in a deep extraction process.
Extensive research studies have been conducted on rocks subjected to high temperatures in order to investigate the impact of temperature on the mechanical properties of rocks. Chen et al. [11] studied the peak stress, peak strain, and elastic modulus of marble specimens in response to high temperature. By examining the change in ultrasonic velocity and porosity of sandstone following thermal treatment, Zhao et al. [12] identified the temperature influence on sandstone damage. Zhai et al. [13] investigated the influence of temperature on the peak stress and elastic modulus of marble using the MTS810 test system and found that after 800 °C, the mechanical properties of marble deteriorated precipitously. Ni et al. [14] used rock uniaxial compression test to study the mechanical properties of marble samples after 100 °C, 300 °C, 450 °C, 600 °C and 1, 10, 20 different temperature cycles. It is found that with the increase of temperature and cycles, the failure mode of the specimen gradually changes from typical brittle failure to brittle plastic failure. Taking marble as the research object, Huang et al. [15] carried out uniaxial compression test and acoustic wave test on high temperature rock samples after water cooling and natural cooling, analyzed and compared the changes of peak strength, elastic modulus, attenuation coefficient, longitudinal wave velocity and main frequency of rock samples under different conditions. Zeng et al. [16] used polarized light microscopy to investigate fine-grained marble after numerous high-temperature cycles, quantified the length, openness, and number of microcracks, and discussed the crack expansion pattern of specimens after various thermal cycles. Li et al. [17] used uniaxial compression test to analyze and study the physical and mechanical properties of jointed sandstone after experiencing different temperatures, and obtained the variation law of stress-strain curve, peak strength, peak strain and elastic modulus of jointed sandstone after high temperature with temperature. To investigate the effect of temperature on rock impact propensity, Zhang et al. [18] conducted uniaxial compression and fracture electron microscope scanning tests on granite samples under real-time high temperature (25~850 °C) and after high-temperature heat treatment (25~1200 °C).
Using a large-diameter SHPB setup, Xu et al. [19] investigated and analyzed the dynamic mechanical properties of marble at various temperatures and loading rates in rock dynamics. They found that the peak strain and peak stress of specimens exhibited various degrees of loading rate strengthening. Yin et al. [20] conducted an impact test on sandstone subjected to various high-temperature treatments using a SHPB equipment and evaluated the influence of temperature on the mechanical properties of sandstone from a fine perspective. Ping et al. [21] The impact test of sandstone and limestone after high temperature treatment was carried out by variable cross-section SHPB test system. The influence of temperature field on rock dynamic properties was studied. Yin et al. [22] used a self-developed temperature-pressure coupling and dynamic disturbance test system to study the impact test of sandstone samples under four temperature levels (20 °C, 100 °C, 200 °C, 300 °C) and four axial static pressure levels (0, 20, 60, 80 MPa). Based on the principle of energy dissipation, the energy dissipation law of rock specimen under dynamic-static combined loading at different temperatures is calculated. Liu et al. [23] carried out rock impact compression tests at room temperature under different impact pressures (0.8, 1.0, 1.2 MPa) and under different temperatures (200 °C, 400 °C, 600 °C, 800 °C) using a split Hopkinson pressure bar device to study the high temperature dynamic behavior of deep skarn. Using MTS652.02 and SHPB test system, Li et al. [24] carried out uniaxial impact compression test on sandstone samples heated at 800 °C, and analyzed the variation of dynamic characteristics of sandstone in the strain rate range of 17.904~62.600 s−1.Using SHPB device, Zhang et al. [25] studied the dynamic failure characteristics of sandstone after treatment at −15 °C~1000 °C, and analyzed the influence of temperature on the damage degree and energy dissipation in the failure process of deep sandstone.
In summary, there are extensive studies on the physical and mechanical properties of high-temperature marble under static and dynamic loading conditions. However, the effect of temperature on the mechanical characteristics of rocks under combined dynamic and static conditions is given little attention in the available literature. In order to study the effect of temperature on the physical and dynamic properties of marble under dynamic and static combination, the basic physical parameters of marble after different temperature treatments were measured. At the same time, the stress—strain SHPB test device was used to study the stress-strain curve, crushing characteristics and the relationship between energy evolution and temperature of marble specimens.

2. Specimen Preparation and Test Procedures

The rock specimens were collected at the Dahongshan copper mine in Yuxi, Yunnan, China. Samples were gathered from the same compacted and homogenous rock block specimen. The size of the marble sample was determined to be Φ 50 × 50 mm in size in accordance with the stress uniformity theory and SHPB test sample size reference [26]. Using the SC-200 automatic coring machine, SCQ-300 automatic cutting machine, and SHM-200 double end grinder, rock samples were cored, cut, and ground for testing. The vertical error is less than 0.25° and both ends of the control specimen are uneven by less than 0.05 mm. The marble specimen has a compressive strength of 60.75 MPa, a modulus of elasticity is 38.71 GPa with a density of 2.70 g/cm3.
First, all the marble specimens were separated into 5 groups and the specimens in each group were numbered for the convenience of recording. Next, the specimen mass, height, diameter, and longitudinal wave velocity were measured. Subsequently, each group of samples was placed in an XH7L-12 box resistance furnace with temperatures set to 200 °C, 400 °C, 600 °C, and 800 °C, respectively. After reaching the specified temperature, the samples were maintained at a steady temperature for two hours. Before and after high temperature, the mass, height, diameter, and longitudinal wave velocity of samples were measured after natural cooling. Finally, the uniaxial impact compression test of the specimen was carried out and the crack propagation information was recorded using a high-speed camera.

2.1. Experimental System and Experimental Principle

The test adopts the SHPB test apparatus of the Rock Mechanics Laboratory at Kunming University of Science and Technology to conduct a dynamic and static combined impact test on the marble specimen. As depicted in Figure 1, the system consists primarily of three components: the main equipment, the launch system, and the test system, including power source, the bullet, the elastic pressure bar, the axial loading device, the support frame, and the test analysis instrument. The elastic pressure bars consist of both incident and transmitted bars. The length of the incidence bar is 2000 mm, the length of the transmitted bar is 1500 mm, the diameter of the elastic bar is 50 mm, the longitudinal wave velocity is 5190 m/s, and the elastic modulus is 210 GPa.
The motion equation has a decisive influence on the axial motion of particles in the bar, so it is necessary to discuss the motion equation. The cross-sectional area of incident bar and transmitted bar is A 0 , the elastic modulus is E 0 , and the density is ρ 0 . Figure 2 shows the schematic diagram of a micro-element before bar deformation.
As shown in the above figure, it is assumed that the length of the differential element is dy and the cross-sectional area is A0. The whole compression bar is in a static equilibrium state before the impact. When the punch strikes the bar, the bar deforms, and the particles in the differential element are subject to the left force F1 and the right force F2. The forces F1 and F2 operating on the differential element are proportional to the stress acting on the cross-section of the compression bar. In the elastic range, the connection between the stress and strain of the compression bar follows Hooke’s law, and the strain caused by the compression bar can be obtained. This strain can be expressed by the particle’s displacement of the particle, that is, the resistance in the differential element can be expressed by the particle’s displacement. Let the left end face displacement of the micro element be μ 1 and the right end face displacement be μ 2 . Then, a stress equation exists [27]:
F 1 = A 0 E 0 μ 1 x F 2 = A 0 E 0 μ 2 x  
According to Newton’ s second law, we can obtain the following pressure pulse motion equation:
A 0 E 0 μ 1 x A 0 E 0 μ 2 x = A 0 d x ρ 0 2 μ 1 t 2
Assuming that the particle acceleration in the differential element is a constant, the equation can be simplified as follows:
C 0 2 μ 1 x μ 2 x = 2 μ 1 t 2 d x
where C 0 is the wave velocity of stress wave in bar, which can be calculated by the following formula:
C 0 = E 0 / ρ 0
where E 0 and ρ 0 are elastic modulus and density of elastic bar, respectively.
Since the differential element displacement μ 1 and μ 2 have the following relationship:
C 0 2 2 μ 1 x 2 = 2 μ 1 t 2
Based on the basic theory of wave dynamics, the wave equation in one-dimensional elastic compression bar is derived.
When the bullet hits the incident bar at a certain impact velocity, a compression strain pulse ε 1 ( t ) will be produced in the incident bar. Under the condition of one-dimensional stress propagation, the stress pulse, also known as the elastic stress wave, propagates forward with velocity C 0 in the incident bar. When the incident wave propagates to the interface between the incident bar and the rock specimen, because the wave impedance of the rock is less than that of the incident bar, part of the pulse is reflected into the incident bar to form a reflection unloading strain pulse ε R ( t ) , and the remaining part generates a transmitted compression strain pulse ε T ( t ) in the transmitted bar [28]. Strain gauges adhered to the incident bar and transmitted bar can measure three types of strain pulses ε 1 ( t ) , ε R ( t ) and ε T ( t ) .
The displacement of the left and right ends of the specimen is μ 1 and μ 2 , respectively. The velocities of the incident wave, reflection wave, and transmitted wave on the end surface are v I , v R , and v T , respectively. The velocities of the left and right ends are v 1 and v 2 , respectively. According to the theoretical derivation formula:
v 1 = v I + v R = C 0 ε I + C 0 ε R = C 0 ε R ε I v 2 = v T = C 0 ε T
Displacements are:
μ 1 = 0 t v 1 d t = C 0 0 t ε R ε I d t μ 2 = 0 t v 2 d t = C 0 0 t ε T d t
Assuming that the original length of the specimen is LS, the average strain of the specimen is:
ε S = μ 1 μ 2 L S = C 0 L S 0 t ε I ε R ε T d t
Then, the force F1 and F2 of sample face 1 and face 2 are:
F 1 = A 0 E 0 ε I + ε R F 2 = A 0 E 0 ε T
When the cross-sectional area of the specimen is the same as the area of the elastic compression bar, the stress at both ends of the specimen is:
σ 1 = E 0 ε I + ε R σ 2 = E 0 ε T
The average stress σ S in the sample is:
σ S = σ 1 + σ 2 2 = E 0 ε I + ε R + ε T 2
In summary, the stress, strain, and strain rate of the specimen are obtained [29]:
σ S ( t ) = 1 2 E 0 ε I ( t ) + ε R ( t ) + ε T ( t ) ε S ( t ) = 0 t ε I ( t ) ε R ( t ) ε T ( t ) d t ε ˙ S ( t ) = C 0 L S ε I ( t ) ε R ( t ) ε T ( t )
The energy carried by incident wave, reflected wave, and transmitted wave can be calculated by integrating the measured strain. The integral formula is as follows:
W = A 0 ρ 0 C 0 0 t ε 2 ( t ) d t
The energy carried by incident wave, reflected wave, and transmitted wave is as follows:
W I = A 0 ρ 0 C 0 0 t ε I 2 d t W R = A 0 ρ 0 C 0 0 t ε R 2 d t W T = A 0 ρ 0 C 0 0 t ε T 2 d t
According to the law of conservation of energy, the energy loss in the impact process can be obtained, and the energy absorbed by the specimen can be expressed as:
W A = W I W R W T
where WI represents the energy carried by the incident wave; WR is the energy carried by the reflected wave; WT is the energy carried by the transmitted wave; and WA is the energy dissipated in the test, that is, the energy absorbed by the failure of the specimen.

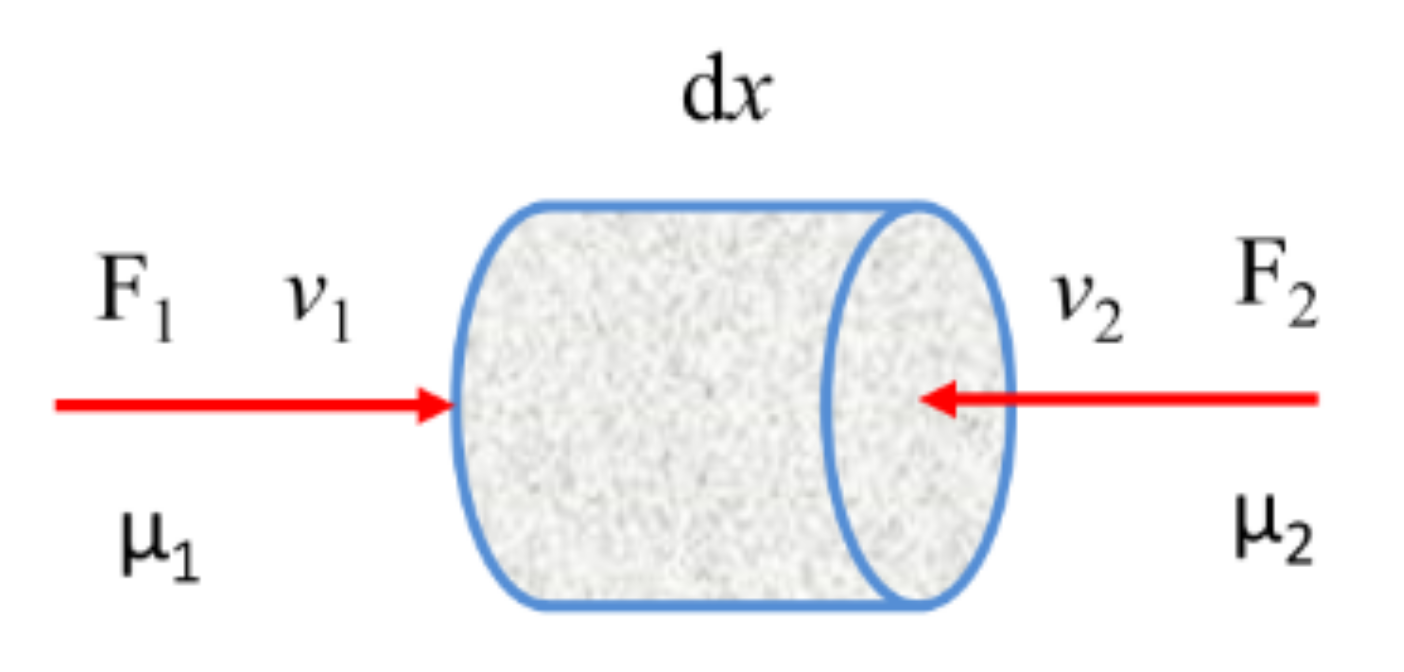
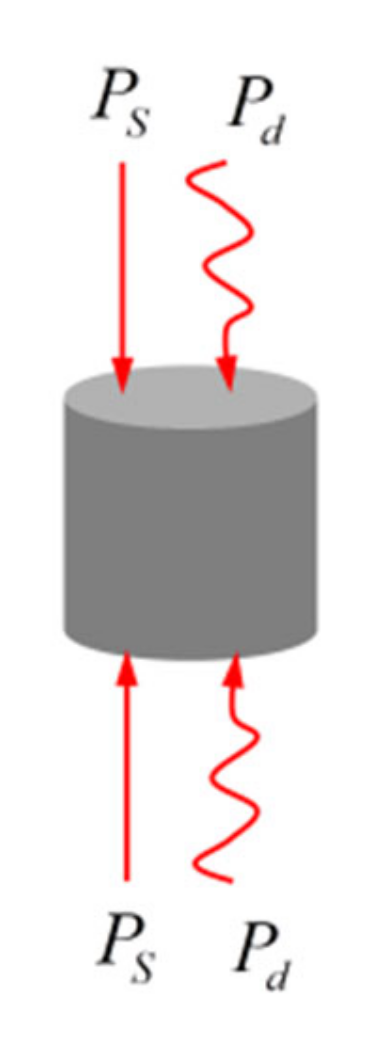
2.2. Model and Principle of One-Dimensional Static and Dynamic Combination Loading

Before the one-dimensional static and dynamic combined loading test, it is necessary to analyze whether the bar and specimen under axial compression meet the stress wave transmitted theory on which the device depends.
As shown in Figure 3, deep rock mass under one-dimensional stress is often subjected to both static stress and dynamic load. Sample micro-force of static and dynamic combination is shown in Figure 4. According to the assumption of one-dimensional stress wave in the bar [30], the force–deformation relationship of the micro-element under combined loading can be obtained:
P S + P d x Δ x = ρ 0 A 0 Δ x 2 u t 2
A 0 and ρ are the cross-sectional area and density of the elastic bar, respectively; u is the displacement of the micro-element after being stressed; and P S and P d are the static and dynamic loading of the sample, respectively.
According to stress, strain, and Hooke’s Law:
σ = P S + P d A 0 σ = E 0 ε ε = u x
Combining the above equations yields:
ρ 0 2 u t 2 = E 0 2 u x 2
The velocity of incident stress wave in compression bar can be expressed by Formula (4), then Formula (18) can be expressed as:
2 u t 2 C 2 2 u x 2 = 0
The same fluctuation equations derived from the combined dynamic and static loading experimental system and the conventional SHPB test system illustrate the applicability of the one-dimensional stress wave theory to the one-dimensional combined dynamic and static loading experimental system.

2.3. Experimental Procedure

In this experiment, the loading axial pressure of marble was determined to be 6 MPa, or 10% of its uniaxial compressive strength, based on its uniaxial compressive strength. The impact of velocity was determined by conducting pre-tests on specimens at room temperature. The pre-test results show that when the impact pressure is 0.4 MPa, the specimen is damaged after three times of impact. Therefore, the impact pressure was set as 0.5 MPa, 0.55 MPa, 0.6 MPa, 0.65 MPa in this experiment. The corresponding average impact velocities were 15.32 m/s, 18.17 m/s, 21.83 m/s and 23.49 m/s, respectively. The corresponding average impact velocities were 15.32 m/s, 18.17 m/s, 21.83 m/s, and 23.49 m/s, while the temperature gradients were 25 °C, 200 °C, 400 °C, 600 °C, and 800 °C, respectively. For this reason, this experiment was separated into four groups, with five pieces in each group undergoing an impact test at a different temperature. Three parallel tests were designed for each temperature, totaling 60 pieces.

3. Physical Properties of Marble before and after High Temperature

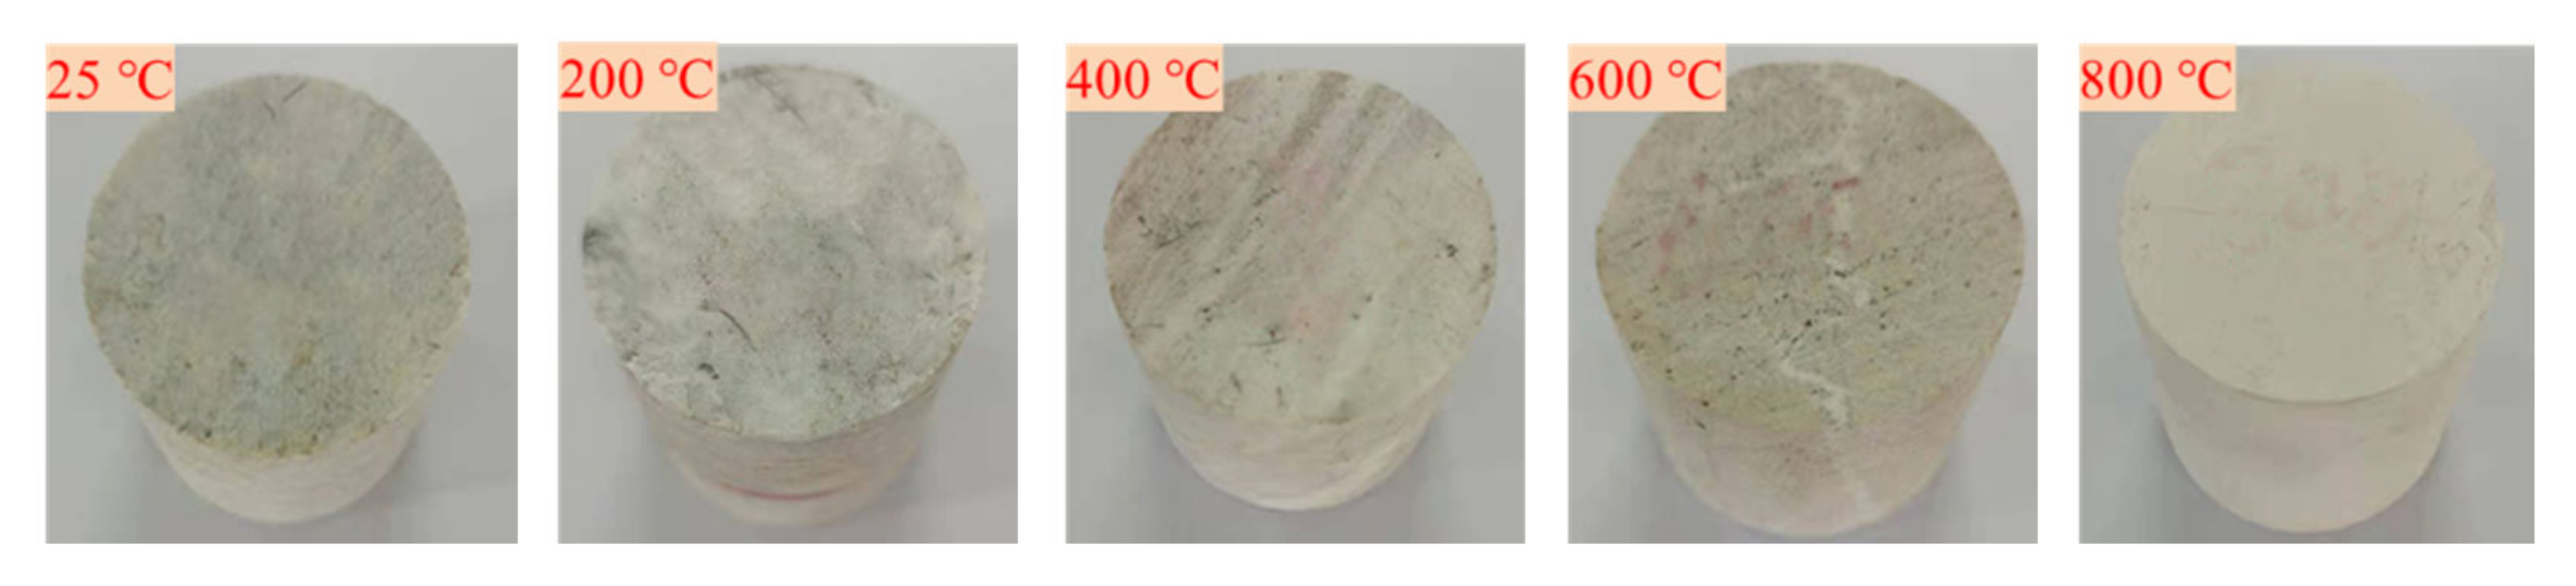
3.1. Apparent Morphological Characteristics of Specimens before and after High Temperature

The apparent diagram of marble specimens treated at different temperatures (25~800 °C) is shown in Figure 5. The diagram shows that the apparent color of marble specimen heated at 200 °C is deepened. When the temperature exceeds 400 °C, the color of marble specimen surface gradually becomes lighter, that is, from light gray to milky white, and a large number of black spots appear on the specimen surface [31]. At 600 °C, the surface of marble becomes very rough, and many microcracks appear on the surface, indicating that the mineral composition of marble has undergone phase transformation, which destroys the original microstructure of the rock. When the temperature reaches 81,000 °C, the color of the specimen becomes white, the volume expansion decreases obviously, and the internal structure of marble has been seriously damaged.

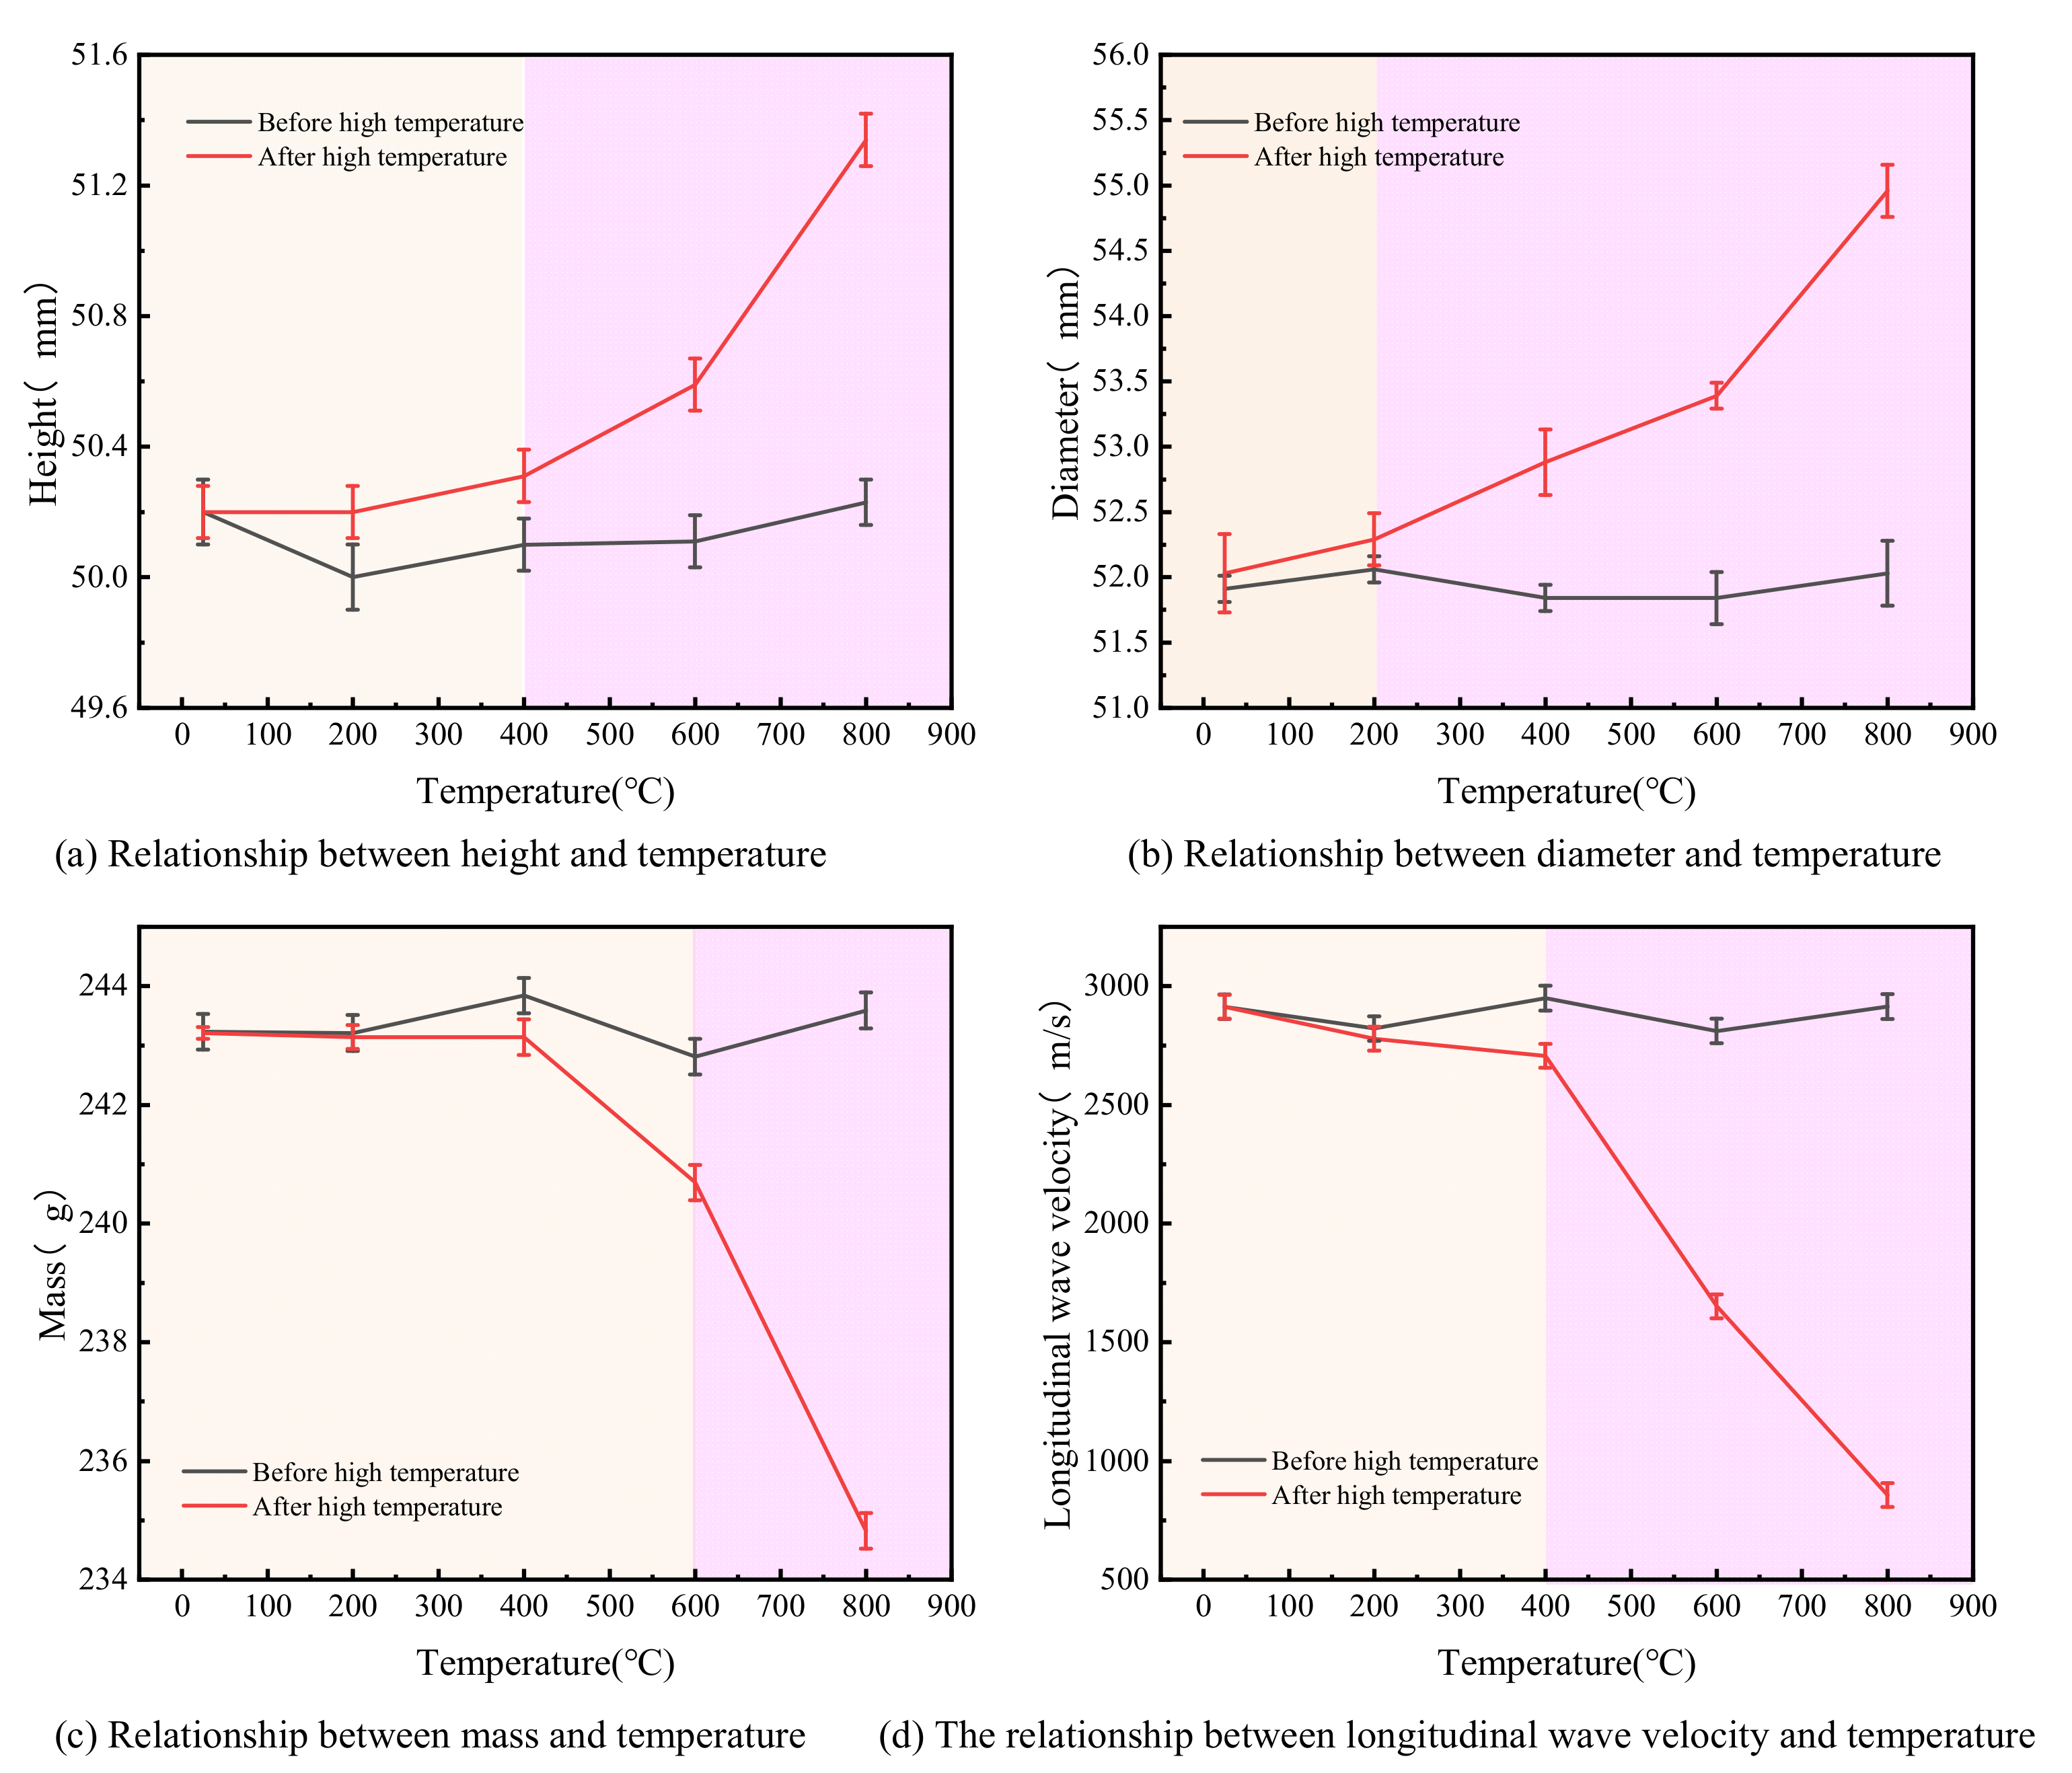
3.2. Variation in Specimen Mass and Longitudinal Wave Velocity

Figure 6a–d shows the changes in geometric size and physical properties of marble before and after high-temperature treatment. Figure 6a depicts the relationship between marble sample height and temperature. The specimen height increases with the increase in temperature on the whole. When heated to 200 °C~400 °C, the specimen height changed little. When heated to 600 °C~800 °C, the height of the specimen changes noticeably. When the temperature was 800 °C, the height of the specimen increased from 50.23 mm before heating to 51.34 mm, with an increase of 2.2%. The fluctuation curve of marble sample diameter with temperature is shown in Figure 6b The variation in the diameter with temperature is similar to that of the diameter with temperature. The diameter of a specimen increases as the temperature rises. At a room temperature of 200 °C, the height of the specimen changed little. At 200 °C, the diameter of the specimen increased by only 0.23 mm. When heated to 400 °C, 600 °C, and 800 °C, the diameter of the specimen changed drastically. After a high temperature of 800 °C, the diameter increased from 52.03 mm before heating to 54.96 mm, with an increase of 5.6%. This is primarily due to the irreversible thermal expansion of the internal part of the specimen at high temperature. Therefore, the specimen size will not return to its original state after cooling. Due to the decomposition of carbonates when the temperature reaches 800 °C, the rock strength rapidly declines, and CO2 gas is emitted during the decomposition process, causing the expansion of the height and diameter of high-temperature marble and loose particles [32]. Figure 6c illustrates the variation curve of sample mass and temperature. Between the room temperature and high temperature of 600 °C, the mass change in the sample was not obvious, the loss rate was less than 1%. At 800 °C, the mass decreased from 243.59 g to 234.82 g, reduced by 3.6%. Due to the thermal decomposition of some minerals in marble caused by the high temperature, the specimen mass changes significantly [33]. The fluctuation curve of marble longitudinal wave velocity with temperature is depicted in Figure 6d The longitudinal wave velocity of the sample decreases with the increase in the overall temperature of the sample. The longitudinal wave velocity of the sample heated to 400 °C changed little, only reducing by 8.6%. When heated to 600 °C and 800 °C, the longitudinal wave velocity decreased significantly by 41.27% and 70.62%, respectively. There are two main reasons for the decrease in rock longitudinal wave velocity after high temperature. On the one hand, when the rock is subjected to high temperature, the free water in the pore evaporates to water vapor and the volume of the pore increases. The pore has a blocking effect on the propagation of longitudinal wave velocity, resulting in a decrease in wave velocity. On the other hand, there are a large number of cracks in the rock, which will lead to the further expansion of cracks and the generation of new cracks under the action of temperature. The higher the temperature, the higher the number of cracks, so the wave velocity of rock samples decreases significantly after high temperature [34]. The above result shows that temperature has a significant impact on the physical properties of marble, and the greater the temperature, the more obvious the impact.

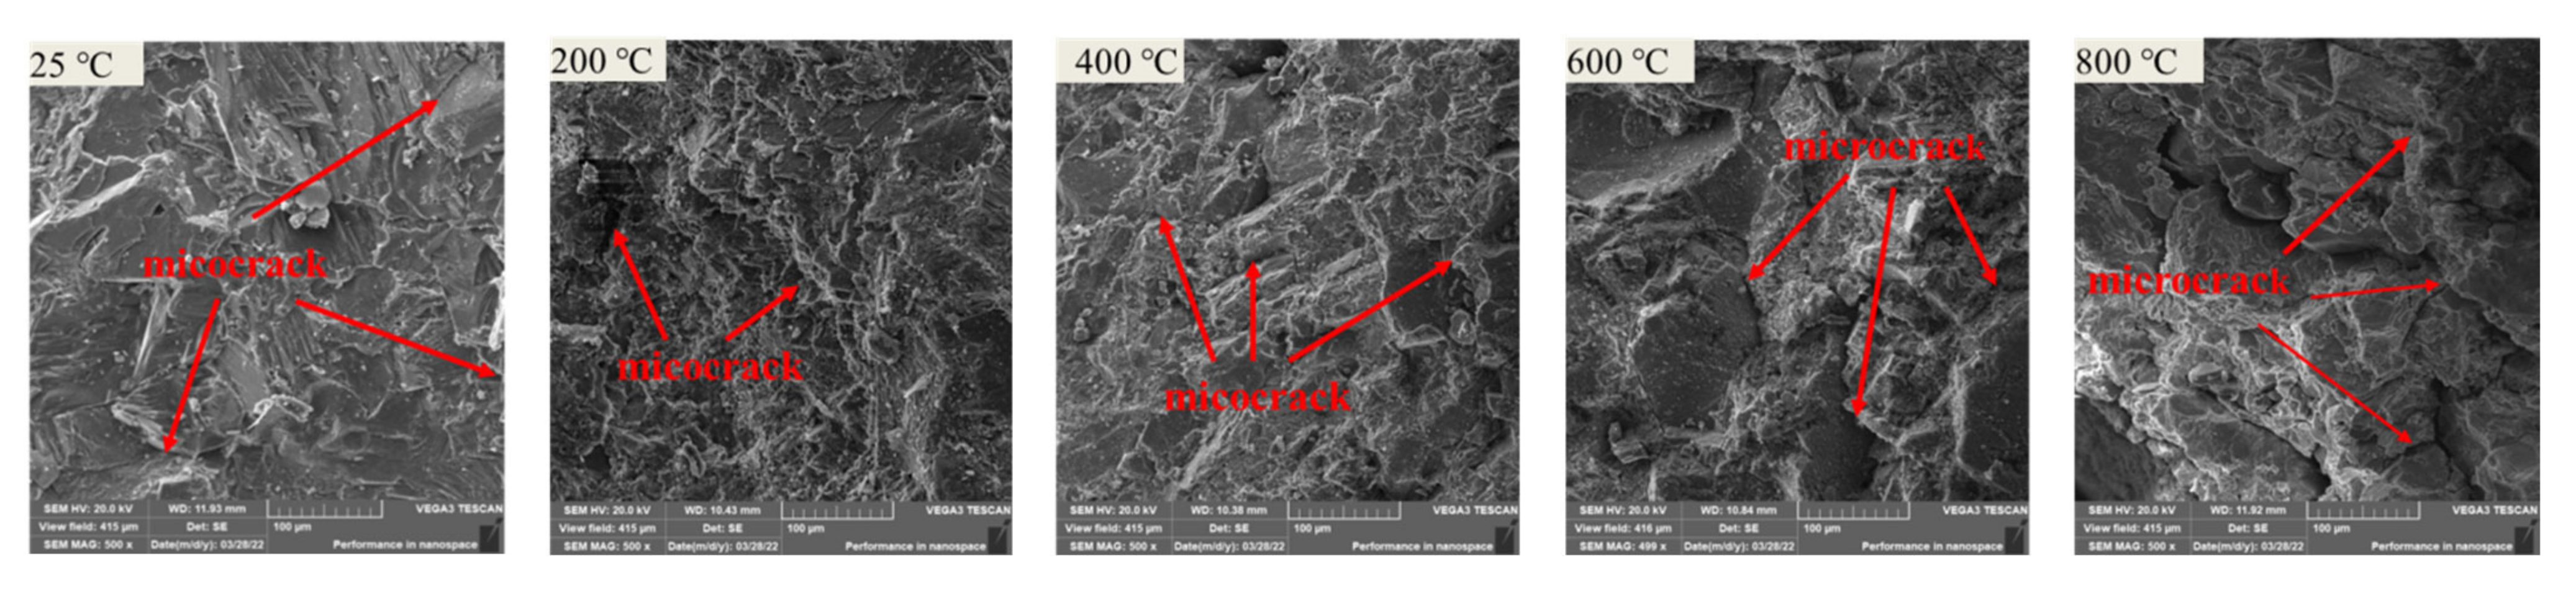
3.3. Influence of High Temperature on the Microstructure of Marble

The change in the internal microstructure of rock can be observed by scanning electron microscope images. Figure 7 illustrates typical SEM images of granite samples subjected to varying temperatures. For comparison purposes, all images have the same magnification (Mag = 500). Even at room temperature (25 °C), marble retains its natural cracks. When marble samples were heated to 200 °C, the number of microcracks did neither increase nor decrease. Compared to the marble at room temperature, the crack width and number of specimens increased marginally following heat treatment at 400 °C, but the increase was minimal. In the specimens of marble subjected to heat treatments at 600 °C and 800 °C, the number and width of cracks rose dramatically. At 800 °C, cracks even penetrated the specimens, and the thermal damage of specimens was serious.

4. Dynamic Compressive Mechanical Properties of Marble after High Temperature

4.1. Stress–Strain Properties

The total stress–strain curves of marble specimens under different loading speeds at room temperature and after different high temperatures are shown in Figure 8.
It can be seen from Figure 8 that the total stress–strain curves of marble specimens treated at different temperatures (T) under different loading rates ( v ) can be roughly divided into four stages, namely fissure compaction stage, elastic deformation stage, plastic deformation stage, and failure stage. In the initial compaction stage, the microcracks in marble tend to close under external dynamic load. Therefore, in this stage, the stress-strain curve slightly upward bending, curve slope increases gradually. Under dynamic load, the stress-strain curves of concave stage are not obvious, but it do exist [35,36]. In the elastic deformation stage, the strain grows as the stress increases, and their correlation is approximately linear. At varying temperatures, the slopes of marble specimens vary. In the plastic deformation stage, as stress increases, the slope of the curve gradually reduces, and the rate of slope reduction for marble at different temperatures varies. When peak stress is attained, the slope of the curve becomes zero. In the failure stage, the stress-strain curve decreases rapidly, and the slope of the curve is negative. At this time, the bearing capacity of marble decreases.
When the impact velocity is constant, the stress-strain curves of marble vary at different temperatures. Specifically, before 400 °C, the stress-strain curves of marble had little difference. At this time, the failure stage curve of the specimen has a “drop” phenomenon, indicating that the brittleness of the specimen is obvious within this temperature range. When the temperature exceeds 400 °C, the stress-strain curve of the specimen gradually shifts to the right, and the slope of the curve slows down in the failure stage, indicating that the mechanical properties of marble change from brittleness to plasticity. When the temperature is constant, the stress and strain of marble are similar under different impact velocities. With the increase of impact velocity, the specimen shows the strengthening effect of impact velocity, that is, the peak stress increases with the increase of impact velocity.

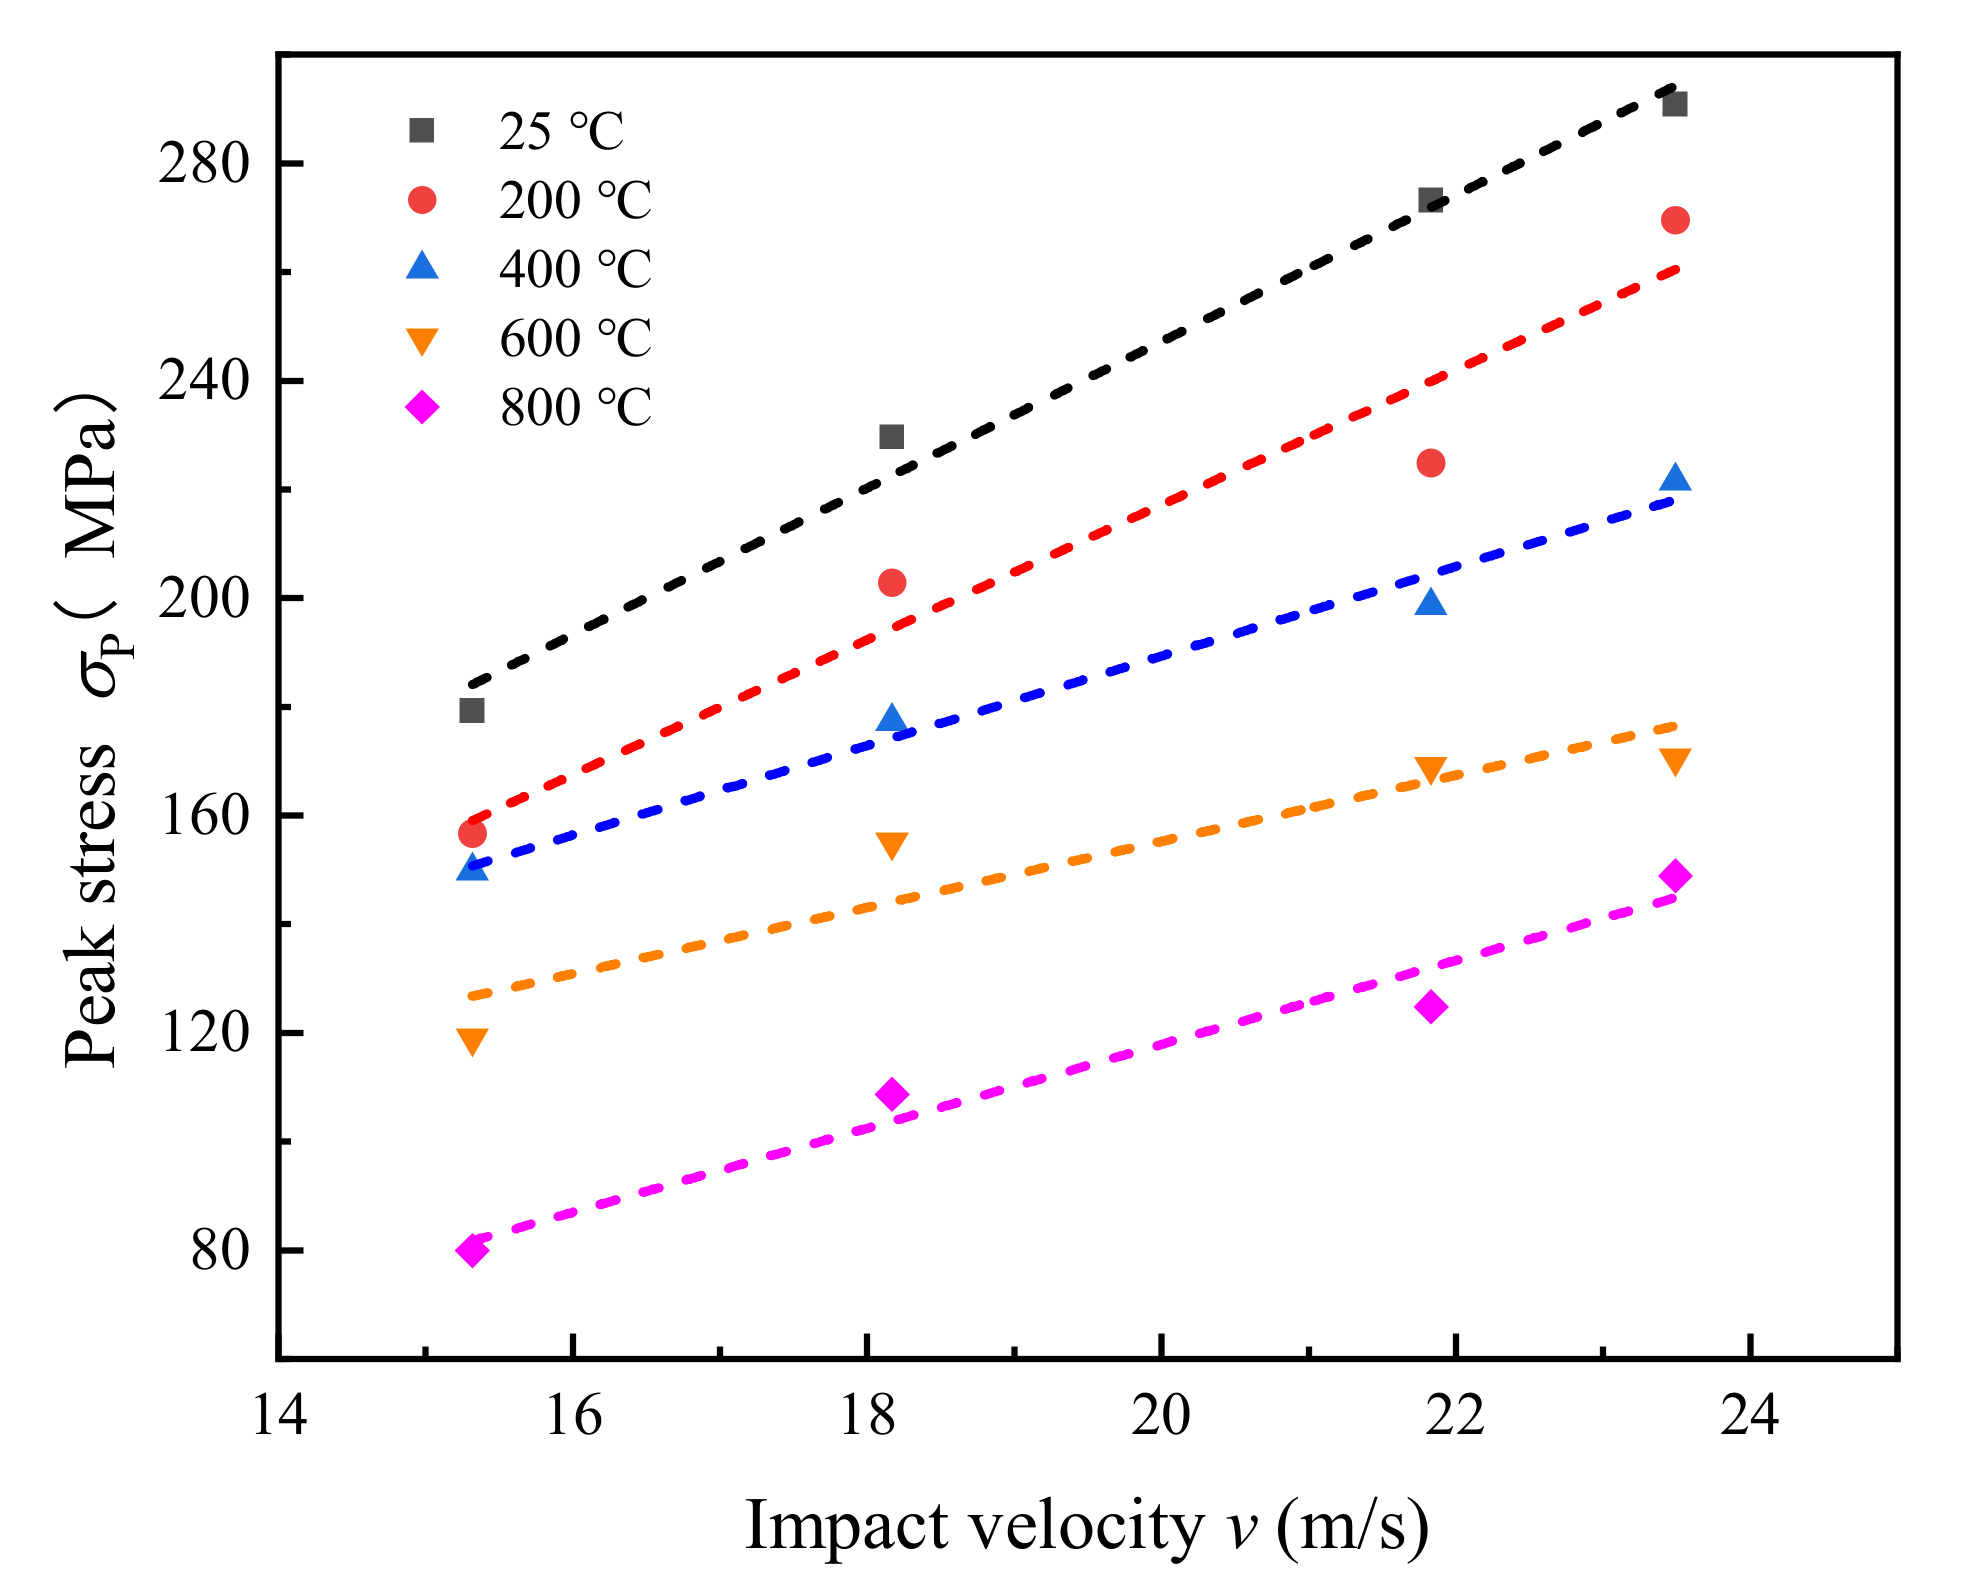
4.2. The Variation Pattern of Peak Stress

Figure 9 shows the relationship between the peak stress, impact velocity, and temperature of the sample. At the same temperature, the peak stress of the marble specimen increases as the impact velocity increases, indicating that the impact velocity has a significant strengthening effect. The dynamic peak stress ( σ P ) increases linearly with the impact velocity ( v ), and the fitting relationship is:
σ P = a v + b  
where a and b are the fitting parameters. The values of marble specimens at different temperatures are shown in Table 1.
Figure 9 demonstrates that, at the same temperature, the peak stress of the specimen increases progressively with increasing impact velocity. When the impact velocity remains unchanged, the specimen’s peak stress steadily falls as the temperature rises.
There are two primary reasons for the analysis: first, the high temperature causes the expansion stress inside the marble specimen to increase, resulting in the expansion of the original micro-cracks and the generation of new micro-cracks [37]. Due to the fact that the primary components of marble are calcite (CaCO3) and dolomite (MgCa(CO3)2), high temperature will lead to the degradation and decomposition of dolomite structure, thereby reducing the ability of marble to resist external load damage.
The relationships between dynamic peak stress and the impact velocity of marble specimens at various temperatures are listed in Table 1. It can be seen from Table 1 that the minimum fitting correlation coefficient R2 between dynamic peak stress and the impact velocity of marble specimens at different temperatures is 0.87, indicating that the correlation between them is obvious. In the fitting formula, coefficient a represents the rate of peak stress rise with impact velocity. The greater the value of a, the more pronounced the strengthening effect of impact velocity. In general, with the gradual increase in temperature, the strengthening effect of impact velocity on marble peak stress is lower.

4.3. Crack Extension Process and Damage Mode

Figure 10 illustrates the axial damage process of marble at a speed of 18.17 m/s and a temperature of 400 °C using a high-speed camera.
During the early loading stage of the stress wave, no cracks are detected on the specimen surface. At 50 μs, as a result of the reciprocating propagation of the stress wave in the specimen, an obvious crack, referred to as the major crack, appears on the side of the specimen. At 100~150 μs, the crack length and width gradually expand with time due to the ongoing action of the stress wave. At 200~300 μs, cracks begin to gather and penetrate the whole specimen. At 400 μs, the specimen became unstable, and its bearing capacity drastically dropped. The formation of cracks is mainly due to the dynamic loading induced stress concentration at the crack tip, such that the stress value at the crack tip exceeds the tensile strength of the specimen.
Figure 11 depicts the failure modes of marble specimens at 25~800 °C under four impact velocities. At the same impact velocity, the crushing degree at 600~800 °C is greater than that at 25~400 °C. It shows that temperature has a significant effect on the fracture characteristics of the specimen. When the impact velocity is low (15.32 m/s ≤ v  ≤ 618.17 m/s), the specimen can still maintain a certain bearing capacity at temperatures between 25~600 °C. At 800 °C, the specimen is unstable. At a higher impact velocity (21.83 m/s ≤ v ≤ 23.49 m/s), at 25 °C ≤ T ≤ 400 °C, the bulk rate of the specimen is higher and the average particle size is larger. When 600 °C ≤ T ≤ 800 °C, the specimen suffered from crushing failure, with small particle size and relatively uniform distribution.
At the same temperature, with the increase in impact velocity, the fracture surface of the specimen gradually expands, the degree of fragmentation increases, and the fragment size decreases [21].

4.4. Energy Analysis of Rocks under Combined Dynamic and Static Loading

In rock engineering, the excavation, fragmentation, and disturbance of rock mass inevitably involve the inflow, accumulation, dissipation, and outflow of energy, and the energy changes throughout the entire rock deformation and failure process. Therefore, it is crucial to examine the failure deformation of rock from the perspective of energy [38]. In the SHPB test, The incident energy (WI), absorption energy (WA), transmitted energy (WT), and reflection energy (WR) can be calculated using Formulas (14) and (15). Figure 12 depicts the relationship between incident energy, absorbed energy, transmitted energy, reflected energy, and temperature at various impact velocities.
Figure 12a–d shows the relationship between the energy and temperature of the specimen under different impact velocities. When the impact velocity is constant, the incident energy increases first and then decreases with the increase of temperature, and reaches the maximum at 400 °C. The reflected energy first decreases and then increases with the increase of temperature, and the two are quadratic functions with an upward opening. The transmission energy and absorption energy first increase and then decrease with the increase of temperature, and the two are quadratic functions with an open downward direction. With the increase of impact velocity, the incident energy, reflection energy, transmission energy and absorption energy of the specimen increase. The fitting relationship between temperature and energy at different impact velocities is listed in Table 2.

5. Conclusions

At room temperature and high temperatures (25~800 °C), the fundamental physical properties of marble were determined. SHPB impact compression test was used to measure the effect of temperature on the dynamic characteristics of marble.
(1)
Temperature has a great influence on the physical properties and geometric size of marble. As the temperature increases, the color of marble specimens gradually changes from light gray to milky white. The length and diameter of marble samples increase with the increase of temperature, while the mass and longitudinal wave velocity decrease with the increase of temperature. From room temperature to 200 °C, the change of physical properties and geometric size of marble is not obvious, but the change is more obvious at 400~800 °C. The higher the temperature, the more obvious the change.
(2)
At the same temperature, the stress-strain curves of marble specimens under different impact velocities are similar. When the impact velocity is constant, with the increase of temperature, the curve gradually shifts to the right, the brittleness of the specimen decreases and the plasticity increases.
(3)
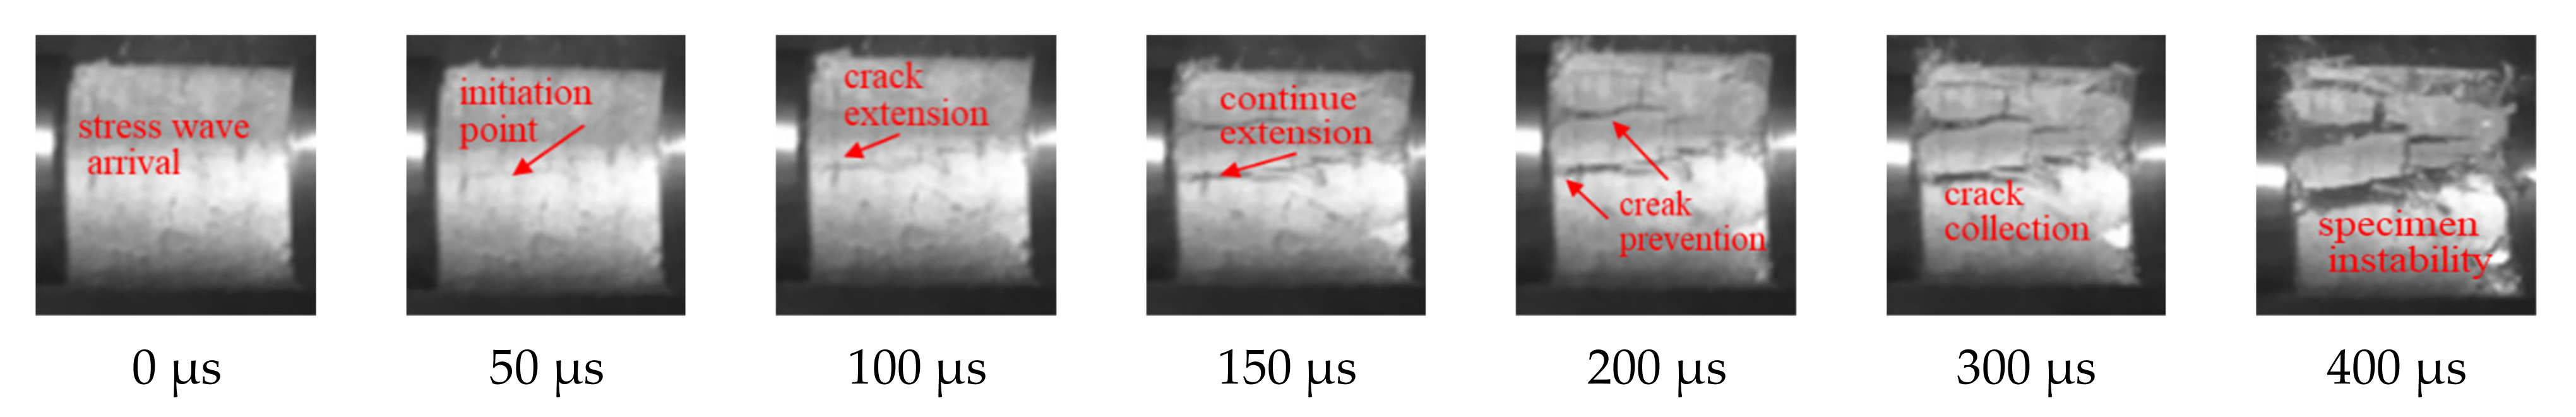
The crack propagation of the specimen is completed within 200 μs, and the failure mode is tensile stress splitting failure. Temperature has significant influence on the failure mechanism of specimens. In general, when the impact velocity is constant, when 25 °C ≤ T ≤ 400 °C, the crushing degree of the specimen is higher than 600 °C ≤ T ≤ 800 °C. When the temperature is constant, the crushing degree increases with the increase of impact velocity, the crushing size decreases gradually, and the particles tend to be uniform.
(4)
When the impact velocity is constant, with the increase of temperature, the changes of incident energy, transmission energy and absorption energy of the specimen are similar, and all increase first and then decrease with the increase of temperature. The relationship between the above energy and temperature is a quadratic function of opening upward. The transmitted energy decreases first and then increases with the increase of temperature, and there is a quadratic function relationship between them.

Author Contributions

Conceptualization, methodology, software, validation, formal analysis, writing—original draft, writing—review and editing: Y.W.; investigation, data curation: X.Z.; supervision, software: L.H.; supervision, methodology: J.W.; funding acquisition, project administration: X.L. All authors have read and agreed to the published version of the manuscript.

Funding

This study was financially supported by the National Natural Science Foundation of China (No. 52164010, No. 52064025), the General Project of Basic Research Program of Yunnan Province (No. 202201AT070178), and Yunnan major scientific and technological special project (202102AG050024). Their support is gratefully appreciated.

Institutional Review Board Statement

Not applicable.

Informed Consent Statement

Not applicable.

Data Availability Statement

Data sharing not applicable.

Conflicts of Interest

The authors declare no conflict of interest.

References

  1. He, M.C.; Xie, H.P.; Peng, S.P.; Jiang, Y.D. Study on rock mechanics in deep mining engineering. Chin. J. Rock Mech. Eng. 2005, 24, 2803–2813. [Google Scholar]
  2. Xie, H.P.; Gao, F.; Ju, Y. Research and development of rock mechanics in deep ground engineering. Chin. J. Rock Mech. Eng. 2015, 34, 2161–2178. [Google Scholar]
  3. Xie, H.P. Research review of the state key research development program of China: Deep rock mechanics and mining theory. J. China Coal Soc. 2019, 44, 1283–1305. [Google Scholar]
  4. Wang, S.F.; Tang, Y.; Wang, S.Y. Influence of brittleness and confining stress on rock cuttability based on rock indentation tests. J. Cent. South Univ. 2021, 28, 2786–2800. [Google Scholar] [CrossRef]
  5. Xie, H.P.; Gao, M.Z.; Zhang, R.; Peng, G.; Wang, W.; Li, A. Study on the mechanical properties and mechanical response of coal mining at 1000 m or deeper. Rock Mech. Rock Eng. 2019, 52, 1475–1490. [Google Scholar] [CrossRef]
  6. Wang, S.F.; Tang, Y.; Li, X.B.; Kun, D.U. Analyses and predictions of rock cuttabilities under different confining stresses and rock properties based on rock indentation tests by conical pick. Trans. Nonferr. Met. Soc. China 2021, 31, 1766–1783. [Google Scholar] [CrossRef]
  7. Wang, S.F.; Li, X.B.; Yao, J.R.; Gong, F.; Li, X.; Du, K.; Tao, M.; Huang, L.; Du, S. Experimental investigation of rock breakage by a conical pick and its application to non-explosive mechanized mining in deep hard rock. Int. J. Rock Mech. Min. Sci. 2019, 21, 104063. [Google Scholar] [CrossRef]
  8. Wang, S.F.; Sun, L.C.; Li, X.B.; Wang, S.; Du, K.; Li, X.; Feng, F. Experimental investigation of cuttability improvement for hard rock fragmentation using conical cutter. Int. J. Geomech. 2021, 21, 06020039. [Google Scholar] [CrossRef]
  9. Sun, B.; Zhang, Z.Y.; Meng, J.L.; Huang, Y.; Li, H.; Wang, J. Research on Deep-Hole Cutting Blasting Efficiency in Blind Shafting with High In-Situ Stress Environment Using the Method of SPH. Mathematics 2021, 9, 3242. [Google Scholar] [CrossRef]
  10. Somani, A.; Nandi, T.K.; Pal, S.K.; Majumder, A.K. Pre-treatment of rocks prior to comminution—A critical review of present practices. Int. J. Min. Sci. Technol. 2017, 27, 339–348. [Google Scholar] [CrossRef]
  11. Chen, G.F.; Yang, S.Q. Study on failure mechanical behavior of marble after high temperature. Eng. Mech. 2014, 31, 189–196. [Google Scholar] [CrossRef]
  12. Zhao, H.B.; Yin, G.Z.; Chen, L.J. Experimental study on effect of temperature on sandstone damage. Chin. J. Rock Mech. Eng. 2009, 28, 2784–2788. [Google Scholar]
  13. Zhai, S.T.; Wu, G.; Sun, H.; Pan, J.H. Acoustic emission characteristics of thermal cracking of marble under uniaxial compression. Chin. J. Rock Mech. Eng. 2012, 31, 1237–1244. [Google Scholar]
  14. Ni, X.H.; Li, X.J.; Huang, D.W. Uniaxial compression tests on mechanical properties of marble after undergoing different numbers of temperature cycling. J. Hydroelectr. Eng. 2016, 35, 95–100. [Google Scholar]
  15. Huang, Z.P.; Zhang, Y.; Wu, W.D. Analysis of mechanics and fluctuation characteristics of high temperature marble cooled by water. Rock Soil Mech. 2016, 37, 367–375. [Google Scholar]
  16. Zeng, Y.J.; Rong, G.; Peng, J.; Sha, S. Experimental study of crack propagation of marble after high temperature cycling. Rock Soil Mech. 2018, 39, 220–226. [Google Scholar]
  17. Li, Q.S.; Yang, S.Q.; Chen, G.F. Strength and deformation properties of post-high-temperature joint sandstone. J. China Coal Soc. 2014, 39, 1283–1305. [Google Scholar]
  18. Zhang, Z.Z.; Gao, F.; Liu, Z.J. Research on rockburst proneness and its microcosmic mechanism of granite considering temperature effect. Chin. J. Rock Mech. Eng. 2010, 29, 1591–1602. [Google Scholar]
  19. Xu, J.Y.; Liu, S. Effect of impact velocity on dynamic mechanical behaviors of marble after high temperatures. Chin. J. Geotech. Eng. 2013, 35, 879–883. [Google Scholar]
  20. Yin, T.B.; Li, X.B.; Yin, Z.Q.; Zhou, Z.L.; Liu, X.L. Study and comparison of mechanical properties of sandstone under static and dynamic loadings after high temperature. J. Rock Mech. Eng. 2012, 31, 273–279. [Google Scholar]
  21. Ping, Q.; Su, H.P.; Ma, D.D.; Zhang, H.; Ma, C.L. Experimental study on physical and dynamic mechanical properties of limestone after different high temperature treatments. Rock Soil Mech. 2021, 42, 932–942. [Google Scholar]
  22. Yin, T.B.; Li, X.B.; Ye, Z.Y.; Gong, F.Q.; Zhou, Z.L. Energy dissipation of rock fracture under thermo- mechanical coupling and dynamic disturbances. J. Rock Mech. Eng. 2013, 32, 1197–1202. [Google Scholar]
  23. Liu, L.; Li, R.; Qin, H.; Liu, Y. Dynamic mechanical properties and microscopic damage characteristics of deep skarn after high-temperature treatment. Chin. J. Geotech. Eng. 2022, 44, 1166–1174. [Google Scholar]
  24. Li, M.; Mao, X.B.; Cao, L.L.; Mao, R.R.; Tao, J. Experimental study of mechanical properties on strain rate effect of sandstones after high temperature. Rock Soil Mech. 2014, 35, 3479–3488. [Google Scholar]
  25. Zhang, R.R.; Jing, L.W. The relationship between the fracture degree of deep sandstone and energy dissipation after high and low temperature in the SHPB test. J. China Coal Soc. 2018, 43, 1884–1892. [Google Scholar]
  26. Li, X.B.; Yin, T.B.; Zhou, Z.L.; Hong, L.; Gao, K. Study of dynamic properties of siltstone under coupling effects of temperature and pressure. Chin. J. Rock Mech. Eng. 2010, 29, 2377–2384. [Google Scholar]
  27. Kraut, E.A. Advances in the theory of anisotropic elastic wave propagation. Rev. Geophys. 1962, 1, 401–448. [Google Scholar] [CrossRef]
  28. Wang, Y.B.; Wen, Z.J.; Liu, G.Q.; Wang, J.; Bao, Z.; Lu, K.; Wang, D.; Wang, B. Explosion propagation and characteristics of rock damage in decoupled charge blasting based on computed tomography scanning. Int. J. Rock Mech. Min. Sci. 2020, 136, 104540. [Google Scholar] [CrossRef]
  29. Zhao, Y.; Zhou, H.G.; Zhong, J.C.; Liu, D. Study on the relation between damage and permeability of sandstone at depth under cyclic loading. Int. J. Coal Sci. Technol. 2019, 6, 479–492. [Google Scholar] [CrossRef] [Green Version]
  30. Wang, Y.B.; Yang, R.S. Study of the dynamic fracture characteristics of coal with a bedding structure based on the NSCB impact test. Eng. Fract. Mech. 2017, 184, 319–338. [Google Scholar] [CrossRef]
  31. Liu, L.; Dong, L.Z.; An, H.M.; Fan, Y.; Wang, Y. Experimental Study of the Thermal and Dynamic Behaviors of Polypropylene Fiber-Reinforced Concrete. Appl. Sci. 2021, 11, 10757. [Google Scholar] [CrossRef]
  32. Liu, S.; Xu, J.J.; Bai, E.L.; Zhi, L.P.; Chen, T.F. Experimental study of dynamic tensile behaviors of marble after high temperature. Rock Soil Mech. 2013, 34, 3500–3504. [Google Scholar]
  33. Liu, L.; Li, R.; Qin, H.; Sun, W. Experimental SHPB Study of Limestone Damage under Confining Pressures after Exposure to Elevated Temperatures. Metals 2021, 11, 1663. [Google Scholar] [CrossRef]
  34. Xia, X.H.; Lu, Y.P.; Huang, X.H.; Shen, W.P. Experimental research on ultrasonic characteristics of marble under the action of high temperature. J. Shanghai Jiaotong Univ. 2004, 38, 1225–1228. [Google Scholar]
  35. Yang, R.S.; Wang, Y.B.; Ding, C.X. Laboratory study of wave propagation due to explosion in a jointed medium. Int. J. Rock Mech. Min. Sci. 2016, 81, 70–78. [Google Scholar] [CrossRef]
  36. Gao, T.; Sun, W.; Liu, Z.; Cheng, H.Y. Cheng, Investigation on fracture characteristics and failure pattern of inclined layered cemented tailings backfill. Constr. Build. Mater. 2022, 343, 128110. [Google Scholar] [CrossRef]
  37. Zuo, J.P.; Zhou, H.W.; Xie, H.P. Fracture characteristics of sandstone under thermal effects. Eng. Mech. 2008, 25, 124–130. [Google Scholar]
  38. Zhang, R.R.; Jing, L.W. Analysis on the fragment and energy dissipation of deep sandstone after high/low temperature treatment in SHPB tests. J. China Coal Soc. 2018, 43, 1884–1892. [Google Scholar]
Figure 1. SHPB test equipment.
Mathematics 10 02603 g001
Figure 2. Diagram of the differential element before the deformation of bar.
Mathematics 10 02603 g002
Figure 3. Schematic diagram of static and dynamic combination.
Mathematics 10 02603 g003
Figure 4. Sample micro-force of static and dynamic combination.
Mathematics 10 02603 g004
Figure 5. Apparent morphology of marble specimens after high-temperature treatment.
Mathematics 10 02603 g005
Figure 6. Changes of physical properties of marble samples after different temperatures.
Mathematics 10 02603 g006
Figure 7. SEM micrograph of marble after high-temperature treatment.
Mathematics 10 02603 g007
Figure 8. Stress–strain curves in marble after high-temperature treatment.
Mathematics 10 02603 g008
Figure 9. Relationship between the dynamic peak stress and the impact velocity.
Mathematics 10 02603 g009
Figure 10. Failure process of specimen taken by high-speed camera.
Mathematics 10 02603 g010
Figure 11. Failure mode of marble after high temperatures.
Mathematics 10 02603 g011
Figure 12. Change of energy with temperature under different impact velocity.
Mathematics 10 02603 g012
Table 1. Fitting parameters for the peak stress and the impact velocity.
Temperature T/°CabR2
2513.48−22.420.98
20012.41−31.010.94
4008.2424.520.98
6006.0933.490.87
8007.73−36.620.96
Table 2. Fitting relationship between temperatures and energies at different impact velocities.
Impact Velocity v (m/s)Fitting RelationshipR2
15.32WI = 244.30 + 0.09T − 1.51 × 10⁻⁴T20.98
WR = 87.51 − 0.08T + 1.44 × 10⁻⁴T20.90
WT = 115.35 + 0.10T − 1.96 × 10⁻⁴T20.91
WA = 41.43 + 0.07T − 1.18 × 10⁻⁴T20.92
18.17WI = 356.28 + 0.08T − 1.44 × 10⁻⁴T20.98
WR = 138.41 − 0.12T + 2.03 × 10⁻⁴T20.91
WT = 161.91 + 0.05T − 1.15 × 10⁻⁴T20.98
WA = 55.95 + 0.15T − 2.32 × 10⁻⁴T20.88
21.83WI = 427.99 + 0.12T − 2.10 × 10⁻⁴T20.98
WR = 157.64 − 0.04T + 1.31 × 10⁻⁴T20.95
WT = 172.91 + 0.09T − 1.62 × 10⁻⁴T20.98
WA = 97.44 + 0.06T − 1.79 × 10⁻⁴T20.94
23.59WI = 577.06 + 0.13T − 2.67 × 10⁻⁴T20.95
WR = 223.99 − 0.07T + 1.54 × 10⁻⁴T20.87
WT = 239.89 + 0.17T − 3.22 × 10⁻⁴T20.99
WA = 113.18 + 0.02T − 9.95 × 10⁻⁴T20.86
Publisher’s Note: MDPI stays neutral with regard to jurisdictional claims in published maps and institutional affiliations.

