
Development of Predictive Models for Determination of the Extent of Damage in Granite Caused by Thermal Treatment and Cooling Conditions Using Artificial Intelligence

 ,
,  , , and
Abstract
:1. Introduction
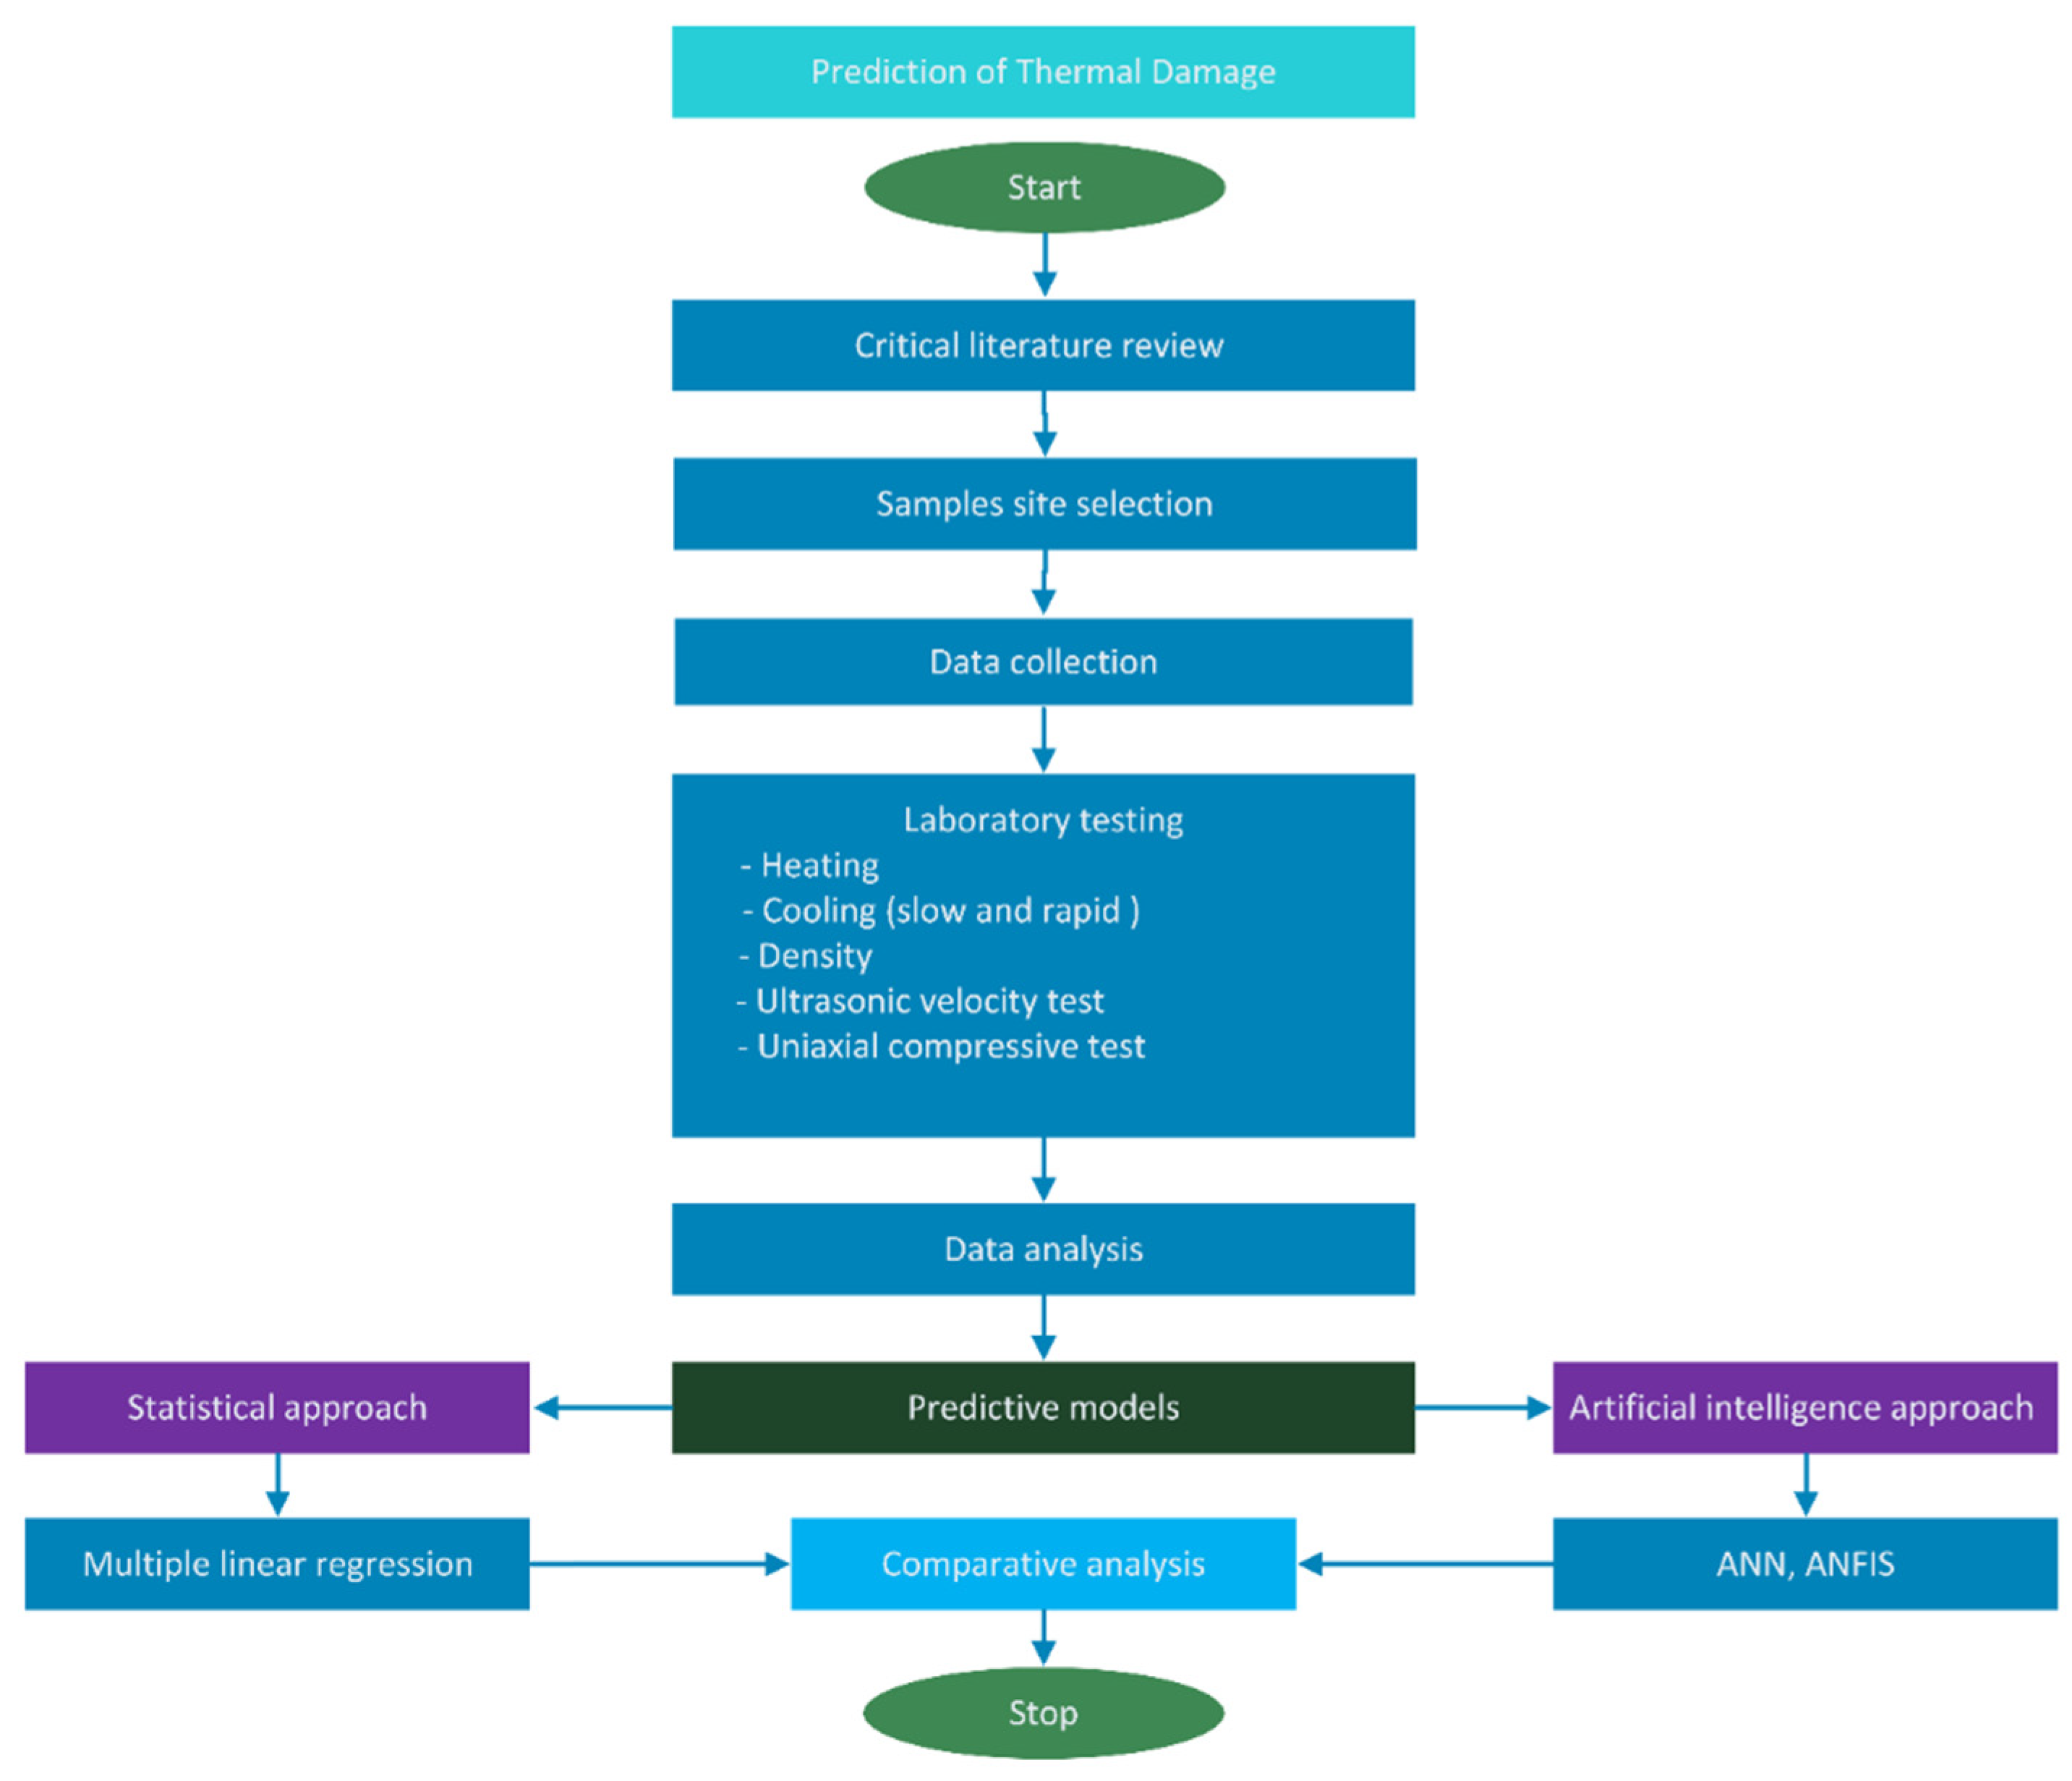
2. Design of the Experimentation Process
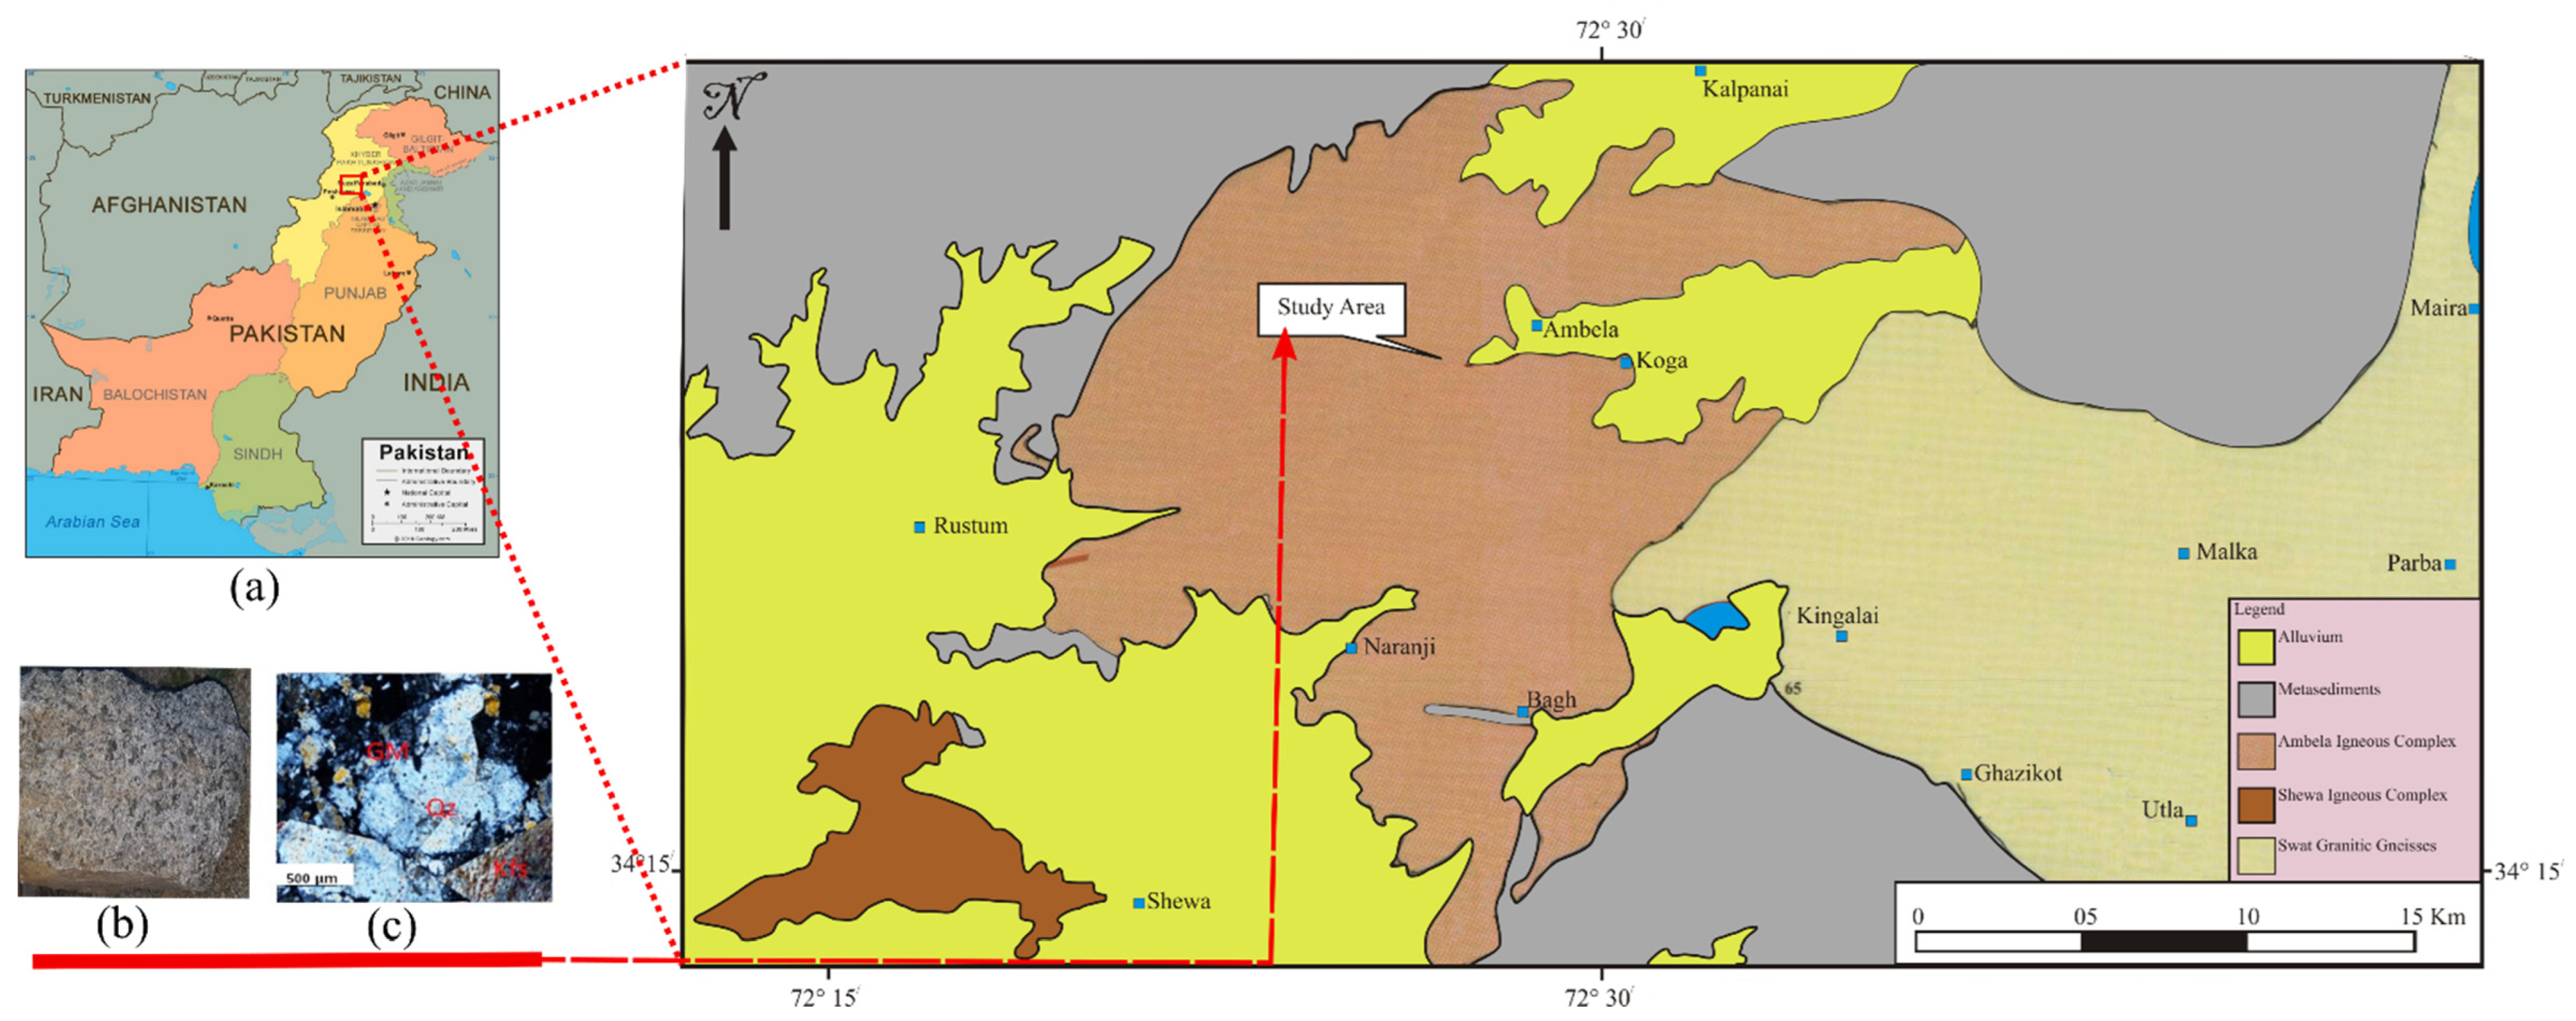
2.1. Sample Preparation
2.2. Experimental Procedure and Instrument
2.3. Thermal Damage Factor
3. Prediction Model
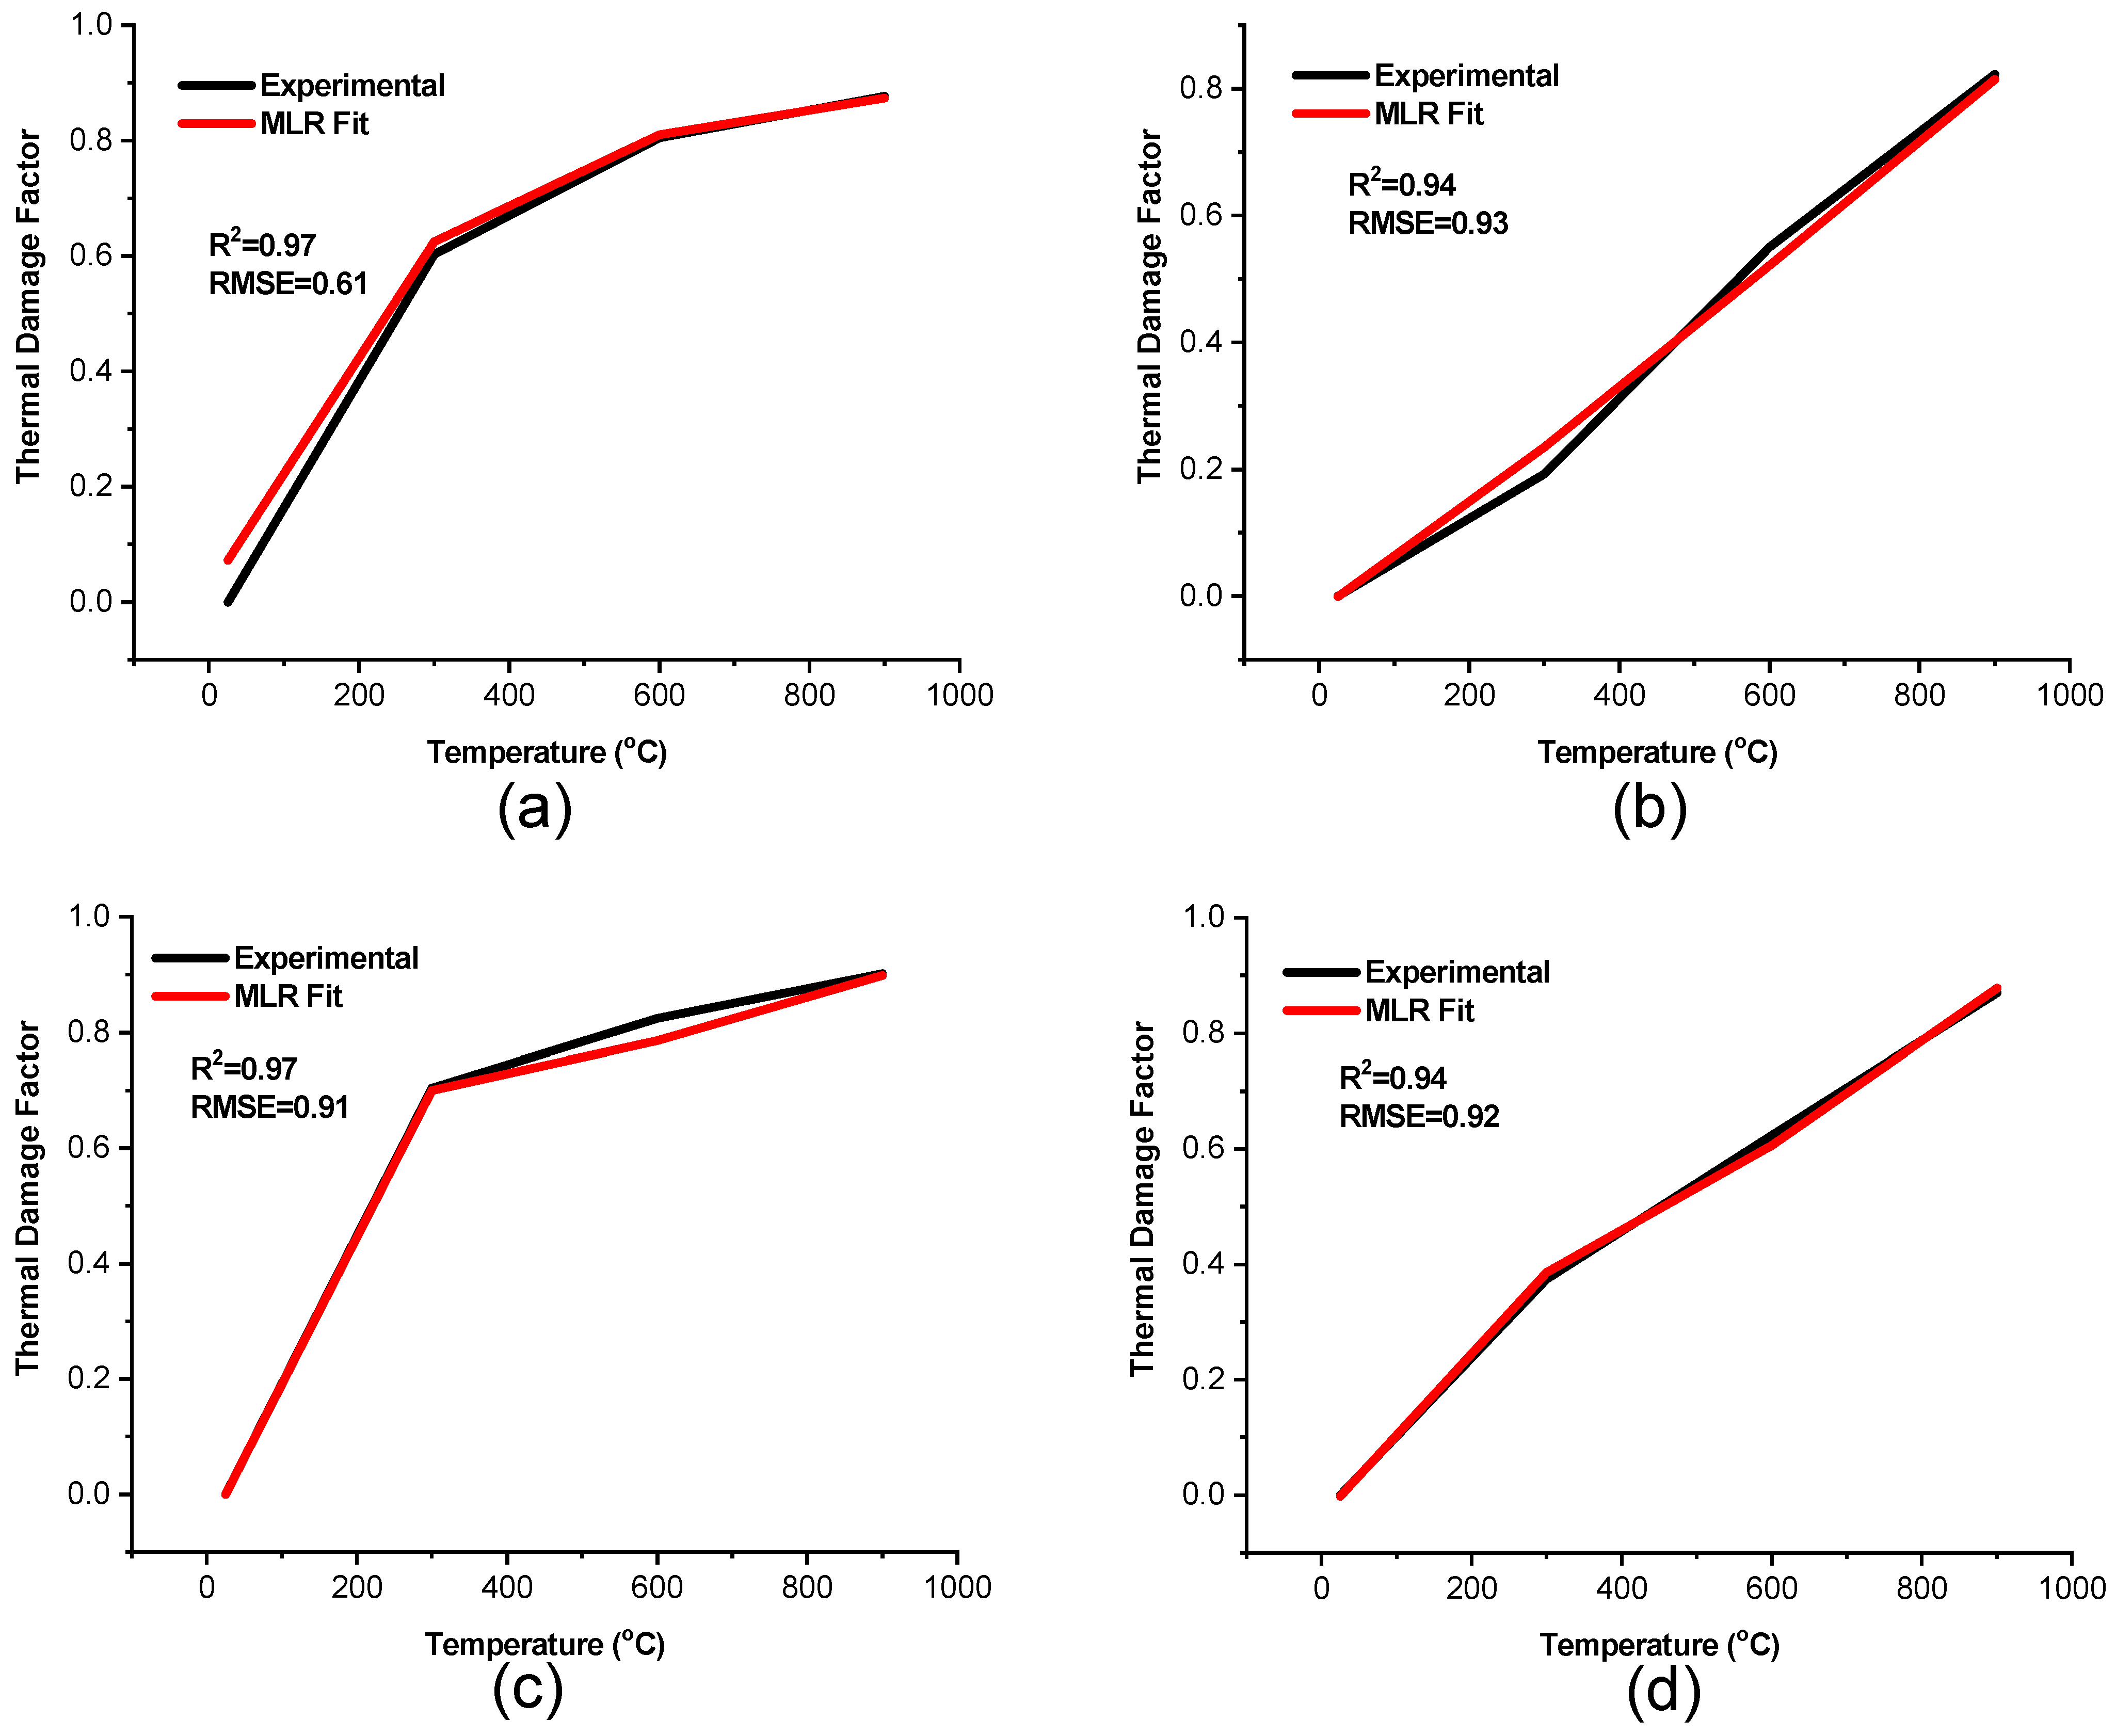
3.1. MLR Model
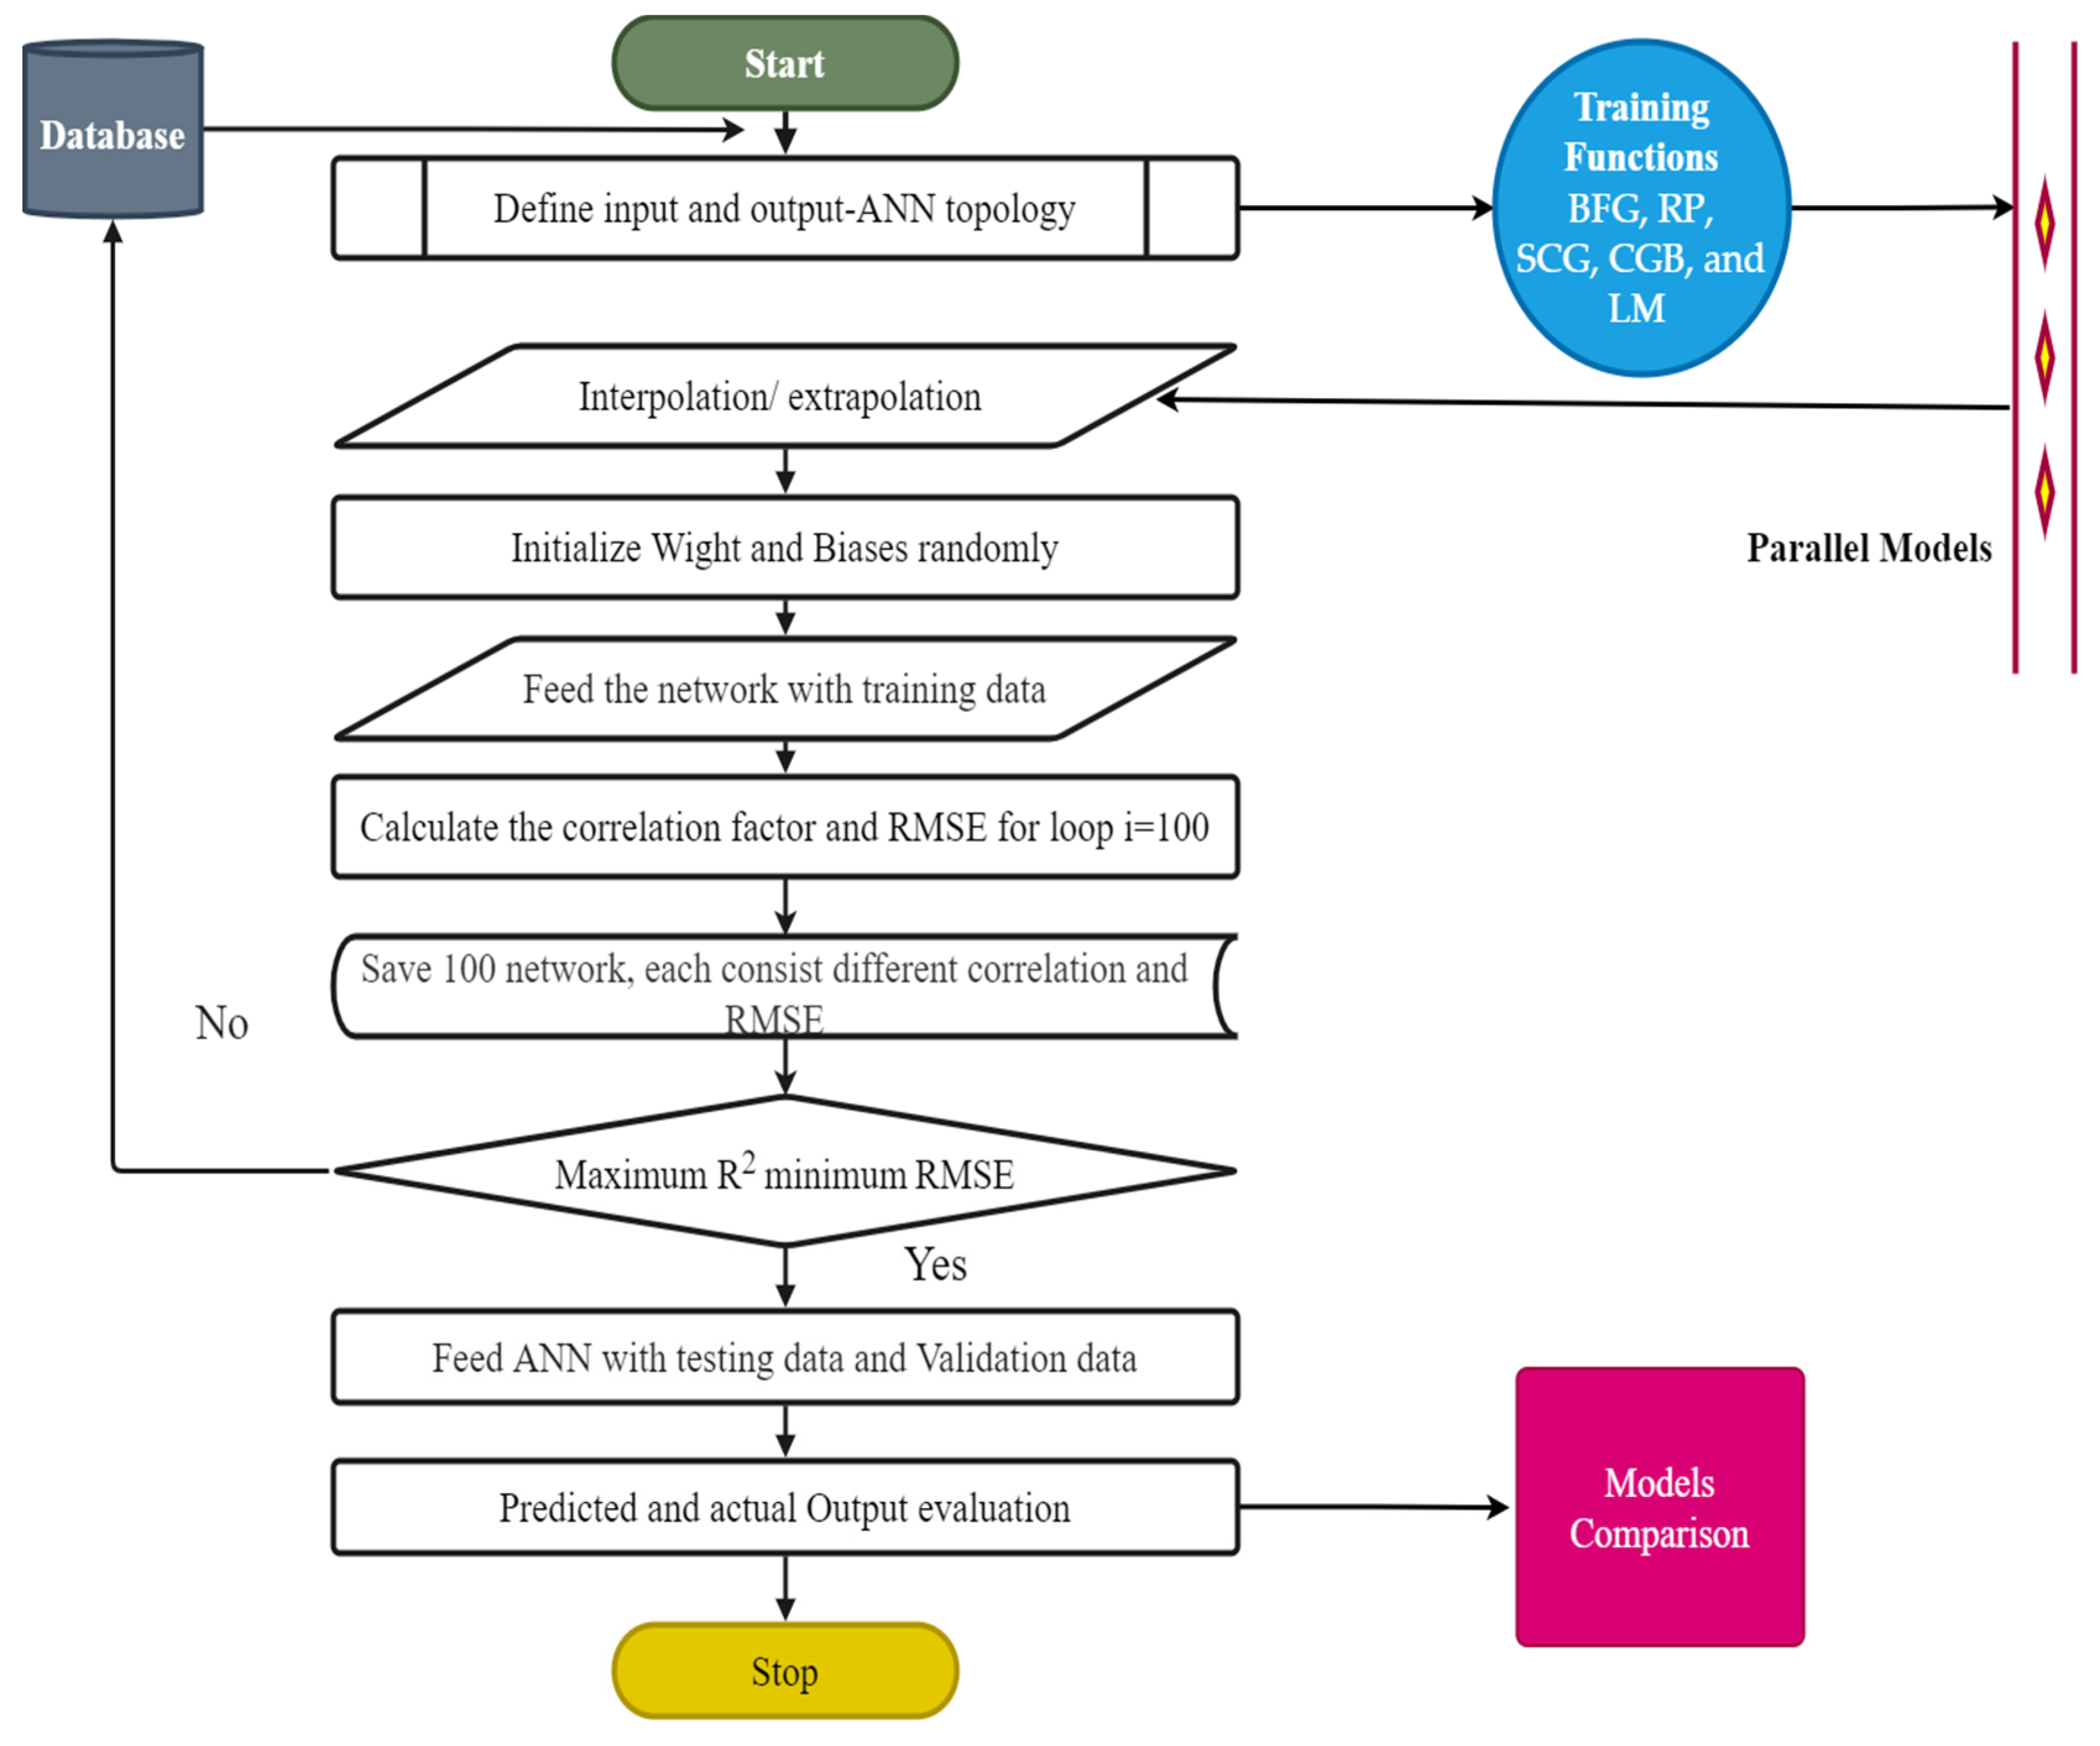
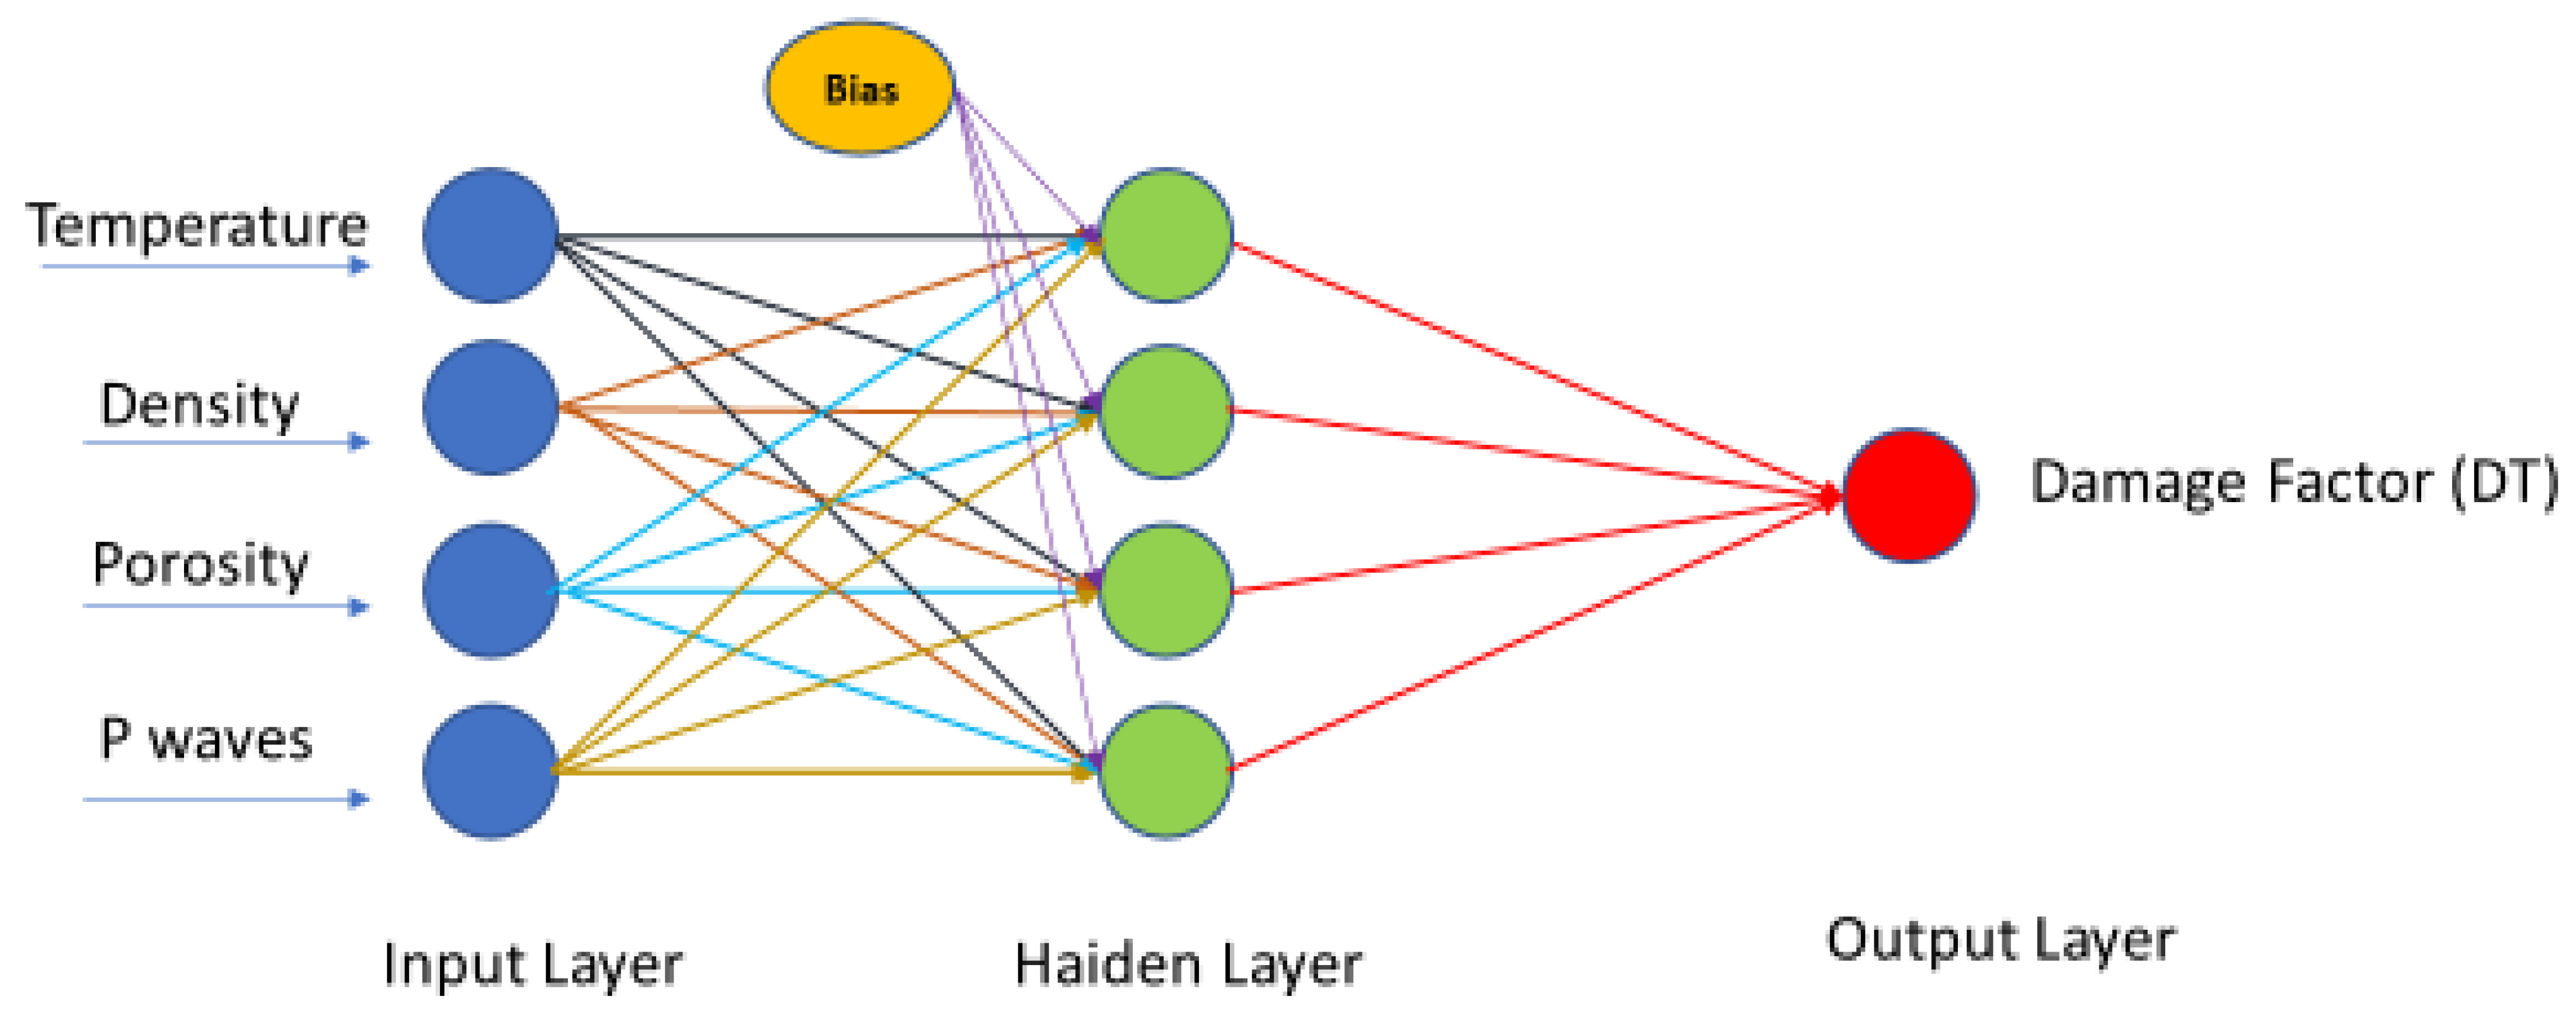
3.2. ANN Model
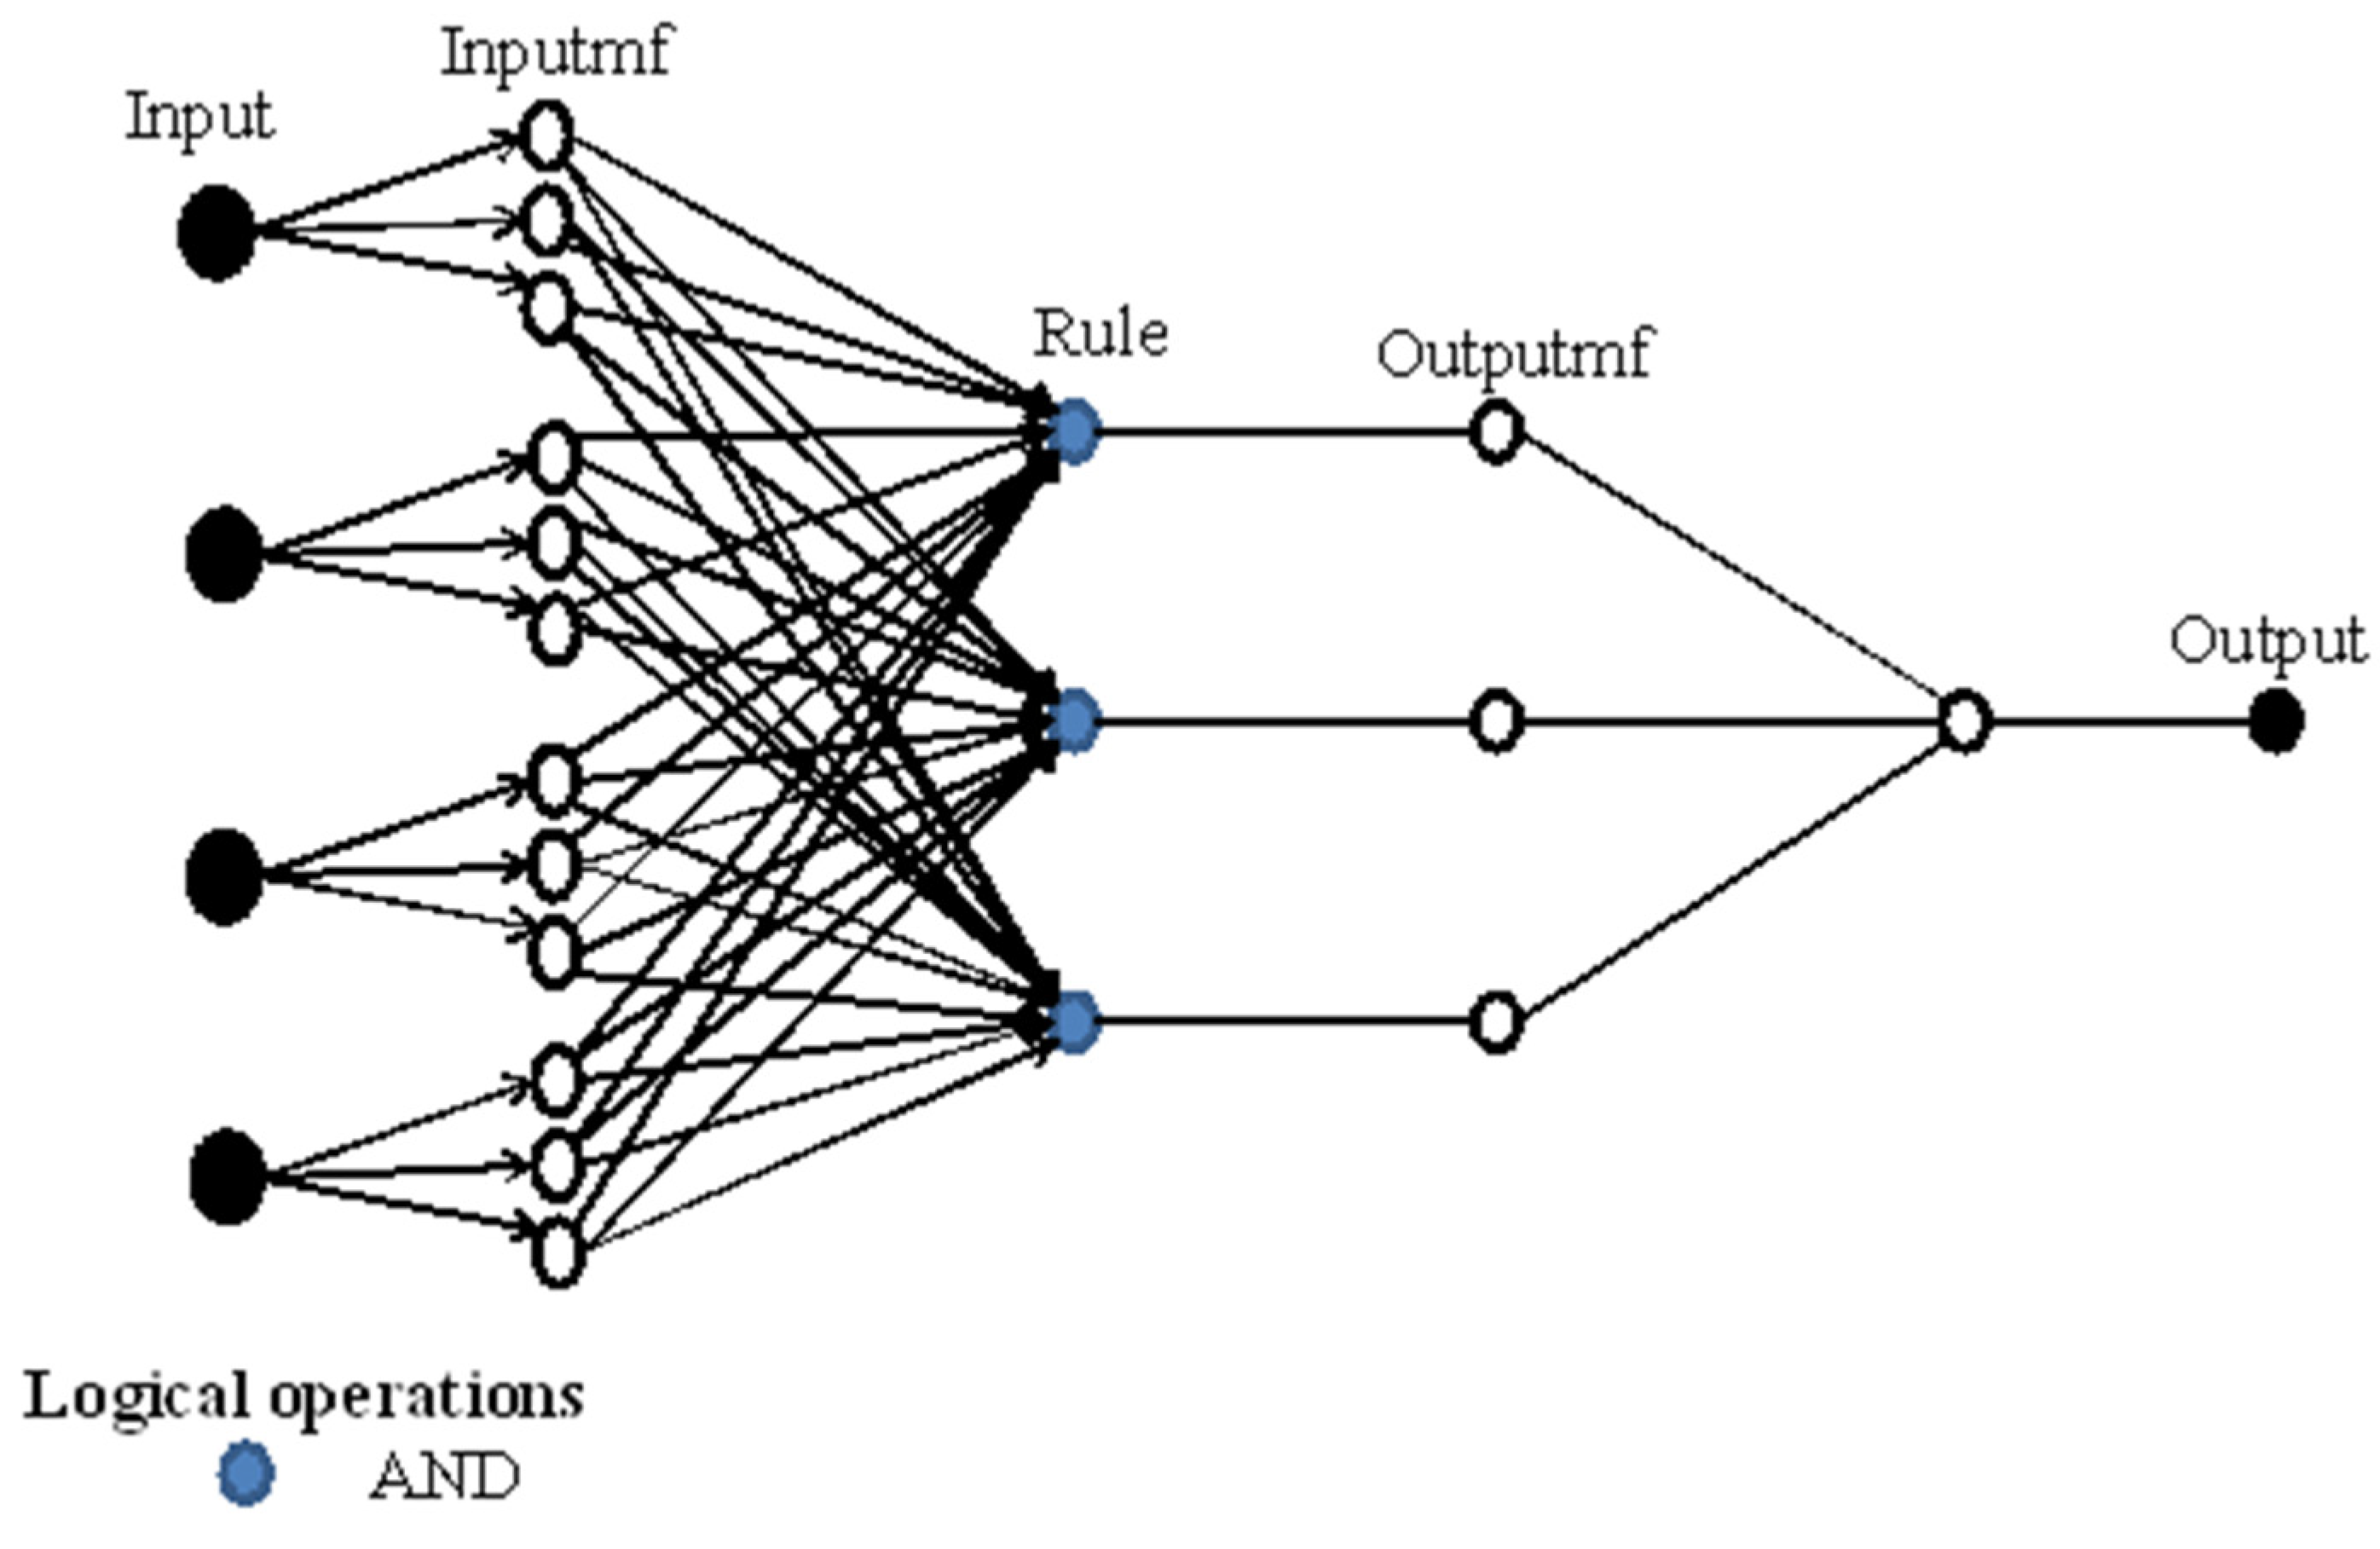
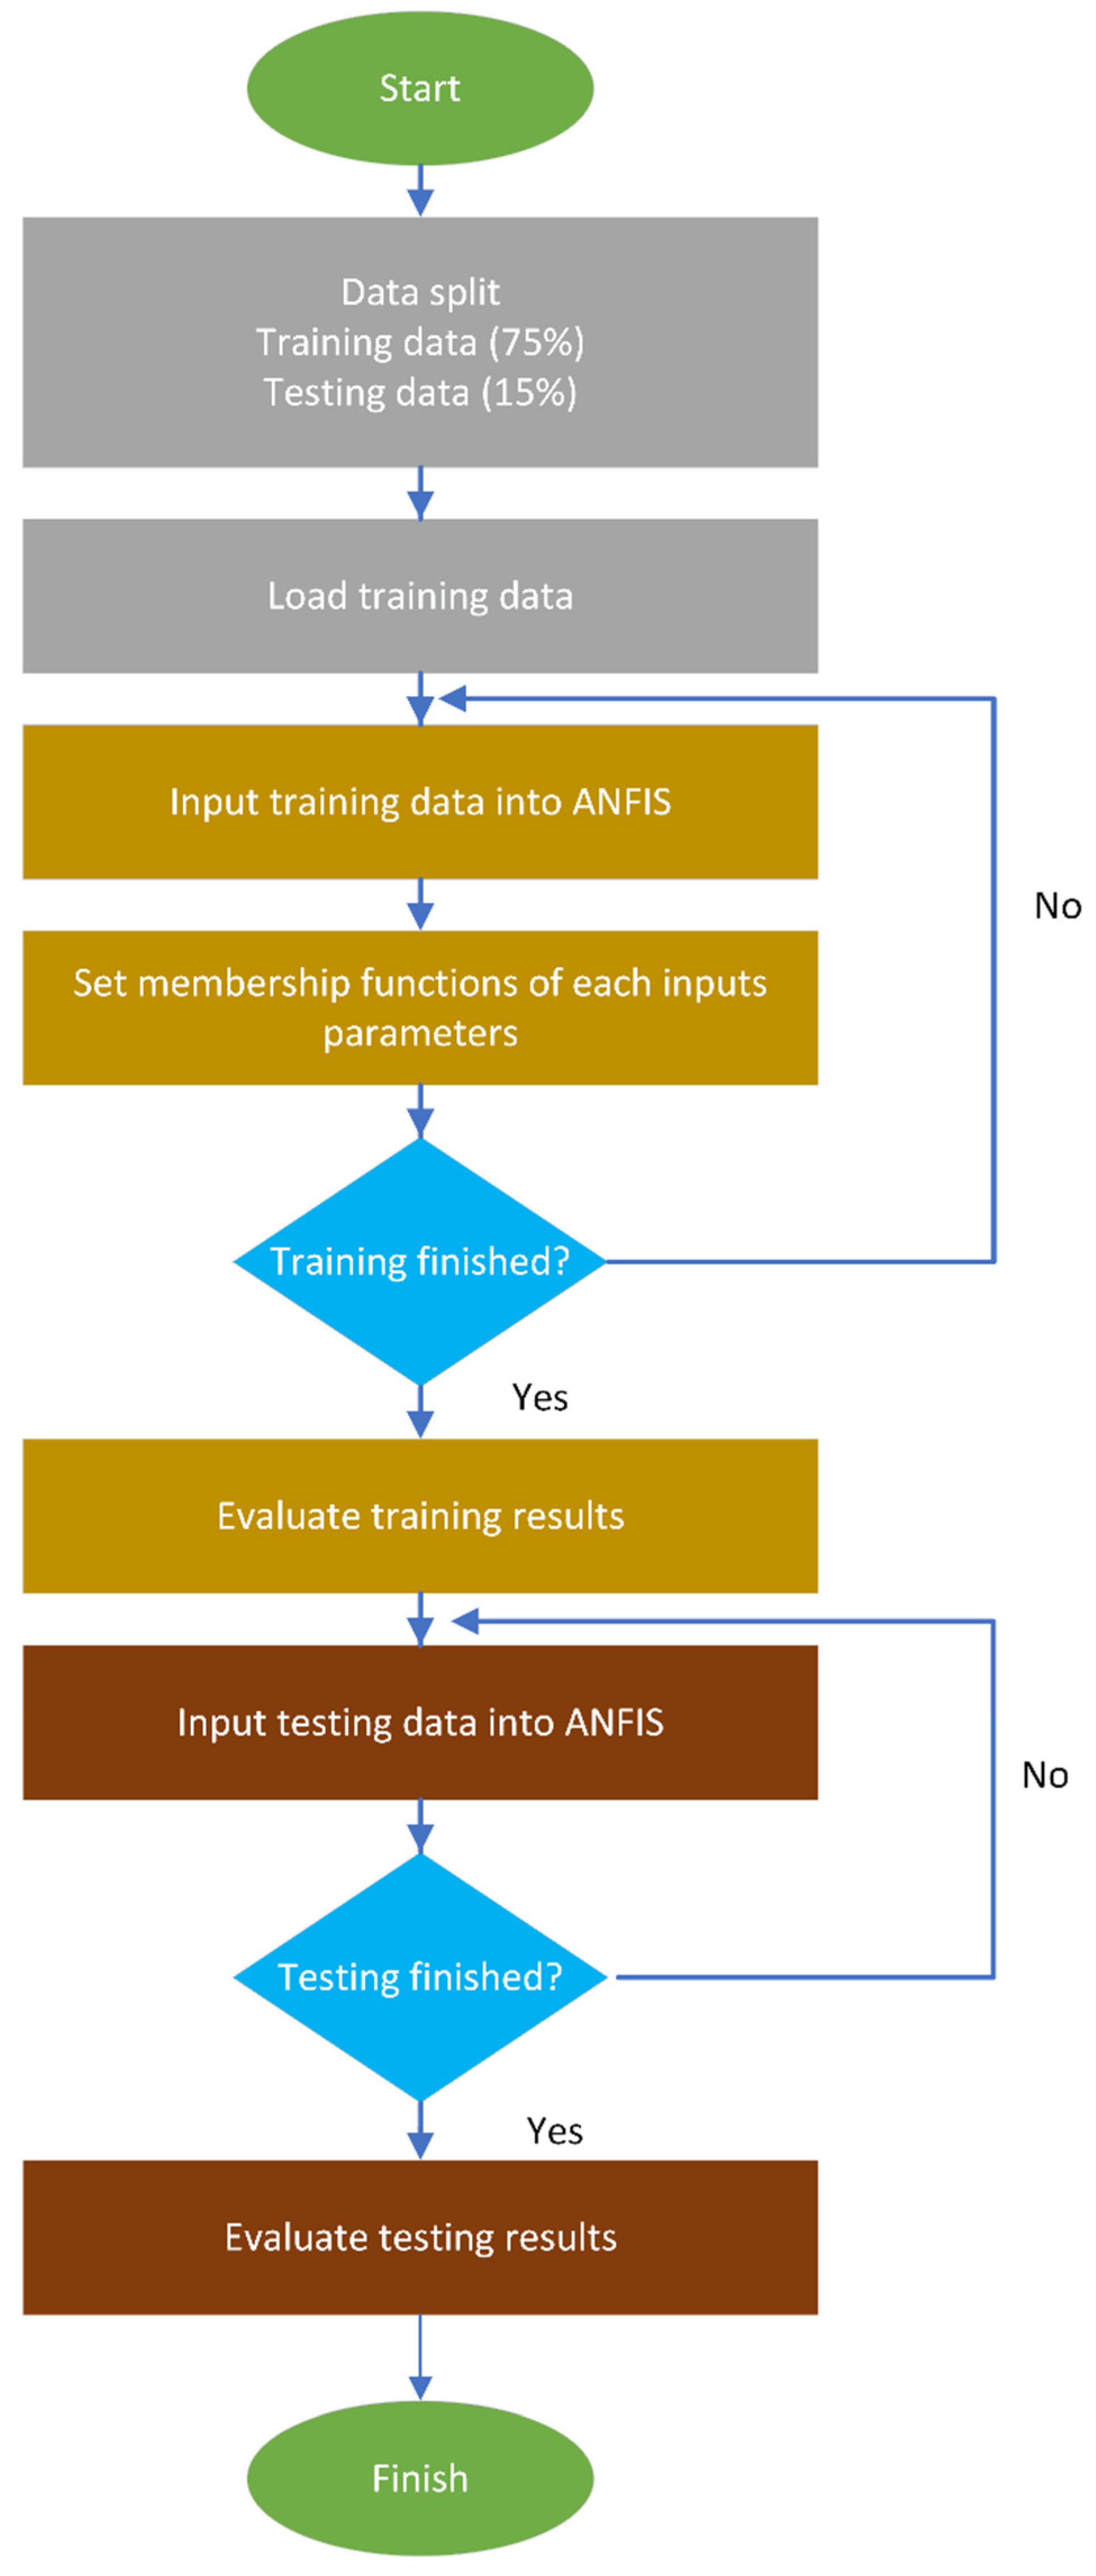
3.3. Adaptive Neural Fuzzy Interface System (ANFIS) Models
4. Results and Discussion
4.1. MLR Models
4.2. ANN Models
4.2.1. Model Design
4.2.2. ANN Code Compilation in MATLAB
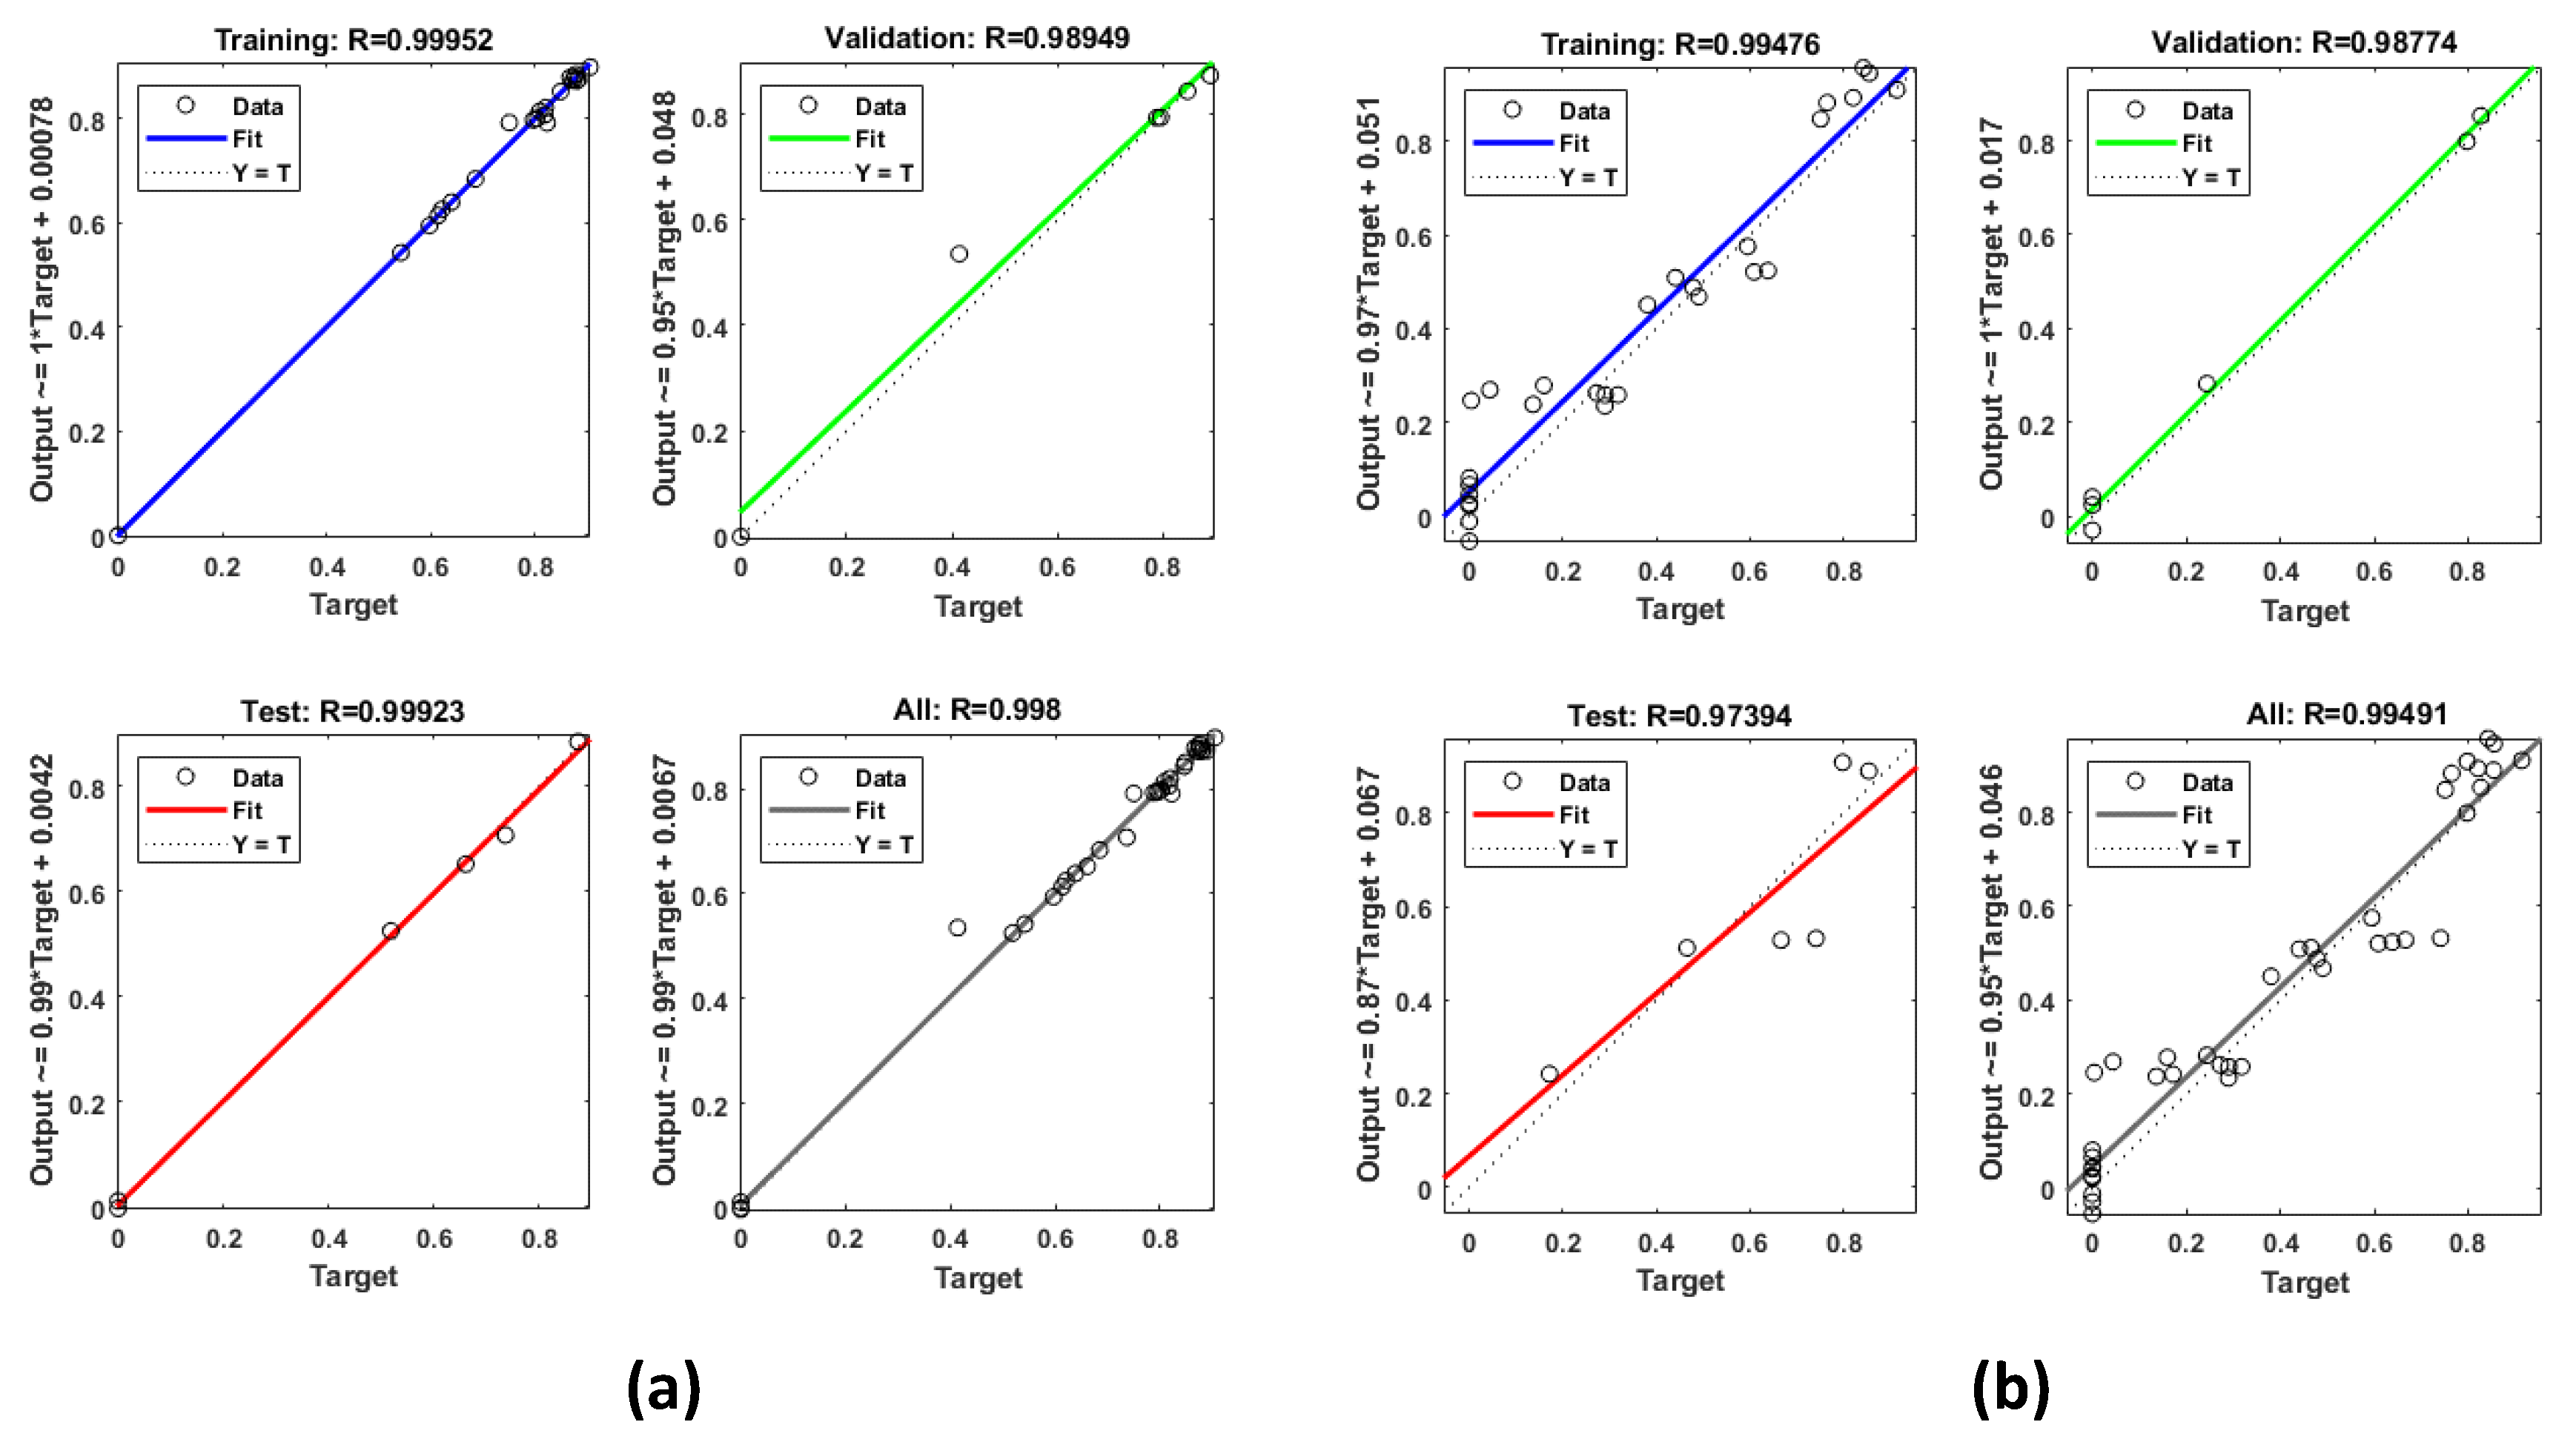
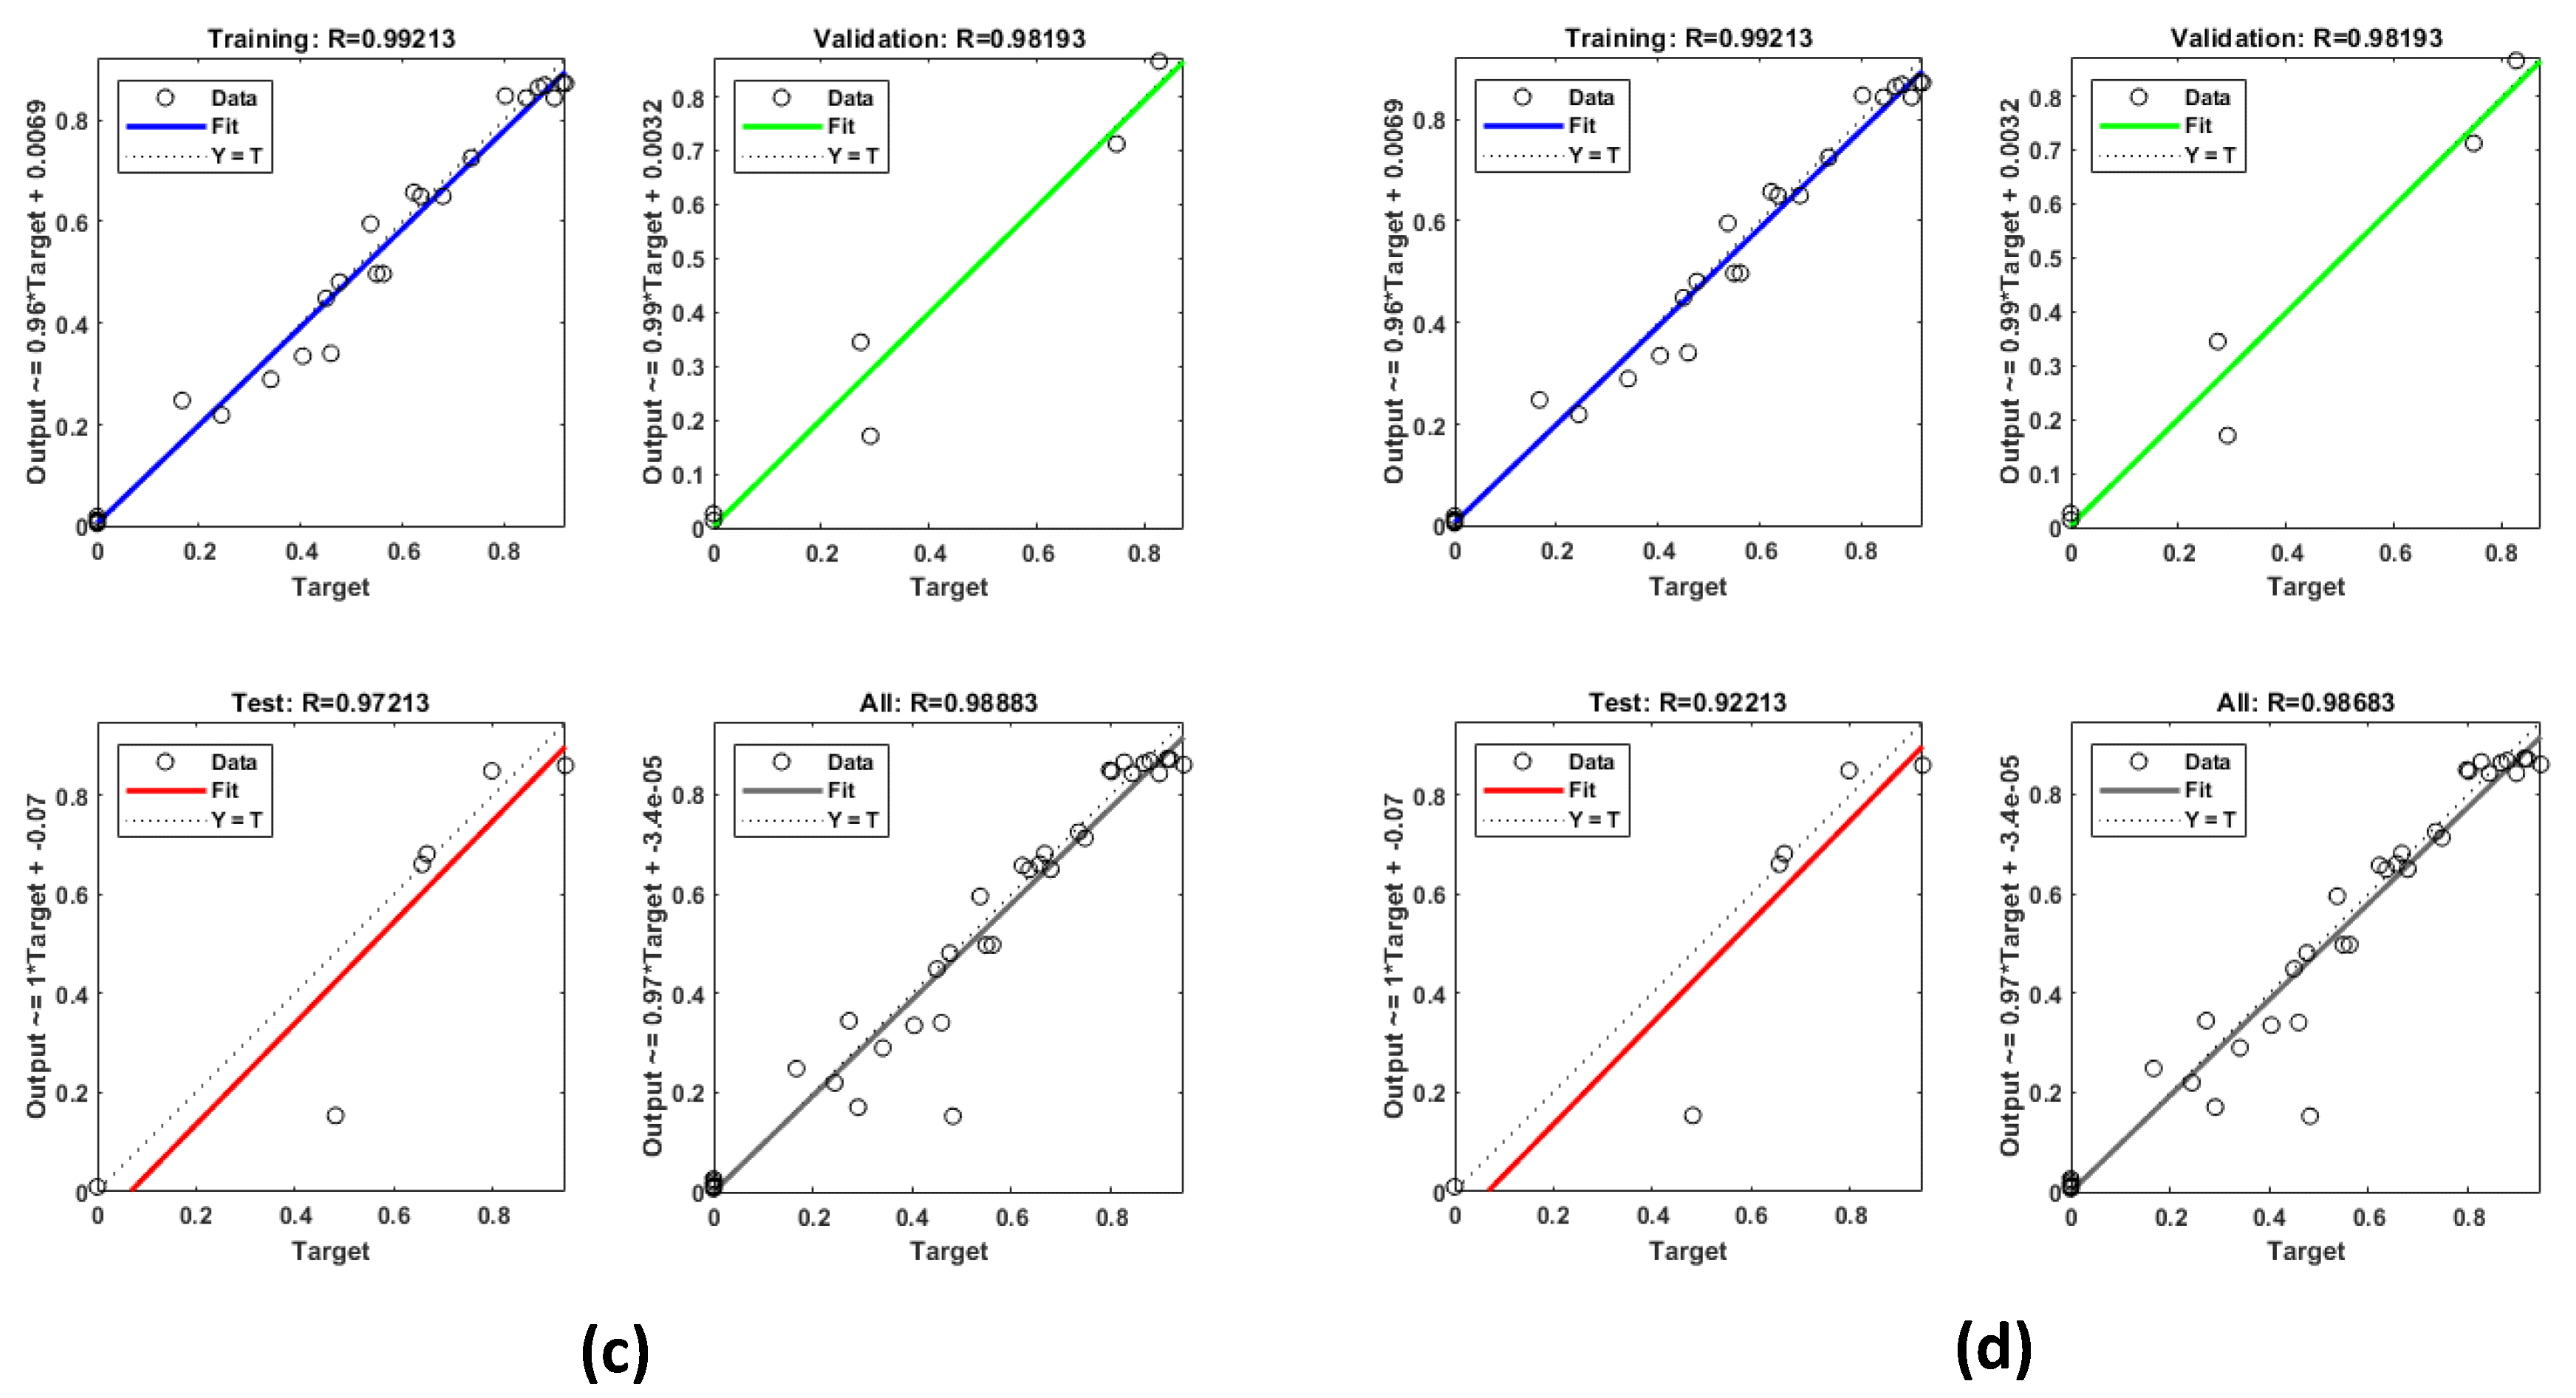
4.2.3. Network Phases and Regression Models
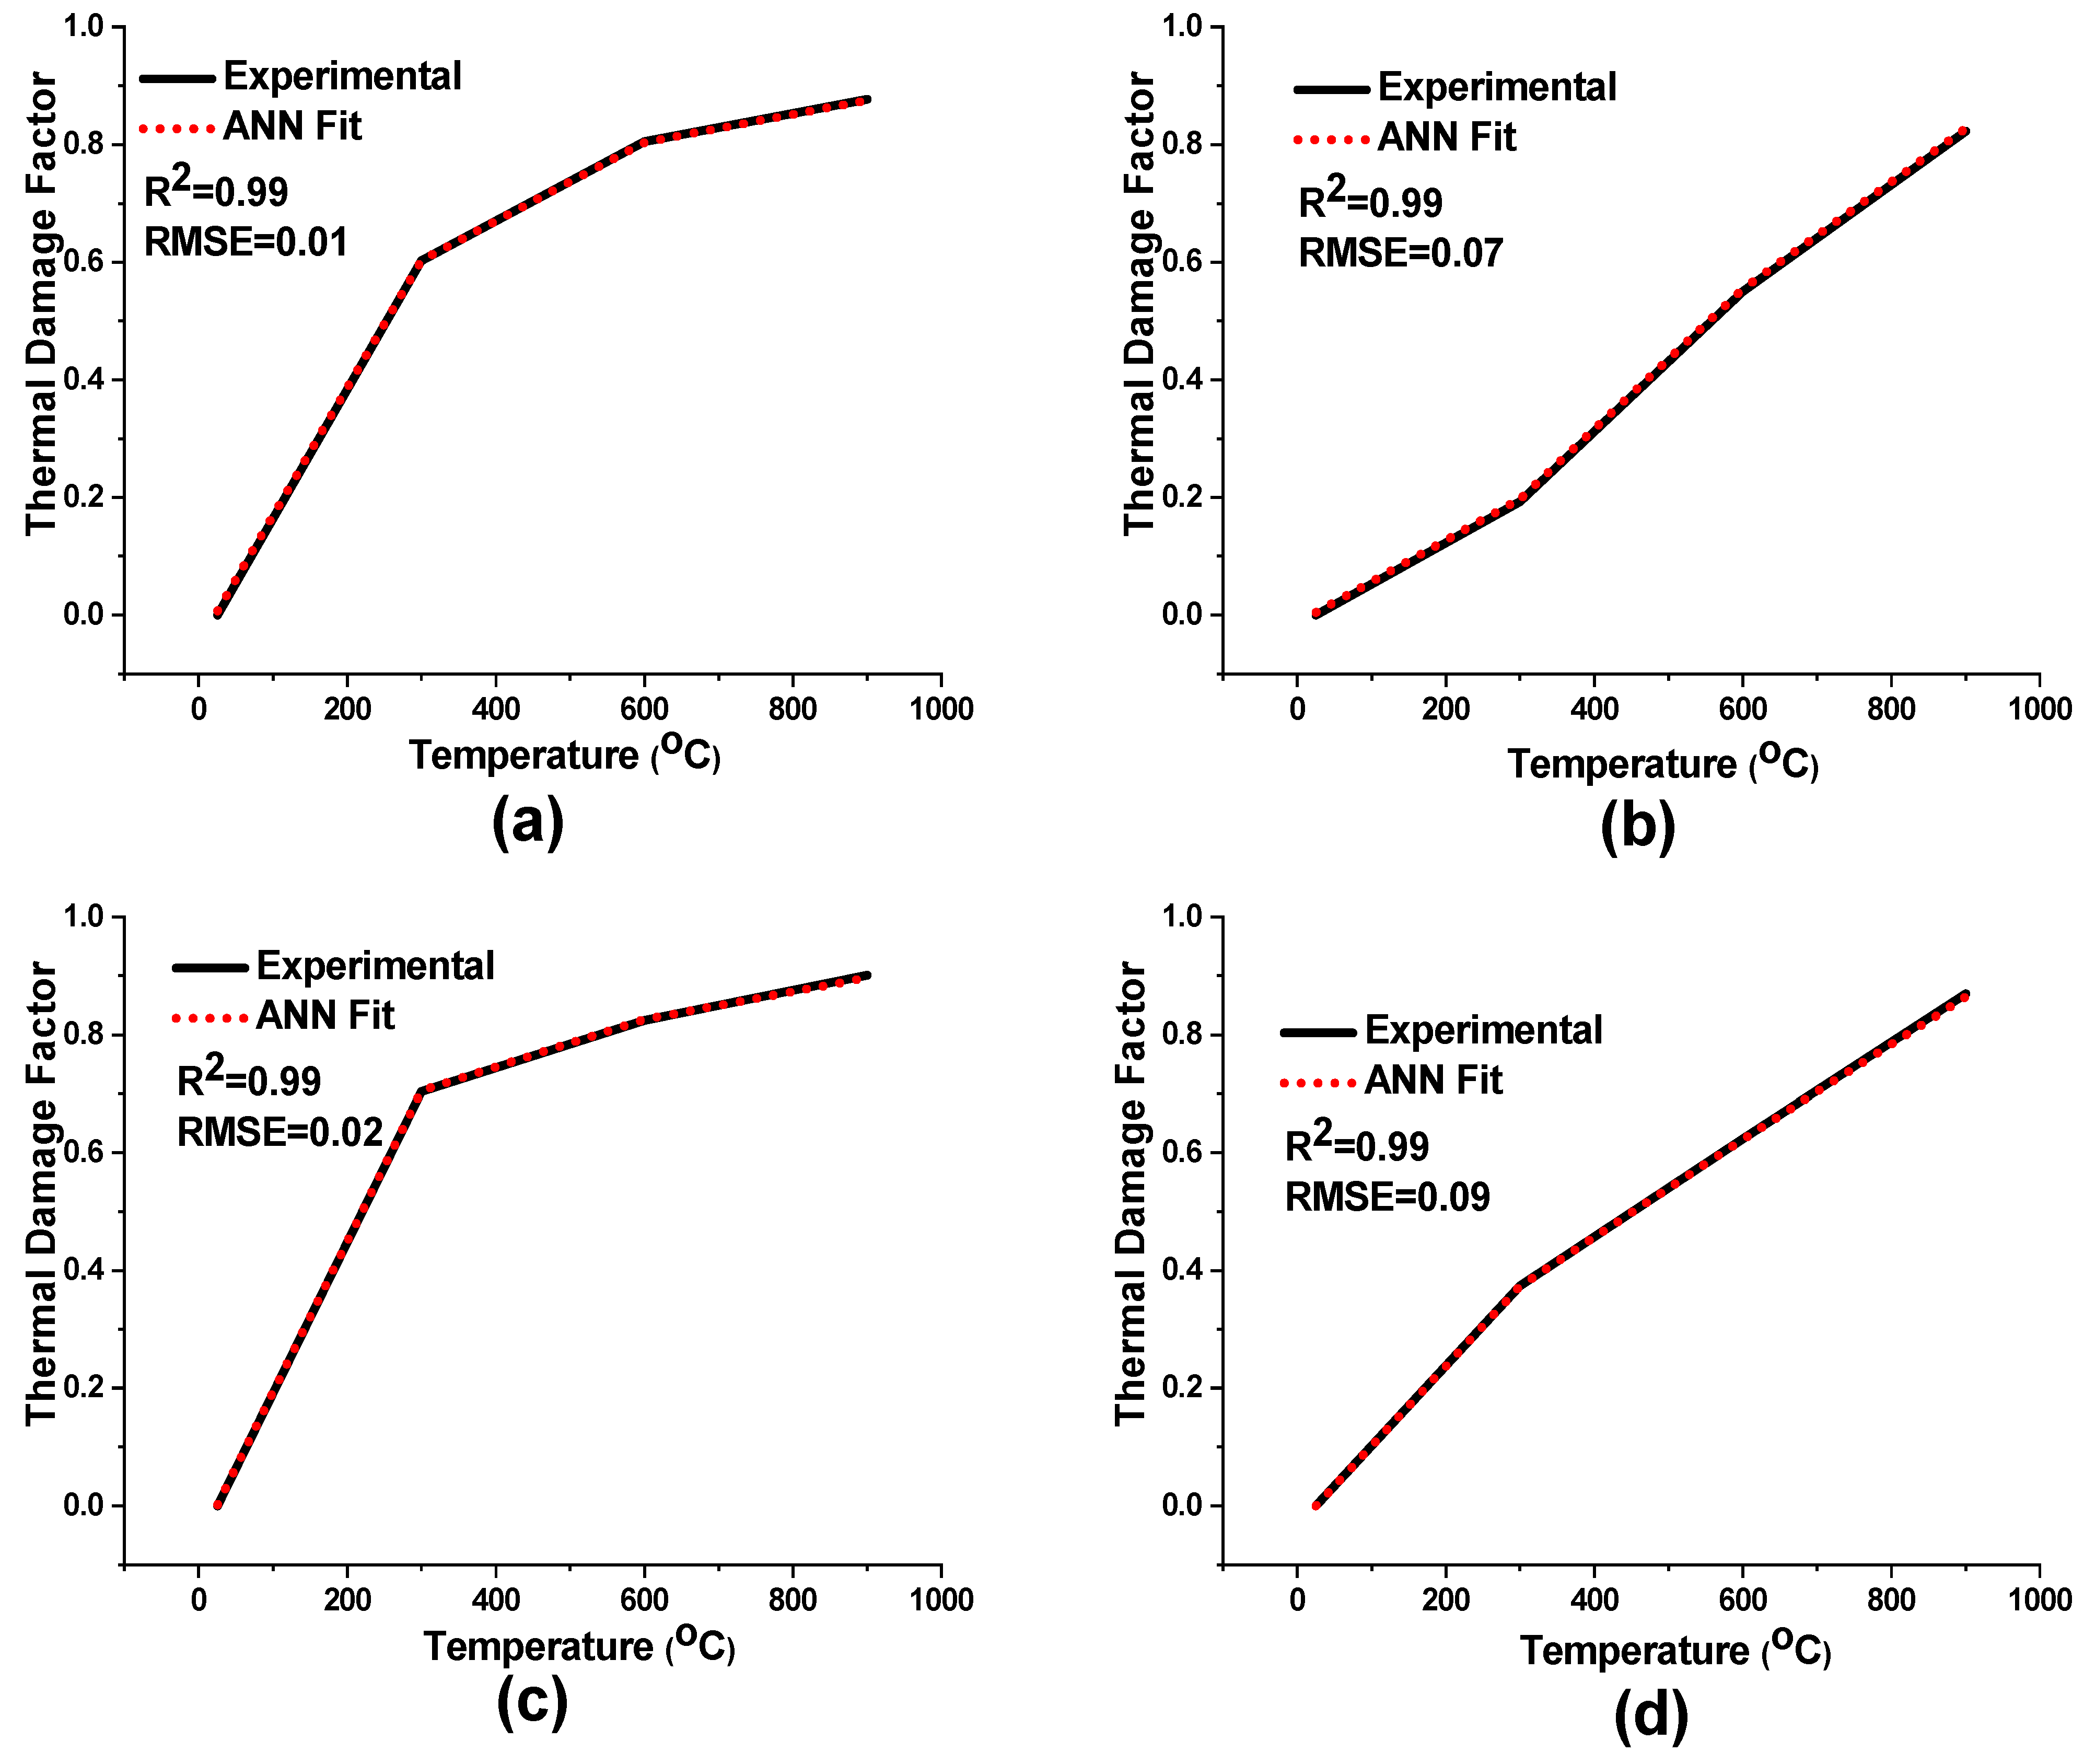
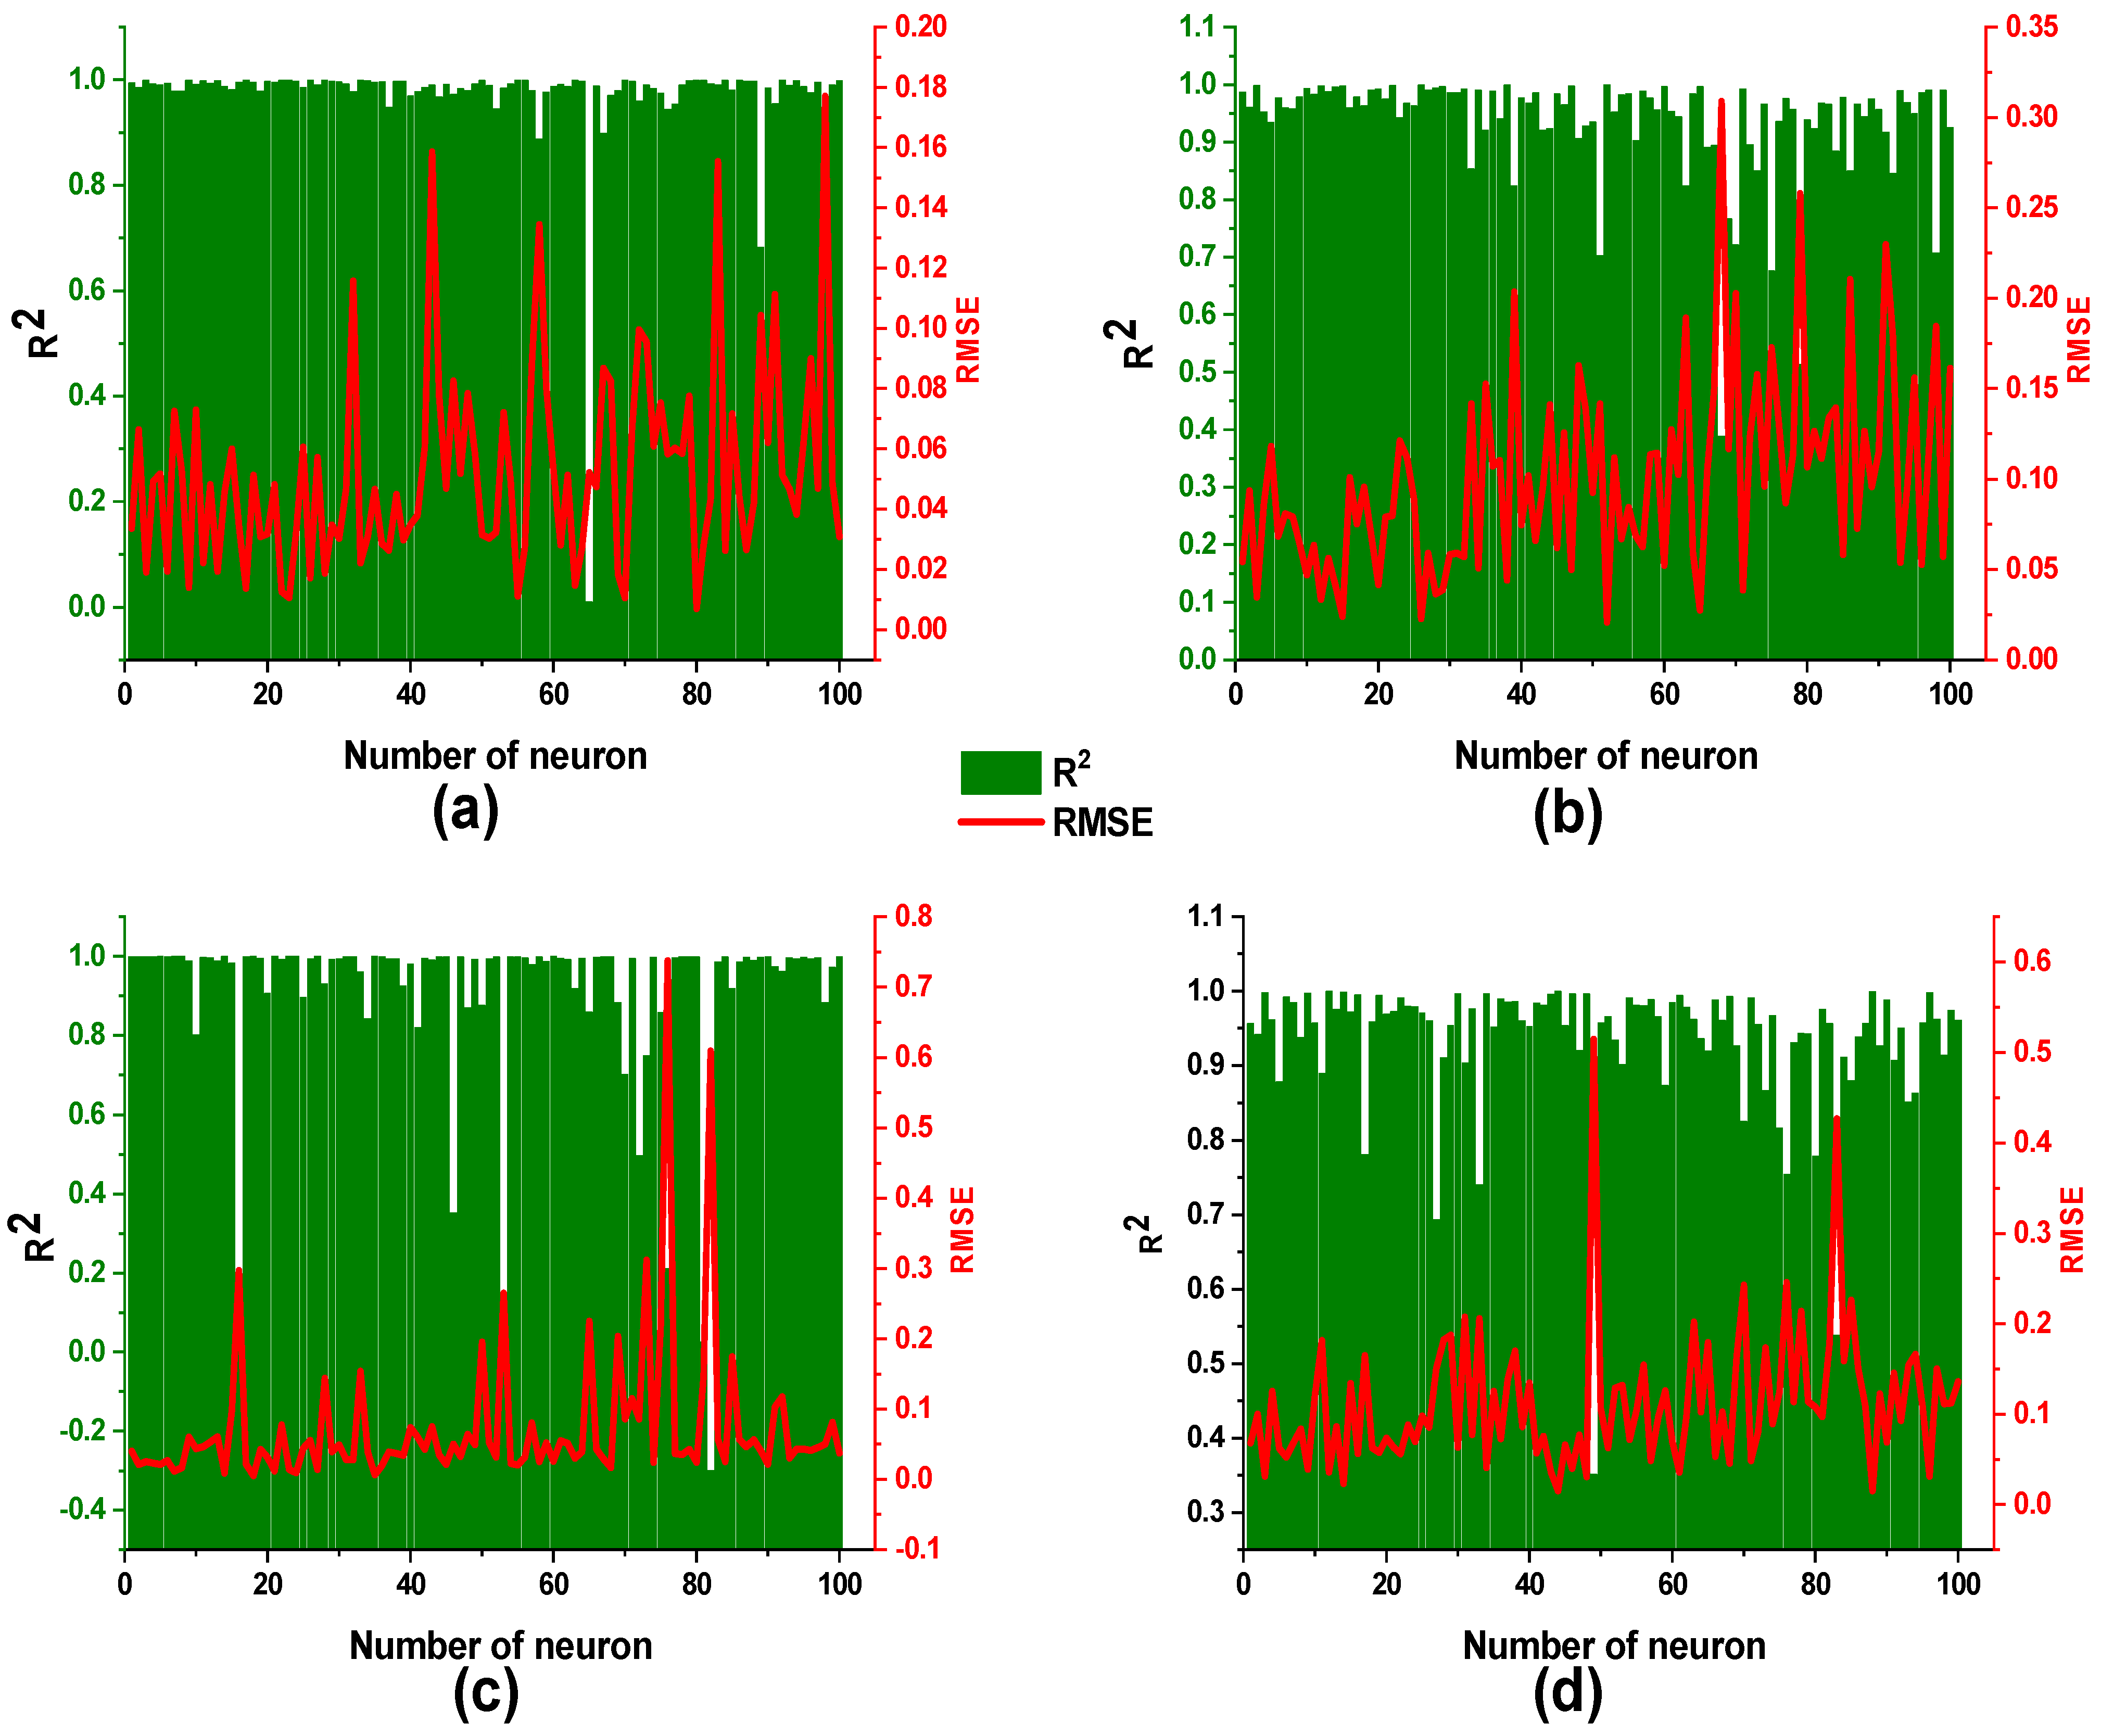
4.2.4. Model Performance
4.2.5. ANN Predicted Models
4.3. ANFIS Models
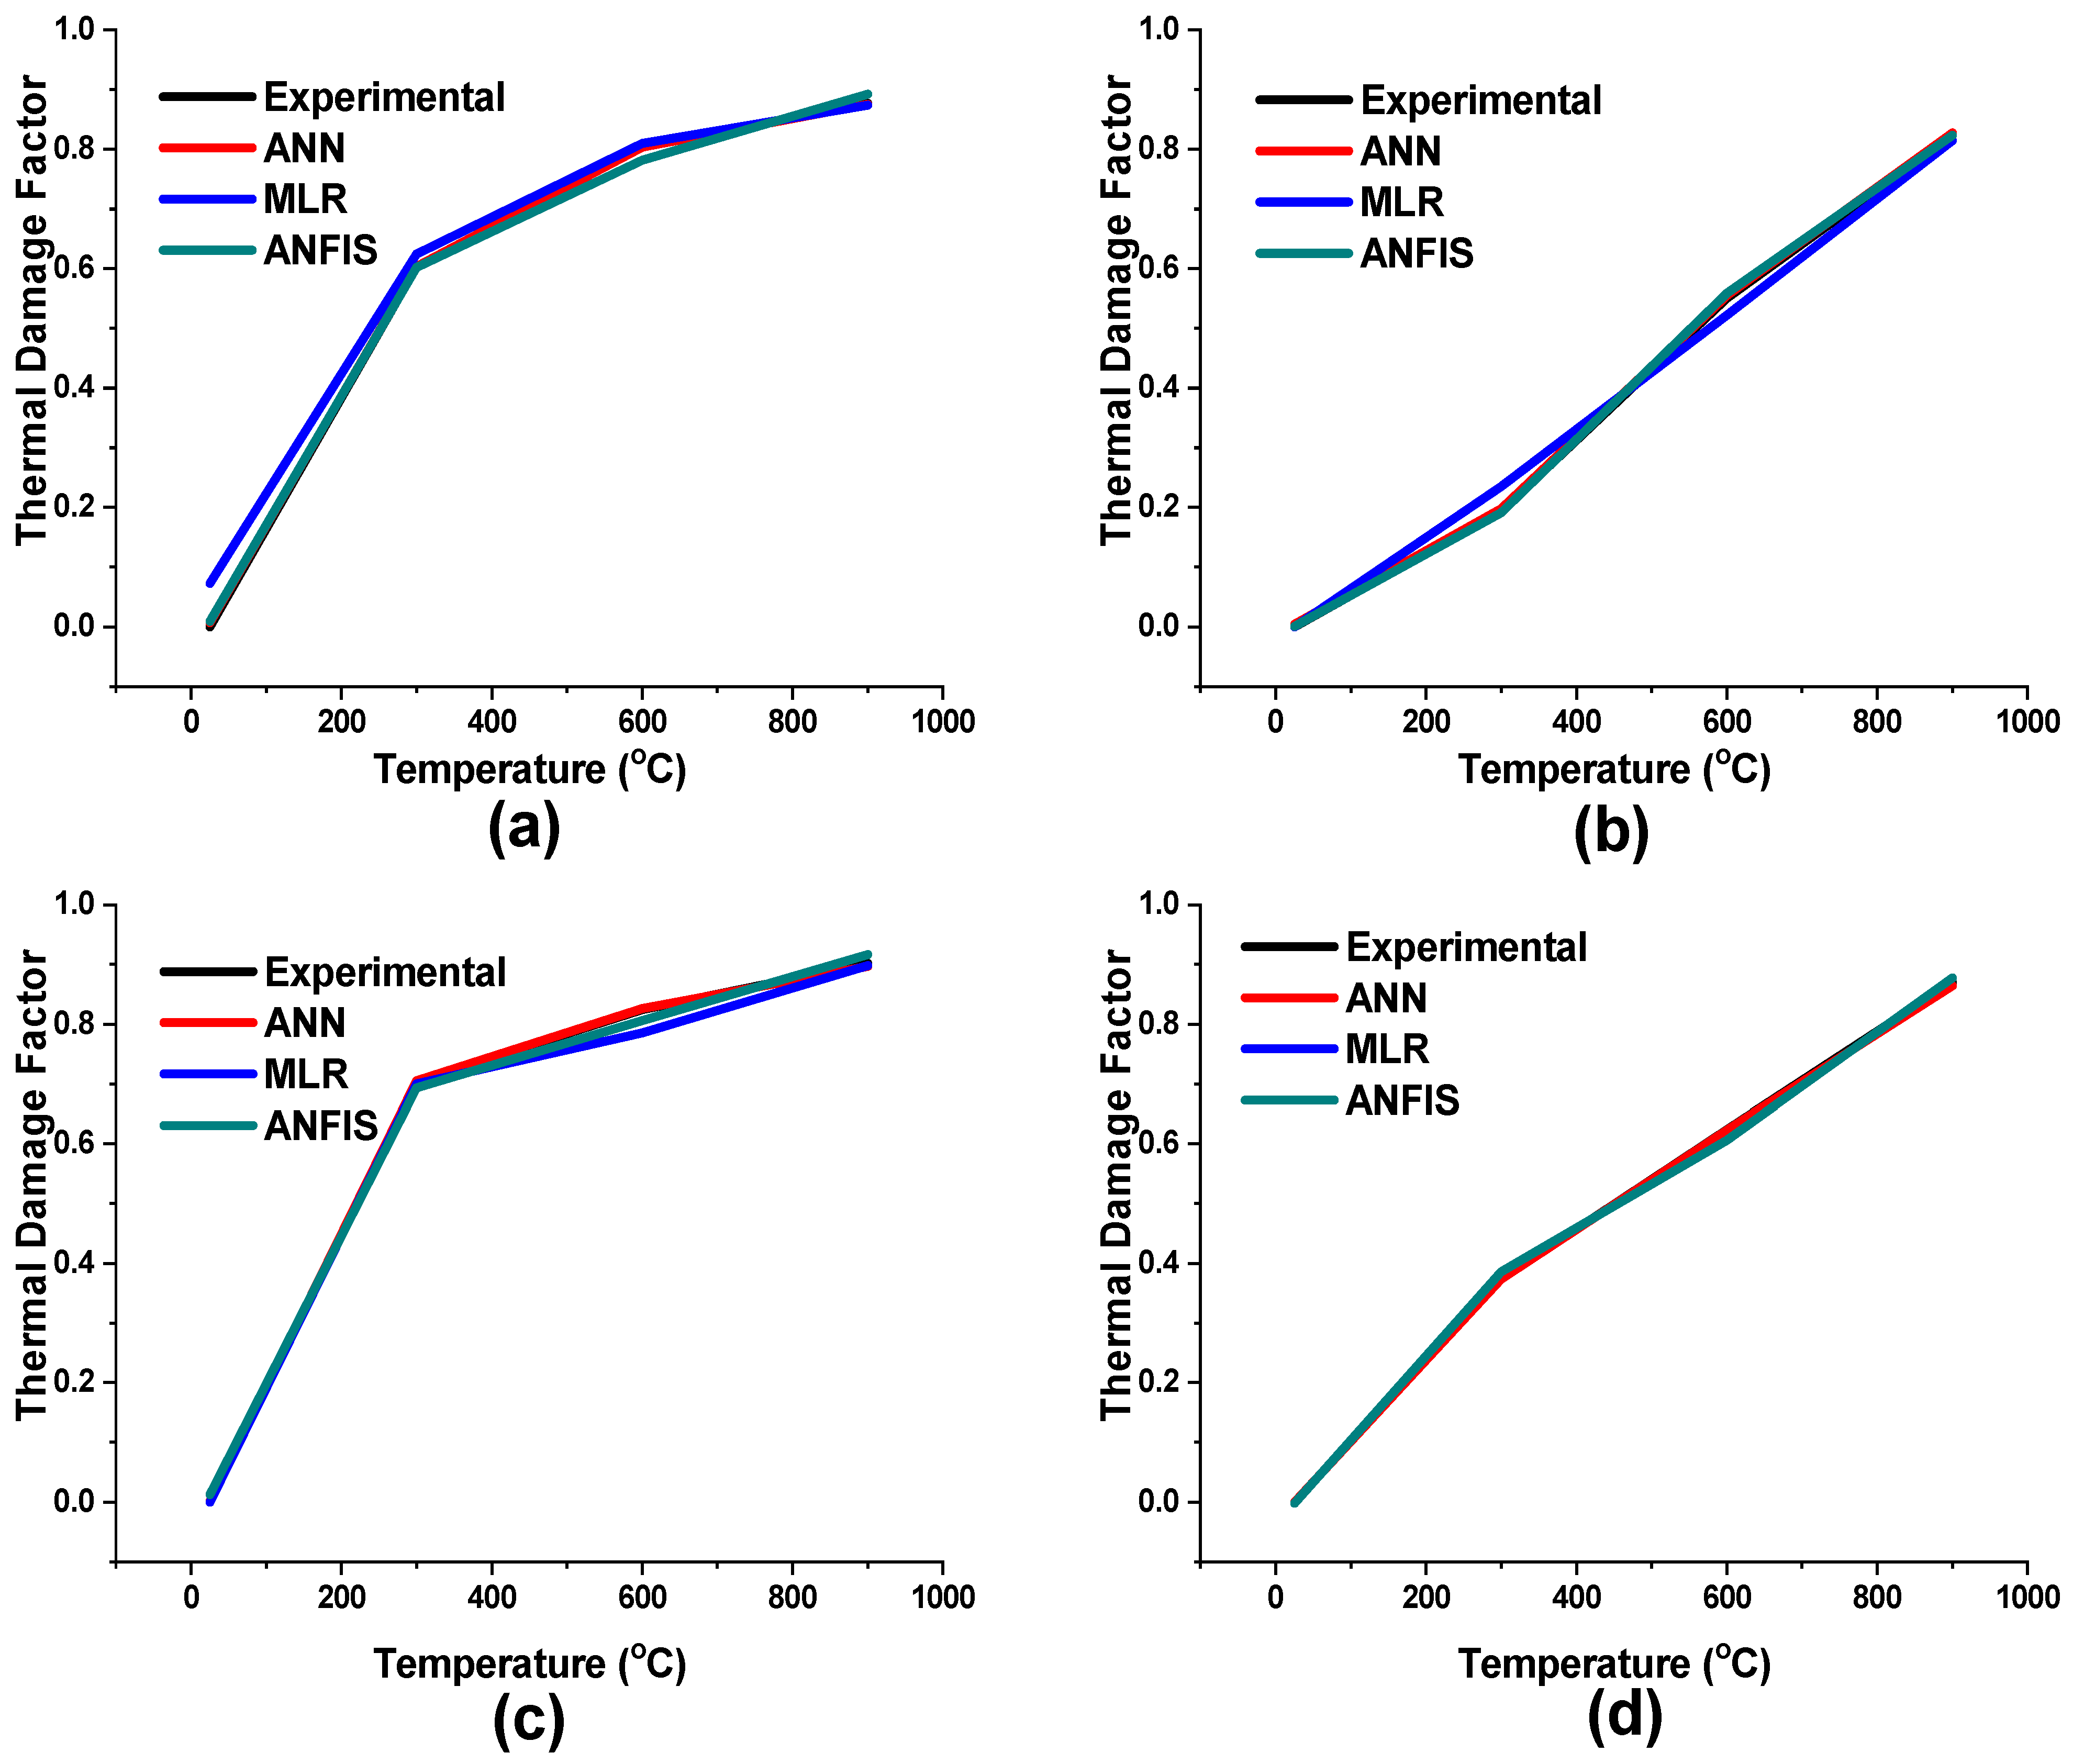
5. A Comparative Appraisal of Statistics and Intelligent Technique
6. Limitations and Future Works
7. Conclusions
Author Contributions
Funding
Institutional Review Board Statement
Informed Consent Statement
Data Availability Statement
Acknowledgments
Conflicts of Interest
References
- Wei, S.; Yang, Y.; Su, C.; Cardosh, S.R.; Wang, H. Experimental Study of the Effect of High Temperature on the Mechanical Properties of Coarse Sandstone. Appl. Sci. 2019, 9, 2424. [Google Scholar] [CrossRef]
- Lian, X.; Hu, H.; Li, T.; Hu, D. Main geological and mining factors affecting ground cracks induced by underground coal mining in Shanxi Province, China. Int. J. Coal Sci. Technol. 2020, 7, 362–370. [Google Scholar] [CrossRef]
- Chang, J.; He, K.; Pang, D.; Li, D.; Li, C.; Sun, B. Influence of anchorage length and pretension on the working resistance of rock bolt based on its tensile characteristics. Int. J. Coal Sci. Technol. 2021, 8, 1384–1399. [Google Scholar] [CrossRef]
- Ju, Y.; Zhu, Y.; Xie, H.; Nie, X.; Zhang, Y.; Lu, C.; Gao, F. Technology. Fluidized mining and in-situ transformation of deep underground coal resources: A novel approach to ensuring safe, environmentally friendly, low-carbon, and clean utilisation. Int. J. Coal Sci. Technol. 2019, 6, 184–196. [Google Scholar] [CrossRef]
- Burton, E.; Friedmann, S.; Upadhye, R. Best Practices in Underground Coal Gasification; Report: W-7405-Eng-48; Lawrence Livermore National Laboratory: Livermore, CA, USA, 2007.
- Sirdesai, N.; Singh, R.; Singh, T.; Ranjith, P. Numerical and experimental study of strata behavior and land subsidence in an underground coal gasification project. Proc. Int. Assoc. Hydrol. Sci. 2015, 372, 455. [Google Scholar] [CrossRef]
- Batugin, A.; Wang, Z.; Su, Z.; Sidikovna, S.S. Combined support mechanism of rock bolts and anchor cables for adjacent roadways in the external staggered split-level panel layout. Int. J. Coal Sci. Technol. 2021, 8, 659–673. [Google Scholar] [CrossRef]
- Gao, R.; Kuang, T.; Zhang, Y.; Zhang, W.; Quan, C. Controlling mine pressure by subjecting high-level hard rock strata to ground fracturing. Int. J. Coal Sci. Technol. 2021, 8, 1336–1350. [Google Scholar] [CrossRef]
- Jangara, H.; Ozturk, C.A. Longwall top coal caving design for thick coal seam in very poor strength surrounding strata. Int. J. Coal Sci. Technol. 2021, 8, 641–658. [Google Scholar] [CrossRef]
- Li, C.; Guo, D.; Zhang, Y.; An, C. Compound-mode crack propagation law of PMMA semicircular-arch roadway specimens under impact loading. Int. J. Coal Sci. Technol. 2021, 8, 1302–1315. [Google Scholar] [CrossRef]
- Liu, B.; Zhao, Y.; Zhang, C.; Zhou, J.; Li, Y.; Sun, Z. Characteristic strength and acoustic emission properties of weakly cemented sandstone at different depths under uniaxial compression. Int. J. Coal Sci. Technol. 2021, 8, 1288–1301. [Google Scholar] [CrossRef]
- Zuo, J.; Wang, J.; Jiang, Y. Macro/meso failure behavior of surrounding rock in deep roadway and its control technology. Int. J. Coal Sci. Technol. 2019, 6, 301–319. [Google Scholar] [CrossRef]
- Chen, B. Stress-induced trend: The clustering feature of coal mine disasters and earthquakes in China. Int. J. Coal Sci. Technol. 2020, 7, 676–692. [Google Scholar] [CrossRef]
- Chen, Y.; Zuo, J.; Liu, D.; Li, Y.; Wang, Z. Experimental and numerical study of coal-rock bimaterial composite bodies under triaxial compression. Int. J. Coal Sci. Technol. 2021, 8, 908–924. [Google Scholar] [CrossRef]
- Zhang, S.; Lu, L.; Wang, Z.; Wang, S. A physical model study of surrounding rock failure near a fault under the influence of footwall coal mining. Int. J. Coal Sci. Technol. 2021, 8, 626–640. [Google Scholar] [CrossRef]
- Chi, X.; Yang, K.; Wei, Z. Breaking and mining-induced stress evolution of overlying strata in the working face of a steeply dipping coal seam. Int. J. Coal Sci. Technol. 2021, 8, 614–625. [Google Scholar] [CrossRef]
- Feng, G.; Kang, Y.; Wang, X.-C. Fracture failure of granite after varied durations of thermal treatment: An experimental study. R. Soc. Open Sci. 2019, 6, 190144. [Google Scholar] [CrossRef] [PubMed]
- Kim, B.-H.; Walton, G.; Larson, M.K.; Berry, S. Investigation of the anisotropic confinement-dependent brittleness of a Utah coal. Int. J. Coal Sci. Technol. 2021, 8, 274–290. [Google Scholar] [CrossRef]
- Yang, D.; Ning, Z.; Li, Y.; Lv, Z.; Qiao, Y. In situ stress measurement and analysis of the stress accumulation levels in coal mines in the northern Ordos Basin, China. Int. J. Coal Sci. Technol. 2021, 8, 1316–1335. [Google Scholar] [CrossRef]
- Lou, J.; Gao, F.; Yang, J.; Ren, Y.; Li, J.; Wang, X.; Yang, L. Characteristics of evolution of mining-induced stress field in the longwall panel: Insights from physical modeling. Int. J. Coal Sci. Technol. 2021, 8, 938–955. [Google Scholar] [CrossRef]
- Ding, X.; Xiao, X.-C.; Wu, D.; Lv, X.-F. Mechanical properties and charge signal characteristics in coal material failure under different loading paths. Int. J. Coal Sci. Technol. 2019, 6, 138–149. [Google Scholar] [CrossRef]
- Lin, K.; Huang, W.; Finkelman, R.B.; Chen, J.; Yi, S.; Cui, X.; Wang, Y. Distribution, modes of occurrence, and main factors influencing lead enrichment in Chinese coals. Int. J. Coal Sci. Technol. 2020, 7, 1–18. [Google Scholar] [CrossRef]
- Liu, S.; Tan, F.; Huo, T.; Tang, S.; Zhao, W.; Chao, H. Origin of the hydrate bound gases in the Juhugeng Sag, Muli Basin, Tibetan Plateau. Int. J. Coal Sci. Technol. 2020, 7, 43–57. [Google Scholar] [CrossRef]
- Chen, Y.-L.; Wang, S.-R.; Ni, J.; Azzam, R.; Fernandez-Steeger, T.M. An experimental study of the mechanical properties of granite after high temperature exposure based on mineral characteristics. Eng. Geol. 2017, 220, 234–242. [Google Scholar] [CrossRef]
- Chen, Y.; Watanabe, K.; Kusuda, H.; Kusaka, E.; Mabuchi, M. Crack growth in Westerly granite during a cyclic loading test. Eng. Geol. 2011, 117, 189–197. [Google Scholar] [CrossRef]
- Xue, D.; Lu, L.; Zhou, J.; Lu, L.; Liu, Y. Cluster modeling of the short-range correlation of acoustically emitted scattering signals. Int. J. Coal Sci. Technol. 2021, 8, 575–589. [Google Scholar] [CrossRef]
- Kumari, W.; Ranjith, P.; Perera, M.; Chen, B.; Abdulagatov, I. Temperature-dependent mechanical behaviour of Australian Strathbogie granite with different cooling treatments. Eng. Geol. 2017, 229, 31–44. [Google Scholar] [CrossRef]
- Kumari, W.; Ranjith, P.; Perera, M.; Shao, S.; Chen, B.; Lashin, A.; Al Arifi, N.; Rathnaweera, T. Mechanical behaviour of Australian Strathbogie granite under in-situ stress and temperature conditions: An application to geothermal energy extraction. Geothermics 2017, 65, 44–59. [Google Scholar] [CrossRef]
- Liu, H.; Zhang, K.; Shao, S.; Ranjith, P.G. Numerical Investigation on the Mechanical Properties of Australian Strathbogie Granite under Different Temperatures Using Discrete Element Method. Rock Mech. Rock Eng. 2019, 52, 3719–3735. [Google Scholar] [CrossRef]
- Liu, H.; Zhang, K.; Shao, S.; Ranjith, P.G. Numerical investigation on the cooling-related mechanical properties of heated Australian Strathbogie granite using Discrete Element Method. Eng. Geol. 2020, 264, 105371. [Google Scholar] [CrossRef]
- Zhang, F.; Zhang, Y.; Yu, Y.; Hu, D.; Shao, J. Influence of cooling rate on thermal degradation of physical and mechanical properties of granite. Int. J. Rock Mech. Min. Sci. 2020, 129, 104285. [Google Scholar] [CrossRef]
- Zhao, Z. Thermal influence on mechanical properties of granite: A microcracking perspective. Rock Mech. Rock Eng. 2016, 49, 747–762. [Google Scholar] [CrossRef]
- Su, G.; Chen, Z.; Ju, J.W.; Jiang, J. Influence of temperature on the strainburst characteristics of granite under true triaxial loading conditions. Eng. Geol. 2017, 222, 38–52. [Google Scholar] [CrossRef]
- Tian, Z.; Tang, C.a.; Liu, Y.; Tang, Y. Zonal disintegration test of deep tunnel under plane strain conditions. Int. J. Coal Sci. Technol. 2020, 7, 337–349. [Google Scholar] [CrossRef]
- Zhou, A.; Zhang, M.; Wang, K.; Elsworth, D. Near-source characteristics of two-phase gas–solid outbursts in roadways. Int. J. Coal Sci. Technol. 2021, 8, 685–696. [Google Scholar] [CrossRef]
- Song, Z.; Ji, H.; Liu, Z.; Sun, L. Study on the critical stress threshold of weakly cemented sandstone damage based on the renormalization group method. Int. J. Coal Sci. Technol. 2020, 7, 693–703. [Google Scholar] [CrossRef]
- Dou, L.; Yang, K.; Chi, X. Fracture behavior and acoustic emission characteristics of sandstone samples with inclined precracks. Int. J. Coal Sci. Technol. 2021, 8, 77–87. [Google Scholar] [CrossRef]
- Cheng, X. Damage and failure characteristics of rock similar materials with pre-existing cracks. Int. J. Coal Sci. Technol. 2019, 6, 505–517. [Google Scholar] [CrossRef]
- Placido, F. Thermoluminescence test for fire-damaged concrete. Mag. Concr. Res. 1980, 32, 112–116. [Google Scholar] [CrossRef]
- Chew, M.Y. The assessment of fire damaged concrete. Build. Environ. 1993, 28, 97–102. [Google Scholar] [CrossRef]
- Sharma, L.; Sirdesai, N.; Sharma, K.; Singh, T. Experimental study to examine the independent roles of lime and cement on the stabilization of a mountain soil: A comparative study. Appl. Clay Sci. 2018, 152, 183–195. [Google Scholar] [CrossRef]
- Chaki, S.; Takarli, M.; Agbodjan, W. Influence of thermal damage on physical properties of a granite rock: Porosity, permeability and ultrasonic wave evolutions. Constr. Build. Mater. 2008, 22, 1456–1461. [Google Scholar] [CrossRef]
- Wang, M.; Tan, C.; Meng, J.; Yang, B.; Li, Y. Crack classification and evolution in anisotropic shale during cyclic loading tests by acoustic emission. J. Geophys. Eng. 2017, 14, 930–938. [Google Scholar] [CrossRef]
- Inserra, C.; Biwa, S.; Chen, Y. Influence of thermal damage on linear and nonlinear acoustic properties of granite. Int. J. Rock Mech. Min. Sci. 2013, 62, 96–104. [Google Scholar] [CrossRef]
- Yang, S.-Q.; Ranjith, P.; Huang, Y.-H.; Yin, P.-F.; Jing, H.-W.; Gui, Y.-L.; Yu, Q.-L. Experimental investigation on mechanical damage characteristics of sandstone under triaxial cyclic loading. Geophys. J. Int. 2015, 201, 662–682. [Google Scholar] [CrossRef]
- Yang, S.-Q.; Ranjith, P.; Jing, H.-W.; Tian, W.-L.; Ju, Y. An experimental investigation on thermal damage and failure mechanical behavior of granite after exposure to different high temperature treatments. Geothermics 2017, 65, 180–197. [Google Scholar] [CrossRef]
- Ulusay, R. The ISRM Suggested Methods for Rock Characterization, Testing and Monitoring: 2007–2014; Springer: Cham, Switzerland, 2014. [Google Scholar]
- Zhou, J.; Lin, H.; Jin, H.; Li, S.; Yan, Z.; Huang, S. Cooperative prediction method of gas emission from mining face based on feature selection and machine learning. Int. J. Coal Sci. Technol. 2022, 9, 51. [Google Scholar] [CrossRef]
- Gorai, A.K.; Raval, S.; Patel, A.K.; Chatterjee, S.; Gautam, T. Design and development of a machine vision system using artificial neural network-based algorithm for automated coal characterization. Int. J. Coal Sci. Technol. 2021, 8, 737–755. [Google Scholar] [CrossRef]
- Xie, J.; Ge, F.; Cui, T.; Wang, X. A virtual test and evaluation method for fully mechanized mining production system with different smart levels. Int. J. Coal Sci. Technol. 2022, 9, 41. [Google Scholar] [CrossRef]
- Bai, Q.; Zhang, C.; Paul Young, R. Using true-triaxial stress path to simulate excavation-induced rock damage: A case study. Int. J. Coal Sci. Technol. 2022, 9, 49. [Google Scholar] [CrossRef]
- He, S.; Qin, M.; Qiu, L.; Song, D.; Zhang, X. Early warning of coal dynamic disaster by precursor of AE and EMR “quiet period”. Int. J. Coal Sci. Technol. 2022, 9, 46. [Google Scholar] [CrossRef]
- Tarawneh, A.S.; Chetverikov, D.; Verma, C.; Hassanat, A.B. Stability and reduction of statistical features for image classification and retrieval: Preliminary results. In Proceedings of the 2018 9th International Conference on Information and Communication Systems (ICICS), Irbid, Jordan, 3–5 April 2018; pp. 117–121. [Google Scholar]
- Tarawneh, A.S.; Hassanat, A.B.; Almohammadi, K.; Chetverikov, D.; Bellinger, C. Smotefuna: Synthetic minority over-sampling technique based on furthest neighbour algorithm. IEEE Access 2020, 8, 59069–59082. [Google Scholar] [CrossRef]
- Armaghani, D.J.; Amin, M.F.M.; Yagiz, S.; Faradonbeh, R.S.; Abdullah, R.A. Prediction of the uniaxial compressive strength of sandstone using various modeling techniques. Int. J. Rock Mech. Min. Sci. 2016, 85, 174–186. [Google Scholar] [CrossRef]
- Momeni, E.; Armaghani, D.J.; Hajihassani, M.; Amin, M.F.M. Prediction of uniaxial compressive strength of rock samples using hybrid particle swarm optimization-based artificial neural networks. Measurement 2015, 60, 50–63. [Google Scholar] [CrossRef]
- Parsajoo, M.; Armaghani, D.J.; Mohammed, A.S.; Khari, M.; Jahandari, S. Tensile strength prediction of rock material using non-destructive tests: A comparative intelligent study. Transp. Geotech. 2021, 31, 100652. [Google Scholar] [CrossRef]
- Cabalar, A.F.; Cevik, A.; Gokceoglu, C. Some applications of adaptive neuro-fuzzy inference system (ANFIS) in geotechnical engineering. Comput. Geotech. 2012, 40, 14–33. [Google Scholar] [CrossRef]
- Armaghani, D.J.; Mohamad, E.T.; Hajihassani, M.; Yagiz, S.; Motaghedi, H. Application of several non-linear prediction tools for estimating uniaxial compressive strength of granitic rocks and comparison of their performances. Eng. Comput. 2016, 32, 189–206. [Google Scholar] [CrossRef]
- Barzegar, R.; Sattarpour, M.; Nikudel, M.R.; Moghaddam, A.A. Comparative evaluation of artificial intelligence models for prediction of uniaxial compressive strength of travertine rocks, case study: Azarshahr area, NW Iran. Model. Earth Syst. Environ. 2016, 2, 76. [Google Scholar] [CrossRef]
- Majdi, A.; Rezaei, M. Prediction of unconfined compressive strength of rock surrounding a roadway using artificial neural network. Neural Comput. Appl. 2013, 23, 381–389. [Google Scholar] [CrossRef]
- Minaeian, B.; Ahangari, K. Prediction of the uniaxial compressive strength and Brazilian tensile strength of weak conglomerate. Int. J. Geo-Eng. 2017, 8, 19. [Google Scholar] [CrossRef]
- Yesiloglu-Gultekin, N.; Gokceoglu, C.; Sezer, E.A. Prediction of uniaxial compressive strength of granitic rocks by various nonlinear tools and comparison of their performances. Int. J. Rock Mech. Min. Sci. 2013, 62, 113–122. [Google Scholar] [CrossRef]
- Singh, R.; Kainthola, A.; Singh, T. Estimation of elastic constant of rocks using an ANFIS approach. Appl. Soft Comput. 2012, 12, 40–45. [Google Scholar] [CrossRef]
- Singh, T.N.; Verma, A.K. Comparative analysis of intelligent algorithms to correlate strength and petrographic properties of some schistose rocks. Eng. Comput. 2012, 28, 1–12. [Google Scholar] [CrossRef]
- Sirdesai, N.N.; Singh, A.; Sharma, L.K.; Singh, R.; Singh, T. Determination of thermal damage in rock specimen using intelligent techniques. Eng. Geol. 2018, 239, 179–194. [Google Scholar] [CrossRef]
- Shen, Y.-J.; Zhang, Y.-L.; Gao, F.; Yang, G.-S.; Lai, X.-P. Influence of temperature on the microstructure deterioration of sandstone. Energies 2018, 11, 1753. [Google Scholar] [CrossRef]
- Sun, Q.; Geng, J.; Zhang, W.; Lü, C. Variation of wave velocity and thermal conductivity of concrete after high-temperature treatment. Environ. Earth Sci. 2017, 76, 88. [Google Scholar] [CrossRef]
- Garson, G.D. Multiple Regression; Statistical Associates Publishers: Fargo, ND, USA, 2014. [Google Scholar]
- Cohen, P.; West, S.G.; Aiken, L.S. Applied Multiple Regression/Correlation Analysis for the Behavioral Sciences; Lawrence Erlbaum Associates Publishers: Mahwah, NJ, USA, 2002. [Google Scholar]
- Sharma, L.; Singh, R.; Umrao, R.; Sharma, K.; Singh, T. Evaluating the modulus of elasticity of soil using soft computing system. Eng. Comput. 2017, 33, 497–507. [Google Scholar] [CrossRef]
- Sharma, L.; Singh, T. Regression-based models for the prediction of unconfined compressive strength of artificially structured soil. Eng. Comput. 2018, 34, 175–186. [Google Scholar] [CrossRef]
- Zhang, Y.; Zhou, L.; Hu, Z.; Yu, Z.; Hao, S.; Lei, Z.; Xie, Y. Prediction of layered thermal conductivity using artificial neural network in order to have better design of ground source heat pump system. Energies 2018, 11, 1896. [Google Scholar] [CrossRef]
- Arcaklioğlu, E.; Erişen, A.; Yilmaz, R. Artificial neural network analysis of heat pumps using refrigerant mixtures. Energy Convers. Manag. 2004, 45, 1917–1929. [Google Scholar] [CrossRef]
- Kumar, R.; Aggarwal, R.; Sharma, J. Energy analysis of a building using artificial neural network: A review. Energy Build. 2013, 65, 352–358. [Google Scholar] [CrossRef]
- Ma, L.; Khan, N.M.; Cao, K.; Rehman, H.; Salman, S.; Rehman, F.U. Prediction of Sandstone Dilatancy Point in Different Water Contents Using Infrared Radiation Characteristic: Experimental and Machine Learning Approaches. Lithosphere 2022, 2021, 3243070. [Google Scholar] [CrossRef]
- Khan, N.M.; Ma, L.; Cao, K.; Hussain, S.; Liu, W.; Xu, Y.; Yuan, Q.; Gu, J. Prediction of an early failure point using infrared radiation characteristics and energy evolution for sandstone with different water contents. Bull. Eng. Geol. Environ. 2021, 80, 6913–6936. [Google Scholar] [CrossRef]
- Khan, N.M.; Cao, K.; Yuan, Q.; Hashim, M.H.B.M.; Rehman, H.; Hussain, S.; Emad, M.Z.; Ullah, B.; Shah, K.S.; Khan, S. Application of Machine Learning and Multivariate Statistics to Predict Uniaxial Compressive Strength and Static Young’s Modulus Using Physical Properties under Different Thermal Conditions. Sustainability 2022, 14, 9901. [Google Scholar]
- Fidan, S.; Oktay, H.; Polat, S.; Ozturk, S. An Artificial Neural Network Model to Predict the Thermal Properties of Concrete Using Different Neurons and Activation Functions. Adv. Mater. Sci. Eng. 2019, 2019, 3831813. [Google Scholar] [CrossRef]
- Zadeh, L.A. Fuzzy sets. Inf. Control 1965, 8, 338–353. [Google Scholar] [CrossRef]
- Jang, J.-S. ANFIS: Adaptive-network-based fuzzy inference system. IEEE Trans. Syst. Man Cybern. 1993, 23, 665–685. [Google Scholar] [CrossRef]
- Zhang, L.; Liu, J.; Lai, J.; Xiong, Z. Performance analysis of adaptive neuro fuzzy inference system control for MEMS navigation system. Math. Probl. Eng. 2014, 2014, 961067. [Google Scholar] [CrossRef]
- Şahin, M.; Erol, R. Prediction of attendance demand in European football games: Comparison of ANFIS, fuzzy logic, and ANN. Comput. Intell. Neurosci. 2018, 2018, 5714872. [Google Scholar] [CrossRef] [PubMed]
- Lawal, A.I.; Aladejare, A.E.; Onifade, M.; Bada, S.; Idris, M.A. Predictions of elemental composition of coal and biomass from their proximate analyses using ANFIS, ANN and MLR. Int. J. Coal Sci. Technol. 2021, 8, 124–140. [Google Scholar] [CrossRef]


| Sample No. | Cooling Condition | Temperature (°C) | Porosity (%) | Density (Kg/m3) | P-Wave (m/s) | Elasticity (GPa) | DTρ | DTE |
|---|---|---|---|---|---|---|---|---|
| An | Slow cooling | 25 | 1.33 | 2681.67 | 4098.67 | 20.70 | 0.00 | 0.00 |
| Bn | 300 | 3.43 | 2674.56 | 4047.56 | 16.50 | 0.41 | 0.19 | |
| Cn | 600 | 6.83 | 2673.17 | 3916.20 | 9.10 | 0.75 | 0.55 | |
| Dn | 900 | 10.83 | 2671.27 | 3700.27 | 3.62 | 0.86 | 0.82 | |
| An | Rapid Cooling | 25 | 1.33 | 2681.67 | 4098.67 | 20.70 | 0.00 | 0.00 |
| En | 300 | 4.53 | 2673.09 | 3747.56 | 12.73 | 0.70 | 0.37 | |
| Fn | 600 | 7.63 | 2672.16 | 3560.65 | 7.80 | 0.82 | 0.62 | |
| Gn | 900 | 13.53 | 2670.07 | 3210.27 | 2.62 | 0.90 | 0.87 |
| Cooling Conditions | Thermal Damage Based on | Training Function | R2 | RMSE | Neuron | Time (s) |
|---|---|---|---|---|---|---|
| Slow cooling | Porosity | BFG | 0.99 | 0.03 | 61 | 307 |
| RP | 0.99 | 0.24 | 35 | 256 | ||
| SCG | 0.99 | 0.35 | 32 | 308 | ||
| CGB | 0.99 | 0.03 | 71 | 289 | ||
| LM | 0.999 | 0.01 | 80 | 65 | ||
| Elasticity | BFG | 0.99 | 0.03 | 68 | 308 | |
| RP | 0.99 | 0.25 | 53 | 256 | ||
| SCG | 0.99 | 0.35 | 93 | 310 | ||
| CGB | 0.99 | 0.04 | 34 | 291 | ||
| LM | 0.999 | 0.07 | 52 | 43 | ||
| Rapid cooling | Porosity | BFG | 0.99 | 0.02 | 72 | 307 |
| RP | 0.99 | 0.23 | 64 | 256 | ||
| SCG | 0.99 | 0.35 | 54 | 308 | ||
| CGB | 0.99 | 0.03 | 25 | 289 | ||
| LM | 0.999 | 0.02 | 18 | 34 | ||
| Elasticity | BFG | 0.99 | 0.02 | 14 | 308 | |
| RP | 0.99 | 0.22 | 4 | 254 | ||
| SCG | 0.99 | 0.32 | 32 | 310 | ||
| CGB | 0.99 | 0.03 | 12 | 291 | ||
| LM | 0.999 | 0.012 | 74 | 58 |
| ANFIS Parameters | Value (Thermal Damage Factor on Porosity and Elasticity) | |||
|---|---|---|---|---|
| Slow Cooling | Rapid Cooling | |||
| Porosity | Elasticity | Porosity | Elasticity | |
| FIS generator types | Sub clustering | ✓ | ✓ | ✓ |
| Membership function types for each input | Gaussian | ✓ | ✓ | ✓ |
| Type Membership function types for each input | Linear | ✓ | ✓ | ✓ |
| Range of influence | 0.5 | ✓ | ✓ | ✓ |
| Squash Factor | 1.25 | ✓ | ✓ | ✓ |
| Accept Ratio | 0.5 | ✓ | ✓ | ✓ |
| Reject Ratio | 0.15 | ✓ | ✓ | ✓ |
| Number of fuzzy rules | 256 | ✓ | ✓ | ✓ |
| Number of epochs | 50 | ✓ | ✓ | ✓ |
| Number of data point | 40 | ✓ | ✓ | ✓ |
| Number training points | 28 | ✓ | ✓ | ✓ |
| Number of testing points | 6 | ✓ | ✓ | ✓ |
| Number of valid points | 6 | ✓ | ✓ | ✓ |
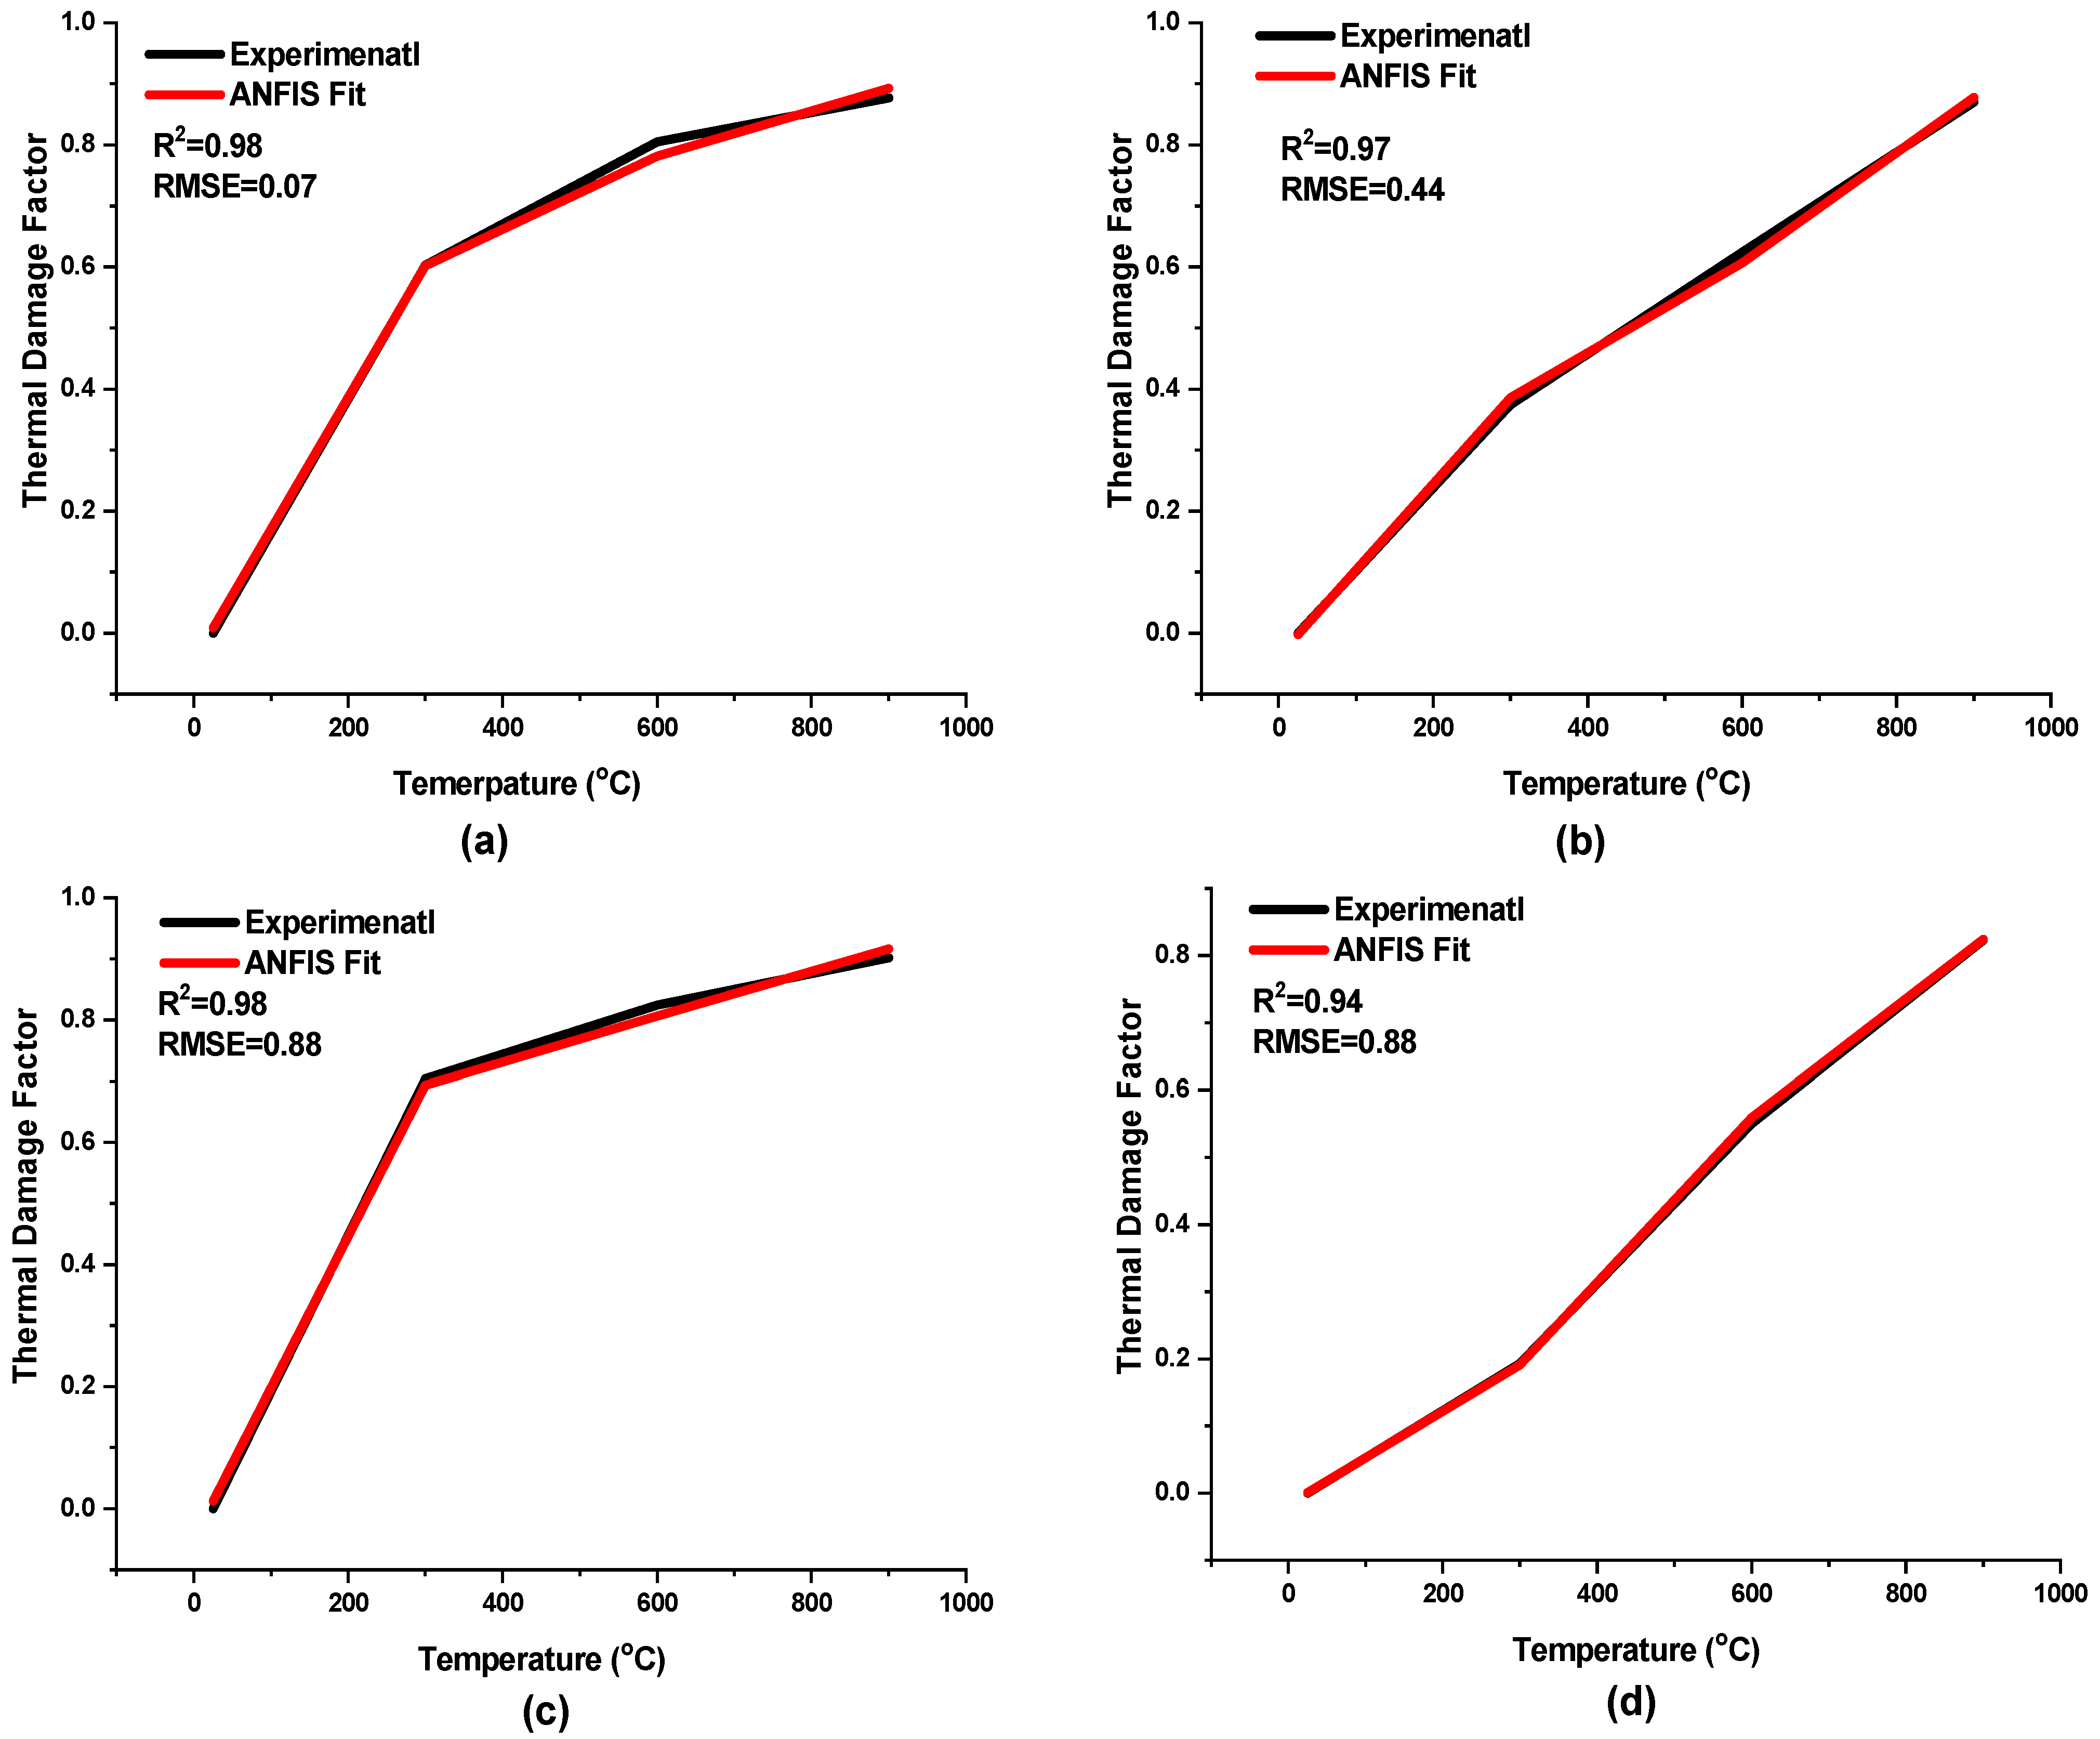
| Cooling Conditions | Thermal Damage Based on | Models | R2 | A20 Index | RMSE | MAPE (%) | VAF (%) |
|---|---|---|---|---|---|---|---|
| Slow cooling | Porosity | MLR | 0.97 | 0.94 | 0.061 | 31.55 | 91.51 |
| ANFIS | 0.98 | 0.96 | 0.07 | 7.4 | 92.33 | ||
| ANN | 0.99 | 0.98 | 0.01 | 0.14 | 100 | ||
| Elasticity | MLR | 0.94 | 0.91 | 0.93 | 31.53 | 91.51 | |
| ANFIS | 0.97 | 0.96 | 0.44 | 8.96 | 78.52 | ||
| ANN | 0.99 | 0.98 | 0.07 | 1.18 | 99.19 | ||
| Rapid cooling | Porosity | MLR | 0.97 | 0.94 | 0.91 | 11.96 | 94.73 |
| ANFIS | 0.98 | 0.96 | 0.88 | 11.56 | 84.29 | ||
| ANN | 0.99 | 0.98 | 0.02 | 0.36 | 99.99 | ||
| Elasticity | MLR | 0.94 | 0.91 | 0.92 | 29.53 | 94.51 | |
| ANFIS | 0.97 | 0.96 | 0.88 | 15.03 | 80.68 | ||
| ANN | 0.99 | 0.98 | 0.09 | 1.53 | 99.75 |
Publisher’s Note: MDPI stays neutral with regard to jurisdictional claims in published maps and institutional affiliations. |
© 2022 by the authors. Licensee MDPI, Basel, Switzerland. This article is an open access article distributed under the terms and conditions of the Creative Commons Attribution (CC BY) license (https://creativecommons.org/licenses/by/4.0/).
Share and Cite
Khan, N.M.; Cao, K.; Emad, M.Z.; Hussain, S.; Rehman, H.; Shah, K.S.; Rehman, F.U.; Muhammad, A. Development of Predictive Models for Determination of the Extent of Damage in Granite Caused by Thermal Treatment and Cooling Conditions Using Artificial Intelligence. Mathematics 2022, 10, 2883. https://doi.org/10.3390/math10162883
Khan NM, Cao K, Emad MZ, Hussain S, Rehman H, Shah KS, Rehman FU, Muhammad A. Development of Predictive Models for Determination of the Extent of Damage in Granite Caused by Thermal Treatment and Cooling Conditions Using Artificial Intelligence. Mathematics. 2022; 10(16):2883. https://doi.org/10.3390/math10162883
Chicago/Turabian StyleKhan, Naseer Muhammad, Kewang Cao, Muhammad Zaka Emad, Sajjad Hussain, Hafeezur Rehman, Kausar Sultan Shah, Faheem Ur Rehman, and Aamir Muhammad. 2022. "Development of Predictive Models for Determination of the Extent of Damage in Granite Caused by Thermal Treatment and Cooling Conditions Using Artificial Intelligence" Mathematics 10, no. 16: 2883. https://doi.org/10.3390/math10162883
APA StyleKhan, N. M., Cao, K., Emad, M. Z., Hussain, S., Rehman, H., Shah, K. S., Rehman, F. U., & Muhammad, A. (2022). Development of Predictive Models for Determination of the Extent of Damage in Granite Caused by Thermal Treatment and Cooling Conditions Using Artificial Intelligence. Mathematics, 10(16), 2883. https://doi.org/10.3390/math10162883