Abstract
Spectrum-Based Fault Localization (SBFL) is one of the most effective fault localization techniques, and its performance closely depends on the program spectra and the ranking formula. Despite the numerous proposed approaches for fault localization, there are still great demands for fault localization techniques that can help guide developers to the locations of faults. Therefore, this paper defines four metrics from the program spectrum, which can become essential components of ranking formulas to mitigate spectrum-based fault localization problems. These metrics are further combined to propose a new heuristic, Metrics Combination (MECO), which does not require any prior information on program structure or semantics to locate faults effectively. The evaluation experiments are conducted on the Defects4J and SIR datasets, and MECO is compared with the 18 maximal formulas. The experimental result shows that MECO is more efficient in terms of Precision, Accuracy, and Wasted Efforts than the compared formulas. An empirical evaluation also indicates that two of the defined metrics, Assumption Proportion and Fault Assumption, when combined with the existing formulas, improve the localization effectiveness, especially the precision of ER5a-c (77.77%), GP02 (41%), and GP19 (27.22%), respectively.
Keywords:
fault localization; fault assumption; assumption proportion; failed execution flag; total execution MSC:
68N30
1. Introduction
Software Fault Localization (SFL) in program debugging is a tedious and time-consuming process for pinpointing the root causes of program failures. It plays an indispensable role in software debugging, which has been estimated to account for up to 75% to 80% of the total software cost [1,2].
The automation of locating faults can effectively improve the efficiency and quality of debugging, so it has become a common goal pursued by industry and academia. In recent years, various methods have been proposed to assist programmers in performing fault localization, including Spectrum-Based Fault Localization [2,3,4,5,6,7], Program Slicing [8,9,10], Machine Learning [11,12,13,14], and Mutation-Based Fault Localization (MBFL) [15,16,17].
Spectrum-Based Fault Localization (SBFL) is one of the most widely used approaches due to its lightweight and effective features [4,7,12,18]. SBFL techniques collect program execution traces from passed and failed executions stimulated by a collection of test cases. These traces record the specific execution information of the program entities (such as statements, basic blocks, and methods), which constitutes the program spectrum. Spectrum-based methods are based on a fundamental assumption: an entity with a higher number of failed executions, but fewer passed executions is more likely to be faulty [19]. On this basis, SBFL techniques use a ranking formula and calculate the suspiciousness score for each entity using program spectra. Then, they sort program entities in descending order of the suspiciousness scores, which indicate how likely each program entity is to be faulty. Finally, testers can manually inspect the source code to diagnose the root causes of failures by following the ranked entity list (from the beginning to the end).
So far, although a large number of SBFL methods have been proposed (such as Jaccard/Ochiai [20,21], Op1&2 [7], also known as ER1a&b [4], Tarantula [22], FLUCCS [23], Savant [24], and Prince [25]), no one can always perform the best in practice [26]. Therefore, how to further improve the accuracy of fault localization is still a research problem worth exploring. One of the significant existing problems is that many non-faulty statements possess identical program spectra as the correct ones and then share similar suspiciousness scores computed by some existing techniques. This problem causes the testers to check many non-faulty statements before discovering the real faulty ones, consequently affecting the efficiency of fault localization. Except for those statements contained in the Dynamic Basic Block (DBB) [27], whose spectra are always identical, other scenarios still have the potential to be further improved, in particular the uncovered faulty statements during failed test executions. For example, if faulty statements are located in a simple if statement block without an else-clause and no test cases cover the branch where such faults are located, many existing formulas may not identify this fault. Here, we cannot go in-depth on why test cases do not cover a faulty line, as this is beyond the scope of this paper. However, when this situation happens, how to identify this kind of fault is a major concern in fault localization.
To this effect, defining a means to identify the following problems top our goals in this study:
- -
- Faulty statements in a pool of program statements with identical failed execution values.
- -
- Faulty statements with fewer failed execution values than non-faulty statements.
- -
- Faulty statements that are not covered by any failed test (faulty statements with zero failed execution values).
One of the potential solutions is to utilize the relationship among the failed execution, passed non-execution, and the total test cases to break the ties between the faulty and non-faulty statements.
Therefore, this paper proposes a new method of fault localization based on coverage similarity analysis. First, we suggest combining a failed execution (), non-execution pass (), and the total test cases (, , , ) to form a metric that is capable of breaking a tie between faulty and non-faulty statements with identical failed execution values. This metric is referred to as Assumption Proportion in this study and has the exact definition as Simple-Matching cited in Naish et al. [7]. This metric is motivated by its ability to calculate the percentage of the probability that a statement contains a fault. Then, this paper proposes Failed Execution Flag, a metric that returns a value of “1” for a statement covered by one or more failed test cases and “0” for a statement not covered by failed test cases. This metric differs from Binary, proposed in Lee Hua Jie [28]. The Binary metric failed to consider that none of the failed test cases covers many faulty statements. Therefore, it isolates any faulty statement with failed non-execution values. Unlike Binary, the Failed Execution Flag considers all the statements covered by the failed test case(s) as potential faulty statements. The Fault Assumption metric is further suggested, which is the relationship between and . This metric can calculate the total probability that a statement contains a fault, considering that both and contribute enormously to the fault-probability of the program statements. It has the exact definition as Hamming, etc., in Naish et al. Finally, Total Execution ( and ) is proposed, adding the total number of failed executions to the pass execution to enhance fault localization.
The four metrics perform different functions. When a faulty statement has no execution values or lower execution values than the non-faulty statements, many existing formulas are not effective in such a situation; the Fault Assumption and Assumption Proportion metrics are better to use. In the same way, when the faulty program statement has smaller failed execution values than the non-faulty statements, the Failed Execution Flag can help localize this type of fault when combined with Fault Assumption or Assumption Proportion. Thus, when the faulty program statement has a higher passing execution than the non-faulty statement, Total Execution is more appropriate for localizing this fault. Therefore, a more sophisticated fault localization method can be proposed when combining all the suggested metrics.
Therefore, the suggested metrics are combined to devise a new formula known as Metrics Combination (MECO). The aim is to assess the effectiveness of each metric when combined to form a new heuristic and compare it with the existing maximal formulas. We empirically evaluate MECO based on the SIR repository [29] and Defects4J-repository [30] datasets.
The main contributions of this paper can be summarized as follows:
- It defines four metrics, Failed Execution Flag, Assumption Proportion, Total Execution, and Fault Assumption. It then assesses their effectiveness on each existing maximal formula to understand which is best to combine with them for effective fault localization.
- It proposes a new formula, MECO, by combining the proposed metrics, which developers can also use as a standalone method for fault localization.
- It assesses the contribution of each metric to the performance of the proposed method, MECO, to determine which contributes more to its fault localization accuracy.
- MECO is empirically evaluated in seeded and real faults of the SIR-repository and Defects4J-repository and compared on the effectiveness with the existing formulas.
The remainder of the paper is organized as follows. Section 2 provides an overview of fault localization and a running example. Section 3 presents the details of the proposed approach and introduces the metrics used to formulate MECO. Section 4 describes the experimental setup and more, while Section 5 of this study gives the results. The related work and threats to the validity are presented in Section 6 and Section 7. Finally, this study is concluded in Section 8.
2. Background and Motivation
2.1. Spectrum-Based Fault Localization
Spectrum-Based Fault Localization (SBFL) is an automated technique to pinpoint the location of a fault in the code. The location of a faulty component can be reported at any abstraction level, including statements, blocks, methods, etc. In SBFL, a tuple of four values represents a program entity’s spectrum. The spectrum is formalized as (, , , ), where and signify the number of failing and passing test cases that execute and and signify the number of failing and passing test instances that do not execute the program entity under consideration. The instrumentation of program entities can be used to collect spectra. A ranking metric can then be used to convert spectra into a suspiciousness score. Various ranking metrics referred to as formulas in this study have been proposed by different researchers to assign the highest suspiciousness score to the faulty program statements. Some of the well-known formulas have been demonstrated to perform best, termed maximal formulas [31,32]. These maximal formulas are both human designed based on an analytical approach, such as Tarantula [33], Ample [34], Ochiai1&2 [21], Jaccard [20], OP1&2 [7], [35], and Wong1–3 [36], and also evolved via genetic programming including GP2, 3, 13, and 19 [37] (see Table 1 for the list of maximal formulas studied in this paper).

Table 1.
Some notable well-performing formulas.
Many formulas emphasize how frequent failed test cases hit a program statement. Limitations on the performance of these maximal formulas unfold when there is a disparity between the number of failed test cases executing faulty and non-faulty program statements in favor of non-faulty program statements. Many program statements containing faults are not covered by any failed test cases, limiting the ability of the existing maximal formulas. In this case, we propose a method that utilizes the fault-revealing ability of the Assumption Proportion and Fault Assumption metrics to tackle the limitation, eliminating the issue of uncovered faulty statements. Furthermore, the coverage information of real faults is very dynamic. In this case, many non-faulty program statements have more potential of containing a fault. Therefore, this study defines different metrics that can:
- Distinguish the faulty statements covered by fewer failed executions than the non-faulty statements.
- Identify the faulty statements that have no failed execution.
- Identify the faulty statement with higher pass execution than non-faulty statements.
These metrics are then combined to propose MECO for effective fault localization.
2.2. Motivation
Given an n-statement of program P = () and a test suite T = () with m test cases, SBFL needs the collection of program spectrum information (M = coverage matrix), as well as testing outcomes R = (). The relationship between statement and test case is represented by the statement in the row and column of M. The statement is equal to (✓) if statement is covered by test case , otherwise blank. The R statement represents the testing result of test case on P. We may define a four-tuple = ( (), (), (), ()) to reflect the number of times has been executed or not executed for each statement . Furthermore, () and () imply the number of successful and unsuccessful test cases in T that do not execute , respectively; () and () imply the number of successful and unsuccessful test instances that execute , respectively. The size of the test suite T is always equal to the total of these four parts in .
Table 2 shows a simple function mid() that accepts as input three integers and outputs the median value. is buggy, which should be m = y. Next, Table 2 shows ten test cases, labeled as –, with different inputs. For each test case, the column shows the coverage of the statement (✓) and whether the test case passes (P) or fails (F).
Table 2.
Motivating example: fault, : . P: Assumption Proportion, F: Failed Execution Flag, A: Fault Assumption, E: Total Execution, MECO: Proposed method.
Six test cases passed, and four failed. For each statement, the program spectrum (, , , ) and the suspiciousness scores computed by one of the best maximal formulas, Jaccard, indicating the likelihood of the statement being faulty, are shown next to the test spectrum. The existing formula in the example fails to rank the faulty statement higher than the non-faulty ones. In short, almost 90% of the existing maximal formulas cannot place the faulty statement higher because some non-faulty ones, such as , , and , have greater failed execution values than the faulty statements and are highly ranked. The potential solutions to rank such a fault in the example given in Table 2 are:
- Find the relationship between the failed execution and non-execution pass, known as Fault Assumption, A.
- Divide Fault Assumption by the total test cases known as Fault Probability, P.
- Convert the failed execution to “1” or “0” if a statement has one or more failed executions or has no failed execution, known as Failed Execution Flag, F. This can replace failed execution () in any formula with only as its numerators, such as Jaccard, ER1b, and . When Failed Execution Flag replaces in Jaccard, ER1b, and , the formulas become , , and . Applying these metrics to the example will rank the faulty statement more than the non-faulty statements.
- Find the total number of test cases that hit each program statement, known as Total Execution, E.
- Combine the Fault Assumption, Assumption Proportion, Failed Execution Flag, and Total Execution to form a formula, MECO.
When the above-proposed solutions are applied to the example, the faulty statement can be distinguished from non-faulty ones. Therefore, a new fault localization method, MECO, is proposed for effective fault localization.
3. MECO Method
This study proposes MECO, which combines different metrics for fault localization. This section discusses the motivation for selecting the suggested metrics and how they are combined for effective fault localization.
This study defines four metrics that can localize faults in different situations and then combines them to propose MECO. Furthermore, the existing maximal formulas are overwhelming when no failed test cases cover the faulty statements and when the number of failed test cases executing non-faulty statements is higher than the faulty ones. Therefore, the suggested metrics to handle different fault localization problems in this study are discussed below.
- (1)
- Fault Assumption
This study assumes special attention should be given to a passed test that did not cover a program statement. A fault might have triggered the test to pass without hitting a program statement. Furthermore, with a close observation of some large real faulty programs, such as Closure and Time, in the presence of multiple faults, some faulty statements were not covered by any failed test, but have more passed non-execution tests. If the developers combine the failed execution and passed non-execution values, and , during debugging, it can rank the faulty program statements higher than the non-faulty ones. Some research work [19,35,39,40] has demonstrated that when failed test cases cover a statement, such a program statement is potentially faulty. Similarly, a statement is potentially faulty when no test cases cover it, but passed [35]. Consequently, developers may find themselves in a situation where hundreds of non-faulty program statements have higher failed execution than the faulty ones, for example if a faulty statement A has (38, 0, 3973, 1) coverage information and non-faulty statement B has (3661, 1, 350, 0). The majority of the existing maximal formulas cannot identify this fault. This coverage information can be found in large programs, such as closure in defects4j. Therefore, the union between a failed execution test and a passed non-execution test is defined, Fault Assumption, denoted as A, to help identify this fault. In Naish et al. [7], the definition of the Hamming, etc., formula is the same as the definition of the defined Fault Assumption in this study, but in a different context. The Fault Assumption metric is only a component of the proposed method. The Fault Assumption metric is given as the addition of failed execution and passed non-execution:
- (2)
- Assumption Proportion
The Assumption Proportion metric, denoted as P, calculates the percentage of the assumption that a program statement contains a fault. This metric helps identify a program statement that failed test cases during the coverage instrumentation. Using the above example in the Fault Assumption, we define a metric by dividing the Fault Assumption by the total test cases present in the test oracle, known as the Assumption Proportion. Ideally, the Simple-Matching formula in Naish et al.. has the exact definition of the Assumption Proportion in our study. However, we suggested this based on the problems found in the studied datasets. This metric is formulated based on the insight from the Fault Assumption metric, identifying a faulty statement with fewer failed execution values than the non-faulty statement. This metric is more effective if the of the faulty program statements is higher than the non-faulty ones. Therefore, we propose P as:
- (3)
- Failed Execution Flag
The Failed Execution Flag (F) converts the failed execution to “1” and “0”. This metric assigns “1” to a statement covered by one or more failed tests and “0” otherwise. It is motivated by the numerous non-faulty statements with higher failed execution values than faulty ones. This situation is prevalent with a close observation of many statements in real faults of defects4j programs, for example a faulty statement A with coverage information (20, 1, 50, 29) and a non-faulty statement B with coverage information (40, 30, 30, 0) in terms of (, , , ). There is no existing maximal formula that can identify this fault except Wong2. When the Failed Execution Flag is applied to convert the failed execution of the two statements and replace the numerator of , Kulczynski1, Jaccard, and other formulas with an numerator, A can have a higher suspiciousness score. Therefore, this metric is handy to flag failed execution values as 1 and 0, regardless of the number of failed tests that execute them. It is most effective when the number of failed executions of the non-faulty statements is higher than the faulty ones, and the faulty statement(s) has (have) higher passed non-execution values. The developer can then use other information to break the ties. Therefore, F is given as:
- (4)
- Total Execution
In the context of this study, the Total Execution (E) gives the overall number of hits that a program statement receives during coverage instrumentation. This metric can help localize faults, especially when the suspected program statements have fewer failed and more passed tests than the non-faulty statements, for example a faulty program statement A with coverage information (60, 1, 10, 29) and a non-faulty statement B with a program spectra (40, 1, 30, 29) in terms of (, , , ). Only the Ample formula can identify this fault among all the studied maximal formulas. The similar failed execution values of faulty and faulty statements with different higher passed execution values are common in real-fault programs, especially the Closure program benchmark. Therefore, we combined passed and failed executions with other metrics to localize faults in this study. Therefore, E is given as follows:
All the above-discussed metrics are combined to propose MECO, a heuristic that needs no other program information to localize faults in real and seeded faults effectively. Many existing formulas have their underlying intuition. Some of these intuitions are:
- The higher the failed test (i.e., ), the more suspicious the program’s statement.
- The higher the pass test (i.e., ), the lesser the suspicion of the program’s statement, and the lesser the pass test (i.e., ), the higher the suspicion of the program’s statement.
- The higher the uncovered failed test (i.e., ), the lesser the suspicious of the statement. The lesser the uncovered failed test, the higher the suspicion of the program’s statement.
This study also agrees with the intuitions and adds one other intuition based on the formula formulation.
- Intuition: The higher the Assumption Proportion with one or more failed execution, the higher the suspiciousness of such program statements.
Therefore, this study uses the four metrics discussed above to propose a new formula, which is given as:
The usefulness of each defined metric on the proposed fault localization formula and its underlying intuitions is discussed above with examples. Therefore, this proposed formula is empirically evaluated because it is the norm for fault localization studies and it is impossible to prove that one fault localization technique is always more effective than another [9,10,22,36,41,42].
4. Experimental Setup
This section contains the relevant details of the experimental study conducted to determine the efficacy of MECO.
4.1. Fault Localization
This study uses spectrum-based fault localization as the fault localization process. It performs its fault localization processes at the statement granularity level. Spectrum-based fault localization can use formulas to compute program statements’ suspiciousness scores to determine which part of the statements contains a fault. Thus, the effectiveness of MECO and the existing eighteen maximal formulas are evaluated as shown in Table 1.
4.2. Evaluation Metrics
This study uses the following three evaluation metrics to assess the rankings calculated by each fault localization method.
4.2.1. acc@n
This metric counts the number of successfully localized faults within the top-n positions of the ranked lists. Following the results, programmers investigate the top few places in a ranked list of potential faulty lines [1]. The percentage of absolute ranks is utilized, and n = 1, 3, 5 is chosen, computing acc@1, acc@3, and acc@5 scores. This study further used a max tie-breaker that ranks all tied elements with the lowest to break the tie if two program statements share the same suspiciousness score. The higher the number of faults placed by this metric, the better the formula.
4.2.2. Mean Average Precision
Traditionally, the Mean Average Precision (MAP) [43] is used to evaluate ranking lists in information retrieval. It can also be used to investigate fault localization. The MAP examines all suspicious program statements and prioritizes Recall over Precision. As a result, the MAP is more suited for developers who want to dig further into the ranking list to uncover more fault-related statements. We calculate the Average Precision (AP) of a ranking list as follows:
where i denotes a statement’s position in the ranking list, T denotes the list’s length, and the Boolean indicates if the statement in position i is faulty. The precision at the position in the suspiciousness score ranking list is Precision(i).
4.2.3. Wasted Effort
This study assumes that developers have a perfect comprehension of faults and can detect the fault as soon as they reach it when going through the ranking list. As a result, the developer’s wasted effort is the number of non-faulty statements inspected. Because a formula ranks all the program statements according to their suspiciousness scores for a given faulty program, it then calculates the wasted effort as the rank of the actual faulty program statement. Suppose more than one statement has identical suspiciousness scores as the faulty statement. In that case, we calculate the wasted effort as the average-rank of the total program statements that have identical scores. Therefore, we adopt the absolute wasted effort as Xuan and Martin [12] used it.
The wasted effort of a candidate statement is formally defined as:
where is the suspiciousness score computed by each formula, and are the subsets of faulty and non-faulty spectra, and is the length of all spectra elements in a set.
4.3. Dataset
This study conducted an experiment based on the SIR-repository [29] and Defects4J repository (version 1.2.0) [30] benchmarks, which have been commonly used data sets in automatic fault localization [4,36,42,44]. This study was unable to use the latest version of the defects4j dataset, v2.0.0, due to some unavoidable circumstances. However, version 1.2.0 still serves our purpose in this study. Furthermore, there are 92 faults (seeded) in the SIR repository written in the C language and 357 faults (real-world) written in Java in the Defects4J repository and are medium to large open-source projects. The total number of faults in the SIR is 219, spanning five versions of four different programs, FLEX, GREP, GZIP, and SED. This study isolated all the unreachable faults, 35, and 92 other uncompilable faults. The FLEX program is a lexical analyzer; the GREP program is a utility for text search; the GZIP program is a compressor; the SED program is an editor for the streamed text. The Defects4J repository, on the other hand, contains many real-world Java projects, but five were selected, JfreeChart, which was used for creating the chart, Google Closure for optimization, Apache common lang for JDK, Apache common-math for JDK as well, and Joda-Time for standard time. The subject programs are large enough, ranging from 9 k to 96 k LOC. The details of all the subject programs used in this study are shown in Table 3.
Table 3.
Subject programs.
4.4. Research Questions
- RQ1.
- Which of the metrics contribute more to the performance of MECO?This research question first assesses the performance of each metric to determine its performance. It then drops one metric at a time from the MECO formula and measures its performance. The results are then compared to MECO to determine if dropping one of the metrics can positively or negatively affect MECO’s performance. The effectiveness is measured using acc@n, Mean Average Precision, and Wasted Effort. MECO is evaluated in 449 program faults.
- RQ2.
- How effective is MECO compared to the existing maximal formulas?This research question assesses and compares the performance of MECO to the 18 existing maximal formulas using the three evaluation metrics. It compares the effectiveness of each method on the combined SIR faults and Defects4J project-by-project separated faults. A total of 449 program faults is used in this experiment.
- RQ3.
- How effective are the proposed metrics when combined with the existing maximal formulas?The effectiveness of the proposed metrics is assessed on the existing formulas when combined. This study investigates how these metrics boost the fault localization ability of the studied formulas. The approach employed is changing one metric at a time to observe the effect of a formula locating faults. Then, the percentage of the performance difference in 449 real and seeded faults is measured. Consult sbfl for further information about the studied formulas.
5. Results
This section presents the experimental results of this study. It also details the comparison of the results with the other methods in the real and seeded faults.
5.1. The Metric That Contributes More to the Performance of MECO
This study first determines the performance of each metric and then compares its effectiveness with the performance of MECO. Table 4 shows the performance of each metric and MECO when each metric is excluded from MECO.
Table 4.
Contribution of each metric to MECO’s performance. Assumption Proportion (P), Failed Execution Flag(F), Fault Assumption (A), Total Execution (E), MECO without A (W/A), MECO without P (W/P), MECO without F (W/F), and MECO without E (W/E).
5.1.1. Performance of Each Metric Compared to MECO
The fault localization accuracy of the utilized Fault Assumption and Assumption Proportion is better than the other two metrics. Both the Fault Assumption and Assumption proportions placed an average of 9% faults at the top of the ranking list, just 47% of the MECO’s performance. These two metrics are more effective in seeded faults of the SIR repository. The Total Execution metric has the least performance among the four metrics. This metric only placed an average of 1% of faults at the top of the ranking list. In terms of Wasted Effort, the developer must check an average of 50% of the total statement before localizing the first fault in the subject programs without the Fault Assumption and Assumption Proportion metrics. These two metrics are better than the Failed Execution Flag and Total Execution metrics in terms of Fault Localization Accuracy, but inferior when assessing the number of statements the developer must check before localizing faults. The Failed Execution Flag outperformed the other metrics in terms of Wasted Efforts. The developer must check an average of 23% of the total program statement before localizing the first fault, 39% of the MECO’s performance. On fault localization precision, both the Fault Assumption and Assumption Proportion metrics precisely localized more faults than the Failed Execution Flag and Total Execution Metrics. The performance of these two metrics is 52% of the MECO’s performance.
5.1.2. The Contributions of Each Metric to MECO
MECO without Fault Assumption: The exclusion of the Fault Assumption from the MECO formula placed 5% faults at the top of the ranking list. Its inclusion improved MECO’s fault localization accuracy by 24%. In the same sense, excluding this metric from MECO increases the number of non-faulty statements to be checked before locating the first fault by 15%. MECO’s fault localization precision is inferior without the Fault Assumption. MECO achieved an average of 67% improvements with this metric; see Table 4.
MECO without Assumption Proportion: The MECO formula without the Assumption Proportion localized only 2% of the faults at the top of the ranking list. If this metric is replaced in MECO, it increases the fault localization accuracy by 27%. Furthermore, without this metric, MECO can only help the developer check 17.71% of non-faulty statements before locating the first fault. If this metric is replaced in MECO, it increases the performance by 9%. It also increases the MECO’s fault localization precision by 80%; see Table 4.
MECO without Failed Execution Flag: The Failed Execution Flag did not impact MECO’s fault localization accuracy, unlike the Fault Assumption and Assumption Proportion. Without this metric, MECO’s performance is reduced by 12%. MECO’s Wasted Efforts without this metric were 34.48%. The Wasted Effort also improved by 25% after replacing this in MECO. Finally, the fault localization precision, which was 0.182 without the Failed Execution Flag, increased to 0.191 when replacing it. This shows a percentage improvement of 5%; see Table 4.
MECO without Total Execution: MECO can localize 17% of faults at the top of the ranking list without the Total Execution metric. When this metric is replaced in MECO, its performance increases to 29%, a roughly 12% improvement. Similarly, MECO’s Wasted Effort without the Total Execution metric is 19.88%. This is improved to 9.03%, almost an 11% improvement when replaced in MECO’s formula. Finally, without this metric, MECO’s fault localization precision is 0.184, but increases to 0.191 when replaced. Therefore, after the Total Execution is replaced, MECO achieved a performance improvement of 12%, 11%, and 4% Accuracy, Wasted Effort, and Precision; see Table 4.
- RQ1 Summary:
The four metrics contribute differently to the effectiveness of the MECO formula. The Assumption Proportion and Fault Assumption metrics mainly contributed to the fault localization Accuracy and Precision of MECO, while the Failed Execution Flag metric mainly contributed to the Wasted Effort of MECO. Therefore, the Assumption Proportion and Fault Assumption metrics have the highest contribution to the effectiveness of the proposed formula, MECO.
5.2. The Performance Comparison of MECO and the Maximal Formulas
This section compares MECO with the other eighteen proven maximal formulas studied in fault localization. Table 1 shows the list of the compared formulas. Table 5 shows the overall performances in seeded faults of SIR (92-faults) and real faults, Chart (26-faults), Closure (133-faults), Lang (65-faults), Math (106-faults), and Time (27-faults). We report the Wasted Effort in percentage (%). Figure 1 shows the percentage of faults that each formula localized in each program benchmark. We calculated this as the total number of faults localized divided by the total number of faults in the evaluation dataset.
Table 5.
Performance comparison of the combined risk evaluation metrics with the standalone risk evaluation metrics in terms of Mean Average Precision and Wasted Effort.
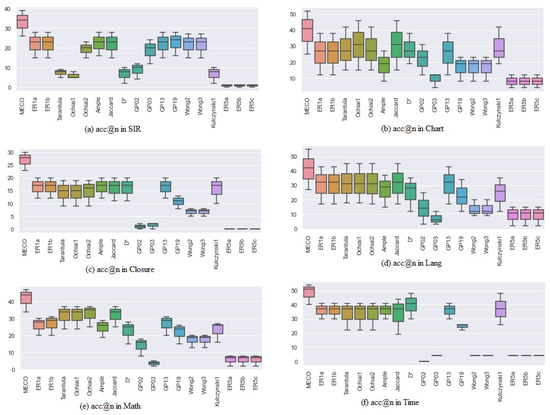
Figure 1.
(a) shows the boxplot of MECO and the compared formulas in terms of acc@n in the SIR dataset. (b) shows the same comparison in the Chart. (c) shows Closure, (d) in Lang, (e) in Math and (f) in Time.
5.2.1. Fault Localization Accuracy
In seeded faults, MECO ranked more faults, 26%, at the top 1 of the suspiciousness list, outperforming all other formulas. MECO also localized more faults, 39%, than all the existing metrics at the top 5 in the ranking list. None of the existing formulas placed more faults in the top-1 ranking list of the real fault program than MECO. When the average performance is taken across all the subject programs in this study, MECO accurately localizes 29%, 40%, and 46% at top 1, top 3, and top 5 of the ranking list, which is better than all the existing compared formulas; see Table 5.
5.2.2. Fault Localization Wasted Effort
Fault localization is helpful if it reduces the number of statements a developer encounters before locating the first fault. The wasted effort of the proposed MECO in seeded faults is 3.31%, Chart (11.51%), Closure (9.77%), Lang (3.08%), Math (13.62%), and Time (12.88), which outrightly outperformed all the existing formulas in real and seeded fault programs. On average, MECO outperformed the best existing formula, Ample, in terms of Wasted Effort, 7.2%, Table 5.
5.2.3. Fault Localization Precision
How a technique precisely localizes faults is very important in fault localization. The proposed MECO has a 20.9% MAP score in seeded faults, better than all the existing formulas. This performance shows that the proposed method can precisely localize seeded faults better than the existing maximal formulas. MECO and Kulczynski1 have the same precision values in the Chart program and are better than the other formulas. MECO outperformed all the existing formulas in the Closure and Lang projects, with MAP scores of 11.1% and 19.4%, respectively. Some maximal formulas, such as Tarantula, Ochiai1, Ochiai2, and Jaccard, outperformed the MECO formula in the Math program. Furthermore, and Kulczynski1 outperformed MECO in the Time program. The MECO formula is more precise at fault localization than all the compared existing formulas, 0.191, especially Jaccard, 0.184, which shows an outstanding performance in terms of Mean Average Precision on average of 3.8%; see Table 5.
- RQ2 summary:
The proposed formula can accurately and precisely localize faults and reduce the efforts of fault localization compared to all the existing maximal formulas in seeded and real faults. The MECO formula outperformed the best formula in terms of Wasted Effort, Ample, by an average of 7.2%. In terms of Mean Average Precision, MECO outperformed the best formula, Jaccard, on average 3.8%. MECO is more effective than all the compared existing formulas in this study on the average performance.
5.3. The Effects of the Defined Four Metrics on the Existing Formulas
We evaluated the possibility of combining Fault Assumption, Assumption Proportion, Failed Execution Flag, and Total Execution metrics with the existing formulas for fault localization. This is a simple combination, such that A is combined with B to localize fault, using a “+” sign, where A is the existing maximal metric and B is the utilized metric, such as Assumption Proportion, Fault Assumption, Failed Execution Flag, and Total Execution. We compared the performance of the studied formulas before and after combining the proposed metrics with them in terms of Wasted Effort, Mean Average Precision, and acc@n.
A point to note is that this study combines all the faults for this experiment (357 + 92) to make the datasets more complex. This is to assess the dynamic power of these metrics adequately. Table 6 shows the average improvements of each of the four metrics on the studied formulas in the datasets in terms of Wasted Efforts and Mean Average Precision. We report each metric’s improvement on MECO and its Wasted Efforts in percentage (%). Figure 2, on the other hand, shows the average improvement of the four metrics on the existing formulas in terms of fault localization accuracy. The number of faults placed at the top 1 of the ranking list is reported.
Table 6.
Mean Average Precision and Wasted Effort of the existing formulas with and without Assumption Proportion (P), Failed Execution Flag (F), Fault Assumption (A), and Total Execution (E) in seeded and real faults. PI: Percentage of Improvement. w/o: without metric. w/: with metric.
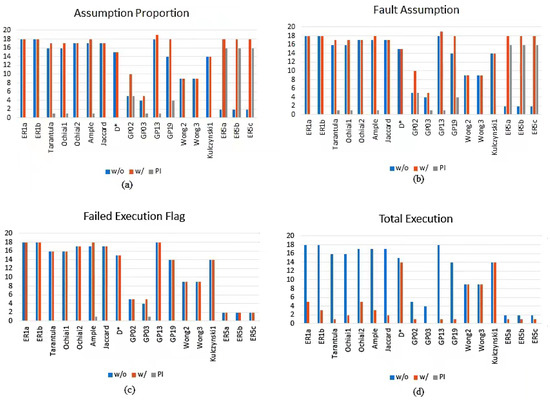
Figure 2.
Percentage of increase in the fault localization accuracy, acc@1, of the existing formulas with or without the proposed metrics: Assumption Proportion, Fault Assumption, Failed Execution Flag, and Total Execution. PI: Percentage of Improvement. w/o: without metric. w/: with metric. (a) the effect of Assumption on the existing maximal formula. (b) the effect of Fault Assumption. (c) the effect of Failed Execution Flag. (d) the effect of Total Execution.
5.3.1. The Improvements on Fault Localization Accuracy
Both the Assumption Proportion and Fault Assumption have the same noticeable improvement on the studied formulas. The noticing improvements can be observed in GP02 (5%), GP19 (4%), ER5a, ER5b, and ER5c (16%). There is no noticeable improvement in the fault localization accuracy of ER1a, Ochiai2, Jaccard, , Wong2, Wong3, and Kulczynski1. The Failed Execution Flag metric, on the other hand, only improved the Accuracy of Ample and GP02. Finally, the Total Execution metric did not increase the performance of any of the studied formulas.
5.3.2. The Improvements on Wasted Effort
On average, the Assumption Proportion and Fault Assumption improved the performance of all the studied maximal formulas, except Ochiai2, , Jaccard, and GP02. The Failed Execution Flag did not improve any of the studied formulas, while the Total Execution metric improved ER1a (3%) and ER5c (1%); see Table 6.
5.3.3. The Improvements on Fault Localization Precision
Assumption Proportion and Fault Assumption enhanced the fault localization precision of all the studied formulas, especially Tarantula (11.11%), Ochiai1 (11.11%), GP02 (41%), GP19 (27.22), ER5a, ER5b, and ER5c (77.77%). Both the Failed Execution Flag and Total Execution do not have any visible improvement in the Precision of the existing formulas.
Figure 3 shows the list of the existing formulas that the developers can combine with the proposed metrics for fault localization. Figure 3a–c show that the Assumption Proportion and Fault Assumption can be combined with eight existing formulas, Tarantula, Ochiai1, GP02, GP03, GP19, ER5a, ER5b, and ER5c, for fault localization. Furthermore, as the Failed Execution Flag can improve the performance of some formulas when combined with them, the Total Execution did not have any visible improvements on the studied maximal formulas.
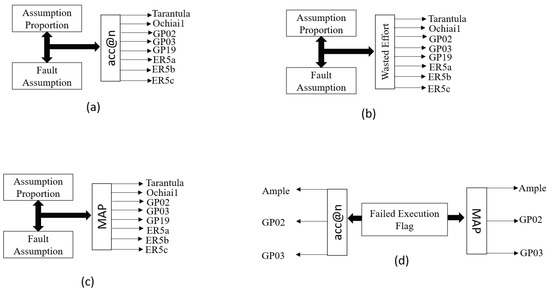
Figure 3.
The improvements of the defined metrics on the existing formulas. (a) the list of formulas that can be improved in terms of acc@n when combined with Fault Assumption or Assumption Proportion. (b) the list of formulas that Fault Assumption or Assumption Proportion can enhance their wasted effort. (c) the formulas that can be improved in terms of MAP when combined with Fault Assumption or Assumption Proportion. (d) the list of the formulas that Failed Execution Flag can enhance in terms of acc@n and MAP.
- Summary of RQ.3
Among the proposed metrics, only the Assumption Proportion and Fault Assumption have more improvement on the existing formulas. Combining these two metrics with some studied formulas can improve the Accuracy, Wasted Effort, and Precision of many state-of-the-art methods, such as Tarantula, Ochiai1, GP02, GP03, GP19, ER5a, ER5b, and ER5c. Therefore, they are good metrics to consider for fault localization.
5.4. Discussion
This study proposed a potent formula with a better fault localization ability. We first studied the coverage information of both seeded and real faults and discovered that the real faults possess a dynamic characteristic, in which the non-faulty statements have more fault-related attributes than the faulty ones, such as higher failed execution and lower passed execution. Furthermore, many non-faulty statements have the same number of failed execution test cases as the faulty ones, but lower passed non-execution test cases. However, many existing maximal formulas, such as ER1a, ER5a, Wong2, Ochiai1, Jaccard, , etc., do not consider these passed non-execution test cases, which can help break ties between the faulty and non-faulty statements with the same numbers of failed execution test cases. This situation limits the performance of the existing maximal formulas and does not help developers rank the faulty statements higher.
Therefore, this study utilized four metrics, Failed Execution Flag, Fault Assumption, Total Execution, and Assumption Proportion, which were subsequently combined to formulate a heuristic. These metrics were utilized to handle different problems that were discovered in the analysis of the program spectra, such as:
Zero failed execution values of the faulty statements: Many faulty statements in the real faults of the defects4j repository have no failed execution test cases. This situation was observed in multiple fault programs. Not all faults are located in a single block, but it may be difficult to localize a fault not covered by any failed test cases. In this situation, many existing maximal formulas are not effective in localizing this type of fault. Therefore, we utilized Fault Assumption and Assumption Proportion to localize this type of fault. The Fault Assumption metric adds the values of failed execution test cases to the passed non-execution test cases, while Assumption Proportion takes the proportion of Fault Assumption, which divides Fault Assumption by the total test cases.
Lower failed execution of the faulty statement: In the real-faults subject programs, some faults have lower failed execution values than the non-faulty statements. Many existing maximal formulas might find distinguishing faulty from non-faulty statements difficult. Therefore, we utilized Failed Execution Flag, which converts failed execution values of each statement covered by one or more failed execution to one. By virtue of this, if the faulty statements have more passed non-execution values than the non-faulty statements, the fault hidden in this situation can be exposed by this metric, using other values, such as passed non-execution values, to break the ties.
Faulty statement with higher passed execution: Close observation is given to the faulty statements with higher passing execution. Higher passed execution of a faulty statement cannot help localize such a statement. However, combining passed execution values with the failed execution value can, one way or the other, help to localize some faults. Therefore, we utilized Total Execution, which is the addition of passed and failed executions to localize faults.
This study subsequently combined the above-discussed metrics to propose a new heuristic, MECO, for effective fault localization. MECO was compared with the 18 existing maximal metrics to determine its effectiveness for fault localization. Before this comparison, an experiment was performed to determine which metrics contribute more to MECO’s effectiveness. This was achieved by computing the acc@n, Wasted Efforts, and Mean Average Precision of each metric. Furthermore, MECO’s effectiveness was observed without each metric by removing one metric at a time in the formula. This study showed that Fault Assumption and Assumption Proportion contribute more to MECO’s performance, especially its Accuracy and Precision. This study further suggests that each metric is individually poor at fault localization, but is effective when combined. Although Fault Assumption and Assumption Proportion are the major backbones of MECO, combining these two metrics is not effective without the other two metrics.
On the other hand, MECO is more effective than all the existing formulas. It outperformed all the existing maximal formulas in the evaluation metrics used in this study. On average performance, MECO outperformed the best formula in terms of Wasted Effort, Ample, with an average of 7.2%. In terms of Mean Average Precision, MECO outperformed the best formula, Jaccard, on average 3.8%. In terms of fault localization accuracy, MECO outperformed some formulas with the same performance, ER1a, ER1b, Ochiai2, Ample, and GP13, which is better than all the existing formulas with an average of 11%.
Finally, we combined each proposed metric with the existing studied formulas to determine if these metrics can be combined with the existing maximal formulas. This shows that only two of the utilized metrics, Fault Assumption and Assumption Proportion, improved the fault localization accuracy and Precision of some existing formulas, such as Tarantula, Ochiai1, GP02, GP03, GP19, ER5a, ER5b, and ER5c. Therefore, these two proposed metrics can be combined with the existing formulas for effective fault localization.
6. Related Works
The formula is used in spectrum-based fault localization to transform the spectrum of program statements into their likelihood of being faulty. As a result, the search for the optimum formulas and Machine Learning approach is part of the dimensions of enhancing the spectrum-based fault localization. Many studies have been conducted to find or build the most effective strategies in the form of formulas and models for fault localization. We separate the related work into three categories: Machine Learning, formulas created by humans, and formulas created using algorithms.
Human-designed formulas: Wong et al. [36] presented three different versions of Wong formulas, Wong1, Wong2, and Wong3. In Abreu et al. [5], the authors introduced the Ochiai formula used in molecular biology in Spectrum-based fault localization. The Ochiai formula also has other versions, Ochiai1 and Ochiai2, widely studied and used in Spectrum-based fault localization. Naish et al. [7] also empirically studied the effectiveness of the existing formulas and proposed two new metrics called OP1 and OP2 to support Spectrum-based fault localization. These two formulas were later classified under ER (ER1a and ER1b) and are among the existing maximal formulas. The formula was introduced as a modified version of the Kulczynski1 formula, which intuitively indicates that each statement’s execution traces via test cases might be interpreted as an execution pattern [40]. As a result, the similarity between statements more frequently executed in failing test cases can be used to identify the faulty ones.
Contrary to the previous works that introduced new formulas in Spectrum-based fault localization, Lucia et al. [18] investigated the efficacy of 40 association measures proposed in data mining and quantified the strength of a relationship between two variables for fault localization. They adopted these association formulas in the context of fault localization to assess the strength of the link between program execution and program failures. They found that no single measure is best in all circumstances, but that numerous association measures outperform maximal formulas. In essence, the major purpose of this research is to discover the best-performing measures for Spectrum-based fault localization and also find the highest performing formulas that have been the bourne of Spectrum-based fault localization.
However, the proposed formula in this paper is differentiated from the existing formulas by utilizing Assumption Proportion, Fault Assumption, Total Execution, and Failed Execution Flag. These combined metrics effectively localized more faults in real and seeded faults.
Algorithm-designed formulas: Many researchers also have produced optimized formulas with the help of algorithms, which is different from our study. However, the proposed algorithm-designed formulas have been studied in the literature. Yoo used Genetic Programming (GP) to evolve formulas for Spectrum-based fault localization to compete with the human design metrics [37]. Indeed, 6 of the 30 GP-evolved formulas outperformed the literature’s studied maximal formulas. Similarly, Ajibode et al. used Genetic Programming to evolve formulas where 20 of the 30 metrics outperformed maximal formulas [2]. Another study related to an algorithm-designed study utilized multi-objective GP to improve fault localization [45]. Multi-objective GP was also embedded into the FLUCC model, designed by Sohn and Yoo [23], to rank the faulty elements.
Machine Learning: Other methods, such as Machine Learning methods, have been used in Spectrum-based fault localization. Recently, a method for learning a ranking model using several fault localization sources has been presented. Xuan and Monperrus used linear weights to aggregate scores from various SBFL models [12]. Le et al. learned ranking models from various SBFL scores, as well as invariant violation characteristics using rankSVM [24]. Sohn and Yoo [23] learned ranking models from SBFL scores and program change measures, using rankSVM and GP. Finally, Kim et al. introduced the PRecise machINe-learning-based fault loCalization tEchnique (PRINCE), a unique learn-to-rank fault localization technique that uses Genetic Programming (GP) to combine several sets of previously researched localization input features [25]. This study proposed some metrics that can be combined with the existing formulas to train other Machine Learning algorithms for effective fault localization.
Note that the proposed Assumption Proportion method in the context of this study is different from the Barinel [46] and ER5b [24] formulas. The dichotomy of Failed Execution and total test cases made up Barinel. Furthermore, Failed Execution and Total Execution made up ER5b, which opposes the Fault Assumption and total test cases that made up Assumption Proportion in our study.
7. Threats to Validity
We describe the risks that empirical research faces regarding the validity of its findings and the steps we took to mitigate them. These threats to validity are divided into three groups:
- Internal validity: The degree to which the outcomes of empirical evaluations support the claims is internal validity, the data integrity of training, and test data.In our study, we chose statements as the granularity of fault localization rather than methods and blocks. Existing studies by Xu et al. investigated fault localization with blocks, and Steimann et al. [47,48], Xuan et al. [12,12], and Sohn et al. [23], addressed fault localization with methods in the C and Java programs. In our study, we used statements as our level of granularity, as has also been followed by Jones et al. [33], Abreu et al. [5], Kim et al. [25], and Naish et al. [7]. Given the program for methods, our study can easily be adapted to fault localization on methods without further modification.
- External validity: By design, the MECO method described in this paper depends on the subject program dataset and may not be generalizable. Many fault localization research’ results and findings are, in fact, not directly generalizable. However, we took a measure to mitigate this threat by experimenting on two different repository datasets (nine different programs in all) to evaluate our method extensively. We also ensured that the subject programs contain both real and seeded faults to determine if our method can be adapted to different types of faults and provide a high quality of fault localization effectiveness.
- Construct validity:The measure used to evaluate MECO’s performance poses a significant threat to construct validity. We mitigated this threat by reporting not only the commonly used Wasted Effort metric, which shows the percentages of a program that needs to be investigated, but also the Mean Average Precision and acc@n metrics, which show the absolute rank of a faulty statement, as proposed by Parnin and Orso [1].
8. Conclusions
An approach to help developers quickly localize faults with less cost is highly in demand in spectrum-based fault localization. Therefore, this paper first proposed the Fault Assumption, Total Execution, Failed Execution Flag, and Assumption Proportion metrics, which can be combined and also combined with other existing formulas for effective fault localization. Secondly, it presented MECO, a fault localization method that combines different metrics to automatically lead developers to the locations of the faults in a program. This study is the first to consider using different shortcomings in the program spectra to construct a simple formula for fault localization.
The proposed formula and the existing maximal formulas were evaluated on single and multiple real faults of the Defects4J dataset and seeded faults of the SIR dataset. The empirical evaluation showed that MECO is an effective fault localization method, placing an average of 107 of 357 real faults and 23 of 92 seeded faults at the top 1 of the ranking list. It further placed 171 of 357 real faults and 36 of 92 seeded faults within the top-5 places of the ranking list. This performance supersedes the existing maxima formulas’ performances.
Furthermore, the Assumption Proportion and Fault Assumption metrics can be combined with other existing formulas as they drastically improve the Wasted Effort and Precision of many existing maximal formulas. The general performance of the proposed formula in this study shows that it can be applied to other projects for effective fault localization.
The future works will regard using MECO on other large projects such as AspectJ. We also plan to compare MECO with other fault localization techniques using different coverage information types. Finally, we plan to optimize MECO’s performance using some optimization techniques such as particle swarm optimization [49] and gray wolf optimization [50] as used in [51,52].
Author Contributions
Conceptualization, A.A.; methodology, A.A.; software, A.A.; data curation, A.A., T.S. and K.S.; original draft preparation, A.A.; writing—review and editing, A.A., K.S. and T.S.; visualization, A.A.; funding acquisition, T.S. and Z.D. All authors have read and agreed to the published version of the manuscript.
Funding
This work was supported by the Zhejiang Provincial Natural Science Foundation of China under Grant No.LY22F020019, the Zhejiang Science and Technology Plan Project under Grant No.2022C01045, and the Natural Science Foundation of China under Grants 62132014 and 61101111.
Institutional Review Board Statement
Not applicable.
Informed Consent Statement
Not applicable.
Data Availability Statement
Not applicable.
Conflicts of Interest
The authors declare no conflict of interest.
References
- Parnin, C.; Orso, A. Are automated debugging techniques actually helping programmers? In Proceedings of the 2011 International Symposium on Software Testing and Analysis (ISSTA ’11). Association for Computing Machinery, Toronto, ON, Canada, 17–21 July 2011; pp. 199–209. [Google Scholar] [CrossRef]
- Ajibode, A.A.; Shu, T.; Ding, Z. Evolving Suspiciousness Metrics From Hybrid Data Set for Boosting a Spectrum Based Fault Localization. IEEE Access. 2020, 8, 198451–198467. [Google Scholar] [CrossRef]
- Dallmeier, V.; Lindig, C.; Zeller, A. Lightweight Defect Localization for Java. In ECOOP 2005—Object-Oriented Programming; Black, A.P., Ed.; Lecture Notes in Computer Science; Springer: Berlin/Heidelberg, Germany, 2005; Volume 3586, pp. 528–550. [Google Scholar] [CrossRef] [Green Version]
- Xie, X.; Chen, T.Y.; Kuo, F.C.; Xu, B. A theoretical analysis of the risk evaluation formulas for spectrum-based fault localization. ACM Trans. Softw. Eng. Methodol. (TOSEM) 2013, 22, 1–40. [Google Scholar] [CrossRef]
- Abreu, R.; Zoeteweij, P.; Van Gemund, A.J.C. On the accuracy of spectrum-based fault localization. In Proceedings of the Testing: Academic and Industrial Conference Practice and Research Techniques—MUTATION (TAICPART-MUTATION ’07), Windsor, UK, 10–14 September 2007; pp. 89–98. [Google Scholar]
- Harrold, M.J.; Rothermel, G.; Sayre, K.; Wu, R.; Yi, L. An empirical investigation of the relationship between spectra differences and regression faults. Softw. Test. Verif. Reliab. 2000, 10, 171–194. [Google Scholar] [CrossRef] [Green Version]
- Naish, L.; Lee, H.J.; Ramamohanarao, K. A model for spectra-based software diagnosis. ACM Trans. Softw. Eng. Methodol. (TOSEM). 2011, 20, 1–32. [Google Scholar] [CrossRef]
- Mao, X.; Lei, Y.; Dai, Z.; Qi, Y.; Wang, C. Slice-based statistical fault localization. J. Syst. Softw. 2014, 89, 51–62. [Google Scholar] [CrossRef]
- Agrawal, H.; Horgan, J.R.; London, S.; Wong, W.E. Fault localization using execution slices and dataflow tests. In Proceedings of the of Sixth International Symposium on Software Reliability Engineering, ISSRE’95, Toulouse, France, 24 October 1995; pp. 143–151. [Google Scholar]
- Renieres, M.; Reiss, S.P. Fault localization with nearest neighbor queries. In Proceedings of the 18th IEEE International Conference on Automated Software Engineering, Montreal, QC, Canada, 6 October 2003; pp. 30–39. [Google Scholar]
- Feng, M.; Gupta, R. Learning universal probabilistic models for fault localization. In Proceedings of the 9th ACM SIGPLAN-SIGSOFT Workshop on Program Analysis for Software Tools and Engineering, Toronto, ON, Canada, 5 June 2010; pp. 81–88. [Google Scholar]
- Xuan, J.; Monperrus, M. Learning to combine multiple ranking metrics for fault localization. In Proceedings of the 2014 IEEE International Conference on Software Maintenance and Evolution, Washington, DC, USA, 29 September 2014; pp. 191–200. [Google Scholar]
- Zhang, M.; Li, X.; Zhang, L.; Khurshid, S. Boosting spectrum-based fault localization using PageRank. In Proceedings of the 26th ACM SIGSOFT International Symposium on Software Testing and Analysis (ISSTA 2017), Association for Computing Machinery, New York, NY, USA, 10–14 July 2017; pp. 261–272. [Google Scholar] [CrossRef]
- He, H.; Ren, J.; Zhao, G.; He, H. Enhancing spectrum-based fault localization using fault influence propagation. IEEE Access. 2020, 8, 18497–18513. [Google Scholar] [CrossRef]
- Moon, S.; Kim, Y.; Kim, M.; Yoo, S. Ask the mutants: Mutating faulty programs for fault localization. In Proceedings of the 2014 IEEE Seventh International Conference on Software Testing, Verification and Validation, Cleveland, OH, USA, 31 March–4 April 2014; pp. 153–162. [Google Scholar]
- Papadakis, M.; Le Traon, Y. Using mutants to locate “unknown” faults. In Proceedings of the 2012 IEEE Fifth International Conference on Software Testing, Verification and Validation, Montreal, QC, Canada, 17–21 April 2012; pp. 691–700. [Google Scholar]
- Zhang, L.; Zhang, L.; Khurshid, S. Injecting mechanical faults to localize developer faults for evolving software. ACM SIGPLAN Not. 2013, 48, 765–784. [Google Scholar] [CrossRef]
- Lucia, L.; Lo, D.; Jiang, L.; Thung, F.; Budi, A. Extended comprehensive study of association measures for fault localization. J. Softw. Evol. Process 2014, 26, 172–219. [Google Scholar] [CrossRef] [Green Version]
- Wong, W.E.; Gao, R.; Li, Y.; Abreu, R.; Wotawa, F. A survey on software fault localization. IEEE Trans. Softw. Eng. 2016, 42, 707–740. [Google Scholar] [CrossRef] [Green Version]
- Chen, M.Y.; Kiciman, E.; Fratkin, E.; Fox, A.; Brewer, E. Pinpoint: Problem determination in large, dynamic internet services. In Proceedings of the International Conference on Dependable Systems and Networks, Washington, DC, USA, 23–26 June 2002; pp. 595–604. [Google Scholar]
- Ochiai, A. Zoogeographic studies on the soleoid fishes found in Japan and its neighbouring regions. Bull. Jpn. Soc. Sci. Fish. 1957, 22, 526–530. [Google Scholar] [CrossRef] [Green Version]
- Jones, J.A.; Harrold, M.J. Empirical Evaluation of the Tarantula Automatic Fault-Localization Technique. In Proceedings of the 20th IEEE/ACM International Conference on Automated Software Engineering, ASE ’05, Long Beach, CA, USA, 7–11 November 2005; pp. 273–282. [Google Scholar] [CrossRef] [Green Version]
- Sohn, J.; Yoo, S. Fluccs: Using code and change metrics to improve fault localization. In Proceedings of the 26th ACM SIGSOFT International Symposium on Software Testing and Analysis (ISSTA 2017), New York, NY, USA, 10–14 July 2017; pp. 273–283. [Google Scholar] [CrossRef]
- Le, T.D.B.; Lo, D.; Le Goues, C.; Grunske, L. A learning-to-rank based fault localization approach using likely invariants. In Proceedings of the 25th International Symposium on Software Testing and Analysis (ISSTA 2016), New York, NY, USA, 18–20 July 2016; pp. 177–188. [Google Scholar] [CrossRef]
- Kim, Y.; Mun, S.; Yoo, S.; Kim, M. Precise learn-to-rank fault localization using dynamic and static features of target programs. ACM Trans. Softw. Eng. Methodol. (TOSEM) 2019, 28, 1–34. [Google Scholar] [CrossRef]
- Chen, T.Y.; Xie, X.; Kuo, F.; Xu, B. A Revisit of a Theoretical Analysis on Spectrum-Based Fault Localization. In Proceedings of the 2015 IEEE 39th Annual Computer Software and Applications Conference, Taichung, Taiwan, 1–5 July 2015; Volume 1, pp. 17–22. [Google Scholar] [CrossRef]
- Baudry, B.; Fleurey, F.; Le Traon, Y. Improving test suites for efficient fault localization. In Proceedings of the 28th International Conference on Software Engineering, Shanghai China, 20–28 May 2006; pp. 82–91. [Google Scholar]
- Lee, H.J. Software Debugging Using Program Spectra. Ph.D. Thesis, The University of Melbourne, Victoria, Australia, 2011. [Google Scholar]
- Rothermel, G.; Elbaum, S.; Kinneer, A.; Do, H. Software-Artifact Infrastructure Repository. 2006. Available online: http://sir.unl.edu/portal (accessed on 10 December 2020).
- Just, R.; Jalali, D.; Ernst, M.D. Defects4J: A database of existing faults to enable controlled testing studies for Java programs. In Proceedings of the 2014 International Symposium on Software Testing and Analysis, San Jose, CA, USA, 21–25 July 2014; pp. 437–440. [Google Scholar]
- Yoo, S.; Xie, X.; Kuo, F.C.; Chen, T.Y.; Harman, M. Human competitiveness of genetic programming in spectrum-based fault localisation: Theoretical and empirical analysis. ACM Trans. Softw. Eng. Methodol. (TOSEM) 2017, 26, 1–30. [Google Scholar] [CrossRef]
- Wu, T.; Dong, Y.; Lau, M.F.; Ng, S.; Chen, T.Y.; Jiang, M. Performance Analysis of Maximal Risk Evaluation Formulas for Spectrum-Based Fault Localization. Appl. Sci. 2020, 10, 398. [Google Scholar] [CrossRef] [Green Version]
- Jones, J.A.; Harrold, M.J.; Stasko, J. Visualization of test information to assist fault localization. In Proceedings of the 24th International Conference on Software Engineering, Orlando, FL, USA, 19–25 May 2002; pp. 467–477. [Google Scholar]
- Dallmeier, V.; Lindig, C.; Zeller, A. Lightweight bug localization with AMPLE. In Proceedings of the Sixth International Symposium on Automated Analysis-Driven Debugging, Monterey, CA, USA, 19–21 September 2005; pp. 99–104. [Google Scholar]
- Wong, C.P.; Xiong, Y.; Zhang, H.; Hao, D.; Zhang, L.; Mei, H. Boosting bug-report-oriented fault localization with segmentation and stack-trace analysis. In Proceedings of the 2014 IEEE International Conference on Software Maintenance and Evolution, Washington, DC, USA, 29 September–3 October 2014; pp. 181–190. [Google Scholar]
- Wong, W.E.; Qi, Y.; Zhao, L.; Cai, K.Y. Effective fault localization using code coverage. In Proceedings of the 31st Annual International Computer Software and Applications Conference (COMPSAC 2007), Beijing, China, 24–27 July 2007; Volume 1, pp. 449–456. [Google Scholar]
- Yoo, S. Evolving human competitive spectra-based fault localisation techniques. In Proceedings of the International Symposium on Search Based Software Engineering, Riva del Garda, Italy, 28–30 September 2012; pp. 244–258. [Google Scholar]
- Choi, S.S.; Cha, S.H.; Tappert, C.C. A survey of binary similarity and distance measures. J. Syst. Cybern. Inform. 2010, 8, 43–48. [Google Scholar]
- Feyzi, F.; Parsa, S. A program slicing-based method for effective detection of coincidentally correct test cases. Computing 2018, 100, 927–969. [Google Scholar] [CrossRef]
- Wong, W.E.; Debroy, V.; Gao, R.; Li, Y. The DStar method for effective software fault localization. IEEE Trans. Reliab. 2013, 63, 290–308. [Google Scholar] [CrossRef]
- Cleve, H.; Zeller, A. Locating causes of program failures. In Proceedings of the 27th International Conference on Software Engineering, St. Louis, MO, USA, 15–21 May 2005; pp. 342–351. [Google Scholar]
- Abreu, R.; Zoeteweij, P.; Van Gemund, A.J.C. An evaluation of similarity coefficients for software fault localization. In Proceedings of the 2006 12th Pacific Rim International Symposium on Dependable Computing (PRDC’06), Riverside, CA, USA, 18–20 December 2006; pp. 39–46. [Google Scholar]
- Schütze, H.; Manning, C.D.; Raghavan, P. Introduction to Information Retrieval; Cambridge University Press: Cambridge, UK, 2008; Volume 39. [Google Scholar]
- Zhang, X.; Gupta, N.; Gupta, R. Locating faults through automated predicate switching. In Proceedings of the 28th International Conference on Software Engineering, Shanghai China, 20–28 May 2006; pp. 272–281. [Google Scholar]
- Choi, K.; Sohn, J.; Yoo, S. Learning fault localisation for both humans and machines using multi-objective GP. In Proceedings of the International Symposium on Search Based Software Engineering, Montpellier, France, 8–9 September 2018; pp. 349–355. [Google Scholar]
- Abreu, R.; Zoeteweij, P.; Van Gemund, A.J. Spectrum-based multiple fault localization. In Proceedings of the 2009 IEEE/ACM International Conference on Automated Software Engineering, Washington, DC, USA, 16–20 November 2009; pp. 88–99. [Google Scholar]
- Steimann, F.; Frenkel, M. Improving coverage-based localization of multiple faults using algorithms from integer linear programming. In Proceedings of the 2012 IEEE 23rd International Symposium on Software Reliability Engineering, Washington, DC, USA, 27–30 November 2012; pp. 121–130. [Google Scholar]
- Steimann, F.; Frenkel, M.; Abreu, R. Threats to the validity and value of empirical assessments of the accuracy of coverage-based fault locators. In Proceedings of the 2013 International Symposium on Software Testing and Analysis, Lugano, Switzerland, 15–20 July 2013; pp. 314–324. [Google Scholar]
- Poli, R.; Kennedy, J.; Blackwell, T. Particle swarm optimization. Swarm Intell. 2007, 1, 33–57. [Google Scholar] [CrossRef]
- Emary, E.; Zawbaa, H.M.; Grosan, C.; Hassenian, A.E. Feature subset selection approach by gray-wolf optimization. In Proceedings of the Afro-European Conference for Industrial Advancement, Villejuif, France, 9–11 September 2015; pp. 1–13. [Google Scholar]
- Lalbakhsh, A.; Afzal, M.U.; Esselle, K.P. Multiobjective particle swarm optimization to design a time-delay equalizer metasurface for an electromagnetic band-gap resonator antenna. IEEE Antennas Wirel. Propag. Lett. 2016, 16, 912–915. [Google Scholar] [CrossRef]
- Karami, A.; Roshani, G.H.; Nazemi, E.; Roshani, S. Enhancing the performance of a dual-energy gamma ray based three-phase flow meter with the help of grey wolf optimization algorithm. Flow Meas. Instrum. 2018, 64, 164–172. [Google Scholar] [CrossRef]
Publisher’s Note: MDPI stays neutral with regard to jurisdictional claims in published maps and institutional affiliations. |
© 2022 by the authors. Licensee MDPI, Basel, Switzerland. This article is an open access article distributed under the terms and conditions of the Creative Commons Attribution (CC BY) license (https://creativecommons.org/licenses/by/4.0/).