
The Research of “Products Rapidly Attracting Users” Based on the Fully Integrated Link Prediction Algorithm


Abstract
:1. Introduction
2. Link Prediction
3. New User Marketing and SDI
3.1. Product Marketing in Brand Community
3.2. SDI for Friend Recommendation
3.2.1. SDI Based on Microstructure
3.2.2. SDI Based on Macrostructure
- (a)
- CCND1
- (b) CCND2
- (c) CCND3
- (d) CCND4
4. FILPA
4.1. Algorithm Evaluation
4.2. NB for Screening the Best SDI
4.2.1. Discriminant Factors for the Best Indexes
- (a)
- Density of common neighbors
- (b) Social distance between the common neighbor and other nodes
4.2.2. NB Model
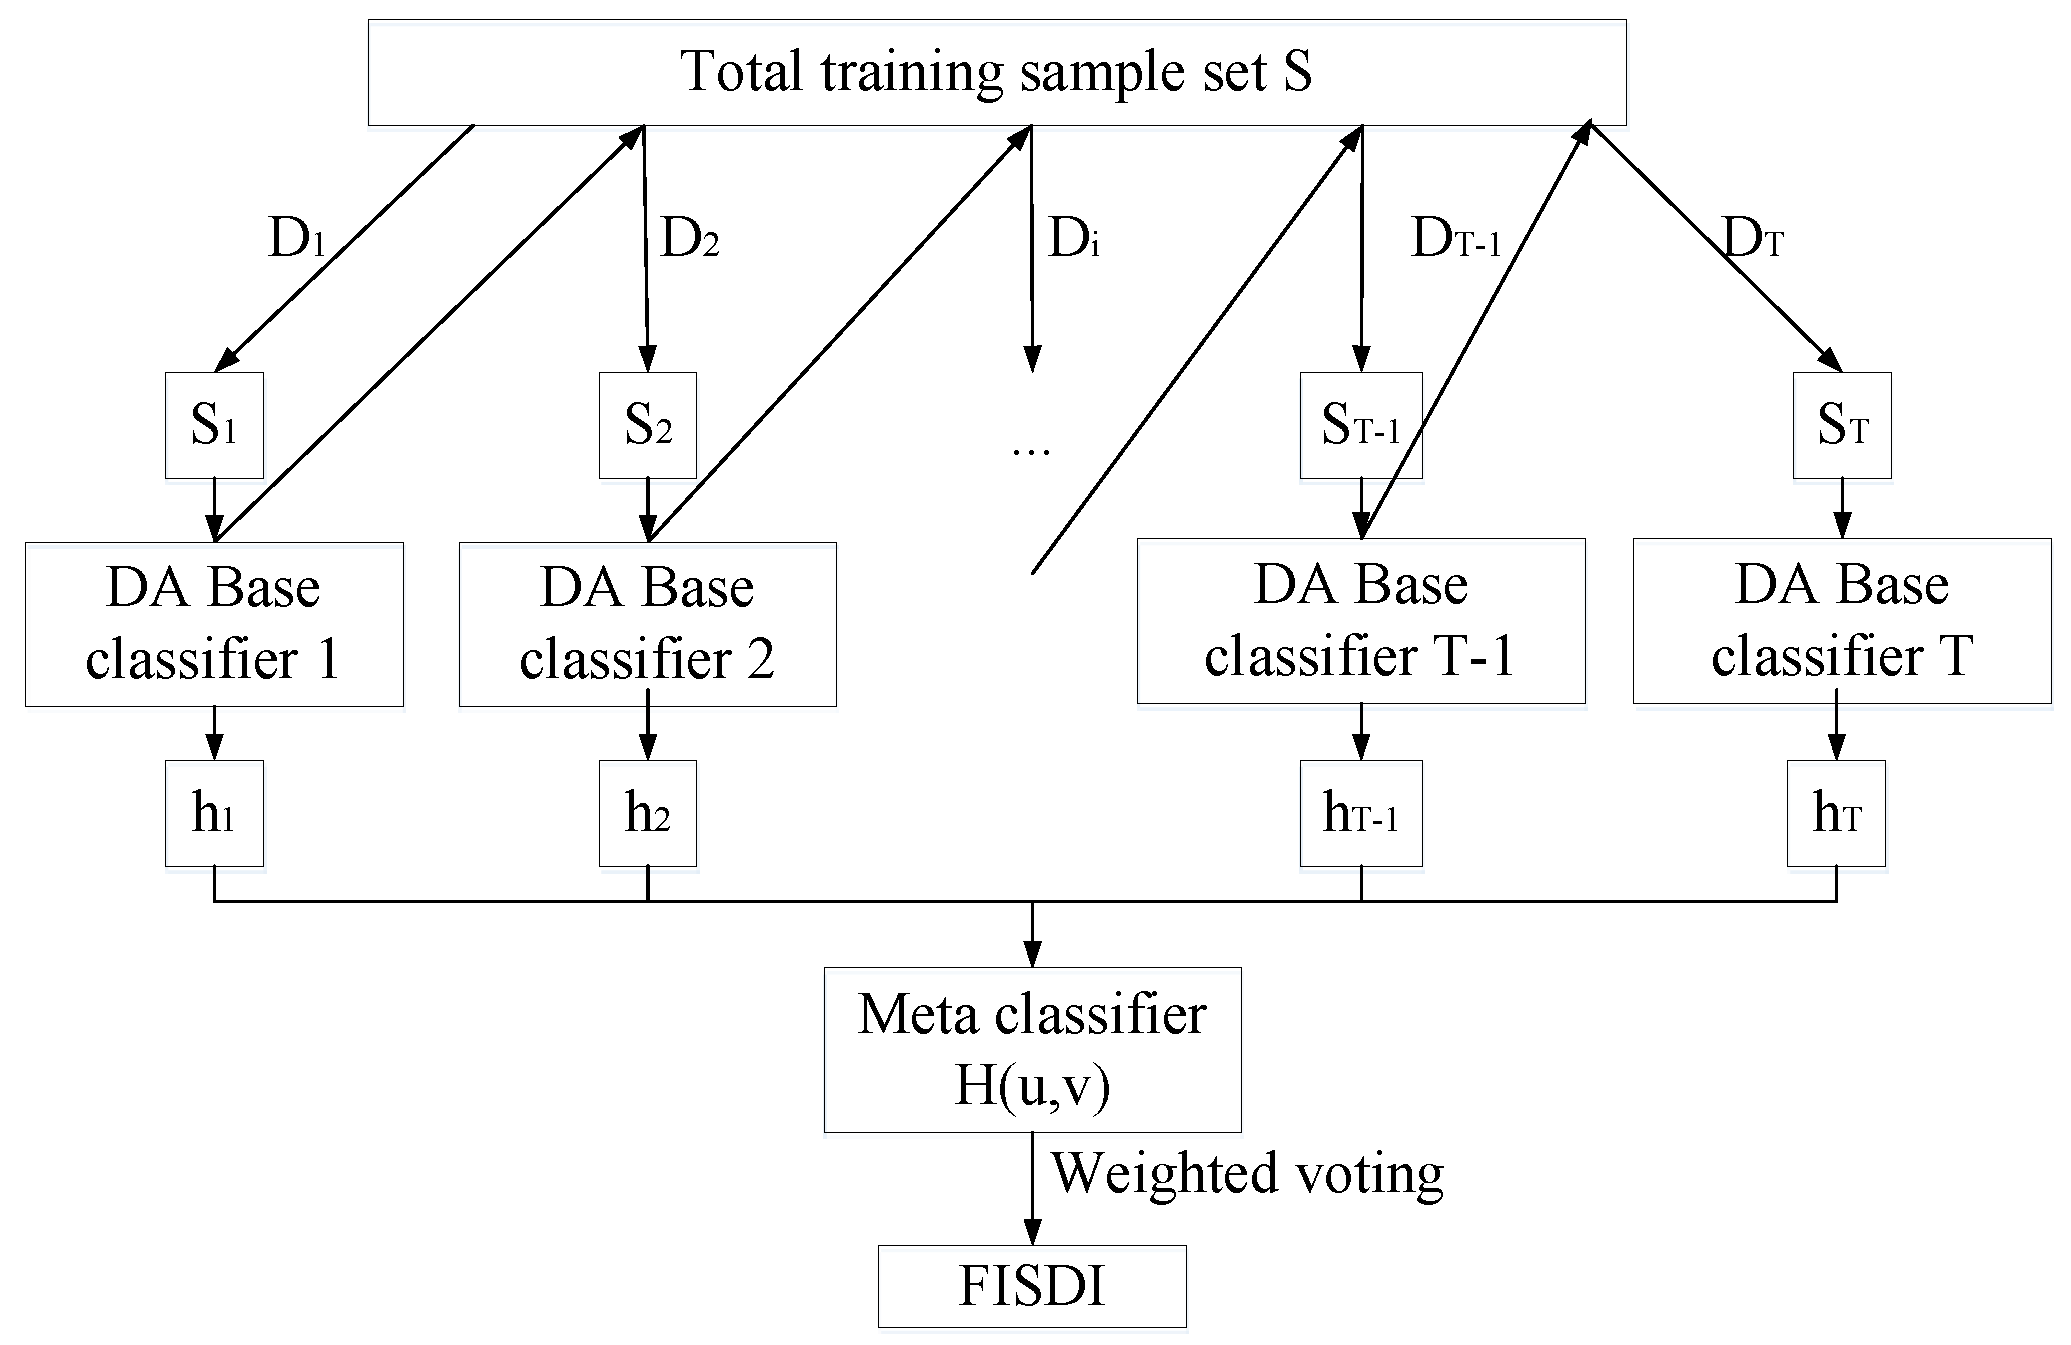
4.3. Identifying FISDI Based on AdaBoost Meta-Learning Strategy
4.3.1. Discriminates Factors of Fully Integrated Index
4.3.2. DA Base Classifier
4.3.3. AdaBoost Framework
4.4. High-Performance FISDI
5. Experiments and Results Analysis
5.1. Experimental Design
5.2. Performance Analysis of Algorithms
6. Conclusions
Author Contributions
Funding
Institutional Review Board Statement
Informed Consent Statement
Data Availability Statement
Acknowledgments
Conflicts of Interest
References
- Muniz, A.M.; O’guinn, T.C. Brand community. J. Consum. Res. 2001, 27, 412–432. [Google Scholar] [CrossRef]
- Kim, Y.A.; Ahmad, M.A. Trust, distrust and lack of confidence of users in online social media-sharing communities. Knowl.-Based Syst. 2013, 37, 438–450. [Google Scholar] [CrossRef]
- Liang, T.P.; Ho, Y.T.; Li, Y.W.; Turban, E. What drives social commerce: The role of social support and relationship quality. Int. J. Electron. Commer. 2011, 16, 69–90. [Google Scholar] [CrossRef] [Green Version]
- Shah, P.P.; Dirks, K.T.; Chervany, N. The multiple pathways of high performing groups: The interaction of social networks and group processes. J. Organ. Behav. 2006, 27, 299–317. [Google Scholar] [CrossRef]
- Rapp, A.; Beitelspacher, L.S.; Grewal, D.; Hughes, D.E. Understanding social media effects across seller, retailer, and consumer interactions. J. Acad. Mark. Sci. 2013, 41, 547–566. [Google Scholar] [CrossRef]
- Chang, H.H.; Chuang, S.S. Social capital and individual motivations on knowledge sharing: Participant involvement as a moderator. Inf. Manag. 2011, 48, 9–18. [Google Scholar] [CrossRef]
- Wang, X.; Yu, C.; Wei, Y. Social media peer communication and impacts on purchase intentions: A consumer socialization framework. J. Interact. Mark. 2012, 26, 198–208. [Google Scholar] [CrossRef]
- Xie, J.; Szymanski, B.K.; Liu, X. Slpa: Uncovering overlapping communities in social networks via a speaker-listener interaction dynamic process. In Proceedings of the IEEE 11th International Conference on Data Mining Workshops, Vancouver, BC, Canada, 11 December 2011; pp. 344–349. [Google Scholar] [CrossRef] [Green Version]
- Chen, D.; Lü, L.; Shang, M.S.; Zhang, Y.C.; Zhou, T. Identifying influential nodes in complex networks. Phys. A: Stat. Mech. Its Appl. 2012, 391, 1777–1787. [Google Scholar] [CrossRef] [Green Version]
- Gomes, H.M.; Barddal, J.P.; Enembreck, F.; Bifet, A. A survey on ensemble learning for data stream classification. ACM Comput. Surv. (CSUR) 2017, 50, 1–36. [Google Scholar] [CrossRef]
- Aziz, F.; Gul, H.; Uddin, I.; Gkoutos, G.V. Path-based extensions of local link prediction methods for complex networks. Sci. Rep. 2020, 10, 1–11. [Google Scholar] [CrossRef]
- Walker, S.K. Connected: The surprising power of our social networks and how they shape our lives. J. Fam. Theory Rev. 2011, 3, 220–224. [Google Scholar] [CrossRef]
- Martínez, V.; Berzal, F.; Cubero, J.C. A survey of link prediction in complex networks. ACM Comput. Surv. (CSUR) 2016, 49, 1–33. [Google Scholar] [CrossRef]
- Fan, X.; Chen, Z.; Cai, F.; Wu, J.; Liu, S.; Liao, Z.; Liao, Z. Local core members aided community structure detection. Mob. Netw. Appl. 2019, 24, 1373–1381. [Google Scholar] [CrossRef] [Green Version]
- Han, Q.; Wen, H.; Wu, J.; Ren, M. Rumor spreading and security monitoring in complex networks. Int. Conf. Comput. Soc. Netw. 2015, 9197, 48–59. [Google Scholar] [CrossRef]
- Lü, L.; Zhou, T. Link prediction in complex networks: A survey. Phys. A Stat. Mech. Its Appl. 2011, 390, 1150–1170. [Google Scholar] [CrossRef] [Green Version]
- Li, S.; Song, X.; Lu, H.; Zeng, L.; Shi, M.; Liu, F. Friend recommendation for cross marketing in online brand community based on intelligent attention allocation link prediction algorithm. Expert Syst. Appl. 2020, 139, 112839. [Google Scholar] [CrossRef]
- Katz, L. A new status index derived from sociometric analysis. Psychometrika 1953, 18, 39–43. [Google Scholar] [CrossRef]
- Rafiee, S.; Salavati, C.; Abdollahpouri, A. CNDP: Link prediction based on common neighbors degree penalization. Phys. A: Stat. Mech. Its Appl. 2020, 539, 122950. [Google Scholar] [CrossRef]
- Zareie, A.; Sakellariou, R. Similarity-based link prediction in social networks using latent relationships between the users. Sci. Rep. 2020, 10, 1–11. [Google Scholar] [CrossRef]
- Li, L.; Liu, X.; Chen, N.; Tian, H. Link prediction based on node centrality. Proc. Int. Conf. Inf. Technol. Electr. Eng. 2018, 17, 1–6. [Google Scholar] [CrossRef]
- Zhou, M.; Jin, H.; Wu, Q.; Xie, H.; Han, Q. Betweenness centrality-based community adaptive network representation for link prediction. Appl. Intell. 2022, 52, 3545–3558. [Google Scholar] [CrossRef]
- Iqbal, M.M.; Latha, K. An effective community-based link prediction model for improving accuracy in social networks. J. Intell. Fuzzy Syst. 2022, 42, 2695–2711. [Google Scholar] [CrossRef]
- Lu, M.; Wei, X.; Ye, D.; Dai, Y. A unified link prediction framework for predicting arbitrary relations in heterogeneous academic networks. IEEE Access 2019, 7, 124967–124987. [Google Scholar] [CrossRef]
- Ozcan, A.; Oguducu, S.G. Multivariate time series link prediction for evolving heterogeneous network. Int. J. Inf. Technol. Decis. Mak. 2019, 18, 241–286. [Google Scholar] [CrossRef] [Green Version]
- Hristova, D.; Noulas, A.; Brown, C.; Musolesi, M.; Mascolo, C. A multilayer approach to multiplexity and link prediction in online geo-social networks. EPJ Data Sci. 2016, 5, 24. [Google Scholar] [CrossRef] [Green Version]
- Ozcan, A.; Oguducu, S.G. Link prediction in evolving heterogeneous networks using the NARX neural networks. Knowl. Inf. Syst. 2018, 55, 333–360. [Google Scholar] [CrossRef]
- Lü, L.; Zhou, T. Link prediction in weighted networks: The role of weak ties. EPL (Europhys. Lett.) 2010, 89, 18001. [Google Scholar] [CrossRef] [Green Version]
- Liben-Nowell, D.; Kleinberg, J. The link-prediction problem for social networks. J. Am. Soc. Inf. Sci. Technol. 2007, 58, 1019–1031. [Google Scholar] [CrossRef] [Green Version]
- Wu, B.X.; Xiao, J. Potential friend recommendation based on user tagging. J. Comput. Appl. 2015, 35, 1663–1667. [Google Scholar] [CrossRef]
- Chen, B.; Hua, Y.; Yuan, Y.; Jin, Y. Link Prediction on Directed Networks Based on AUC Optimization. IEEE Access 2018, 6, 28122–28136. [Google Scholar] [CrossRef]
- Tichy, N.M.; Tushman, M.L.; Fombrun, C. Social network analysis for organizations. Acad. Manag. Rev. 1979, 4, 507–519. [Google Scholar] [CrossRef]
- Marsden, P.V. The reliability of network density and composition measures. Soc. Netw. 1993, 15, 399–421. [Google Scholar] [CrossRef]
- Bonacich, P. Some unique properties of eigenvector centrality. Soc. Netw. 2007, 29, 555–564. [Google Scholar] [CrossRef]
- Albert, R.; Barabási, A.L. Statistical mechanics of complex networks. Rev. Mod. Phys. 2002, 74, 47. [Google Scholar] [CrossRef] [Green Version]
- Palazon, M.; Sicilia, M.; Lopez, M. The influence of “Facebook friends” on the intention to join brand pages. J. Prod. Brand Manag. 2015, 24, 580–595. [Google Scholar] [CrossRef]


| SDI | Formula |
|---|---|
| CND0 | |
| CND1 | |
| CND2 | |
| CND3 | |
| CND4 |
| Statistical Indicators | |||
|---|---|---|---|
| Minimum | Mean | Maximum | |
| Number of nodes | 41 | 116.13 | 205 |
| Number of edges | 59 | 293.86 | 637 |
| Average degree | 2.48 | 4.89 | 8.48 |
| Average shortest path | 2.47 | 3.28 | 4.15 |
| Efficiency of network | 0.28 | 0.34 | 0.42 |
| Average node betweenness | 78.34 | 264.16 | 471.53 |
| Average edge betweenness | 31.67 | 78.68 | 138.67 |
| Average clustering coefficient | 0 | 0.11 | 0.38 |
| Assortativity coefficient | −0.77 | −0.27 | 0.11 |
| Degree heterogeneity | 5.04 | 15.51 | 36.28 |
| Network density | 0.03 | 0.04 | 0.08 |
| Centrality of mean eigenvector | 0.28 | 0.53 | 0.86 |
| Centrality of mean proximity | 0.25 | 1.21 | 8.26 |
| Scale of mean connected group | 20.50 | 91.98 | 205 |
| Algorithm Name | Parameters | Algorithm Name | Parameters | Algorithm Name | Parameters |
|---|---|---|---|---|---|
| CCND2a | α = 3 β = 8 | CCND4d | δ = 3 ε = 3 θ = 3 α = 8 β = 8 | CCND4k | δ = 3 ε = 8 θ = 3 α = 8 β = 3 |
| CCND2b | α = 3 β = 3 | CCND4e | δ = 8 ε = 3 θ = 3 α = 3 β = 8 | CCND4l | δ = 3 ε = 8 θ = 3 α = 8 β = 8 |
| CCND2c | α = 8 β = 3 | CCND4f | δ = 8 ε = 3 θ = 3 α = 3 β = 3 | CCND4m | δ = 3 ε = 3 θ = 8 α = 3 β = 8 |
| CCND2d | α= 8 β = 8 | CCND4g | δ = 8 ε = 3 θ = 3 α = 8 β = 3 | CCND4n | δ = 3 ε = 3 θ = 8 α = 3 β = 3 |
| CCND4a | δ = 3 θ = 3 α = 3 β =8 | CCND4h | δ = 8 ε = 3 θ = 3 α = 8 β = 8 | CCND4o | δ = 3 ε = 3 θ = 8 α = 8 β = 3 |
| CCND4b | δ = 3 ε = 3 θ = 3 α = 3 β = 3 | CCND4i | δ = 3 ε = 8 θ = 3 α = 3 β = 8 | CCND4p | δ = 3 ε = 3 θ = 8 α = 8 β = 8 |
| CCND4c | δ = 3 ε = 3 θ = 3 α = 8 β = 3 | CCND4j | δ = 3 ε = 8 θ = 3 α = 3 β = 3 |
| Algorithm name | Average AUC | Algorithm Name | Average AUC | Algorithm Name | Average AUC |
|---|---|---|---|---|---|
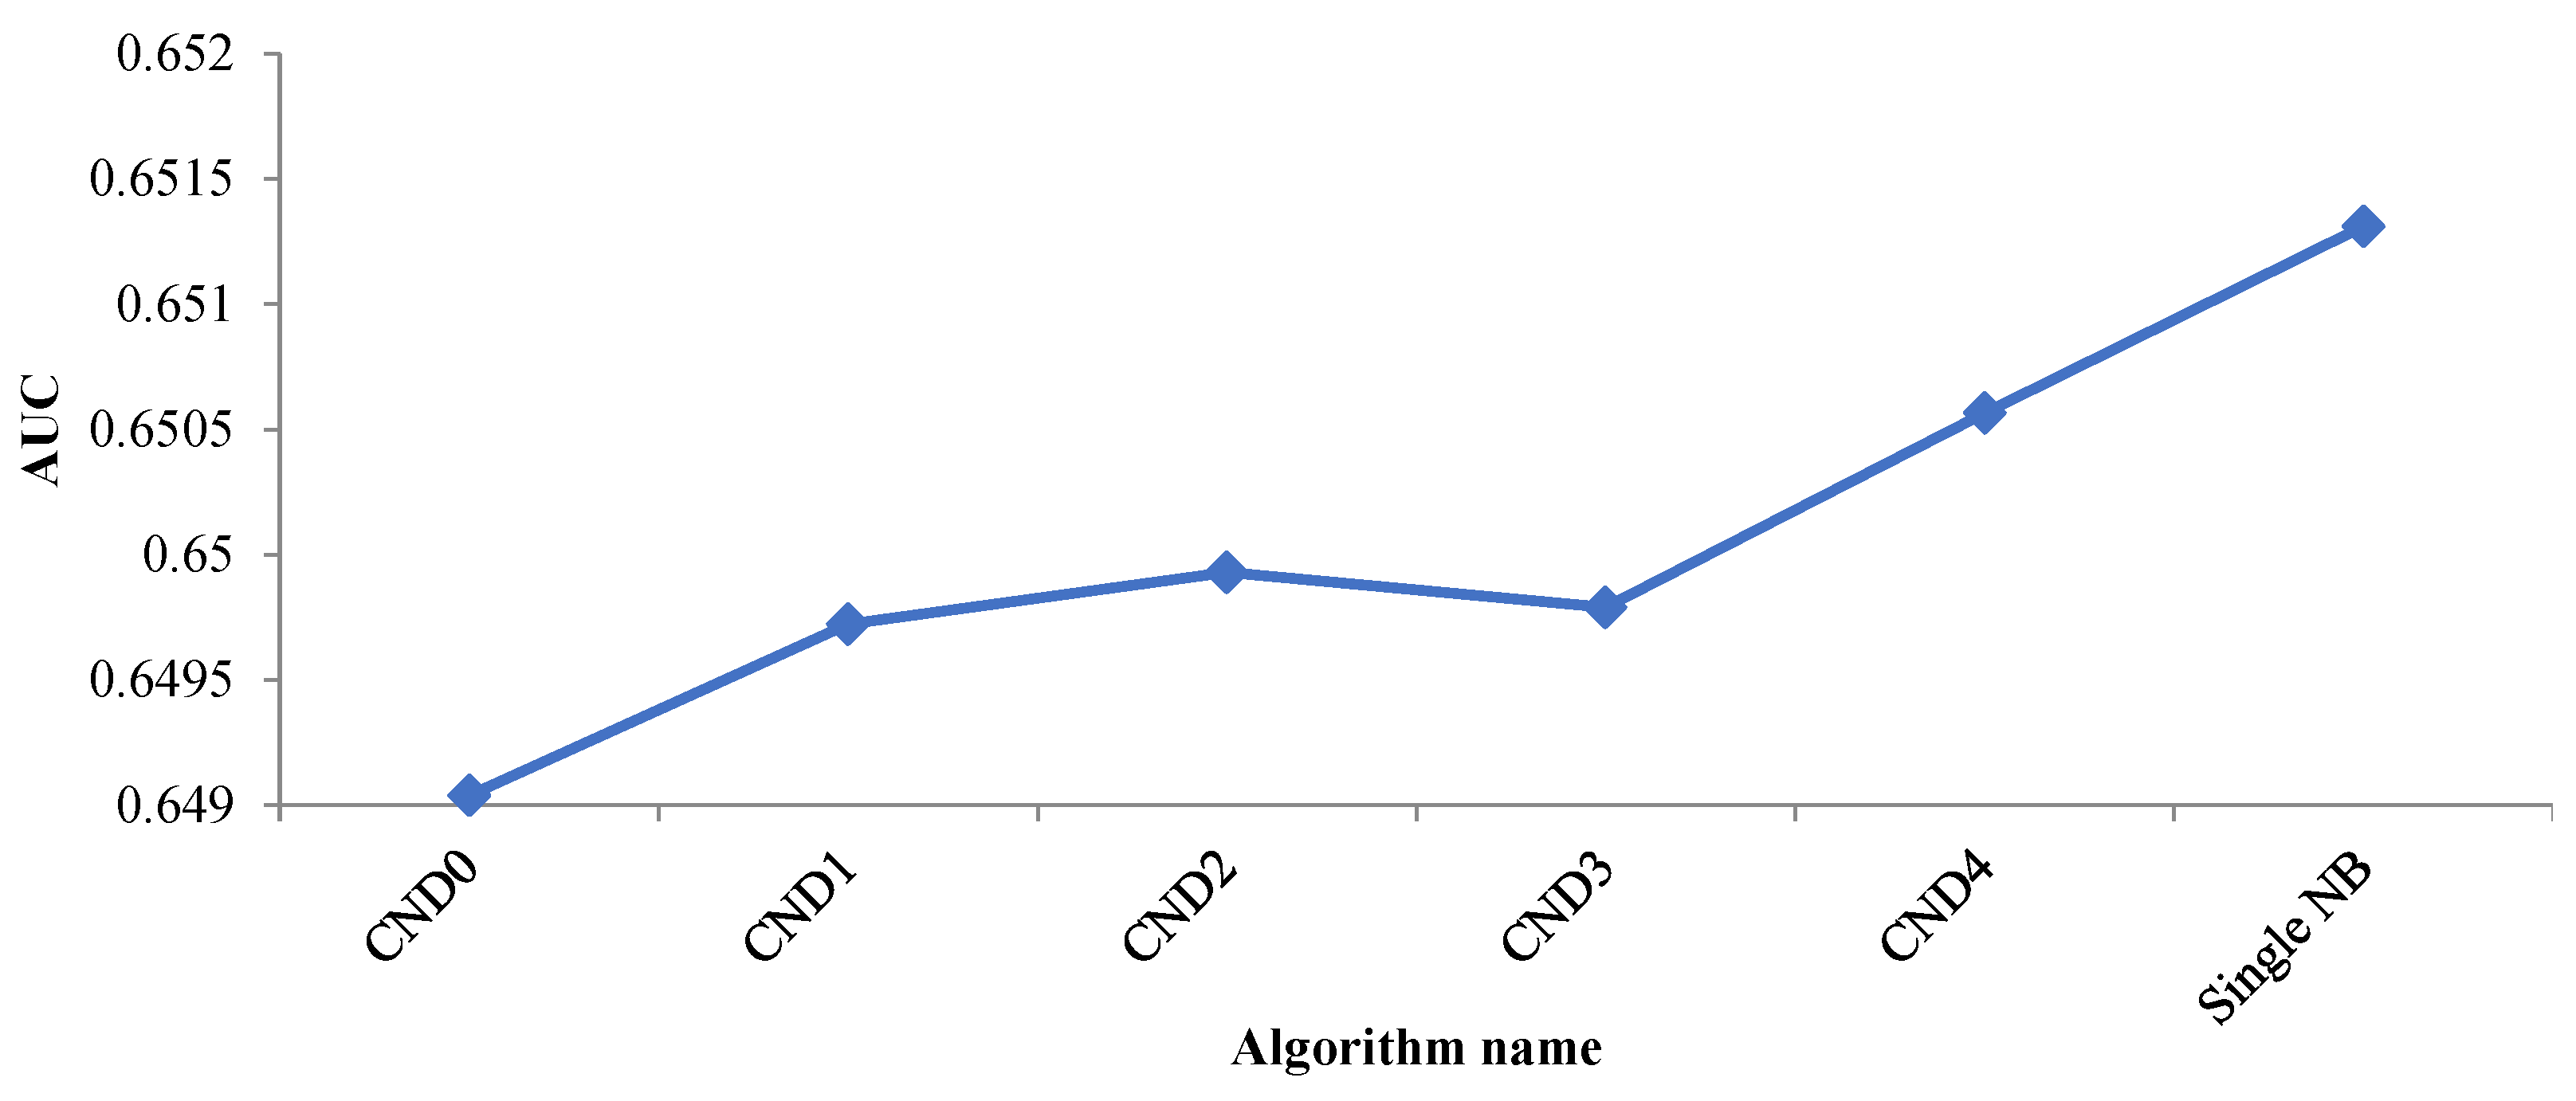
| CND0 | 0.6490383 | CCND3 | 0.6504578 | CCND4j | 0.6507415 |
| CND1 | 0.6497224 | CCND4a | 0.6503807 | CCND4k | 0.6513481 |
| CND2 | 0.6499278 | CCND4b | 0.6507177 | CCND4l | 0.6507386 |
| CND3 | 0.6497900 | CCND4c | 0.6512201 | CCND4m | 0.6504118 |
| CND4 | 0.65056450 | CCND4d | 0.6507350 | CCND4n | 0.6506732 |
| CCND1 | 0.65004691 | CCND4e | 0.6504217 | CCND4o | 0.6510824 |
| CCND2a | 0.65005695 | CCND4f | 0.6507004 | CCND4p | 0.6507198 |
| CCND2b | 0.65052006 | CCND4g | 0.6511380 | Single NB | 0.6513114 |
| CCND2c | 0.65127149 | CCND4h | 0.6507184 | FILPAa | 0.6647313 |
| CCND2d | 0.65054185 | CCND4i | 0.6502706 | FILPAb | 0.6647088 |
| Algorithm Name | Average AUC | Algorithm Name | Average AUC |
|---|---|---|---|
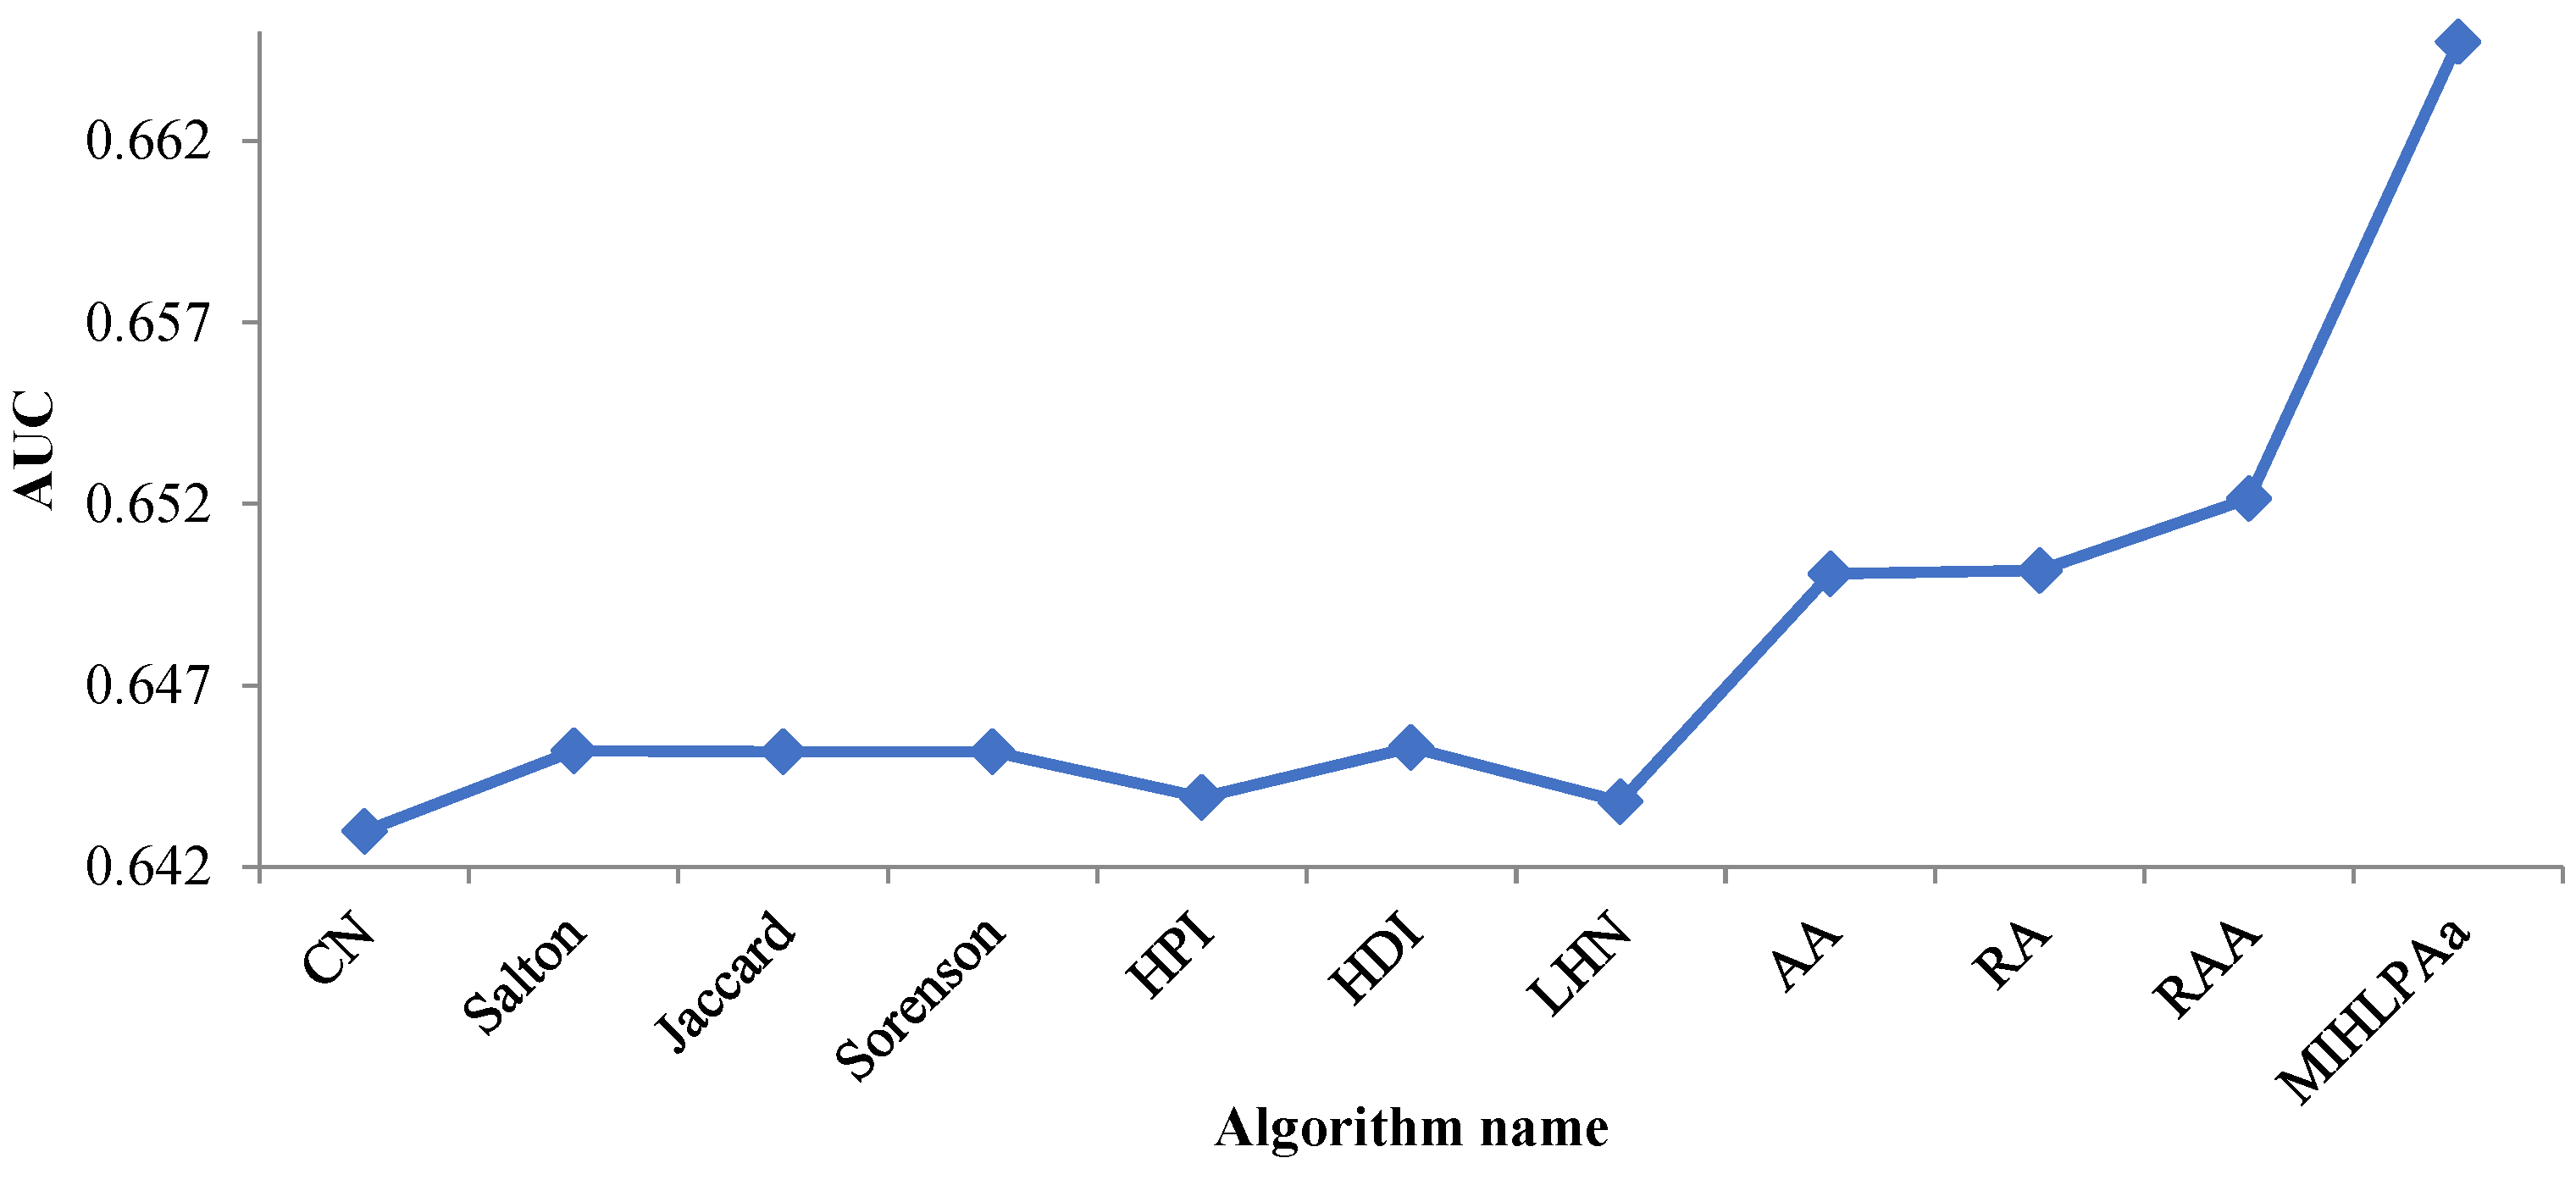
| FILPAa | 0.6647313 | HDI | 0.6452804 |
| CN | 0.6429730 | LHN | 0.6437872 |
| Salton | 0.6452023 | AA | 0.6500761 |
| Jaccard | 0.6451619 | RA | 0.6501544 |
| Sorenson | 0.6451657 | RAA | 0.6521583 |
| HPI | 0.6439117 |
| Algorithm Name | Average AUC | Algorithm Name | Average AUC |
|---|---|---|---|
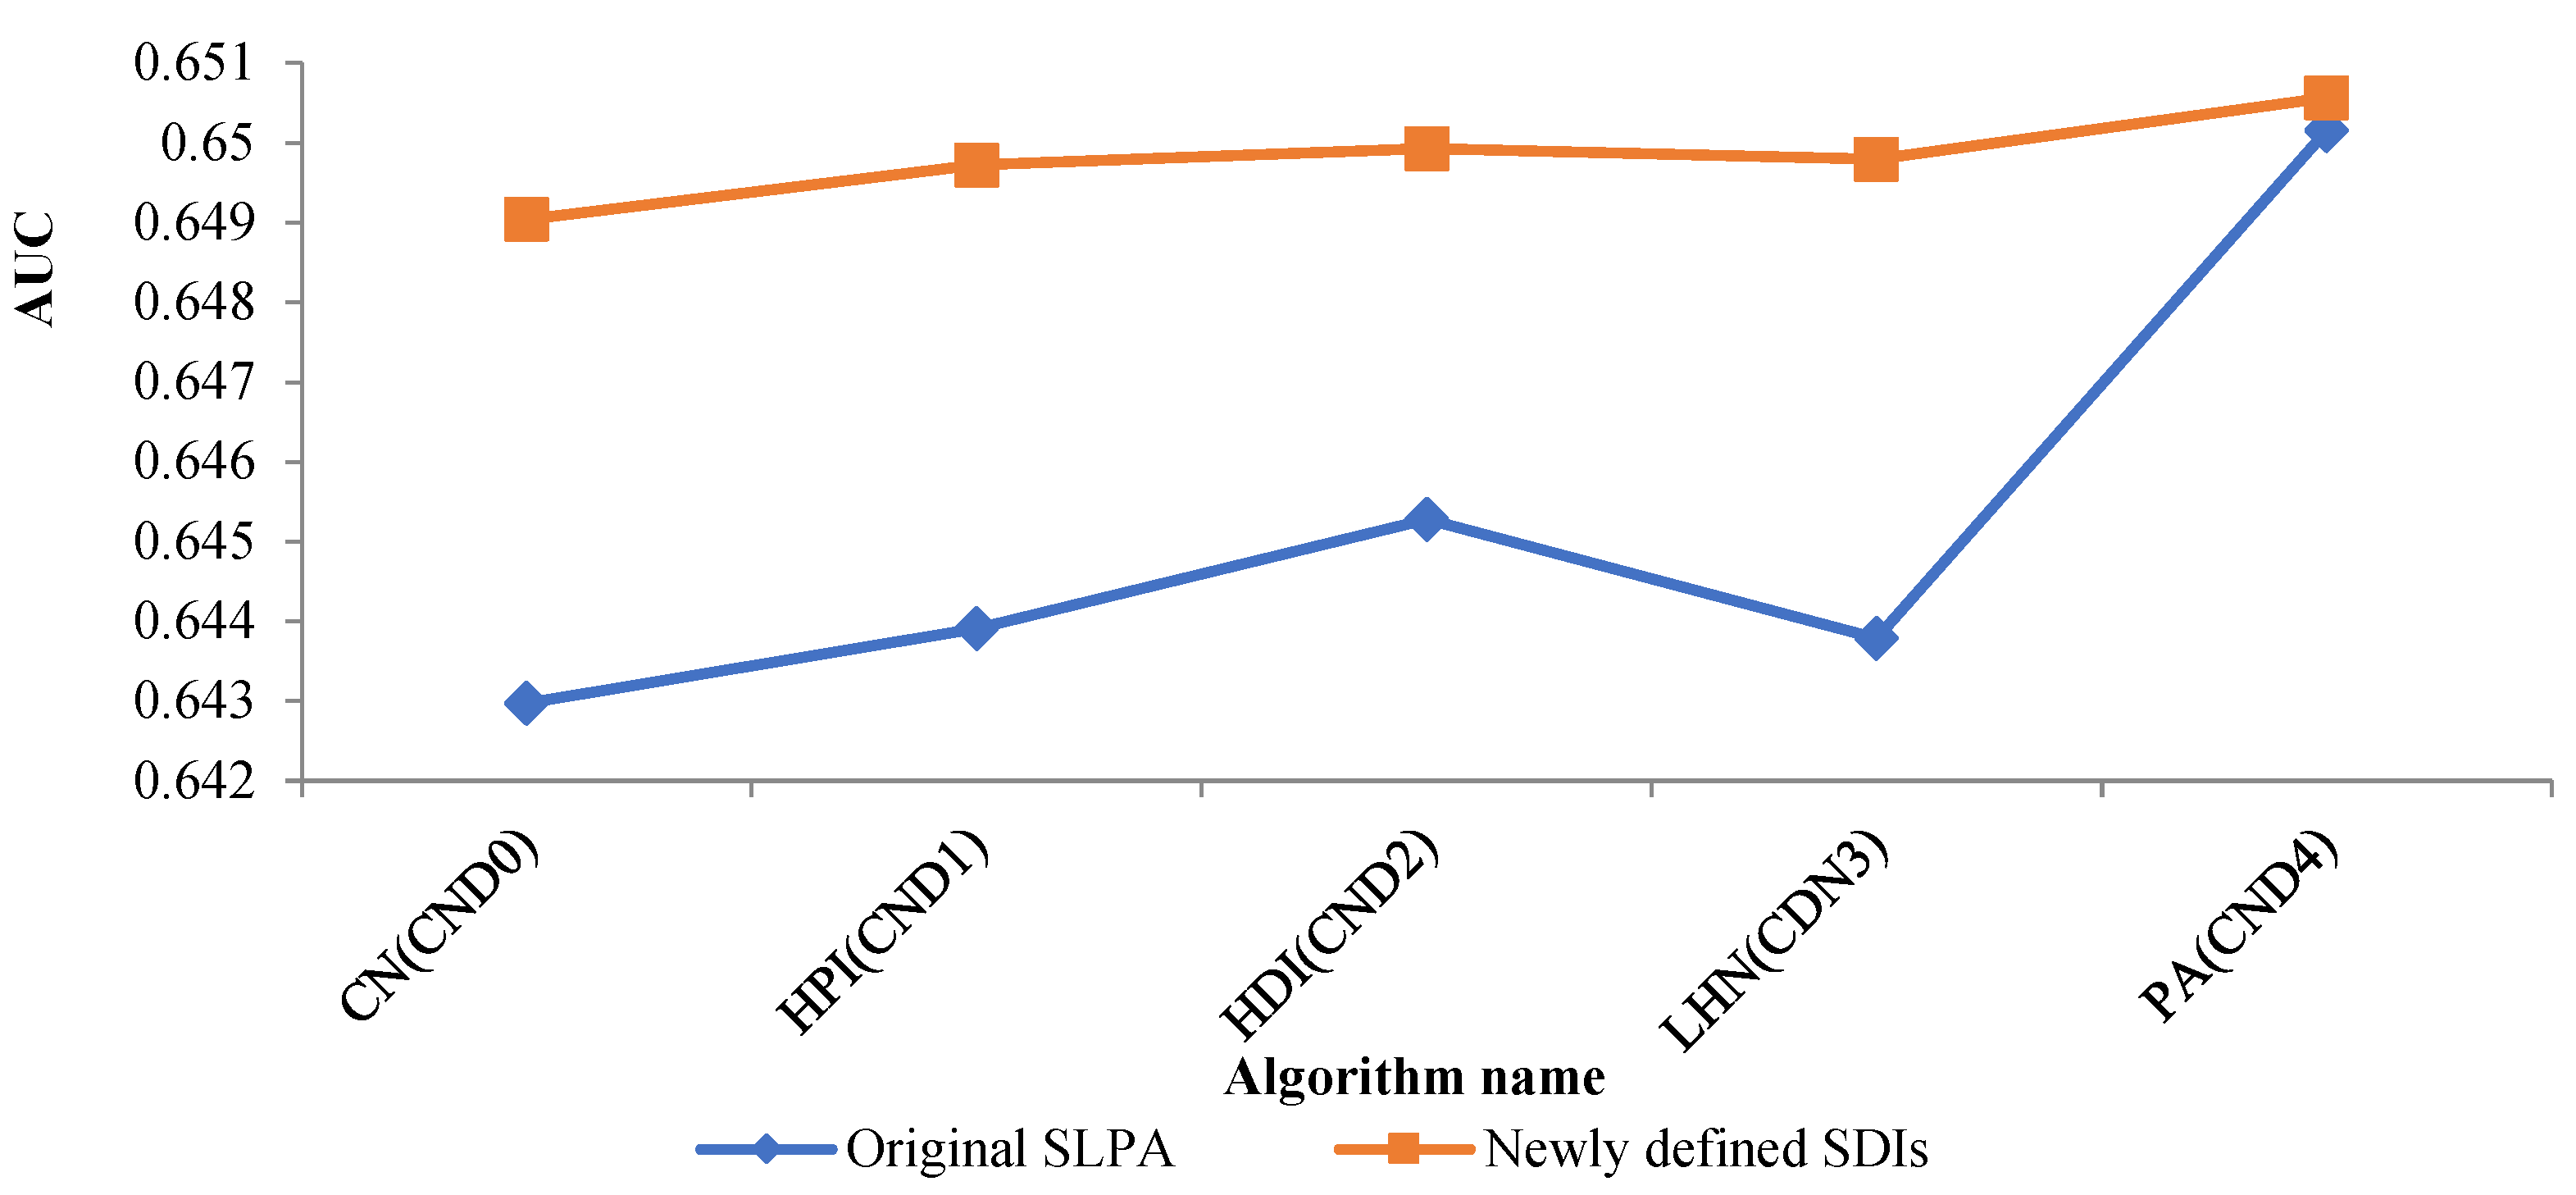
| CND0 | 0.6490383 | CN | 0.6429730 |
| CND1 | 0.6497224 | HPI | 0.6439117 |
| CND2 | 0.6499278 | HDI | 0.6452804 |
| CND3 | 0.6497900 | LHN | 0.6437872 |
| CND4 | 0.65056450 | RA | 0.6501544 |
Publisher’s Note: MDPI stays neutral with regard to jurisdictional claims in published maps and institutional affiliations. |
© 2022 by the authors. Licensee MDPI, Basel, Switzerland. This article is an open access article distributed under the terms and conditions of the Creative Commons Attribution (CC BY) license (https://creativecommons.org/licenses/by/4.0/).
Share and Cite
Li, S.; Wang, Z.; Zhang, B.; Zhu, B.; Wen, Z.; Yu, Z. The Research of “Products Rapidly Attracting Users” Based on the Fully Integrated Link Prediction Algorithm. Mathematics 2022, 10, 2424. https://doi.org/10.3390/math10142424
Li S, Wang Z, Zhang B, Zhu B, Wen Z, Yu Z. The Research of “Products Rapidly Attracting Users” Based on the Fully Integrated Link Prediction Algorithm. Mathematics. 2022; 10(14):2424. https://doi.org/10.3390/math10142424
Chicago/Turabian StyleLi, Shugang, Ziming Wang, Beiyan Zhang, Boyi Zhu, Zhifang Wen, and Zhaoxu Yu. 2022. "The Research of “Products Rapidly Attracting Users” Based on the Fully Integrated Link Prediction Algorithm" Mathematics 10, no. 14: 2424. https://doi.org/10.3390/math10142424
APA StyleLi, S., Wang, Z., Zhang, B., Zhu, B., Wen, Z., & Yu, Z. (2022). The Research of “Products Rapidly Attracting Users” Based on the Fully Integrated Link Prediction Algorithm. Mathematics, 10(14), 2424. https://doi.org/10.3390/math10142424