Article

A Framework of Global Credit-Scoring Modeling Using Outlier Detection and Machine Learning in a P2P Lending Platform

1
Department of Information Management, National Yunlin University of Science and Technology, Douliu 64002, Taiwan
2
Department of Finance, National Yunlin University of Science and Technology, Douliu 64002, Taiwan
3
Department of Electrical and Computer Engineering, Iowa State University, 2520 Osborn Drive, Ames, IA 50011, USA
*
Author to whom correspondence should be addressed.
Mathematics 2022, 10(13), 2282; https://doi.org/10.3390/math10132282
Submission received: 29 May 2022 / Revised: 20 June 2022 / Accepted: 27 June 2022 / Published: 29 June 2022
(This article belongs to the Special Issue Mathematics and Economic Modeling)

Abstract

:
A great challenge for credit-scoring models in online peer-to-peer (P2P) lending platforms is that credit-scoring models simply discard rejected applicants. This selective discard can lead to an inability to increase the number of potentially qualified applicants, ultimately affecting the revenue of the lending platform. One way to deal with this is to employ reject inference, a technique that infers the state of a rejected sample and incorporates the results into a credit-scoring model. The most popular approach to reject inference is to use a credit-scoring model built only on accepted samples to directly predict the status of rejected samples. However, the distribution of accepted samples in online P2P lending is different from the distribution of rejected samples, and the credit-scoring model on the original accepted sample may no longer apply. In addition, the acceptance sample may also include applicants who cannot repay the loan. If these applicants can be filtered out, the losses to the lending platform can also be reduced. Therefore, we propose a global credit-scoring model framework that combines multiple feature selection methods and classifiers to better evaluate the model after adding rejected samples. In addition, this study uses outlier detection methods to explore the internal relationships of all samples, which can delete outlier applicants in accepted samples or increase outlier applicants in rejected samples. Finally, this study uses four data samples and reject inference to construct four different credit-scoring models. The experimental results show that the credit-scoring model combining Pearson and random forest proposed in this study has significantly better accuracy and AUC than other scholars. Compared with previous studies, using outlier detection to remove outliers in loan acceptance samples and identify potentially creditworthy loan applicants from loan rejection samples is a good strategy. Furthermore, this study not only improves the accuracy of the credit-scoring model but also increases the number of lenders, which in turn increases the profitability of the lending platform.
MSC:
62R07; 68-04; 65Y04

1. Introduction

With the rapid development of the global economy and information technology, online credit loans have become a critical transaction channel in the market economy. The main job of financial institutions is to provide credit services to customers, as doing so can bring considerable profits [1]. However, due to insufficient credit-scoring information, there may be market failures in the credit market, and credit risk can have a considerable impact on the financial industry. Especially after the subprime mortgage crisis in 2008, both developed and developing countries suffered long-term damage that made them realize the need for the accurate assessment of the creditworthiness of loan applicants and other financial investments [2,3,4].
The rapid development of the credit industry has also brought many problems to banks. Customer credit defaults constantly appear, such as overdue loans, the inability of borrowers to repay, and malicious defaults, causing considerable losses to commercial banks [5]. In the era of big data and financial technology, efficient and accurate credit-scoring models are very important for banks and financial institutions because an accurate credit-scoring system can make loan decisions faster, effectively reduce the occurrence of credit risks, and thus reduce cost [6].
According to the Board of Governors of the Federal Reserve, as of February 2019, U.S. financial institutions had more than $4 trillion in consumer loan balances, and this number is still growing at an annual rate of more than 4%. In addition, according to a report by the China Banking Regulatory Commission, China’s non-performing loan ratio reached about 1.67% in 2015, and it is still growing. Since lenders may default, financial institutions may face significant financial losses if they do not use credit-scoring models to assess lenders’ creditworthiness [7].
Most credit-scoring models today use a sample of accepted loan applicants for analysis and exclude those who were rejected. However, credit models should be built based on complete information on all applicants. According to the Consumer Credit Access Expectations Survey conducted by the Federal Reserve Bank of New York (FRBNY), loan applicants are rejected three times as often as accepted. In Lending Club, one of the largest P2P (peer-to-peer) lending platforms in the world, more than 90% of loan applicants are rejected [8]. If only a sample of accepted loan applicants is used to create a credit-scoring model, there may be a problem of sample bias, leading to selection bias. This sample bias not only leads to bias in parameter estimates but also affects the outcome of credit-scoring and thus lender equity [9].
In recent years, many methods based on reject inference have emerged and been applied to the field of credit scoring. Common reject inference techniques include the Heckman model [10] and reclassification [11]. Among them, extrapolation and amplification [12] are commonly used reject inference techniques. Amplification is assigning all rejected samples to bad or good lenders with a given score, and the extrapolation rule is to use only the model based on the accepted sample of loan applicants and then apply that model directly to predict the status of the rejected sample.
In a previous study, Bücker et al. [13] showed that amplification impairs and does not improve the performance of credit-scoring models. Studies have also pointed out that extrapolation methods cannot improve the performance of credit-scoring models [14]. In addition, there is an important issue with the use of loan data from the Lending Club credit lending platform. The problem is that the variables of the accepted and rejected datasets are not consistent. Another problem is that the sample size of rejected loan applicants is much larger than the sample size of accepted loan applicants. This study argues that acceptable applicants may be implied in the sample of rejected loan applicants and the outliers found in the sample of rejected loan applicants may represent those acceptable loan applicants. Furthermore, an accepted sample of loan applicants may imply applicants who should be rejected, while outliers found in the sample represent applicants who should be rejected. Therefore, if the sample of loan applicants is handled more properly, it is possible to increase the number of lenders, and increasing the number of lenders can increase the revenue of the lending platform. Therefore, finding potential qualified applicants in the rejected sample to increase the number of lenders and improve the credit-scoring model is the main purpose of this study.
To address the above problems, this study proposes a global credit-scoring model framework that combines multiple feature-selection methods and classifiers to better evaluate the model after adding rejected samples. In addition, this study uses outlier detection methods to explore the internal relationships of all samples, which can delete outlier applicants in accepted samples or increase outlier applicants in rejected samples. At the same time, the credit-scoring model cannot reduce its performance by adding these potentially qualified applicants since the performance is essential for all stakeholders interested in the company’s direction [15,16]. Finally, this study uses four different samples and reject inference to evaluate their credit-scoring models.
This study hopes to experimentally demonstrate that it is feasible to exclude potentially unrepayable lenders from the accepted samples and select eligible applicants from the rejected samples.

2. Materials and Methods

2.1. Dataset

This study uses public data from the Lending Club online lending platform in the United States. There are samples of accepted loan applicants and samples of rejected loan applicants. The platform is currently the world’s largest P2P online lending platform. The platform has more than 3 million loan samples with a total value of over $50 billion. In the data for this study, a sample of 2,260,703 loan applicants were accepted, and 27,648,743 loan applicants were rejected. Variable descriptions of the rejected loan applicants and accepted loan applicants are shown in Table 1 and Table 2. Descriptive statistics are shown in Table 3.

2.2. Sample Split and Aggregation

The evaluation mechanism of the Lending Club decides whether to accept or reject a loan application based on the basic information from the loan applicant. This study argues that acceptable applicants may be implied in the sample of rejected loan applicants and that the outliers found in the sample of rejected loan applicants represent those acceptable loan applicants. Furthermore, an accepted sample of loan applicants may imply applicants who should be rejected, while outliers found in the sample represent applicants who should be rejected. Therefore, if the sample of loan applicants is handled properly, it is possible to increase the number of loan applicants, and increasing the number of lenders can increase the revenue of the lending platform. Therefore, according to this hypothesis, this study restructures all loan applicant samples using outlier detection and divides them into 4 sample groups (MD1, MD2, MD3, MD4), which are defined as follows:
MD1 = {AC}
MD2 = {AC} − {AO}
MD3 = {AC} + {RO}
MD4 = {AC} − {AO} + {RO}
where TL defines the sample of all loan applicants and {TL} = {AC} + {RJ}. AC defines the sample of loan applicants whose applications have been accepted. AO defines the sample of outliers of loan applicants whose applications have been accepted. RJ defines the sample of loan applicants whose applications for loans have been rejected. RO defines the sample of loan applicant outliers whose applications for loans have been rejected.
Next, this study will build credit-scoring models using different feature extraction methods and different classification methods and verify whether adding or removing outliers in reject inference affects the accuracy of the credit-scoring model.

2.3. Global Credit-Scoring Modeling Framework

The global credit-scoring framework in this study is shown in Figure 1. First, as described in Section 2.2, all loan applicant samples are regrouped through an isolation forest to detect outliers and divided into 4 sample groups (MD1, MD2, MD3, and MD4). Three feature extraction methods, Pearson, information gain, and gain ratio, are used to select the best features in these four sample groups. Then, all the credit-scoring models are trained using three classification methods: random forest, naive Bayesian, and logistic regression. In addition, this study refers to the research method of Li et al. [8], who divide the samples into a training set and a testing set according to the ratio of 70% and 30%. The testing set is evaluated by three evaluation metrics: the accuracy rate of the credit-scoring model, AUC, and F-score.

2.4. Data Preprocessing

To facilitate comparison with previous studies, the sampling range of this study was four years, from January 2009 to December 2012. A major problem with loan data is that the variables for the acceptance and rejection datasets are inconsistent. The loan applicants accept data set has 28 variables, whereas the loan applicants reject data set only has 5 variables (loan amount, FICO score, debt–income ratio (DTI), address, and employment time). Most previous research on reject inference has only used five variables in the rejection dataset to build credit-scoring models. However, there are still arguments if only five variables are used to build credit-scoring models. Therefore, this study proposes the method of supplementing missing values, using these five variables to find the variable values of similar samples in the acceptance dataset. The imputation method of missing values in this study refers to the research of Troyanskaya et al. [17] using the k-nearest neighbor imputation method. The k-nearest neighbor imputation method uses the original value of the sample to find similar adjacent values of similar samples in another dataset, estimates the missing value data [18], and finally uses the complimentary sample data to build a credit-scoring model.

2.5. Outlier Detection

This study draws on the practice of Xia et al. [19] and uses the isolated forest method for outlier detection. The number of samples in the Lending Club is quite large. The main feature of the isolated forest is that the amount of calculation is small, and it can be trained and calculated in a distributed manner. It is suitable for outlier detection in large data volumes. Therefore, this study uses the isolation forest algorithm to detect outliers in the accepted and rejected data. The number of relevant samples and the detection results of outliers are shown in Table 4.

2.6. Feature Extraction

In the related research on credit scoring, most researchers use feature extraction methods to build credit models and then use different machine learning classifiers for comparative analysis to find better combinations to improve model performance [20]. There are also studies based on the accuracy of ROC and logistic regression methods, combining different voting types to find the best results [21].
Three feature extraction methods were used in this study: Pearson, information gain (IG), and gain ratio (GR). The calculation of the Pearson correlation coefficient is fast and convenient. Through the Pearson correlation coefficient, the variables related to the credit score can be found from the variables of the loan data, so that the model can be more accurately evaluated. Referring to Trivedi [20], this study applies information gain (IG) and gain ratio (GR) as well to feature extraction for the credit-scoring models. Information gain (IG) is widely used with high-dimensional data to measure the effectiveness of features in classification. There is a problem with information acquisition. It will tend to select higher-valued features even when there is less information. However, using information gain in select features can improve this problem. This study uses these three feature-extraction methods to perform feature extraction on four sample groups (MD1, MD2, MD3, MD4). The most important features of each sample group are shown in Table 5. As can be seen from Table 5, the execution results of the three feature-extraction methods are quite different.

2.7. Classifier and Performance Metrics

This study uses naive Bayesian (NB), logistic regression (LR), and random forest (RF) for classification. Naive Bayesian has stable classification efficiency, while random forest can produce classifiers with high accuracy, and logistic regression is a discriminative method widely used in machine learning algorithms. It can estimate the probability of belonging to a certain class and use it to explain the relationships between variables. In order to evaluate the effectiveness of the established credit-scoring model, this study uses three evaluation metrics, which are accuracy rate (ACC), F-score, and AUC.

3. Results

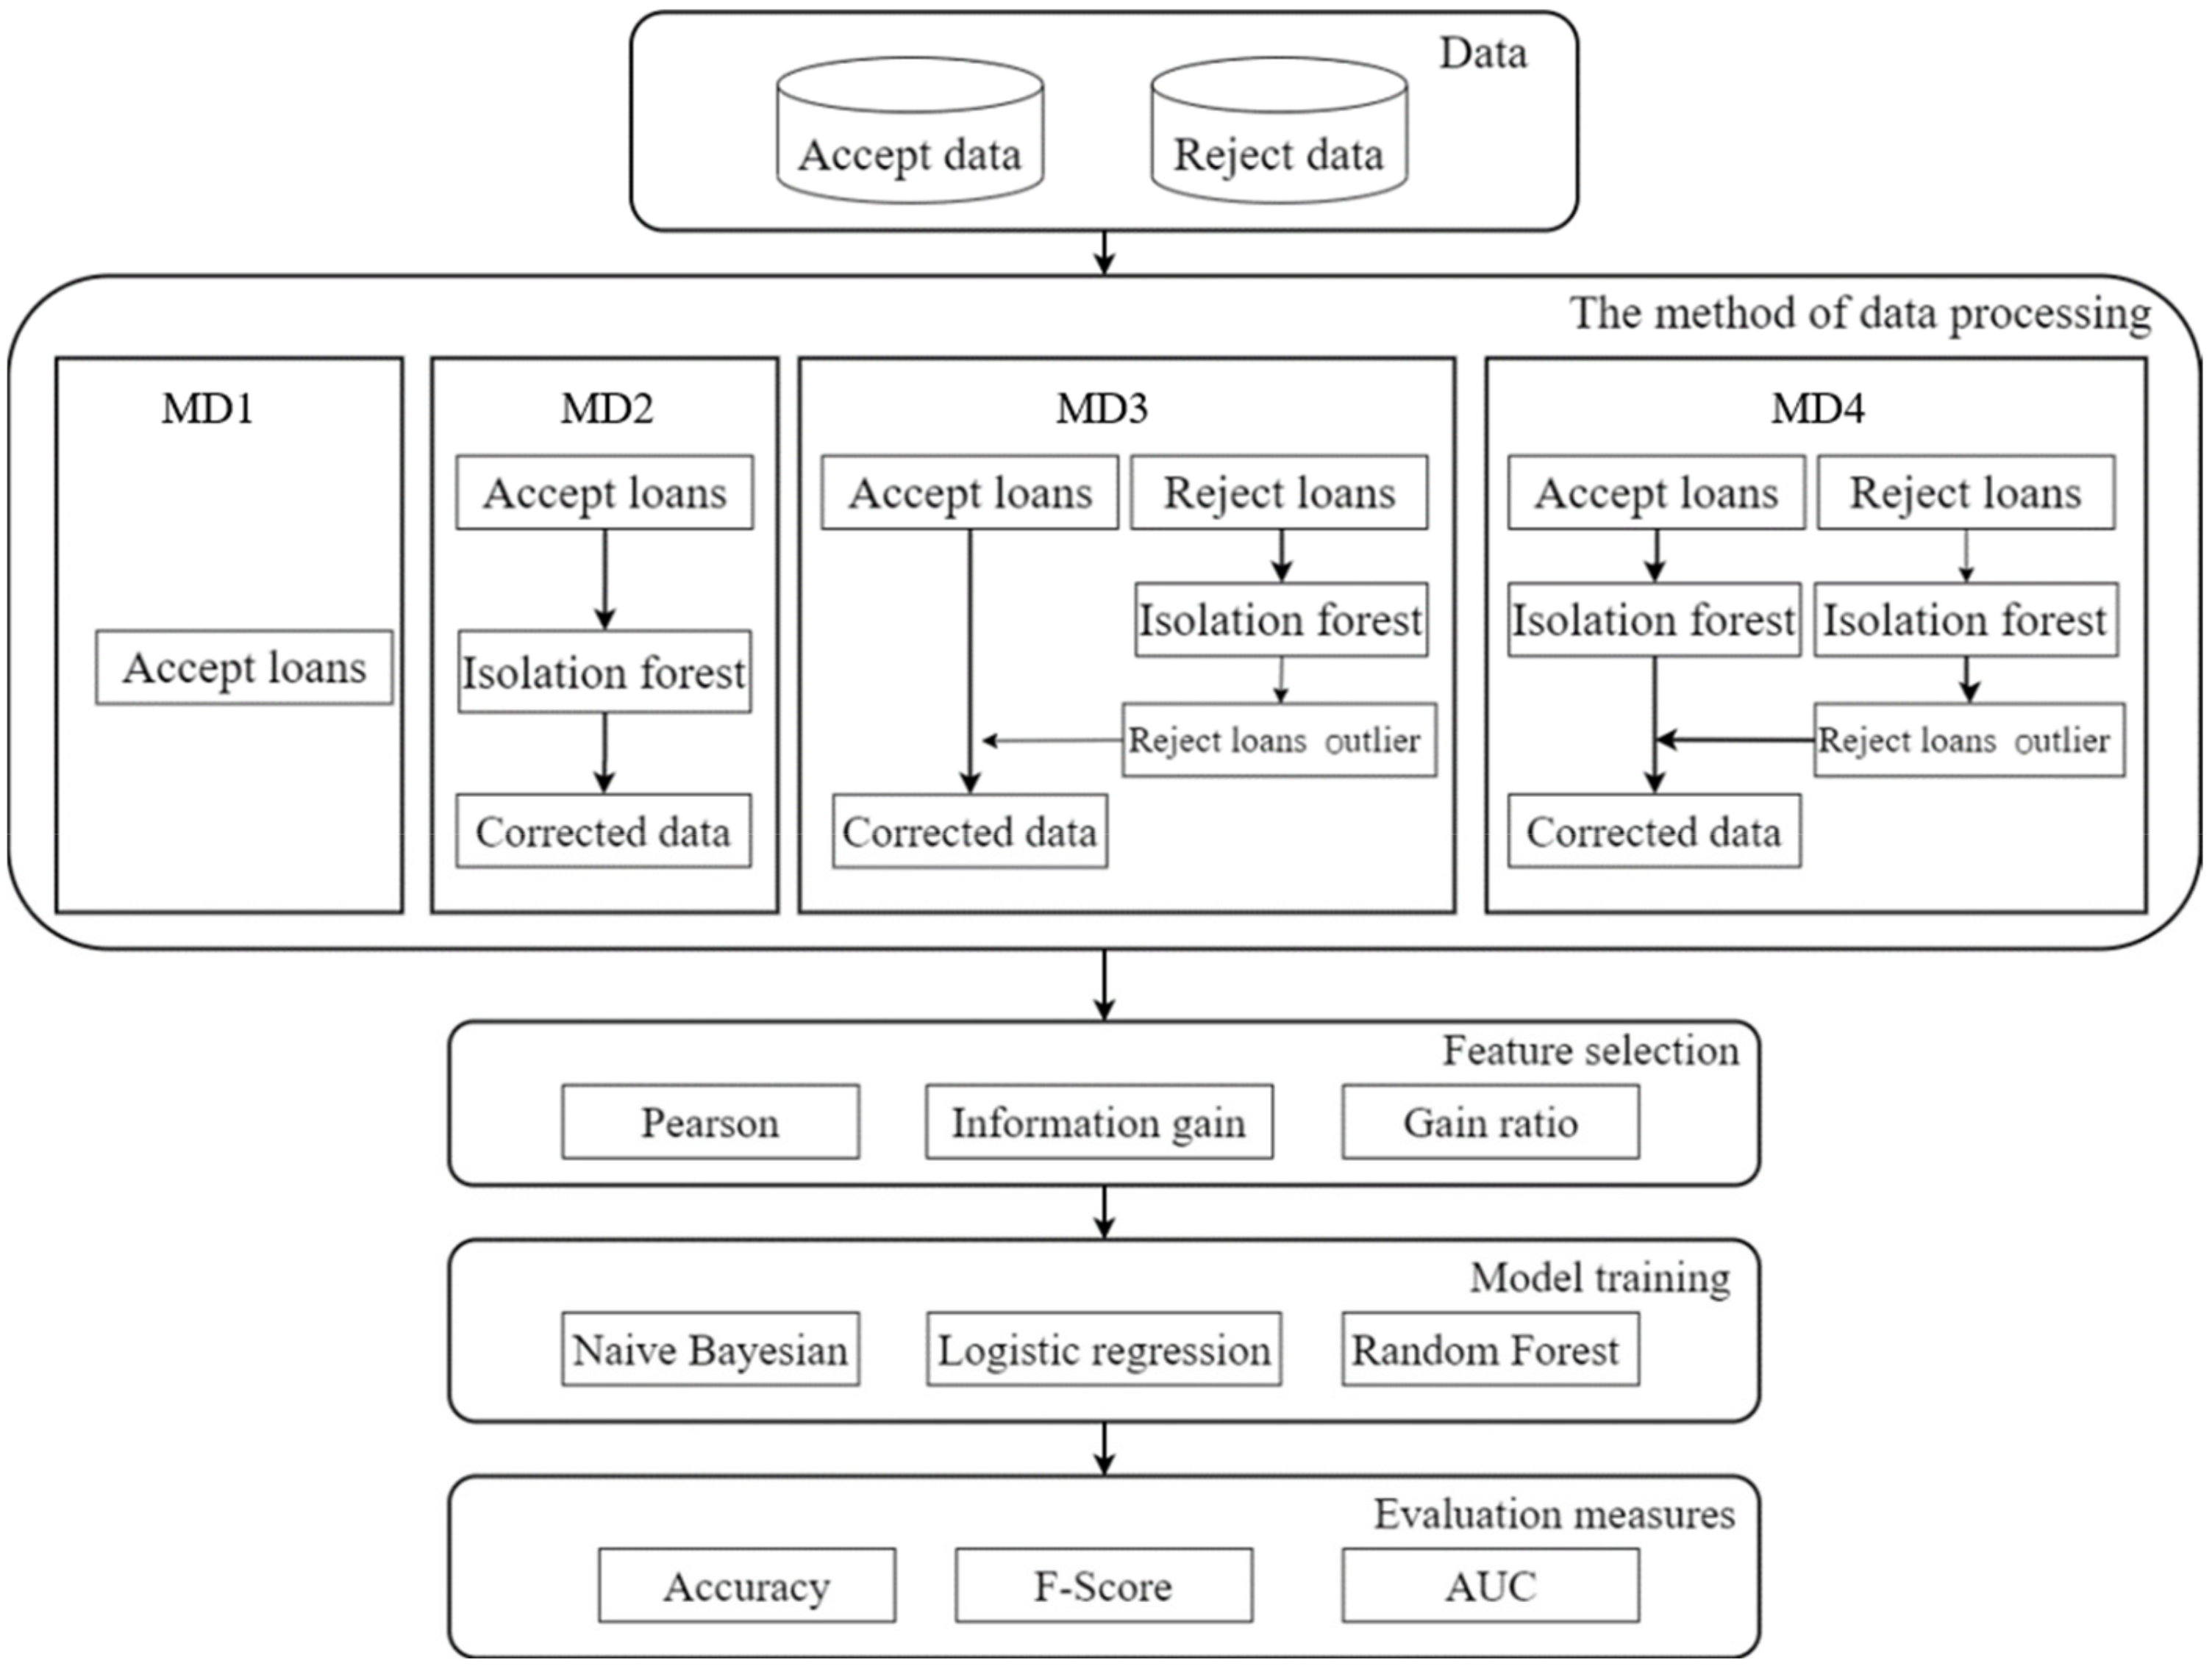
This study uses the accepted and rejected data from the Lending Club loan dataset, with outlier processing, and divides the dataset into 4 sample groups, namely MD1, MD2, MD3, and MD4; the study then uses three feature-extraction methods and three classification methods to build 4 credit-scoring models. The accuracy test results are shown in Table 6. Among the feature-extraction methods, Pearson with RF classification results is the best.
Due to the better accuracy of using Pearson for feature extraction and the random forest to build the credit-scoring models, we further applied it to all 4 sample groups. The evaluation results are in Table 7. As can be seen from Table 7, the study results of the MD4 sample are the best, followed by the MD3 sample. This means that the accuracy of the credit-scoring model will increase if the outlier sample in the loan rejection sample is added to the loan acceptance sample. Therefore, the accuracy of the credit-scoring model is better if the outlier samples are removed from the loan acceptance sample, which is encouraging.

4. Discussion

It has been shown in previous studies that if a financial institution builds a credit-scoring model using only the accepted sample data of loan applicants, the model cannot be representative of all applicants, and this is where reject inference is proposed. Reject inference is inferring whether a loan applicant who has been denied was a good or bad loan applicant. However, it is necessary to combine the loan applicant’s rejection status with the loan applicant’s acceptance status [22]. In a past study, Tian et al. [23] removed outliers from rejected data and modeled them with accepted data. In addition, some scholars extract the outliers of the rejected data, add them to the accepted data, and then add the outliers in the rejected data to the accepted data. Both rejection and acceptance data are modeled [24]. Liu [25] applied reject inference to credit scoring to solve the problem of information asymmetry in credit-scoring models, combining loan acceptance data and rejection data as a credit-scoring model. However, this study argues that acceptable applicants may be implicit in the sample of rejected loan applicants, and the outliers found in the sample of rejected loan applicants represent those acceptable loan applicants. Furthermore, an accepted sample of loan applicants may also imply applicants who should be rejected, while outliers found in the sample represent applicants who should be rejected. Therefore, if the loan applicant sample is handled correctly, it may be possible to increase the number of loan applicants, and the increase in the number of loaners can increase the income of the loan platform. Therefore, according to this hypothesis, this study performed outlier detection and reorganization on all loan applicants, who were divided into 4 sample groups (MD1, MD2, MD3, MD4). A comparison of the practice of this study with other studies is shown in Table 7 and includes a comparison of sample sizes.
Table 8 presents the number of accepted and rejected samples for each study, illustrating the number of variables for each study and the outlier handling of the data. In Table 8, after adding the outliers in the rejected data into MD3 and MD4, the amount of accepted data is much greater than that without outliers added before. Using the accepted data without removing outliers, the number of data records is 928,112, and when adding outliers to the rejected data, the number of data records is 285,301. When outliers are removed from the accepted data, the number of data records is 75,871, and when adding outliers to the rejected data, the number of data records is 268,361. Adding outliers to rejected data adds a total of 1,924,901 data records, which is more than the accepted data record counts in previous studies. An increase in accepted data for lenders means an increase in the number of loan applicants being accepted, and an increase in the number of lenders means an increase in the loan income of the loan platform.
This study describes a credit-scoring model established based on the work of previous scholars through the Lending Club dataset in Table 8. Xia [24] added the outliers in the rejected data to the accepted data and modeled the accepted and rejected data. Tian et al. [23] modeled the accepted and rejected data after removing outliers in the rejected data. Liu et al. [25] classified the accepted and rejected data and then selected a small part of the accepted and rejected samples for modeling. The authors of [23] extracted features through a single feature selection technique, but other studies use the features of rejected data for modeling. This study processed the accepted and rejected data by outlier detection: MD2 deletes the outliers in the accepted data, MD3 is the outlier that adds the accepted data to the rejected data, and MD4 deletes the outliers in the accepted data and adds the outliers in the rejected data. Different feature selection techniques were used to extract features for each model, and adopting Li et al. [8], the data set was divided into 70% training set and 30% testing set. It is hoped that the combination of outlier detection, feature selection, and machine learning can improve the effectiveness of the current credit-scoring model.
In order to verify the effectiveness of the method proposed in this study, we compare the results from past studies, as shown in Table 9. In terms of accuracy, the results for MD4 in this study are better than those proposed in previous studies. In addition, in terms of AUC, the results for MD3 of this study are also very good. Therefore, it can be seen that it is helpful to model the selection of the outlier applicants in the rejected samples and include them in the accepted applicants. This approach can increase the number of lenders and bring more benefits to the lending platform, while the accuracy of the credit-scoring model is still maintained.
Researchers using the Lending Club dataset want to build credit-scoring models by processing rejected samples, and they mostly use machine learning for learning and classification and evaluate credit-scoring models based on accuracy and AUC [23,24,25]. Xia [24] also believed that if a fixed dataset is used all the time, the generalizability of the model will be lost. Therefore, this study hopes to adjust the samples through outlier detection to improve the generalizability of future credit-scoring models. Past studies have tried removing outliers from the accepted data or adding rejected outliers. The aim of this study was to identify the combination that gave the best result, and machine learning was used to verify.
Table 10 is a consolidated comparison of the results of this study and previous studies. This study is compared with three previous studies on credit-scoring models; the data in the study are all from the Lending Club loan platform, and the study period is four years (2009 to 2012). This study uses outlier detection to add outliers in rejected data to accepted data (as in MD3), and there may be loan applicants who were rejected in the accepted data, so the accepted data also use the outlier detection method to remove outliers (as in MD4). The outliers in the accepted data and the rejected data represent the numbers of people who can increase the loans, and the loan amount will increase accordingly, thereby improving the platform’s revenue.

5. Conclusions

Credit loan transactions have become an important pipeline in the market economy, and most companies are starting to develop better strategies with the help of credit-scoring models. Most of the previous studies only use the method of accepted data or reject inference to build credit-scoring models. However, there should be useful data in both data sets, and lenders should not use just one; doing so can make the established credit model inaccurate and lead to sample bias, which hinders model performance. Indeed, in P2P network lending, many borrowers’ applications are rejected. A company building a credit-scoring model must combine these data to fully assess a loan’s potential risk. Researchers using the Lending Club dataset want to build credit-scoring models by processing rejected samples, with their models built only on accepted samples to directly predict the status of rejected samples. However, the distribution of accepted samples in online P2P lending is different from the distribution of rejected samples, and the credit-scoring model on the original accepted sample may no longer apply.
In this study, outlier detection is used with the real loan data on the loan platform to remove outliers in accepted data and add outliers in rejected data. This approach filters out loan applicants who have a chance of being bad loan applicants and includes loan applicants who may be good loan applicants. In addition, this study uses three feature-extraction methods, three classifier methods, and three evaluation metrics to build credit-scoring models and find out the best combination of accepted samples and rejected samples in the machine learning approach. Properly adding or deleting outliers can improve the model’s generalizability, avoid the use of fixed data sets, and improve the adaptability of future models. The experimental results show that the credit-scoring model combining Pearson and random forest proposed in this study has significantly better accuracy and AUCs than the models of other scholars. Compared with previous studies, using outlier detection to remove outliers in loan accept applicants and identify potentially creditworthy loan applicants from loan rejection samples is a good strategy. Furthermore, this study not only improves the accuracy of the credit-scoring model but also increases the number of lenders, which in turn increases the profitability of the lending platform.
In terms of practical implications, this study brings several advantages. First, because outlier detection and classifiers can be changed freely, the framework of this study is relatively flexible. Second, the size of the adjusted dataset becomes larger, which also represents the potential of this framework to handle large data sets. From a cost-benefit perspective, improving the performance of credit-scoring models from the perspective of outlier detection may bring more revenue to the company in the context of low loan approval rates.
Among the credit-scoring models in this study, only the isolated forest outlier detection method is used. Therefore, it is suggested that future studies can refer to the research of Zhang et al. [26] and use various other outlier detection methods to find common outliers. In addition, the use of deep learning methods to establish a credit-scoring model may be considered, which may make research in this area more complete.

Author Contributions

Conceptualization, P.-Y.S. and M.-H.S.; Data curation, T.-W.W. and N.-A.L.; Formal analysis, T.-W.W. and N.-A.L.; Funding acquisition, D.-H.S.; Methodology, D.-H.S. and P.-Y.S.; Project administration, D.-H.S. and M.-H.S.; Resources, N.-A.L.; Software, N.-A.L.; Validation, P.-Y.S.; Visualization, T.-W.W. and M.-H.S.; Writing—original draft, T.-W.W. and N.-A.L.; Writing—review & editing, D.-H.S. and M.-H.S. All authors have read and agreed to the published version of the manuscript.

Funding

This work was partially supported by the Taiwan Ministry of Science and Technology (grants MOST 110-2410-H-224-010). The funder has no role in study design, data collection and analysis, decision to publish, or preparation of the manuscript.

Institutional Review Board Statement

Not applicable.

Informed Consent Statement

Not applicable.

Data Availability Statement

Not applicable.

Conflicts of Interest

The authors declare no conflict of interest.

References

  1. Caldarelli, A.; Fiondella, C.; Maffei, M.; Zagaria, C. Managing risk in credit cooperative banks: Lessons from a case study. Manag. Account. Res. 2016, 32, 1–15. [Google Scholar] [CrossRef]
  2. Xia, Y.; Zhao, J.; He, L.; Li, Y.; Niu, M. A novel tree-based dynamic heterogeneous ensemble method for credit scoring. Expert Syst. Appl. 2020, 159, 113615. [Google Scholar] [CrossRef]
  3. Batrancea, L.M. An Econometric Approach on Performance, Assets, and Liabilities in a Sample of Banks from Europe, Israel, United States of America, and Canada. Mathematics 2021, 9, 3178. [Google Scholar] [CrossRef]
  4. Batrancea, L. An Econometric Approach Regarding the Impact of Fiscal Pressure on Equilibrium: Evidence from Electricity, Gas and Oil Companies Listed on the New York Stock Exchange. Mathematics 2021, 9, 630. [Google Scholar] [CrossRef]
  5. Sun, J.; Lang, J.; Fujita, H.; Li, H. Imbalanced enterprise credit evaluation with DTE-SBD: Decision tree ensemble based on SMOTE and bagging with differentiated sampling rates. Inf. Sci. 2018, 425, 76–91. [Google Scholar] [CrossRef]
  6. Shen, F.; Zhao, X.; Kou, G. Three-stage reject inference learning framework for credit scoring using unsupervised transfer learning and three-way decision theory. Decis. Support Syst. 2020, 137, 113366. [Google Scholar] [CrossRef]
  7. Zhang, W.; Xu, W.; Hao, H.; Zhu, D. Cost-sensitive multiple-instance learning method with dynamic transactional data for personal credit scoring. Expert Syst. Appl. 2020, 157, 113489. [Google Scholar] [CrossRef]
  8. Li, Z.; Tian, Y.; Li, K.; Zhou, F.; Yang, W. Reject inference in credit scoring using Semi-supervised Support Vector Machines. Expert Syst. Appl. 2017, 74, 105–114. [Google Scholar] [CrossRef]
  9. Crook, J.N.; Edelman, D.B.; Thomas, L.C. Recent developments in consumer credit risk assessment. Eur. J. Oper. Res. 2007, 183, 1447–1465. [Google Scholar] [CrossRef]
  10. Chen, G.G.; Astebro, T. The Economic Value of Reject Inference in Credit Scoring; Department of Management Science, University of Waterloo: Waterloo, ON, Canada, 2001; pp. 5–7. [Google Scholar]
  11. Joanes, D.N. Reject inference applied to logistic regression for credit scoring. IMA J. Manag. Math. 1993, 5, 35–43. [Google Scholar] [CrossRef]
  12. Banasik, J.; Crook, J. Reject inference in survival analysis by augmentation. J. Oper. Res. Soc. 2010, 61, 473–485. [Google Scholar] [CrossRef] [Green Version]
  13. Bücker, M.; van Kampen, M.; Krämer, W. Reject inference in consumer credit scoring with nonignorable missing data. J. Bank. Finance 2013, 37, 1040–1045. [Google Scholar] [CrossRef] [Green Version]
  14. Crook, J.; Banasik, J. Does reject inference really improve the performance of application scoring models? J. Bank. Finance 2004, 28, 857–874. [Google Scholar] [CrossRef]
  15. Batrancea, L.; Rus, M.I.; Masca, E.S.; Morar, I.D. Fiscal Pressure as a Trigger of Financial Performance for the Energy Industry: An Empirical Investigation across a 16-Year Period. Energies 2021, 14, 3769. [Google Scholar] [CrossRef]
  16. Batrancea, L. The Influence of Liquidity and Solvency on Performance within the Healthcare Industry: Evidence from Publicly Listed Companies. Mathematics 2021, 9, 2231. [Google Scholar] [CrossRef]
  17. Troyanskaya, O.G.; Cantor, M.; Sherlock, G.; Brown, P.O.; Hastie, T.; Tibshirani, R.; Botstein, D.; Altman, R.B. Missing value estimation methods for DNA microarrays. Bioinformatics 2001, 17, 520–525. [Google Scholar] [CrossRef] [Green Version]
  18. Zhang, S. Nearest neighbor selection for iteratively kNN imputation. J. Syst. Softw. 2012, 85, 2541–2552. [Google Scholar] [CrossRef]
  19. Xia, Y.; Yang, X.; Zhang, Y. A rejection inference technique based on contrastive pessimistic likelihood estimation for P2P lending. Electron. Commer. Res. Appl. 2018, 30, 111–124. [Google Scholar] [CrossRef]
  20. Trivedi, S.K. A study on credit scoring modeling with different feature selection and machine learning approaches. Technol. Soc. 2020, 63, 101413. [Google Scholar] [CrossRef]
  21. Nalić, J.; Martinović, G.; Žagar, D. New hybrid data mining model for credit scoring based on feature selection algorithm and ensemble classifiers. Adv. Eng. Informatics 2020, 45, 101130. [Google Scholar] [CrossRef]
  22. Anderson, B. Using Bayesian networks to perform reject inference. Expert Syst. Appl. 2019, 137, 349–356. [Google Scholar] [CrossRef]
  23. Tian, Y.; Yong, Z.; Luo, J. A new approach for reject inference in credit scoring using kernel-free fuzzy quadratic surface support vector machines. Appl. Soft Comput. 2018, 73, 96–105. [Google Scholar] [CrossRef]
  24. Xia, Y. A novel reject inference model using outlier detection and gradient boosting technique in peer-to-peer lending. IEEE Access 2019, 7, 92893–92907. [Google Scholar] [CrossRef]
  25. Liu, Y.; Li, X.; Zhang, Z. A new approach in reject inference of using ensemble learning based on global semi-supervised framework. Futur. Gener. Comput. Syst. 2020, 109, 382–391. [Google Scholar] [CrossRef]
  26. Zhang, W.; Yang, D.; Zhang, S. A new hybrid ensemble model with voting-based outlier detection and balanced sampling for credit scoring. Expert Syst. Appl. 2021, 174, 114744. [Google Scholar] [CrossRef]
Figure 1. The framework of the global credit-scoring modeling.
Mathematics 10 02282 g001
Table 1. Variable descriptions of the rejected loan applicants.
Variable NameContent
x1: loan_amountThe loan amount applied for by the borrower
x2: FICO_scoreRisk score
x3: Debt_To_Income_RatioA ratio calculated using the borrower’s total debt repayments divided by the borrower’s self-reported monthly income
x4: StateState provided by the borrower in the loan application
x5: Employment_LengthLength of employment
Table 2. Variable descriptions of the accepted loan applicants.
Variable NameContent
X1: loan_amntThe loan amount applied for by the borrower
X2: funded_amntThe total amount committed to the lender at a point in time
X3: funded_amnt_invThe total amount committed to this loan at a point in time
X4: termLoan payment amount
X5: int_rateIndicates whether the income is LC verified, unverified, or if the source of income is verified
X6: installmentIf the loan is from the borrower’s monthly payment
X7: FICO_scoreRisk score
X8: Employment_LengthLength of employment
X9: annual_incBorrower’s self-reported annual income during registration
X10: verification_statusVerification status
X11: loan_statusCurrent status of loans
X12: purposeCategories provided by borrowers for loan applications
X13: StateState provided by the borrower in the loan application
X14: Debt_To_Income_RatioA ratio calculated using the borrower’s total debt repayments divided by the borrower’s self-reported monthly income
X15: delinq_2yrsIncidents of delinquency that are more than 30 days past due in the borrower’s credit file in the past two years
X16: inq_last_6mthsNumber of inquiries in the past 6 months
X17: open_accOutstanding credit limit in the borrower’s credit file
X18: home_ownershipHomeownership
X19: revol_balTotal credit revolving balance
X20: revol_utilRevolving rate, or the amount of credit a borrower uses relative to all available revolving credit
X21: total_accThe total number of current credit limits in the borrower’s credit file
X22: total_pymntTotal payments received so far
X23: total_rec_prncpThe principal received so far
X24: total_rec_intInterest received to date
X25: total_pymnt_invPartial funding received to date from investors
X26: last_pymnt_amntTotal payment amount last received
X27: last_fico_range_highThe upper bound range for the last time the borrower received FICO
X28: last_fico_range_lowThe lower bound range for the last time the borrower received FICO
Table 3. Descriptive statistics of the Lending Club dataset.
Rejected Dataset
VariablesMinMaxMeanS.D.
loan_amount1000.0035,000.0014,900.0011,057.00
FICO_score385.00850.00642.765.05
Debt_To_Income_Ratio0.0034.9915.287.39
State--23.81-
Employment_Length0.0010.000.772.27
Accepted Dataset
loan_amnt1000.0035,000.0012,548.837915.85
term36.0060.0041.3610.00
int_rate5.4224.8912.994.20
FICO_score0.00850.00680.1396.61
Employment_Length0.0010.005.273.64
State--23.00-
Debt_To_Income_Ratio0.0034.9915.287.39
Table 4. The outlier detection results.
Item2009201020112012
Rejected data in total50,495306,244213,015657,241
Reject data outliers905755,54927,97599,909
Accept data in total526612,53021,70753,308
Accept data outliers855220645279352
Table 5. The results for the different feature-extraction methods for the 4 sample groups.
(a) MD 1
Algorithm#Features  Features
Pearson10X5, X11, X14, X15, X18, X20, X23, X24,27, X28
IG 8X3, X5, X14, X15, X19, X20, X27, X28
GR7X5, X6, X11, X15, X20, X27, X28
(b) MD 2
Algorithm#Features  Features
Pearson9X5, X11, X14, X15, X18, X20, X23, X24, X27
IG 6X5, X14, X15, X20, X27, X28
GR5X5, X15, X20, X27, X28
(c) MD 3
Algorithm#Features  Features
Pearson10X2, X3, X5, X6, X16, X20, X22, X23, X24, X25
IG 11X5, X6, X9, X20, X21, X24, X25, X26, X27, X28
GR9X5, X6, X19, X20, X22, X24, X25, X26
(d) MD 4
Algorithm#Features  Features
Pearson9X2, X3, X5, X6, X16, X20, X22, X23, X24, X25
IG 12X5, X6, X9, X19, X20, X21, X24, X25, X26, X27, X28
GR12X4, X5, X6, X9, X11, X15, X19, X20, X22, X24, X25, X26
#: number of extracted features.
Table 6. The accuracy results for the different sample groups.
YearSampleClassifier
NBLogisticRF
IGGRPearsonIGGRPearsonIGGRPearson
2009MD10.7360.720.7130.7810.7850.7830.8030.7380.805
MD20.7520.7430.7430.770.7880.790.7420.7460.804
MD30.5340.6640.5050.6330.8650.6280.9110.9060.897
MD40.6840.6270.6440.7680.7250.6990.920.9160.904
2010MD10.7510.7170.7010.7740.7830.7890.7870.7940.799
MD20.7440.7430.7250.770.7770.7940.7410.7510.808
MD30.5970.620.3920.7990.7820.7850.950.940.923
MD40.5090.6180.3930.820.8550.7710.9560.9470.924
2011MD10.7120.7080.6940.770.7770.790.7790.7890.813
MD20.7480.7470.7450.7790.7830.8090.7650.7710.827
MD30.4980.5450.3850.8680.870.9050.9210.920.924
MD40.6650.590.4060.8910.9210.920.9340.9380.933
2012MD10.7570.7430.730.8060.7880.8180.8490.7460.858
MD20.7730.7670.7660.8160.8170.8320.8030.8070.868
MD30.5450.6640.40.860.8650.8750.950.9490.953
MD40.6490.7070.4070.8840.90.8740.9580.9590.958
Table 7. The evaluation of the credit-scoring models for the different sample groups.
YearMetricsMD1MD2MD3MD4
2009ACC0.8050.8040.8970.904
F-score0.7920.790.8960.901
AUC0.910.9060.9840.991
2010ACC0.7990.8080.9230.924
F-score0.7860.7920.920.922
AUC0.9020.9010.9940.994
2011ACC0.8130.8270.9240.933
F-score0.8010.8110.9230.932
AUC0.9080.9060.9880.896
2012ACC0.8580.8680.9530.958
F-score0.8510.8620.9520.957
AUC0.9220.9180.9950.933
Table 8. The comparison of the sample size and outlier processing with previous studies.
AuthorAcceptRejectedVariableOutlier Processing
Xia [24].91,825716,505Five variables for rejected dataAdd outliers from rejected samples to accepted data and model both separately
Tian et al. [23]53,630536,738Use Pearson to select features and add five variables that reject dataRemove outliers in rejected samples, modeling accepted and rejected samples
Liu et al. [25]50005000Five variables for rejected dataModeling accepted and rejected samples with small sample
Our study (MD1)92,8111,226,995Select variables using three feature-extraction methodsModeling with accepted samples
Our study (MD2)75,8711,243,935Select variables using three feature-extraction methodsRemove outliers from accepted samples
Our study (MD3)285,3011,034,505Select variables using three feature-extraction methodsAdd outliers from rejected data to accepted samples
Our study (MD4)268,3611,051,445Select variables using three feature-extraction methodsRemove outliers from accepted samples and add outliers from rejected samples
Table 9. The comparison of the results of this study with previous studies.
YearAuthorMethodACCAUC
2009Xia [24]Logistic0.81040.7116
RF0.82920.7772
OD-LightGBM0.83560.8005
Tian et al. [23]FQSSVM0.916-
Liu et al. [25]Logistic0.75750.6769
RF0.85780.8183
RF-SSL-EC3-Kmeans0.91570.9169
Our study (MD3)RF0.8970.984
Our study (MD4)RF0.9040.991
2010Xia [24] Logistic0.85540.8393
RF0.86310.8669
OD-LightGBM0.86430.8734
Tian et al. [23]FQSSVM0.919-
Liu et al. [25]Logistic0.78320.7161
RF0.85680.8165
RF-SSL-EC3-Kmeans0.92920.9297
Our study (MD3)RF0.9230.994
Our study (MD4)RF0.9240.994
2011Xia [24]Logistic0.850.8433
RF0.85930.8894
OD-LightGBM0.8690.8926
Tian et al. [23]FQSSVM0.918-
Liu et al. [25]Logistic0.78440.746
RF0.8410.8012
RF-SSL-EC3-Kmeans0.92780.9184
Our study (MD3)RF0.9240.988
Our study (MD4)RF0.9330.896
2012Xia [24]Logistic0.82470.8336
RF0.85360.8862
OD-LightGBM0.8560.8973
Tian et al. [23]FQSSVM0.905-
Liu et al. [25]Logistic0.75590.7083
RF0.87270.8978
RF-SSL-EC3-Kmeans0.91330.9145
Our study (MD3)RF0.9530.995
Our study (MD4)RF0.9580.933
Table 10. A consolidated comparison of this study and previous studies.
AuthorStudy IntervalAccept DataClassifierAverage ACC Average AUC
Xia [24]4 year91,825OD-LightGBM0.85620.866
Tian et al. [23]4 year53,630FQSSVM0.9145-
Liu et al. [25]4 year5000RF-SSL-EC3-Kmeans0.92150.9199
Our study (MD3)4 year285,301RF0.92430.9905
Our study (MD4)4 year268,361RF0.92980.9535
Publisher’s Note: MDPI stays neutral with regard to jurisdictional claims in published maps and institutional affiliations.

