Abstract
The debate on national identity has been receiving more attention from academics, social planners, and the public in recent years. This study aims to analyse citizens’ different national identity typologies using data from the International Social Survey Program (ISSP) in two waves: 2003 and 2013. The study is based on 10 countries for which the dimensions of the national identity construct are first examined through multi-group confirmatory factor analysis (MGCFA). Then, a fuzzy hybrid approach is used to obtain two synthetic indicators for each dimension of national identity, namely ethnic and civic orientations. Then, a fuzzy clustering analysis is used to extend the Classical Apostle Model, obtaining 16 different national identity categories that expand the four Apostle categories denominated as credentialists, post-nationalists, ethnic-oriented and civic-oriented. The study ends by applying the Binary Probit Model to analyse whether some socioeconomic characteristics can partly explain the four pure national identity categories. Our results show that people seem to be increasingly credentialists. Furthermore, the civic–ethnic dichotomy of France–Germany is no longer confirmed, as Germans appear to be included in the civic-oriented national identity group.
Keywords:
national identity; International Social Survey Program (ISSP); ethnic identity; civic identity; credentialists; post-nationalists; fuzzy clustering analysis; extended eco apostle model MSC:
03B52; 68T27; 68T37; 94D05
1. Introduction
National identity is a topic that has been extensively studied in the historical course of each country, and various migratory waves and globalisation have strongly influenced its definition. Many theories have shown that national identity is often associated with linguistic, religious, and ethnic characteristics ([1,2,3,4]). Scholars have argued that some individuals can develop a national identity based on ethnic and civic criteria [3], while others, on the contrary, have identified citizens who are aligned with an inclusive social state that shapes a moral community [5].
This study is based on the International Social Survey Program (ISSP), in 2003 and 2013, and 10 countries: Denmark, France, Germany, Ireland, Norway, Portugal, Russia, Spain, Great Britain, and the United States. The different dimensions of national identity and how these are influenced by different social characteristics are analysed in this work. First, the Exploratory Factor Analysis analyses the structural dimensions of national identity. Second, Multigroup Confirmation Factor Analysis (MGCFA) is applied to confirm the adequacy of the structure, characterised by two dimensions: ethnic and civic [6,7]. Third, using two fuzzy logic methods, a fuzzy hybrid TOPSIS (The Technique for Order of Preference by Similarity to Ideal Solution) method and fuzzy clustering analysis, ethnic and civic national identity are studied for each citizen. Fourth, the eco-apostle model is extended according to the membership functions obtained by the fuzzy cluster analysis to group the individuals according to the 16 new national identity categories extending the four classical categories, namely post-nationalists, ethnic-oriented, civic-oriented, and credentialists. Finally, binary probit models are estimated to examine which socio-economic characteristics influence national identity.
This work complements past studies [3,7,8] by providing new approaches based on fuzzy set theory that are not commonly used in the social sciences. The novelty of the study is based on the extension applied to the classical eco apostle model using the membership function obtained with the fuzzy clustering analysis. Thus, it is observed that citizens are more often credentialists than any other category.
2. An Ethnic/Civic Dichotomy Theory Overview
Based on the different interpretations of national identity, the civic/ethnic framework is established primarily by [9] based on the historical description of the national identity construct. Cohen [10] states that the difference between civic nationalism and ethnic nationalism is one of the most widely used conceptual building blocks in nationalism research.
Smith [11] is one of the most frequently discussed authors in the literature dealing with the ethnic/civic dichotomy. His thesis has caused a fierce controversy that the nation is the foundation of every country, providing myths, symbols, and public culture for the country [1,12]. Smith [11] affirms that the main feature of some nations (citizen states) is ideological mythology, while the main feature of other nations (nation-states) is genealogical mythology. Popular mythology emphasises borders, legal systems, rights and obligations, citizenship, and shared culture, while racial mythology emphasises genealogy, populism, customs and dialects, and nativism [12].
Despite the criticisms, the civic/ethnic framework has aroused the interest of many scholars, who have used it not only in historical documents but also in the study of the current relationship between civics and ethnicity. Some use the dichotomy to analyse the resurgence of ethnic conflict in post-communist countries [13,14,15]. Others use it to analyse the integration policies of national minorities [16] and immigration policies [17,18]. These authors have adopted the ethnic/civic theory of national identity without modification. For example, Smith [11] provides a mild account of the dichotomy between civics and ethnicity. He affirms that these categories should not be considered as one at the exclusion of the other, but the civic/ethnic framework should be considered as an ideal type, similar to a continuum with two poles, rather than a binary classification. Therefore, he provides a very general dichotomy: the concept of ethnicity considers the culture of a country as heritage (of blood or custom), while civics considers the ownership of a country as a voluntary act of an individual.
The intercultural research used to conceptualise nationalism also mentions the duality between ethnicity and civic/cultural nationalism [1,9], which is often referred to as different ways of drawing “our circle” [19]. In addition to the strength of personal identity and its importance in daily life, the content of national identity makes it possible to distinguish between sub-concepts such as national, ethnic, or civic identity [3]. However, as the meaning and understanding of these terms vary widely in different contexts [7], the personal concept of how to become a genuine member of one’s country has emerged. For this reason, analyses of ethnic identity between countries and cultures have been conducted [2,3], and this topic cannot be underestimated [20].
Nevertheless, recent research has highlighted a particular gap in the ethnic/civic dichotomy, as some definitions of ethnic identity do not fit into either category. For example, Pehrson [21] argues that popular notions of ethnic identity are more confusing than theory suggests. Analysing national identity data from the International Social Survey Program (ISSP) modules conducted in 1995, 2003, and 2013, Pehrson [21] states that citizens can accept criteria such as compliance with state institutions and laws and the ability to speak the official language. Therefore, these two attributes have a positive correlation, as those who support the former tend to support the latter. Analysing the differences in responses between states, Pehrson [21] also found that, contrary to the theoretical practice of attributing identity as civic or ethnic, citizens tend to define it as a combination of the two.
The literature tends to partly overlook other variants of ethnic identity that can expand the duality of ethnic identities beyond ethnic and civic orientation. Therefore, according to Medrano [8], an extension of this analysis would better highlight the complex interaction between popular attitudes of elite representation and national identity, each noting the impact on institutions and public policies in all sectors. In this context, Medrano [8] departs from the traditional ethnic/civic identity dichotomy and presents a new model for citizens who think that both dimensions are important (credentialists) and for those who think that no dimension is important (postnationalist).
3. Data
The sample includes 10 countries—Denmark, France, Germany, Ireland, Norway, Portugal, Russia, Spain, the United Kingdom, and the United States—and two ISSP waves—2003 and 2013. National identity is based on eight indicators: (1) to have been born in (the country); (2) to have (the country’s) citizenship; (3) to have lived in (the country) for most of one’s life; (4) to be able to speak (the country’s) language; (5) to be (religion); (6) to respect (the country’s) political institutions and laws; (7) to feel (country nationality); (8) to have (country nationality) ancestry. The terms “country” and “religion” were accordingly replaced by the respective country and majority religion of the interviewers. Thus, in Spain, the first item would be “to have been born in Spain”, and the fifth item would be “to be Catholic”.
The dataset contains 27,873 respondents, composed as follows: Denmark in 2003: 1322; Denmark in 2013: 1325; France in 2003: 1669; France in 2013: 2017; Germany in 2003: 1287; Germany in 2013: 1717; Ireland in 2003: 1065; Ireland in 2013: 1215; Norway in 2003: 1469; Norway: 2013: 1585; Portugal in 2003: 1600; Portugal in 2013: 1001; Russia 2003: 2383; Russia in 2013: 1514; Spain 2003: 1212; Spain 2013: 1225; United Kingdom 2003: 873; 2013 United Kingdom: 904; United States 2003: 1216; and United States in 2013: 1274.
Table 1 shows that women made up a larger number of respondents (about 55%) than men. Regarding the respondents’ age, the category of those under 24 years old is the least numerous group (4.13%), and the rest of the groups are always represented by more than 13%. Our sample mainly consists of educated people because more than 63% of people have a degree greater than or equal to upper secondary education. The predominating religions are Catholic (34.80%) and Protestant (26.85%), while agnostics represent almost 21% of the sample. Finally, the sample is also characterised by politically moderate individuals, because the two extremes, far left and far right-wing political orientations, only represent 5.49% and 2.48%, respectively.

Table 1.
Survey socio-demographic characteristics (n and %).
4. National Identity Using Ethnic and Civic Dimensions
In this study, eight ISSP indicators of the national identity module are used. According to Sarrasin et al. [22], an Exploratory Factor Analysis (EFA) (Promax rotational) is used to analyse whether there is a comparative factor structure. EFA can uncover the number and substance of the components in each factor. Through the EFA, the underlying design was set up as the highly recognised national identity duality between the ethnic and civic dimensions.
Table 2 shows the eight ISSP indicators according to both dimensions. The ethnic dimension contains five indicators or items: (1) being born in (the country), (2) having citizenship (country), (3) having lived in (the country) for most of one’s life, (5) being (religion), and (8) having (nationality of the country) ancestors. On the other hand, three indicators ((4) being able to speak the language (of the country), (6) respecting the institutions and political laws (of the country), and (7) feeling (nationality of the country)) are classified as the civic criteria of national identity. In this study, we used Cronbach’s alpha to measure the internal consistency of dimensions, and in both cases, the figures represent values equal to or greater than 0.6 for both dimensions, and therefore this can be considered an acceptable result [23].
Table 2.
Factor loadings for EFA. ISSP 2003 and 2013 criteria for being truly national.
Then, through the R lavaan package, the equivalence between groups through the MGCFA is tested, following the literature and considering the results of the EFA. Following Marsh et al. [24], the study analyses whether the metric equivalence model fits the data adequately, and scalar equivalence is then tested later. Consequently, the interceptions between the different groups are bound to be the same. Being aware that these cannot conform to an absolute rule [25] when comparing the fit index (CFI) and the Tucker–Lewis index (TLI), it is recommended that they be greater than 0.95. Therefore, the standardised mean square root (SRMR) and root mean square error (RMSEA) must both be less than 0.05.
These indicators can be used to analyse whether a model fits the data. However, they have less information about the changes between the two stages of the equivalence measurement test. For this reason, fit index tests [26,27] show that small changes (between steps) in CFI and RMSEA reliably indicate that the additional step has achieved equivalence in analysis. According to Chen [25], when the decrease in CFI is equal to or less than 0.010 and the increase in RMSEA is equal to or less than 0.015, a stricter equivalence level can be assumed to have been achieved [28].
To test the configural pool, configural group, and metric and scalar equivalence under different factorial structures, confirmatory factor analysis is applied. We compare this to a first model that includes a latent construct to test the equivalent configuration (pool), configuration (group), and metric and scalar models. Next, we compare a second model that includes two latent constructs designed to represent national, ethnic, and civic identity (Table 3). In agreement with the results of previous studies using the national identity module of 2003 [3], the exploratory factor analysis of aggregate data analyses two waves: 2003 and 2013. The model fit indicators discard solutions to a single factor.
Table 3.
Fit indices that test the configural (pool and multi-group), metric, and scalar equivalence.
Conversely, including two factors, the chi-square model reduces by 4321.0. This reduction is statistically significant and indicates that a two-factor solution is preferable. In addition, the model fit index indicates that the two-factor model is very well suited to the data. RMSEA and SRMR seem to confirm that the second model, with two latent factors, is good, as, for the most part, they turn out to be less than 0.1.
This section aimed to analyse the distinction of current attributes of the concept of national identity based on ethnic and civic criteria. Therefore, these results confirm the results of [3,7,8]. The criteria that can be traced back to national identity in the ethnic sense are the lineage of individuals, religion, where one was born, where one lived, and if one has citizenship. On the other hand, the criteria for defining national identity in a civic sense include respect for laws and institutions, the feeling of belonging to the country, and knowing how to speak the language of the country.
5. The Fuzzy Eco-Apostle Model to Analyse the Ethnic and Civic National Identity
5.1. FTOPSIS and Fuzzy Clustering Analysis
Fuzzy Set Theory (FST) has made progress in a variety of applications and disciplines that go beyond being able to regulate the fuzzy information provided by the sequential semantic scale. Multi-criteria decision-making techniques (MCDM) involve the development of mathematical models in different empirical domains [29], such as education [30], supplier selection [31], green energy [32], or immigration studies [33]. The advantage of applying the FST in MCDM is to give a multivariate perspective by not assigning a single objective function to measure common hidden concepts in the social sciences [34].
In this study, the FST is applied to manage the vagueness of the information provided by the responses given to the ISSP module. First, the semantic ordinal scales are converted into triangular fuzzy numbers (TFN). Salih et al. [35] analyse papers using the keywords “TOPSIS” or “order preference technique for ideal similarity solution” and “development” and “fuzzy”, and the authors conclude that TFNs are the most commonly used fuzzy sets applied by researchers when they study uncertainty and vague information.
The transformation of the semantic ordinal scales provided by the respondents in TFN is characterised because the universe of discourse is within the interval (0, 100) as follows: (1) not at all important (0, 0, 50); (2) not very important (30, 50, 70); (3) quite important (50, 70, 90); and (4) very important (70, 100, 100). The interval is chosen for clarity without loss of generalisation. In each of the categories, the information provided is vague, and, for this reason, all consecutive ordinal semantic points are represented by three tuples that intersect in a certain interval. Fuzzy Set Logic Algebra facilitates the aggregation of TFNs. TFN algebra is applied here to calculate the fuzzy average number of n TFNs, . The properties of algebra ensure that the average of the TFN is also a TFN.
The information provided individually can be used to perform TOPSIS-based hybrid analyses. Therefore, it is now possible to determine the ideal positive solution and the ideal negative solution observed after the polymerisation process, as follows:
where stands for the crisp information matrix given by . i goes from 1 to the sample total (27,813), and j stands for the items included in ethnic and civic national identity dimensions—respectively, 5 and 3. J′ is an empty set, as all the items included in the study are considered benefits [36].
Thus, the positive ideal solution is obtained from the maximum figures observed in the sample of observations in the data set, and the negative ideal solution is obtained through the minimum figures. Once the positive and negative ideal solutions have been obtained, the next step is to obtain the Euclidean distance between each observation and the ideal solutions ( and ) to compare relative distances. Thus, the TOPSIS indicators are measured as follows:
It is useful to adopt the analysis of fuzzy cluster analysis to study the national identity of each individual. Therefore, for each interviewee, a membership function is obtained, where the membership function can determine the degree of similarity between each citizen and a specific representative citizen [37]. The basic knowledge of the fuzzy clustering algorithm is introduced below. This method is an extension of the bag grouping algorithm introduced by Leisch [38]. Readers interested in the method can consult D’Urso et al. [39,40,41]. The C-means fuzzy algorithm for fuzzy data is adopted and can be expressed as follows:
Following the study of Martín et al. [34], represents the fuzzy distance squared between the ith citizen and the profile of the representative citizen where the vector represents the TFN assigned to the information provided by the ith citizen. On the other hand, represents the TFN provided by the representative citizen of the cth cluster; is the square Euclidian distance between the centers of the TFN vectors of the citizen and the citizen representative of the cluster; and are the Eucilidian squared distances between the extreme left and right components of the TFN vectors of the citizen and the representative citizen of the cluster, respectively; are suitable weights for the centre and extreme components for the blurred distance considered; is a weighted exponent that controls the blur of the partition obtained; gives the degree of membership of the ith resident in the cth cluster. The discussion of cluster validation and cluster profiles is omitted, and interested readers are referred again to D’Urso et al. [39,40,41].
5.2. Binary Probit Model
National identity may be influenced by some socio-economic characteristics of the respondents. The probit models are thus estimated to analyse the extent to which these socio-economic characteristics affect national identity by using them as a dependent variable. Probit models provide an appropriate analytical framework for ordinal survey responses [42].
Given a binary response variable Y (national identity)—that is, the variable can have only two possible results indicated as 1 and 0—Y can represent the presence/absence of a certain condition, such as giving importance or not to civic (or ethnic) criteria in defining national identity. We also have a vector of regressors X that are assumed to influence the result Y [43]. Specifically, we assume that the model takes the form
where stands for the individual value i of national identity, is the regressor, and is the error term. The use of the standard normal distribution causes no loss of generality compared to the use of a normal distribution with arbitrary mean and standard deviation, hence
Bliss [44] uses a binary choice model to explain observed behaviours. To do this, the author needs to estimate the parameters of these models using a sample of data. However, binary choice models are fundamentally non-linear in parameters, excluding the ordinary least squares method as an estimation strategy. This problem is solved using maximum likelihood.
The independent explanatory variables considered in the models and their definitions are the covariates year, country, political orientation, education, religion, income (proxied by the top–bottom self-placement), gender, citizenship, main activity, country interest or unilateralism (proxied by agreement with the sentence that the country should follow its interests even in conflict), religiosity, education, respect for minorities (measured by the proxy of the agreement to whether minorities could maintain traditions or if they should adapt into society), and multilateralism (proxied by the agreement with the sentence that international bodies should enforce solutions). The normalisation of categorical variables in binary probit models is an issue that has been studied previously [45,46]. Most of the papers that estimate probit models use the dummy coding as the most recurrent normalisation. Nevertheless, there are advocates of using other types of normalisation to better interpret the results, such as the code effects normalisation proposed by [46]. As the comparisons are more valuable with the last normalisation, we have preferred to normalise all the covariates with it.
In the present study, four binary probit models are estimated: (a) an ethnic-oriented national identity model, (b) a civic-oriented national identity model, (c) a credentialist model, and (d) a postnationalist model. The marginal effects for each model are estimated.
6. Results
6.1. National Identities
The advantage of the fuzzy clustering analysis method is that it can divide the sample into various groups. The three cluster solutions are considered for the two different dimensions of national identity: (1) ethnic and (2) civic. Table 4 shows the three profiles or prototypes in these two cases. The names of the prototypes reflect the degree of rigour or importance given for each indicator as follows: (1) most, (2) least, and (3) intermediate. Thus, the “most” prototype for both dimensions is characterised by those respondents who answered 4 in all the items included in the dimension. Thus, the cluster represents those citizens who are very strict concerning each indicator. On the other hand, the “least” profile represents those citizens who show the least rigour in each of the indicators. For both dimensions, the profiles are represented by individuals who consider that each item is not important at all. Finally, the intermediate profile is an intermediate citizen who presents a more moderate position on the importance of each attribute for having an authentic ethnic or civic national identity. It can be seen that the profiles for these intermediate clusters are represented by a citizen who considers that religion is not important at all and that citizenship, ancestry, and language are quite important. It is interesting to remark that the “intermediate” profiles are closer to the “most” than the “least” profiles.
Table 4.
Fuzzy cluster profiles.
Figure 1 shows the ternary figures of those two dimensions of national identity that graphically represent the distribution of respondents. This graph shows whether the respondents present a more ethnic or civic national identity orientation. The analysis of the ethnic dimension (Figure 1a) reveals a coherent range of respondents approaching the pure intermediate profile. The aggregate of the membership function shows that 36.8% of citizens are more like pure ethnic nationalists, 15.8% are like pure no-ethnic nationalists, and 47.5% are more like intermediate ethnic nationalists. Figure 1b, on the other hand, represents the civic dimension. In this case, the distribution of the degree of the membership function is less widespread than in the commented ethnic case. Pure civic, no-civic, and intermediate nationalists are represented by 60.2%, 6.3%, and 33.5%, respectively. The results support the study by Reeskens [7] as respondents outline compliance with national laws and, also, with the country’s institutions as the most vital criteria for citizenship.
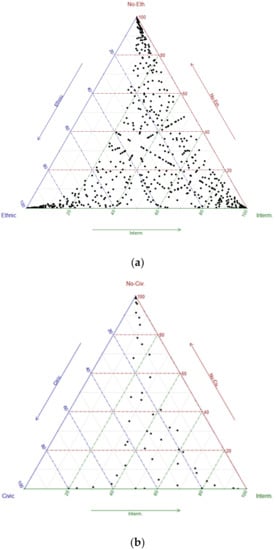
Figure 1.
Fuzzy clustering ternary graphs. (a) Ethnic national identity; (b) civic national identity.
6.2. Pure Nationalist and Pure Credentialist
The “Apostle Model” is a widely used method in ecology and basic classes of endangered species [47]. It is an approach developed by Harvard Business School in the 20th century to optimise the results of organisations that supply products to buyers of goods. This approach was developed to guarantee the customer’s reliability and the satisfaction of the buyer of the goods. It identifies the “apostles” as faithful consumers, the “hostages” as those who do not seek alternatives, and the “mercenaries” as those buying products based on prices. The “defectors” or “deserters” are dissatisfied and not very loyal, so they can easily switch to another supplier or create a commodity. The Apostles are the “credentialists” in this study, while the deserters are “postnationalists”. On the other hand, the other two extremes-hostages and mercenaries-are individually represented by “civic-oriented” and “ethnic oriented”.
Some citizens have a broader vision of national identity that is not limited to the ethnic/civic idea. The ethnic and civic dichotomy of citizens is characterised by giving greater prominence to the set of indicators contained in each respective measure. For this reason, we defined the sample following the Apostle model, as it aims to give a broader perspective of national identity. Thus, the credentialist national identity is based on all eight attributes, represented by the upper right quadrant of Figure 2. The opposite area for postnationalists comes from people who do not care about any analysed attribute. The results show that more than three-fifths of the interviewees are more credentialist and postnationalist (33.4% and 30%). In contrast, civic and ethnic orientation citizens accounted for 16.2% and 20.3%, respectively.
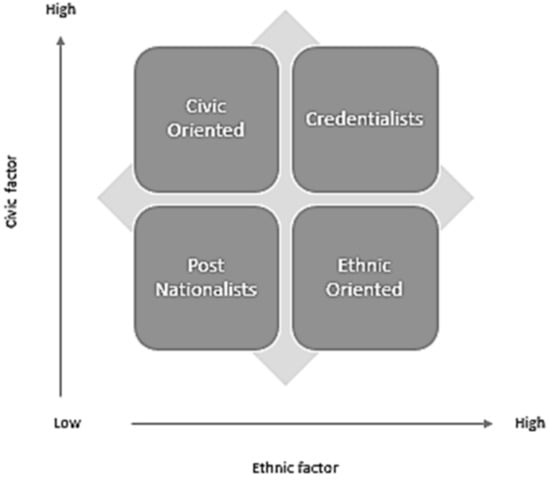
Figure 2.
Apostle model applied to national identity.
It appears evident that, using the classical Apostle model using the FTOPSIS method, the construction of national identity is blurred, as a citizen near the axes of the credentialist quadrant can be more similar to credentialist citizens than to any other kind of national identity. Therefore, we propose using the extended Apostle model based on the fuzzy clustering method to reduce the potential blur area of the event that determines the behaviour of credentialist, postnationalist, civic, and ethnic-oriented citizens. Thus, the global model shifts from a 4 profile subclassification to 16 broader replacement categories. We consider the fundamental difference from two points of pure profiles defined according to the average of the FTOPSIS method to four categories determined by the membership vector of the fuzzy clustering analysis.
Let and be the vectors of the membership functions for the ethnic and civic national identity obtained in the above section. A citizen is a credentialist if e1 and c1 are 0.5 or higher; post-nationalist if e2 and c2 are greater than 0.5; civic-oriented if e2 and c1 are greater than 0.5; and ethnic-oriented if e1 and c2 are greater than 0.5. The results for the extended Apostle model show that the ethnic-oriented group now agrees with 12.3% of the sample, but only 3.7% can be delineated as pure ethnic; i.e., they attach the utmost importance to ethnic attributes and low importance to civic attributes. On the other hand, civic-oriented groups represent 6.7% of the sample, although only 0.3% can be delineated as purely civic-oriented individuals. Unlike the classical Apostle model results, the postnationalist group represents our sample’s most minor representative category. The whole group accounts for 5.2%, while only 1.7% are deliberately pure postnationalists instead of opposed to the fashionable 30% obtained from the classic model. Almost 76% of the sample is classified as credentialist, but in this case, it is necessary to identify those who give more standing to civic proof, those that give more importance to ethnic criteria, and those that give greater importance to two criteria together—respectively, these represent by 28.2%, 9.2%, and 23.6%.
In the next section, we analyse whether some socio-economic characteristics can explain national identity. Binary probit models are used to detect which socio-demographic and economic characteristics influence being credentialist rather than postnationalist, ethnic, or civic-oriented.
6.3. The Relationship between Socio-Economic Variables and National Identity
The study aims to analyse the main drivers that affect citizens’ national identity. Four different binary probit models have been estimated for each category of national identity: credentialist, postnationalist, ethnic-oriented, and civic-oriented. Thus, the dependent variables are the corresponding national identity category for each model, and the independent variables are socioeconomic characteristics, such as country, political orientation, age, religion, income, gender, citizenship, main status, assiduousness in religious events, education, traditions, unilateralism, and multilateralism.
Table A1 shows the result of the binary probit model of our 13 covariates on ethnic-oriented, civic-oriented, postnationalist, and credentialist national identity. Regressors of the ethnic-oriented model do not appear to significantly affect the dependent variable, except for the year variable and assiduousness in religious events. From 2003 to 2013, citizens showed less interest in ethnic criteria, while those who attended one or several religious events a week showed a relevant relation to ethnic–national identity.
As for the civic-oriented model, age, income, gender, and main status have no significant effect. Indeed, from 2003 to 2013, citizens appeared to consider more civic criteria. At the country level, Denmark, France, Germany, and Norway are positively related to civic-oriented national identity. On the other hand, Ireland, Portugal, and Russia did not give importance to civic identity items. Political orientation plays an important role as left-wing citizens showed a positive relationship to civic national identity, while those who have a conservative ideology or far-right political ideology showed less civic-oriented national identity. Regarding religion, it is interesting to remark that protestants showed a negative effect regarding the probability of being a civic-oriented citizen, while Islamic people and agnostics showed a positive relationship with civics. Being a native or foreign citizen turns out to be a significant predictor in the study of civic national identity, and the results show that being a native citizen negatively affects civic criteria, while being a foreigner positively affects the civic items. The level of education also plays an important role, as less-educated citizens appeared to have a negative relationship with civis in comparison with more educated citizens more inclined to civic criteria. Unilateralism and multilateralism are important key drivers in the study of civic national identity as well. Both those who prefer that countries should follow their interest even in conflict and who prefer that the international bodies should enforce solutions can be considered less civic-oriented citizens.
All covariates of postnationalist model have a significant effect on postnationalism, except for the variable that indicates if the citizen is a native or foreigner. Germany, Ireland, and Spain show a positive effect on postnationalist sentiment at the country level, while the North European countries—Norway and Denmark—and France negatively affect postnationalist national identity. Support for far-left political ideology positively affects postnationalism, while being more conservative is not related to being postnationalist. Age does not appear to be significant, except for those who are 75 years old or over, which negatively affects being postnationalist. Results show that being Catholic negatively affects postnationalist national identity. Nevertheless, agnostics do not consider any criteria for national identity. Gender is also an important factor that affects postnationalist identity. Indeed, men appear to be more postnationalist than women. The assiduousness of religious events marks differences in postnationalism between those who never participate and those who participate several times a week. In effect, the first group seems to be more postnationalist than the second one. Likewise, different levels of education are also important determinants. Lower-educated citizens have a positive effect on postnationalism, while citizens who are higher educated present a negative effect on the category of national identity that does not consider any criteria as important. In the same way, unilateralism and multilateralism are characterised by those who prefer that countries do not follow only their interests, and those who prefer that the international bodies do not enforce solutions are more postnationalist than other citizens.
The results regarding citizens demanding both ethnic and civic criteria show that Russia and United States are credentialist, while the Central–Northern European countries—Denmark, France, Germany, Ireland, and Norway, plus Portugal—have a low level of credentialist sentiment. Political orientation plays an important role in credentialist national identity. Indeed, those who are more conservative are credentialist, while left-wing political orientation negatively affects credentialism. Age does not show a significant effect, except for citizens older than 55 years old. Religion and assiduousness in religious events are key factors for being credentialist as Christians, such as Catholics, Protestants, and other Christian religions, are likely to be credentialist, while agnostics, Jews, Muslims, and those who profess other religions are not credentialist. Likewise, higher incomes positively affect the credentialist category, while lower levels of income have a negative effect. In the same way, women and native citizens are found to be more credentialist than men and foreign citizens. Main status and education level are important factors as well. Paid workers and students are not credentialist, and retired citizens are credentialist. Likewise, lower-educated citizens are credentialist, while higher educational levels negatively affect credentialist sentiment. Furthermore, there is a difference between citizens that demand that others must adapt to society and those who prefer that others maintain their traditions. Indeed, the first one positively affects the credentialist group, while the second one has a negative effect.
Table 5 shows the marginal effects on postnationalist, credentialist, and civic-oriented models. National identity based on ethnic criteria did not show any significant coefficient, so it was excluded from the analysis. The analysis first starts with postnationalism, and it can be seen that postnationalism does not show a significant change in the two waves analysed. Central–North European countries are found to be more postnationalist than average, while Portugal and the United States have a 0.16% negative marginal effect on this category. Far-left political orientation has a 0.5% positive marginal effect, but rightist citizens are 0.6 less postnationalist than average. The age of a citizen can affect the probability of being a postnationalist or not. Those younger than 55 are more postnationalist (0.15% more or less) than those older than 75 (−0.56%). In more postnationalist groups, the results show that agnostic citizens (0.53%) and those who profess other Christian religions (0.6%) tend to be postnationalist, while Catholics are less postnationalist than average (−0.30%). Those who perceive higher incomes and males are more postnationalist than average (0.83% and 0.19%, respectively). Student status increases the probability of being postnationalist by 0.04%, while paid workers and retirees have negative effects on not considering any criteria (both by about 0.10%). The time that a citizen spends in religious events also has a marginal effect on postnationalism, as the more assiduous are less postnationalist than average (−0.51%), and those who never attend religious events show a positive marginal effect at 0.22%. Education and traditions show significant marginal effects on postnationalism. Non-educated citizens and those who demand that others must adapt to larger society have negative marginal effects, at 0.365% and 0.15%, respectively. Native citizens have a 0.01% negative marginal effect on postnationalism, while foreign citizens are more postnationalist (about 0.4%) than average. No-unilateralism and no-multilateralism present similar marginal effects on postnationalism, at 0.91% and 0.84%, respectively.
Table 5.
Probit model. Marginal effects.
Nevertheless, considering credentialist national identity, the results show that after a decade in the countries analysed, citizens have become more credentialist. Central–North Europe countries and Russia are less credentialist than the average citizen, while Ireland (3.19%), Spain (5.52%), Great Britain (2.37), and the United States (0.8%) are more credentialist than the average. On the left and right, the two extreme political ideologies are less credentialist than average, respectively, at −3.2% and −5.52%. Meanwhile, more moderate citizens such as Liberals and Conservatives present 4.2% and 7.31% positive marginal effects. All age groups are less credentialist than the average, except the group between 55 and 64 years old, which is 3.08% more credentialist than the average. Agnostic and Protestants present negative marginal effects, at −12.32 and −0.79%, respectively, while Jewish (0.56%), Islamic (1.23%), and members of other religions (1.06%) are more credentialist than average. Income and gender do not present significant effects, except for the seventh category of income (medium-high) and males, who are less credentialist than the average. Citizens who are native, not formally educated, and who attend religious events one or several times a week are more credentialist than the average, while those citizens who never go to religious events, students, and retirees show negative marginal effects. The traditions variable does not present differences between those who prefer that others adapt to a larger society and those who prefer that others maintain their tradition. Both groups seem to be less credentialist than the average, but the credentialist intensity is higher in those citizens who are more respectful of other traditions. Citizens who prefer that countries do not follow only their interests and those who prefer that the international bodies do not enforce solutions are less credentialist than the average, while those in favour of international bodies’ enforcement are more credentialist than the average (about 0.70%).
Finally, the analysis of the civic-oriented citizens shows that citizens were more civic-oriented in 2013 than in 2003. Central–North European countries show positive marginal effects, while Ireland, Portugal, Russia, and Spain show negative effects in this category. Leftist and Liberal citizens are also more civic-oriented than the average. All age groups are more civic-oriented than the average, except for the older than 75 years old group, which has a negative marginal effect of −0.94%. Likewise, agnostics, Muslims, and those who profess other religions are more civic-oriented than the average, while Protestant and Jewish citizens have marginal effects of −0.34 and −0.03, respectively. Income is not significant, except for the seventh category, which has a significant positive marginal effect. Men, natives, and non-educated citizens show negative effects, while paid workers and students are 0.15% and 0.13% more civic-oriented than the average. Those who prefer that others adapt to a larger society show negative marginal effects, but those who prefer that others maintain their traditions are 0.20% more civic-oriented than the average. Finally, the no-unilateralism position seems to be consonant with being more civic-oriented than the average, and multilateralism shows negative marginal effects.
7. Discussion
7.1. National Identies Constructs
The EFA and MGCFA confirm Kunovich’s [3] results. National ethnic identity is based on concepts related to ethnic and cultural heritage. Indeed, the ethnic criteria are being born in the country, being a citizen of the country, having lived most of the time in the country, professing the predominant religion, and having ancestors. Ethnic–national identity is often based on some political and social movements, such as Celtic nationalists [48], in post-Soviet countries [49], or in Asian societies [18]. However, ethnic–national identity is also often used as a slogan—for example, fascism in Italy and Nazism in Germany. Taking advantage of the post-war identity crisis, Hitler and Mussolini underlined the importance of overcoming the enemy that undermined the national status of the people [50].
Furthermore, the latest political debates have animated the sentiment of the ethnonationalism of Marine Le Pen, Matteo Salvini, Santiago Abascal, and Viktor Orban against immigration as they consider it a threat to the identity and economic stability of the country [51]. On the other hand, civic national identity represents liberal principles of the countries in Northern European countries and the United States, overcoming race, ethnicity (language and culture), sex, religion, or place of birth [12,51]. The civic dimension gives importance to speaking the country’s language, being a citizen of the country, and, above all, respecting the laws and institutions of the country.
The analysis of the ethnic dimension showed that most respondents, 84.2%, attribute medium or high importance to the five criteria included in the factor. Therefore, the concept of the national identity of the majority of citizens included in this dimension coincides with the speeches of European nationalist leaders [52]. On the other hand, most of the citizens included in the civic dimension, 60%, argue that speaking the language, respecting the laws and institutions, and feeling the relevant nationality are also very important criteria.
Despite this, the results show that the ethnic/civic dichotomy of national identity can be further extended in a two-dimensional continuum space. The Fuzzy Eco-Apostle model analyses the importance that each citizen gives to both civic and ethnic criteria. According to Medrano [8], Pehrson [21], and Custodi [5], the results reveal that citizens can construct a concept of national identity as a combination of both criteria or, furthermore, by not limiting it with any criteria. Thus, the most demanding are credentialists, while individuals who do not consider any criteria important are postnationalists [7,8,21,53]. Thus, the apostle model extracts four different categories of national identity: credentialist, postnationalist, civic-oriented, and ethnic-oriented.
Finally, the extension of the Apostle model expands the number of categories to 16. The analysis defines four crucial categories in the study, the pure categories of national identity: pure post-nationalists, pure ethnic-oriented nationalists, pure civic-oriented nationalists, and pure credentialists. The results show that only minorities of 3.7% and 0.3% appear to be pure civic nationalist and pure ethnic nationalist, respectively. Most citizens (75%) can be considered credentialists, although only 23.6% of society can be said to be pure credentialist. Pure postnationalist citizens, genuine representatives of a liberal globalised world, comprise only 1.7% of the sample.
7.2. Socioeconomics Effects on National Identities Constructs
The results of the binary probit models confirm that some socio-economic characteristics can influence the national identity of citizens [52,53,54,55]. According to Simonsen [56], the nationalism of the northern countries of Europe is based on liberal and democratic principles. Thus, a Northern European nationalist demands that national identity is based on respect for the laws, the institutions, the feeling of belonging, and the language of a country. For example, the Danish model described by Mouritsen [57] affirms that Danish politics shifts from the liberalism of equal rights and opportunities to a more jarring culture of civic perfectionism. Mouritsen [57] affirms that Danish society increasingly demands that “others” reform themselves as autonomous citizens and adapt to public practices and norms, verifying a certain transnational political learning through tests of nationality and civics.
On the other hand, the results show that some countries analysed tend to be more postnationalist, such as Ireland and Spain. Both countries show a negative association with civic values, and although the results cannot affirm a relationship with the ethnic values of nationalism, other studies affirm that Ireland is more ethnonationalist [53,58]. This ethnonationalism can be explained by the fact that the Irish have always fought for the self-government of their Christian values independent of the British Protestant power [58].
The results regarding political orientation identify a polarisation of the two opposing camps: conservatives and right-wing extremists are more demanding (credentialists), while leftist nationalism loosens its ethnic dimension and supports a liberal nationalism based on civic criteria. Despite this, far-left citizens seem to be more postnationalist. In agreement with Custodi [5], they base national identity on inclusiveness and moral community criteria.
However, country and political orientation are not the only determinants of national identity. For example, education and religion are equally contributing factors to national identity. According to Hjerm [59], people with low levels of education appear to take into account both ethnic and civic criteria, while the increase in education levels is not associated with nationalist sentiments linked to ethnic criteria. The latter can be explained by the fact that education encourages respect and knowledge of other cultures, ethnic groups, and countries [59]. The religion of the citizens, on the other hand, can differentiate the type of national identity that is taken into consideration. Agnostics are represented by the category of postnationalists. In fact, not professing any religion does not establish that bond of belonging based on a religious tradition and culture. Those who profess no religion tend to establish a national identity based on inclusiveness criteria and the moral community defined by [5]. On the contrary, there is a cultural, ethnic, and civic bond linked to the concept of national identity among Christians. Thus, in agreement with Grosby [60], the Catholic identity recognises and legitimates the idea that citizens develop a nationalist sentiment around an ethnic–cultural dimension.
8. Conclusions
The study analysed national identity through innovative and alternative approaches not commonly used in social science. The paper aims to go beyond the classic ethnic–civic dichotomy of national identity [1,3,17], analysing how citizens can consider national identity as a combination of both [8] or without taking into account one of the two criteria [5].
The EFA and the MGCFA were adopted to verify the two dimensions of national identity and whether these fit the data used in the study. The results confirmed the duality of national identity under ethnic and civic criteria [3]. Thus, the Fuzzy-Eco Apostle Model was used to determine whether citizens consider both civic or ethnic criteria, one dimension, or neither of them. This new approach is more flexible than MGCFA and adequately addresses the vague information provided by Likert or semantic scales. The new approach can analyse national identity at an individual level. Therefore, we consider that FST-based methods can also be a suitable tool for analysing social science topics that can be conveniently applied in the future.
The results showed that most citizens see national identity as a combination of ethnic and civic criteria. They are mainly credentialist, neither civic nor ethnic-oriented citizens [8]. Furthermore, binary probit models have been estimated to analyse the influence of some socioeconomic covariates on national identity. These covariates appear to be good predictors of national identity. Thus, country, age, political orientation, income, and education are all important influencing factors.
As with any other study, future research is needed to overcome some existing limitations. Firstly, the analysis is based only on two waves of the ISSP, and it could be interesting to extend it to other subsequent waves to analyse whether the national identity of citizens has changed over the last few years. Secondly, the model is based on an alpha coefficient of 0.5, and the adoption of other alpha parameters could help to analyse the robustness of the results. Finally, the study included only a few socioeconomic covariates, and it could be interesting to test how other characteristics, such as citizens’ attitudes towards climate change or wars, influence national identity.
Author Contributions
Conceptualisation, J.C.M., and A.I.; methodology, J.C.M.; software, J.C.M., and A.I.; validation, J.C.M. and A.I.; investigation, J.C.M. and A.I.; data curation, J.C.M. and A.I.; writing—original draft preparation, J.C.M. and A.I.; writing—review and editing, J.C.M. and A.I. All authors have read and agreed to the published version of the manuscript.
Funding
This research received no external funding.
Institutional Review Board Statement
Not applicable.
Informed Consent Statement
Informed consent was obtained from all subjects involved in the study.
Data Availability Statement
Data available on http://www.issp.org/data-download/by-topic/ (accessed on 15 June 2021).
Conflicts of Interest
The authors declare no conflict of interest.
Appendix A
Table A1.
Probit model. Coefficients for ethnic, civic, postnationalist, and credentialist.
Table A1.
Probit model. Coefficients for ethnic, civic, postnationalist, and credentialist.
| Covariate | Ethnic | Civic | Postnationalist | Credentialist | ||||
|---|---|---|---|---|---|---|---|---|
| 2003 | 0.1204 | ** | 0.0161 | * | −0.0183 | 0.0086 | ||
| 2013 | −0.1232 | ** | 0.0164 | * | 0.0188 | −0.0088 | ** | |
| Denmark | 0.3287 | 0.0523 | *** | −0.2533 | ** | −0.0956 | *** | |
| France | 0.7604 | 0.0400 | *** | −0.3778 | *** | −0.2755 | *** | |
| Germany | 0.1645 | 0.0434 | *** | 0.1821 | ** | −0.1582 | *** | |
| Ireland | 1.3257 | 0.1396 | *** | 0.6839 | *** | −0.9097 | ** | |
| Norway | −2.8252 | 0.0472 | *** | −0.3857 | *** | −0.1036 | * | |
| Portugal | −3.0034 | 0.0765 | ** | −0.0699 | −0.0767 | *** | ||
| Russia | 1.1756 | 0.0842 | *** | 0.0654 | 0.7687 | *** | ||
| Spain | 0.4266 | 0.0709 | * | 0.5143 | *** | −0.1954 | ||
| Great Britain | 1.4043 | 0.0906 | −0.0117 | 0.0825 | *** | |||
| United States | 0.4560 | 0.0554 | −0.0689 | 0.6697 | ** | |||
| Far left | −0.0233 | 0.0607 | 0.2004 | ** | −0.1233 | |||
| Left-Center | −0.0819 | 0.0283 | *** | −0.0141 | −0.0356 | |||
| Center-Liberal | 0.0903 | 0.0389 | 0.0490 | −0.0216 | *** | |||
| Right | −0.0707 | 0.0312 | * | −0.2648 | *** | 0.0952 | *** | |
| Far Right | 0.1295 | 0.1326 | ** | 0.0261 | 0.3650 | |||
| 24 years or under | 0.1135 | 0.1637 | 0.0830 | *** | −0.1093 | *** | ||
| 25–34 years | 0.0378 | 0.1450 | 0.0538 | −0.1124 | *** | |||
| 35–44 years | −0.2006 | 0.1428 | 0.0911 | −0.1820 | *** | |||
| 45–54 years | −0.0051 | 0.1426 | 0.0622 | −0.0780 | ** | |||
| 55–64 years | 0.0183 | 0.1427 | 0.0449 | 0.0621 | *** | |||
| 65–74 years | 0.1241 | 0.1456 | −0.0836 | 0.1051 | *** | |||
| 75 years or over | 0.0898 | 0.1546 | −0.2402 | 0.2710 | *** | |||
| No religion | −0.0947 | 0.0324 | * | 0.2285 | ** | −0.4644 | *** | |
| Catholic | 0.1492 | 0.0301 | −0.1343 | 0.1181 | *** | |||
| Protestant | 0.1478 | 0.0338 | * | −0.0312 | *** | 0.2469 | * | |
| Other Christians | −0.0885 | 0.0756 | 0.0133 | ** | 0.0911 | *** | ||
| Jewish | −3.5064 | 0.1920 | 0.0769 | −1.1207 | *** | |||
| Islamic | 0.7862 | 0.0956 | ** | −0.0157 | −0.8728 | *** | ||
| Other Religions | 0.1091 | 0.1237 | 0.2561 | −0.5038 | ||||
| Inc_Bottom | −0.0002 | 0.1240 | 0.3990 | 0.0664 | ||||
| Inc2 | 0.2149 | 0.1106 | 0.0973 | −0.0327 | ||||
| Inc3 | −0.0550 | 0.0633 | 0.1025 | −0.0614 | ** | |||
| Inc4 | −0.0176 | 0.0513 | 0.0448 | *** | −0.0852 | ** | ||
| Inc5 | 0.0545 | 0.0348 | −0.0074 | −0.0566 | ||||
| Inc6 | 0.0793 | 0.0289 | −0.0200 | 0.0075 | ||||
| Inc7 | −0.0661 | 0.0363 | −0.2376 | −0.0002 | ||||
| Inc8 | 0.0714 | 0.0475 | −0.0840 | 0.0331 | ||||
| Inc9 | −0.0327 | 0.1006 | 0.1880 | 0.1095 | *** | |||
| Inc High | 0.3385 | . | 0.1276 | 0.3570 | *** | 0.3615 | * | |
| Male | 0.0149 | 0.0507 | 0.0814 | −0.0237 | * | |||
| Female | −0.0106 | 0.0498 | −0.0656 | 0.0194 | *** | |||
| Citizen (Y) | 0.0178 | 0.0034 | ** | −0.0056 | ** | 0.0103 | *** | |
| Citizen (N) | 0.1903 | 0.0630 | *** | 0.1526 | −0.2396 | *** | ||
| In paid work | 0.0914 | . | 0.0201 | −0.0133 | ** | −0.0390 | ||
| Unemployed | −0.0343 | 0.0663 | 0.0613 | * | −0.0126 | *** | ||
| Student | −0.1849 | 0.0696 | 0.0186 | −0.3376 | *** | |||
| Retired | −0.1218 | 0.0529 | −0.0572 | 0.1258 | *** | |||
| Other | −0.0831 | 0.0560 | 0.1677 | 0.1278 | *** | |||
| Disagree strongly (CI) | −0.0255 | 0.0508 | *** | 0.3923 | −0.2627 | *** | ||
| Disagree (CI) | −0.1901 | 0.0295 | ** | 0.0320 | −0.1583 | *** | ||
| Indifferent (CI) | 0.0014 | 0.0301 | 0.1489 | −0.1010 | *** | |||
| Agree (CI) | 0.0202 | 0.0227 | −0.1238 | 0.0518 | *** | |||
| Agree strongly (CI) | 0.1435 | 0.0433 | * | −0.1258 | 0.3331 | *** | ||
| Never | −0.1199 | 0.0268 | 0.0938 | ** | −0.1964 | *** | ||
| Once a year or less | −0.0133 | 0.0239 | 0.0570 | −0.0667 | *** | |||
| Several times a year | 0.0039 | 0.0377 | −0.0414 | *** | 0.0935 | *** | ||
| One to three times a month | 0.1084 | 0.0560 | −0.0906 | 0.2183 | *** | |||
| Once or several times a week | 0.1991 | * | 0.0542 | −0.2212 | *** | 0.3341 | *** | |
| No formal education | −0.0542 | 0.1063 | −0.1557 | *** | 0.2712 | *** | ||
| Primary school | −0.2872 | 0.0999 | −0.3594 | * | 0.1782 | *** | ||
| Lower secondary | 0.1268 | 0.0302 | *** | 0.0368 | 0.1215 | * | ||
| Upper secondary | 0.0853 | 0.0311 | ** | −0.0369 | ** | 0.0446 | ||
| Post secondary | −0.0534 | 0.0374 | 0.0377 | 0.0149 | *** | |||
| Lower level tertiary | 0.0256 | 0.0271 | *** | 0.0757 | −0.2672 | *** | ||
| Maintain traditions | 0.0716 | 0.0255 | 0.0273 | −0.0793 | *** | |||
| Adapt into larger society | −0.0671 | 0.0147 | * | −0.0630 | ** | 0.0587 | ||
| Disagree strongly (Int) | −0.0912 | 0.0812 | 0.3617 | −0.0209 | ||||
| Disagree (Int) | 0.1805 | 0.0475 | 0.0362 | −0.0049 | ||||
| Indifferent (Int) | 0.1337 | 0.0364 | 0.0508 | ** | 0.0021 | *** | ||
| Agree (Int) | −0.0547 | 0.0179 | ** | −0.0541 | −0.0449 | *** | ||
| Agree strongly (Int) | −0.0915 | 0.0293 | 0.0051 | 0.0613 | *** | |||
| Threshold (0→1) | 3.8969 | 0.1480 | *** | 2.3839 | 0.9030 |
***: p value < 0.001; **: p value < 0.01; *: p value < 0.05.
References
- Smith, A.D. National Identity; University of Nevada Press: Reno, NV, USA, 1991; ISBN1 0874172039. ISBN2 9780874172034. ISBN3 0874172047. ISBN4 9780874172041. [Google Scholar]
- Bonikowski, B.; DiMaggio, P. Varieties of American Popular Nationalism. Am. Sociol. Rev. 2016, 81, 949–980. [Google Scholar] [CrossRef]
- Kunovich, R.M. The sources and consequences of national identification. Am. Sociol. Rev. 2009, 74, 573–593. [Google Scholar] [CrossRef]
- Theiss-Morse, E. Who Counts as an American? The Boundaries of National Identity; Cambridge University Press: Cambridge, UK, 2014. [Google Scholar] [CrossRef]
- Custodi, J. Nationalism and populism on the left: The case of Podemos. Nations Natl. 2021, 27, 705–720. [Google Scholar] [CrossRef]
- Davidov, E. Measurement equivalence of nationalism and constructive patriotism in the ISSP: 34 countries in a comparative perspective. Polit. Anal. 2009, 17, 64–82. [Google Scholar] [CrossRef]
- Reeskens, T.; Hooghe, M.; Meuleman, B. Beyond the civic-ethnic dichotomy: The nature of citizenship concepts in 24 countries. Nations Natl. 2007, 16, 579–597. [Google Scholar] [CrossRef]
- Medrano, J.D. Nation, Citizenship and Immigration in Contemporary Spain. Int. J. Multicult. Soc. 2005, 7, 133–156. [Google Scholar]
- Kohn, H. The Idea of Nationalism: A Study in Its Origins and Background; Transaction Publishers: Piscataway, NJ, USA, 1961. [Google Scholar]
- Cohen, E.S. Globalization and the boundaries of the state: A framework for analyzing the changing practice of sovereignty. Governance 2001, 14, 75–97. [Google Scholar] [CrossRef]
- Smith, A.D. State-making and nation-building. States Hist. 1986, 15, 228–263. [Google Scholar]
- Kaufman, I. Ethnic, affirmation or ethnic manipulation: The case of the Druze in Israel. Natl. Ethn. Polit. 2003, 9, 53–82. [Google Scholar] [CrossRef]
- Zubrzycki, G. “We, the Polish Nation”: Ethnic and civic visions of nationhood in Post-Communist constitutional debates. Theory and Society. Theory Soc. 2001, 30, 629–668. [Google Scholar] [CrossRef]
- Ignatieff, M. Boundaries of pain. New Repub. 1993, 209, 36–39. [Google Scholar]
- Armstrong, J.A.; Greenfeld, L. Nationalism: Five Roads to Modernity. Hist. Theory 1994, 33, 79–95. [Google Scholar] [CrossRef]
- Nedelsky, N. Constitutional nationalism’s implications for minority rights and democratization: The case of Slovakia. Ethn. Racial Stud. 2003, 26, 102–128. [Google Scholar] [CrossRef]
- Brubaker, R. Citizenship and Nationhood in France and Germany; Harvard University Press, Ed.; Harvard University Press: Cambridge, MA, USA, 1992. [Google Scholar]
- Choe, H. National identity and citizenship in the people’s republic of China and the republic of Korea. J. Hist. Sociol. 2006, 19, 84–118. [Google Scholar] [CrossRef]
- Hollinger, D. Postethnic America: Beyond multiculturalism; Hachette UK: London, UK, 2006. [Google Scholar]
- Helbling, M.; Reeskens, T.; Wright, M. The mobilisation of identities: A study on the relationship between elite rhetoric and public opinion on national identity in developed democracies. Nations Natl. 2016, 22, 744–767. [Google Scholar] [CrossRef]
- Pehrson, S.; Brown, R.; Zagefka, H. When does national identification lead to the rejection of immigrants? Cross-sectional and longitudinal evidence for the role of essentialist in-group definitions. Br. J. Soc. Psychol. 2009, 48, 61–76. [Google Scholar] [CrossRef] [PubMed]
- Sarrasin, O.; Green, E.G.T.; Berchtold, A.; Davidov, E. Measurement equivalence across subnational groups: An analysis of the conception of nationhood in switzerland. Int. J. Public Opin. Res. 2013, 25, 522–534. [Google Scholar] [CrossRef][Green Version]
- van Griethuijsen, R.A.L.F.; van Eijck, M.W.; Haste, H.; den Brok, P.J.; Skinner, N.C.; Mansour, N.; Gencer, A.S.; BouJaoude, S. Global patterns in students’ views of science and interest in science. Res. Sci. Educ. 2015, 45, 581–603. [Google Scholar] [CrossRef]
- Marsh, H.W.; Hau, K.T.; Wen, Z. In search of golden rules: Comment on hypothesis-testing approaches to setting cutoff values for fit indexes and dangers in overgeneralizing Hu and Bentler’s (1999) findings. Struct. Equ. Model. 2004, 11, 320–341. [Google Scholar] [CrossRef]
- Hu, L.T.; Bentler, P.M. Cutoff criteria for fit indexes in covariance structure analysis: Conventional criteria versus new alternatives. Struct. Equ. Model. 1999, 6, 1–55. [Google Scholar] [CrossRef]
- Chen, F.F. Sensitivity of goodness of fit indexes to lack of measurement invariance. Struct. Equ. Model. 2007, 14, 464–504. [Google Scholar] [CrossRef]
- Cheung, G.W.; Rensvold, R.B. Structural Equation Modeling: A Evaluating Goodness-of-Fit Indexes for Testing Measurement Invariance. Struct. Equ. Model. A Multidiscip. J. 2009, 9, 233–255. [Google Scholar] [CrossRef]
- Byrne, B.M.; Stewart, S.M. The MACS approach to testing for multigroup invariance of a second-order structure: A walk through the process. Struct. Equ. Model. 2006, 13, 287–321. [Google Scholar] [CrossRef]
- Kumar, H. Some recent defuzzification methods. In Theoretical and Practical Advancements for Fuzzy System Integration; Information Science Reference: Hershey, PA, USA, 2017; pp. 31–48. [Google Scholar]
- Di Nardo, E.; Simone, R. A model-based fuzzy analysis of questionnaires. Stat. Methods Appl. 2019, 28, 187–215. [Google Scholar] [CrossRef]
- Rashidi, Z. A Review of Afghan Nationalism in two Centuries (19th & 20th). Doctoral Dissertation, Istanbul Aydin University Institute of Social Sciences, Istanbul, Turkey, 2019. [Google Scholar]
- Mohsin, M.; Zhang, J.; Saidur, R.; Sun, H.; Sait, S.M. Economic assessment and ranking of wind power potential using fuzzy-TOPSIS approach. Environ. Sci. Pollut. Res. 2019, 26, 22494–22511. [Google Scholar] [CrossRef]
- Martin, J.C.; Bustamante-Sánchez, N.S.; Indelicato, A. Analyzing the Main Determinants for Being an Immigrant in Cuenca (Ecuador) Based on a Fuzzy Clustering Approach. Axioms 2022, 11, 74. [Google Scholar] [CrossRef]
- Martín, J.C.; Moreira, P.; Román, C. A hybrid-fuzzy segmentation analysis of residents’ perception towards tourism in Gran Canaria. Tour. Econ. 2020, 26, 1282–1304. [Google Scholar] [CrossRef]
- Salih, M.M.; Zaidan, B.B.; Zaidan, A.A.; Ahmed, M.A. Survey on fuzzy TOPSIS state-of-the-art between 2007 and 2017. Comput. Oper. Res. 2019, 104, 207–227. [Google Scholar] [CrossRef]
- Behzadian, M.; Khanmohammadi Otaghsara, S.; Yazdani, M.; Ignatius, J. A state-of the-art survey of TOPSIS applications. Expert Syst. Appl. 2012, 39, 13051–13069. [Google Scholar] [CrossRef]
- Kruse, R.; Döring, C.; Lesot, M.J. Fundamentals of Fuzzy Clustering. In Advances in Fuzzy Clustering and Its Applications; John Wiley & Sons: Hoboken, NJ, USA, 2007; pp. 1–30. [Google Scholar]
- Leisch, F. Bagged clustering. Adapt. Inf. Syst. Model. Econ. Manag. Sci. 1999, 51, 11. [Google Scholar]
- D’Urso, P.; De Giovanni, L.; Disegna, M.; Massari, R. Bagged Clustering and its application to tourism market segmentation. Expert Syst. Appl. 2013, 40, 4944–4956. [Google Scholar] [CrossRef]
- D’Urso, P.; Disegna, M.; Massari, R.; Osti, L. Fuzzy segmentation of postmodern tourists. Tour. Manag. 2016, 55, 297–308. [Google Scholar] [CrossRef]
- D’Urso, P.; Disegna, M.; Massari, R.; Prayag, G. Bagged fuzzy clustering for fuzzy data: An application to a tourism market. Knowl.-Based Syst. 2015, 73, 335–346. [Google Scholar] [CrossRef]
- Hu, Y.; Boker, S.M. Latent Differential Equation Models for Binary and Ordinal Data. Struct. Equ. Model. Multidiscip. J. 2019, 24, 52–64. [Google Scholar] [CrossRef]
- Greene, W.H. Econometric Analysis; Pearson: New York, NY, USA, 2018. [Google Scholar]
- Bliss, C.I. The method of probits. Science 1934, 79, 38–39. [Google Scholar] [CrossRef] [PubMed]
- Greene, W.H.; Hensher, D.A. A latent class model for discrete choice analysis: Contrasts with mixed logit. Transp. Res. Part B Methodol. 2003, 37, 681–698. [Google Scholar] [CrossRef]
- Hensher, D.A.; Rose, J.M.; Rose, J.M.; Greene, W.H. Applied Choice Analysis: A Primer; Cambridge University Press: Cambridge, UK, 2015. [Google Scholar]
- Schaefer, V. Nature’s apostles: A model for using ecological restoration to teach ecology. Am. Biol. Teach. 2013, 75, 417–419. [Google Scholar] [CrossRef]
- Gibson, M. Mysticism, Myth and Celtic Identity; Routledge: London, UK, 2013. [Google Scholar]
- Jaskułowski, K. Western (civic) “versus” Eastern (ethnic) Nationalism. The Origins and Critique of the Dichotomy. Polish Sociol. Rev. 2010, 171, 289–304. [Google Scholar]
- Cassels, A. Mussolini and German Nationalism, 1922–1925. J. Mod. Hist. 1963, 35, 137–157. [Google Scholar] [CrossRef]
- Yael, T. Why Nationalism; Princeton University Press: Princeton, NJ, USA, 2020. [Google Scholar]
- Couperus, S.; Tortola, P.D.; Rensmann, L.; Couperus, S.; Tortola, P.D.; Rensmann, L.; Couperus, S.; Tortola, P.D. Memory politics of the far right in Europe Memory politics of the far right in Europe. Eur. Polit. Soc. 2022, 1–10. [Google Scholar] [CrossRef]
- Indelicato, A.; Martín, J.C. Two Approaches to Analyze Whether Citizens’ National Identity Is Affected by Country, Age, and Political Orientation—A Fuzzy Eco-Apostle Model. Appl. Sci. 2022, 12, 3946. [Google Scholar] [CrossRef]
- Aktürk, Ş. Nationalism and Religion in Comparative Perspective: A New Typology of National-Religious Configurations. Natl. Pap. 2022, 50, 205–218. [Google Scholar] [CrossRef]
- Martín, J.C.; Indelicato, A. A DEA MCDM Approach Applied to ESS8 Dataset for Measuring Immigration and Refugees Citizens’ Openness. J. Int. Migr. Integr. 2021, 1–21. [Google Scholar] [CrossRef]
- Simonsen, K.B.; Bonikowski, B. Is civic nationalism necessarily inclusive? Conceptions of nationhood and anti-Muslim attitudes in Europe. Eur. J. Polit. Res. 2020, 59, 114–136. [Google Scholar] [CrossRef]
- Mouritsen, P.; Olsen, T.V. Denmark between liberalism and nationalism. Ethn. Racial Stud. 2013, 36, 691–710. [Google Scholar] [CrossRef]
- Mccaffrey, L.J. American Society of Church History Irish Nationalism and Irish Catholicism: A Study in Cultural Identity A Study in Cultural Identity. Source Church Hist. 1973, 42, 524–534. [Google Scholar] [CrossRef]
- Hjerm, M. Education, xenophobia and nationalism: A comparative analysis. J. Ethn. Migr. Stud. 2001, 27, 37–60. [Google Scholar] [CrossRef]
- Grosby, S. National identity, nationalism, and the catholic church. Sch. Res. Rev. 2016. [Google Scholar] [CrossRef]
Publisher’s Note: MDPI stays neutral with regard to jurisdictional claims in published maps and institutional affiliations. |
© 2022 by the authors. Licensee MDPI, Basel, Switzerland. This article is an open access article distributed under the terms and conditions of the Creative Commons Attribution (CC BY) license (https://creativecommons.org/licenses/by/4.0/).