
Bayesian Networks for Preprocessing Water Management Data


Abstract
:1. Introduction
2. Hybrid Bayesian Networks Based on Fixed Structures: Classification and Regression Models
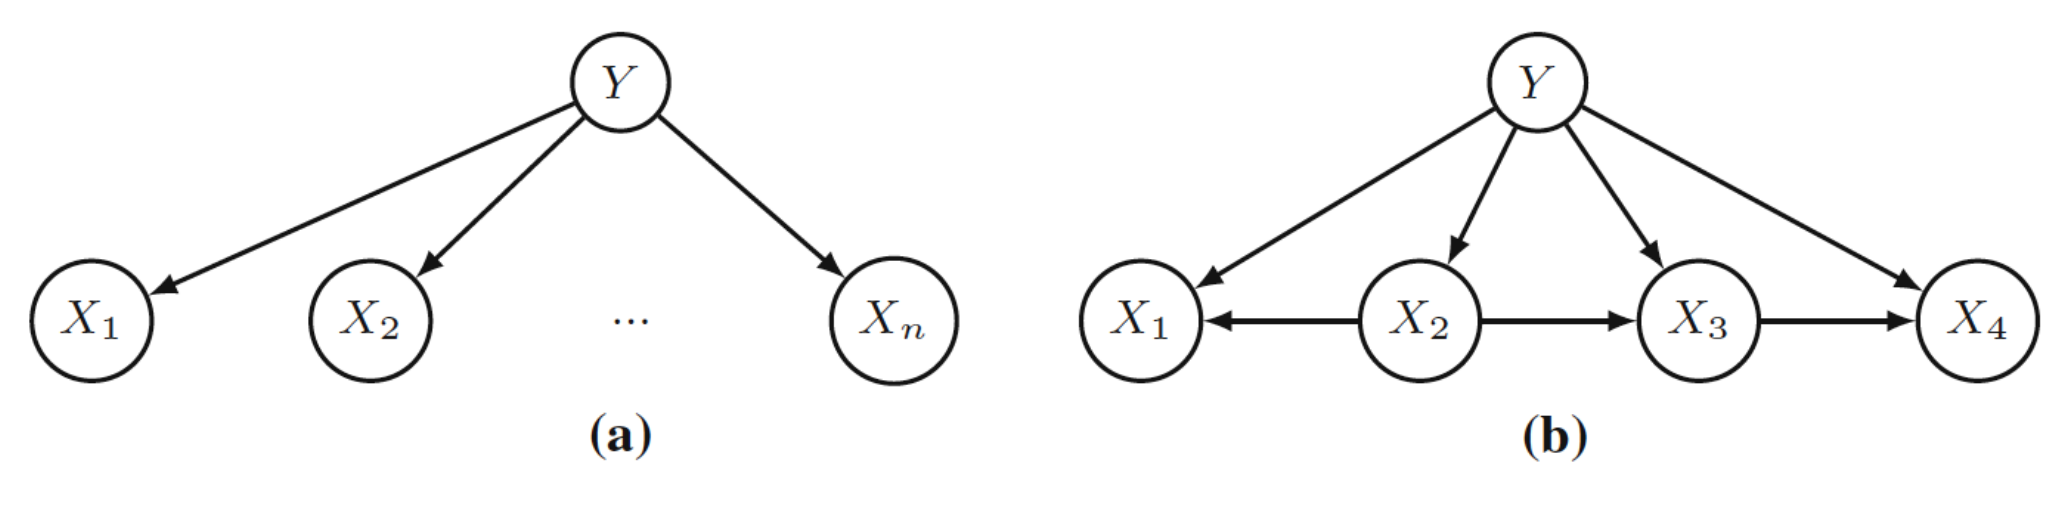
- Naïve Bayes (NB) [45] structure is a BN with a single root node and a set of feature variables with only the root node as a parent. Its name comes from the fact that the feature variables are independent given the root (Figure 2a). It is a naïve assumption that rarely holds in real problems, as feature variables may have direct dependencies.
- Tree-Augmented Naïve Bayes (TAN) [46] structure configures a step beyond NB, since each feature is allowed (but not forced) to have one more parent besides the target variable. This structure is first learnt as a directed tree structure with feature variables, using mutual information with respect to the target variable. In the second step, the relationships between the target variable and each feature are included (Figure 2b).
2.1. Regression Models Based on BN
2.2. Classification Models Based on BN
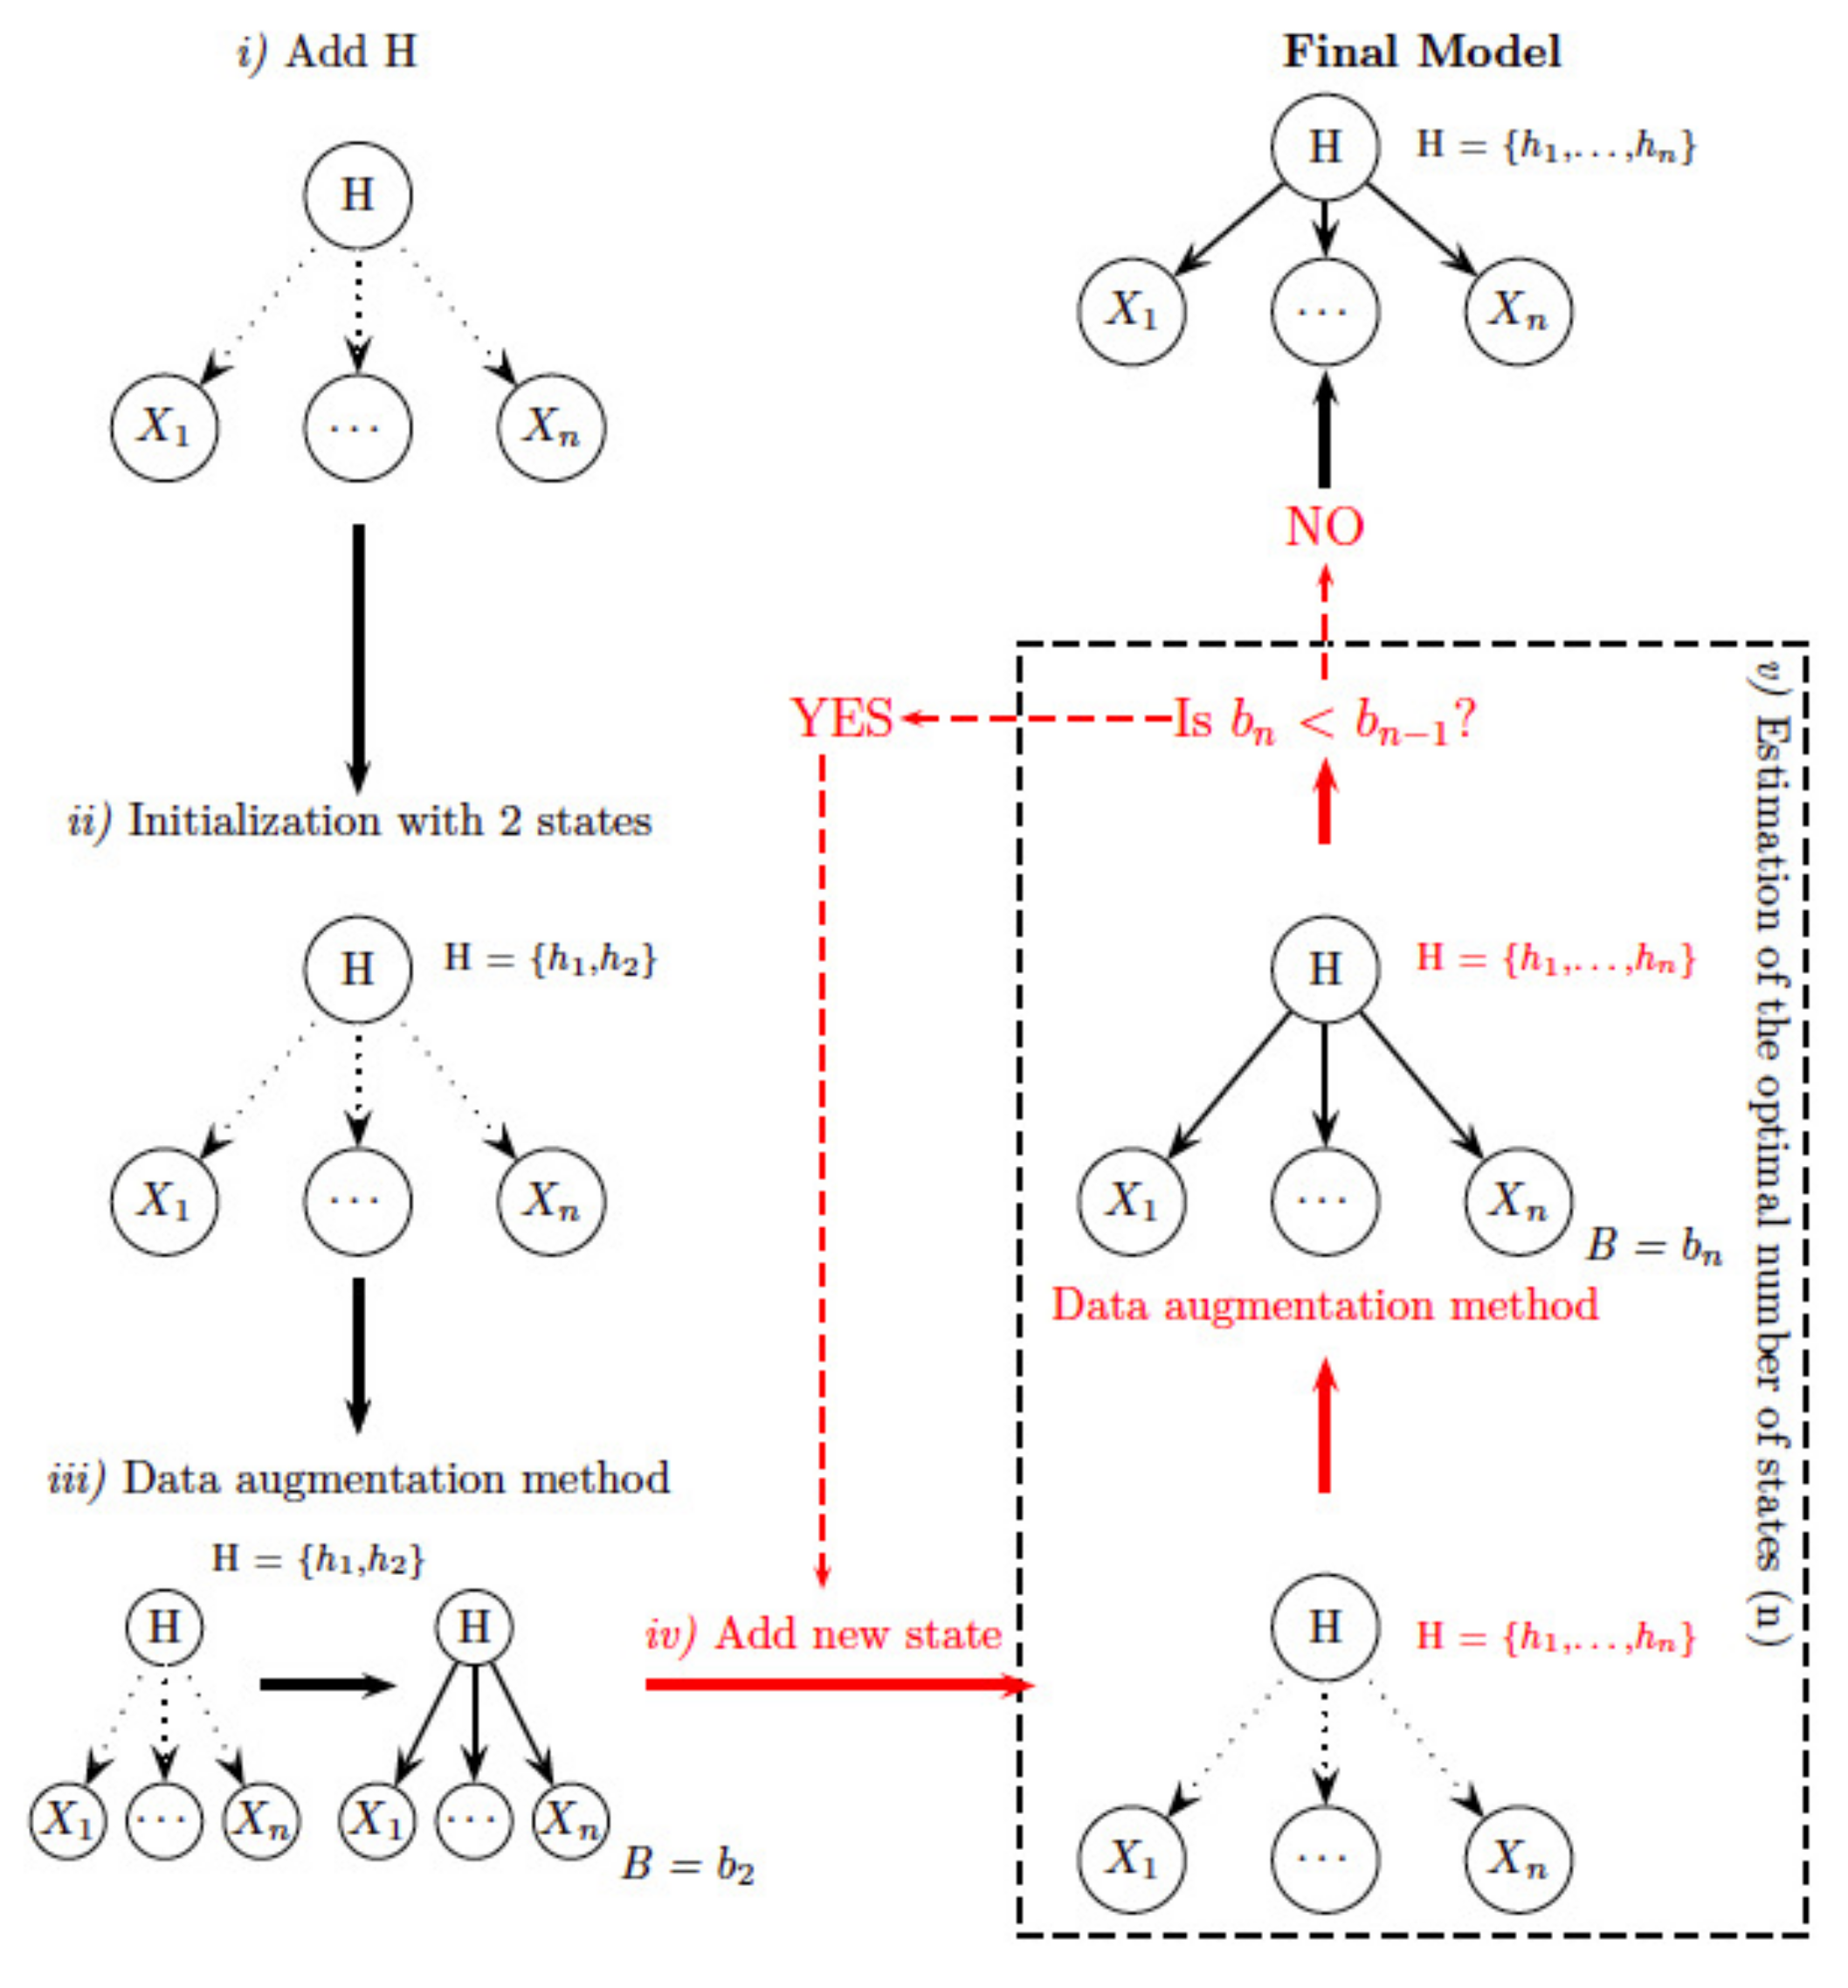
- Estimation of the optimal number of states. Initially the class variable is considered to be a hidden variable, H, whose values are missing, because no information about it is given. The process starts by giving two states for the variable H, uniformly distributed (the same probability value for belonging to both groups). Now, the model is estimated based on an iterative procedure called the data augmentation method [58]: (a) the values of H are simulated for each observation according to the probability distribution of H, updated specifically for the corresponding observation, and (b) the parameters of the probability distribution are re-estimated according to newly simulated data. The BIC score of the model is computed in each iteration, and the process is repeated until there is no improvement. Thus, we have obtained the optimal parameters of the probability distribution function of the model in which the class variable has two states, and its likelihood value. The next step consists of a new iterative process in which a new state is included in variable H by splitting one of the existing states. The model is again re-estimated (by repeating the data augmentation method), and the BIC score is compared with the previous run. The process is repeated until there is no improvement in the BIC score, so the final model achieved will contain the optimal number of states.
- Computing the probability of each observation belonging to each group. Once we have obtained the final model, the next step consists of probability propagation, also called the inference process—for more information, see [41]. In this step, all the available information about the feature variables is input into the model as a new value called evidence, and propagated through the network, updating the probability distribution of the class variable, H. Finally, from this new distribution, the most probable state of the variable H for each data sample is achieved.
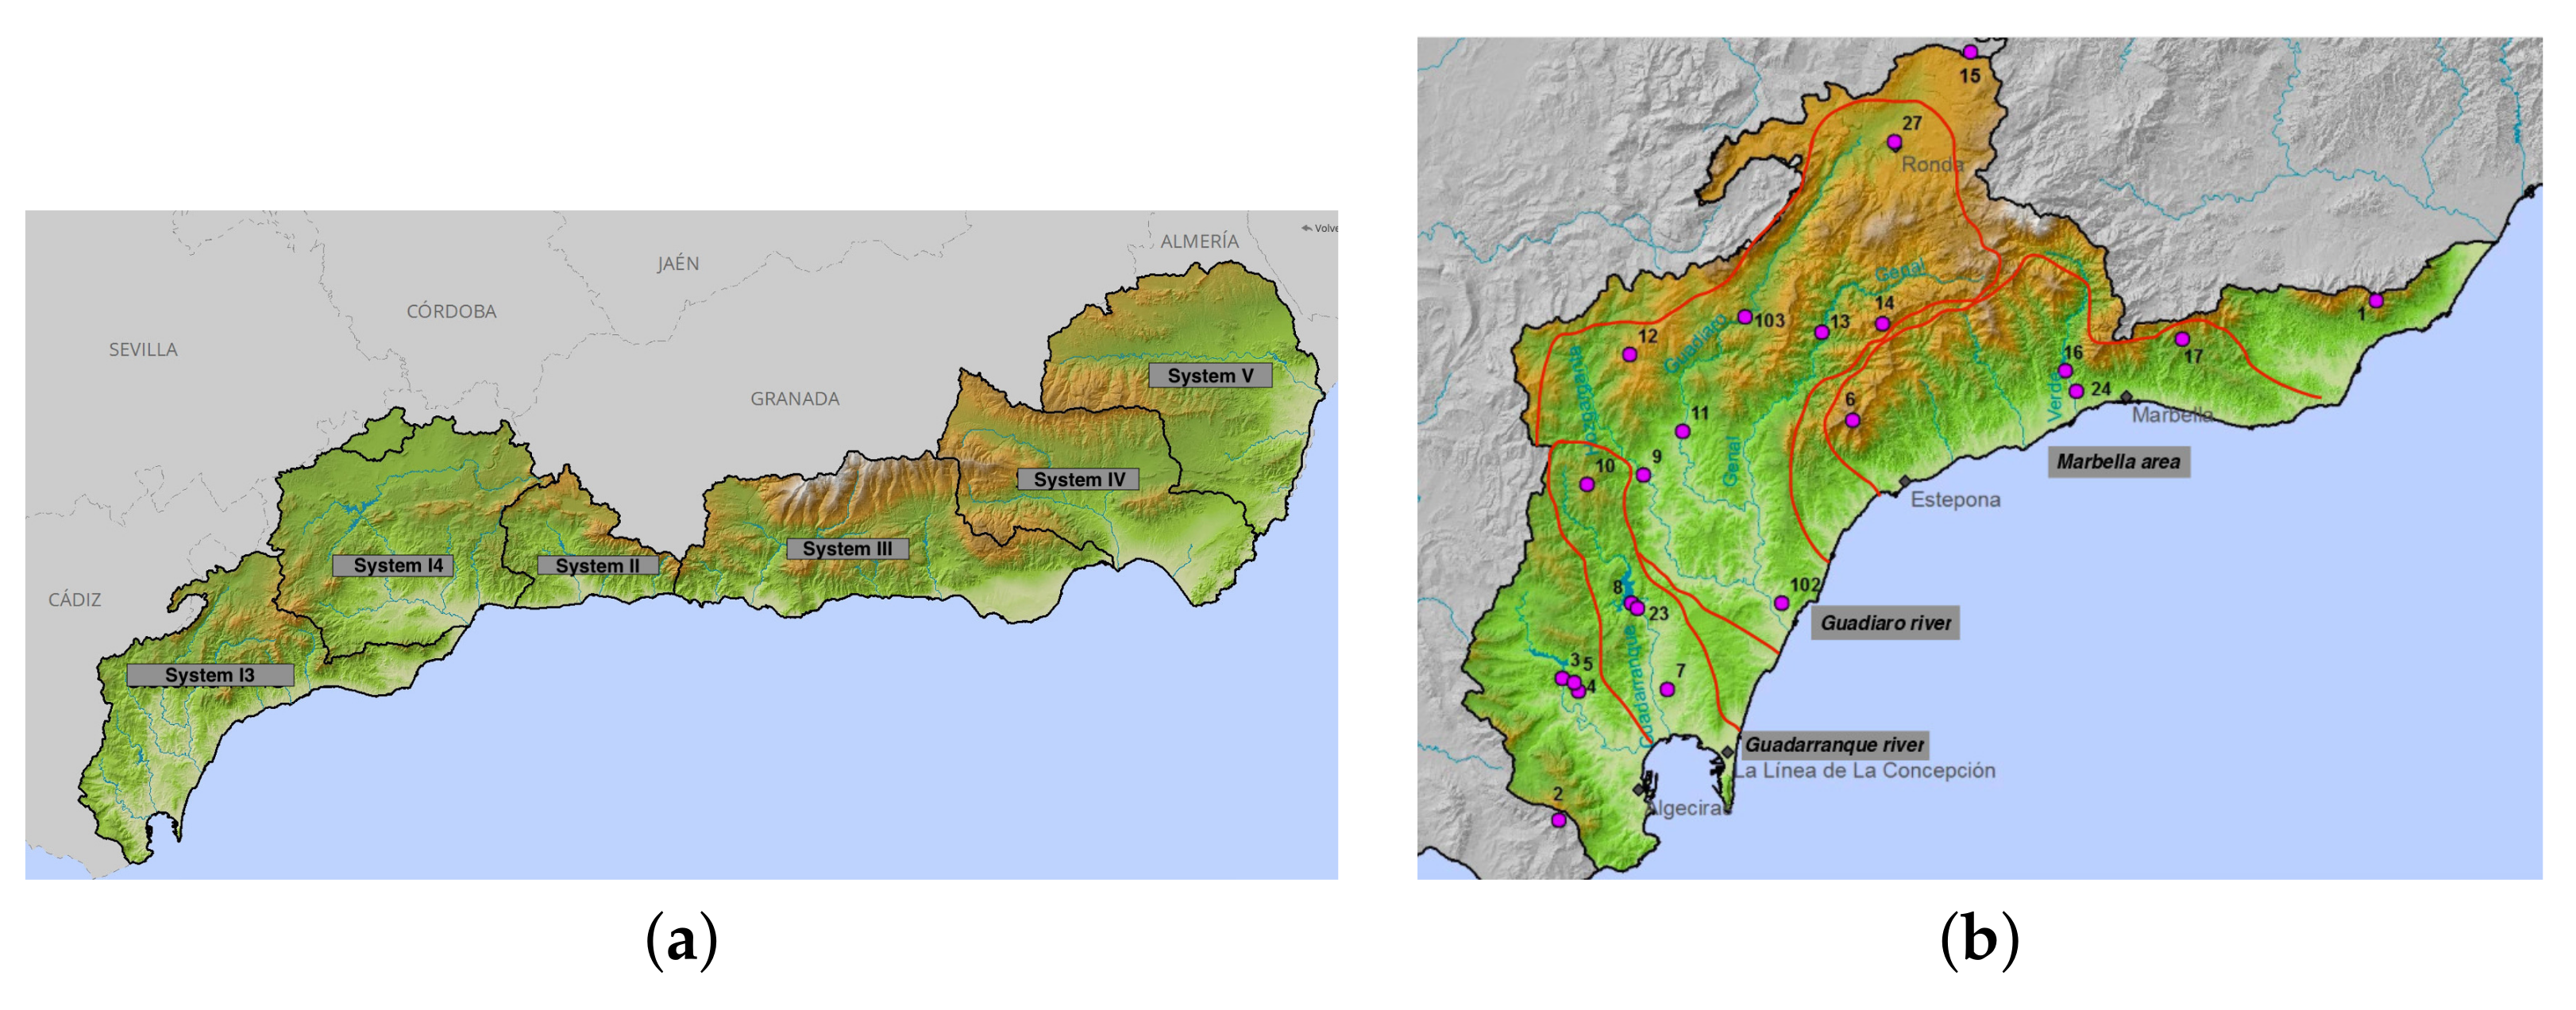
3. Case Study
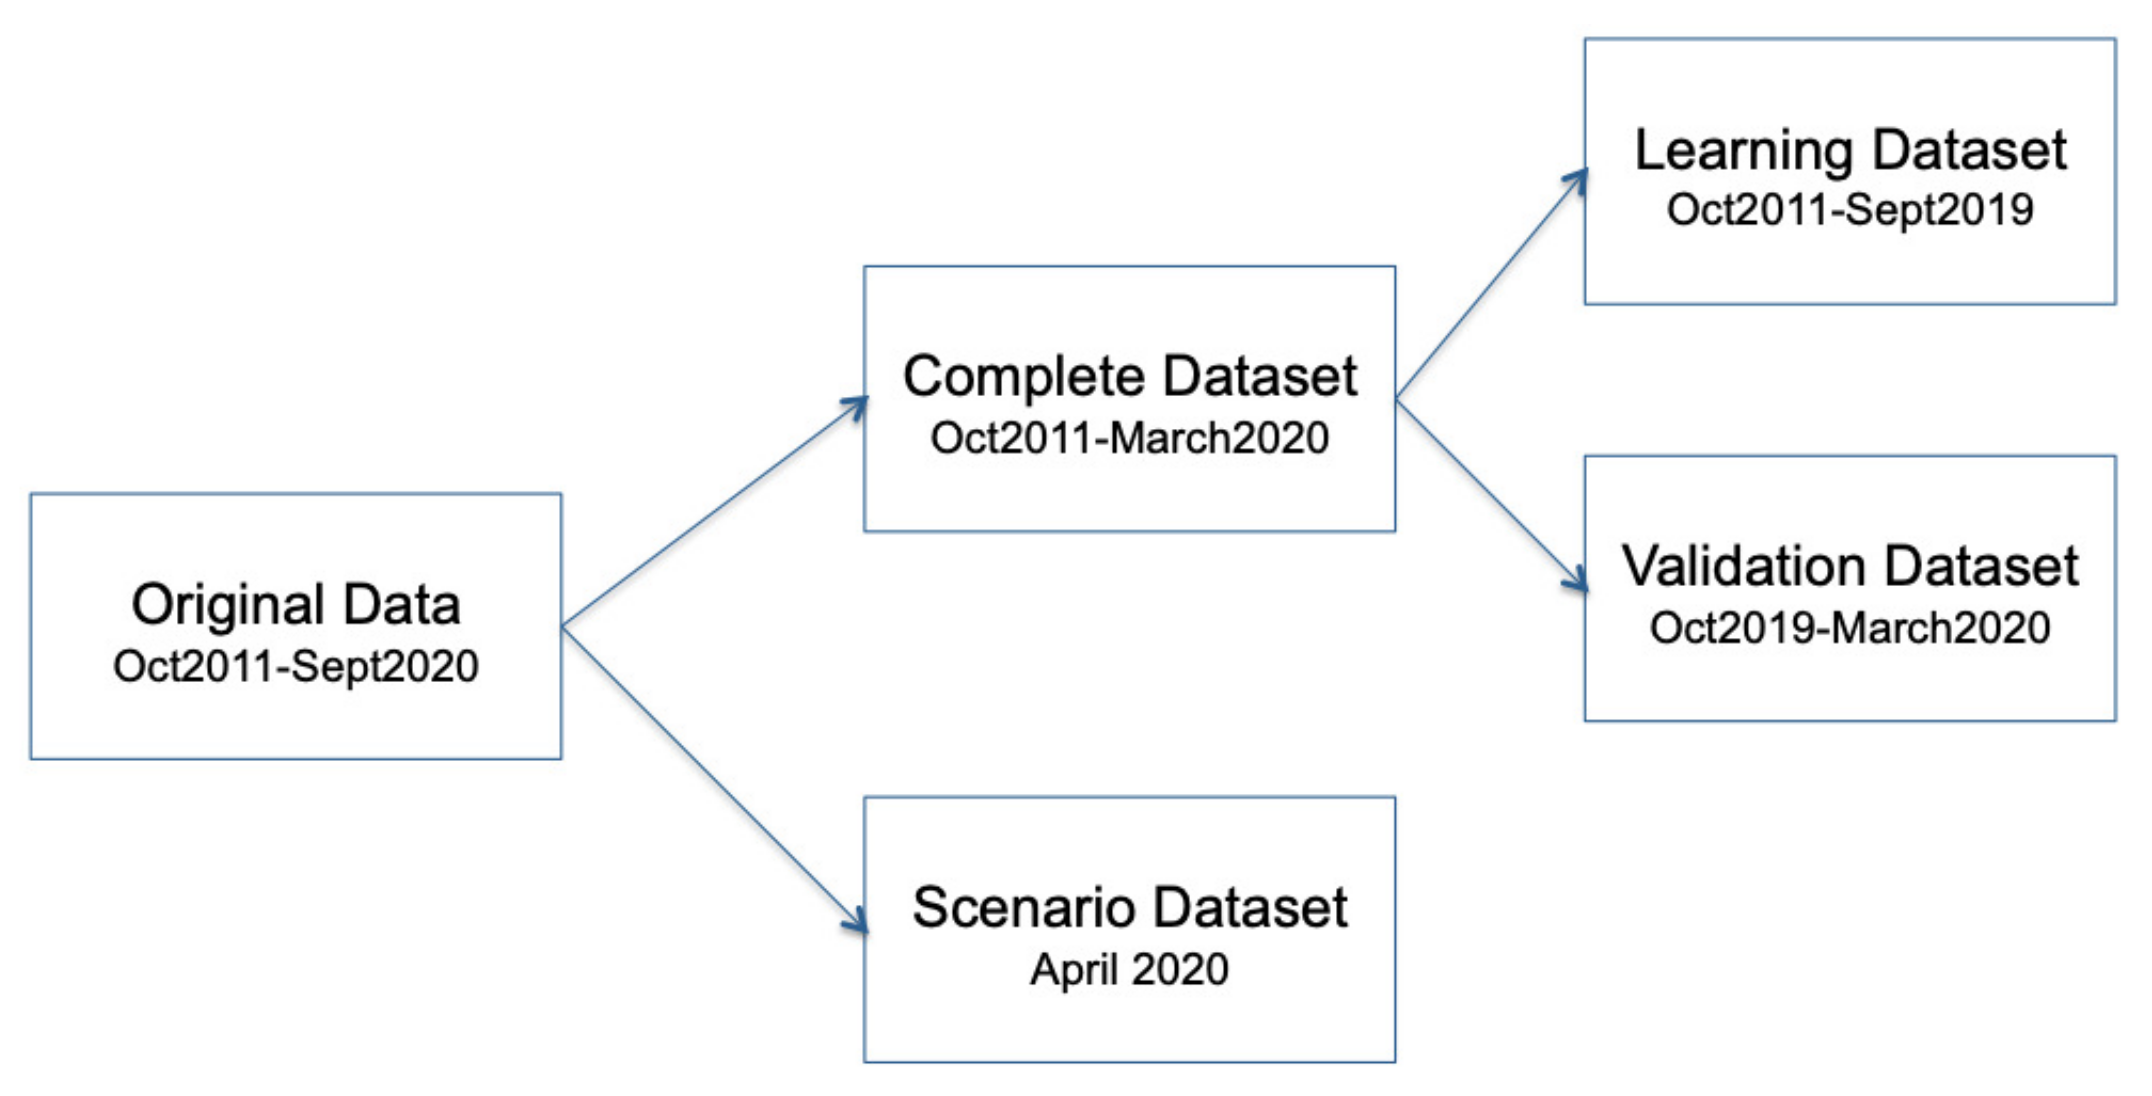
3.1. Data Collection and Preprocessing
3.2. Missing Values: Guadarranque River
- Real data from October 2011 to March 2020;
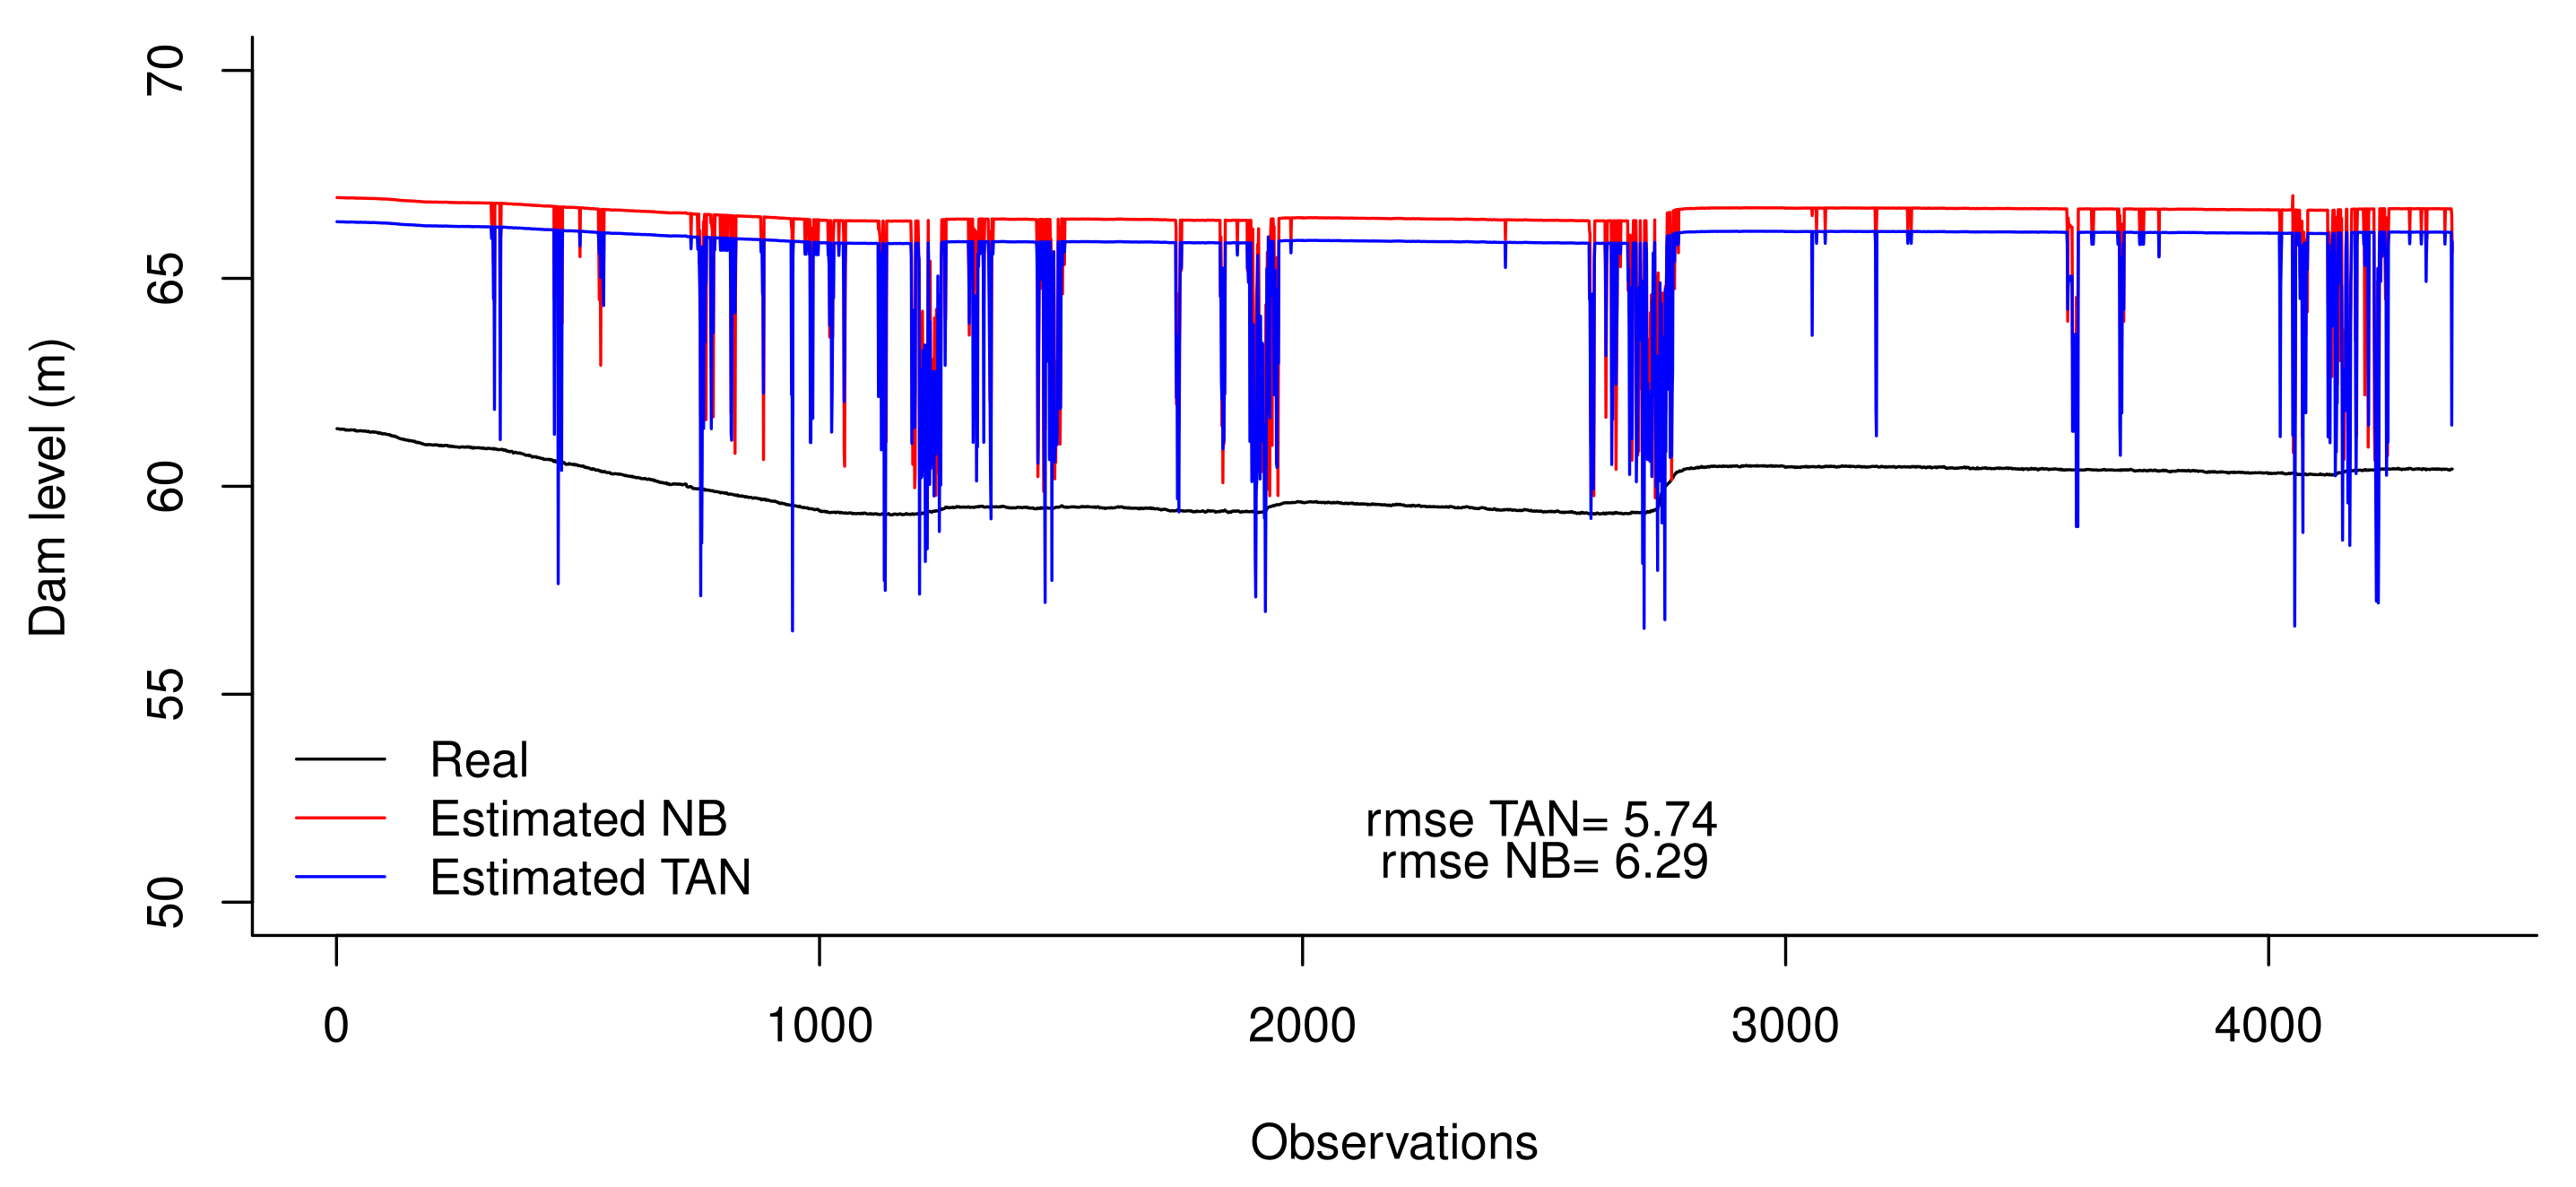
- Imputed data with NB. Using the real dataset above, we considered the last six months were missing, and those values were imputed using the previously described NB model;
- Imputed data with TAN. In this case, six months with missing values were imputed using the TAN model, as previously described.
3.3. Lack of Information: Guadiaro River and Marbella Area
4. Results and Discussion
4.1. The Guadarranque River
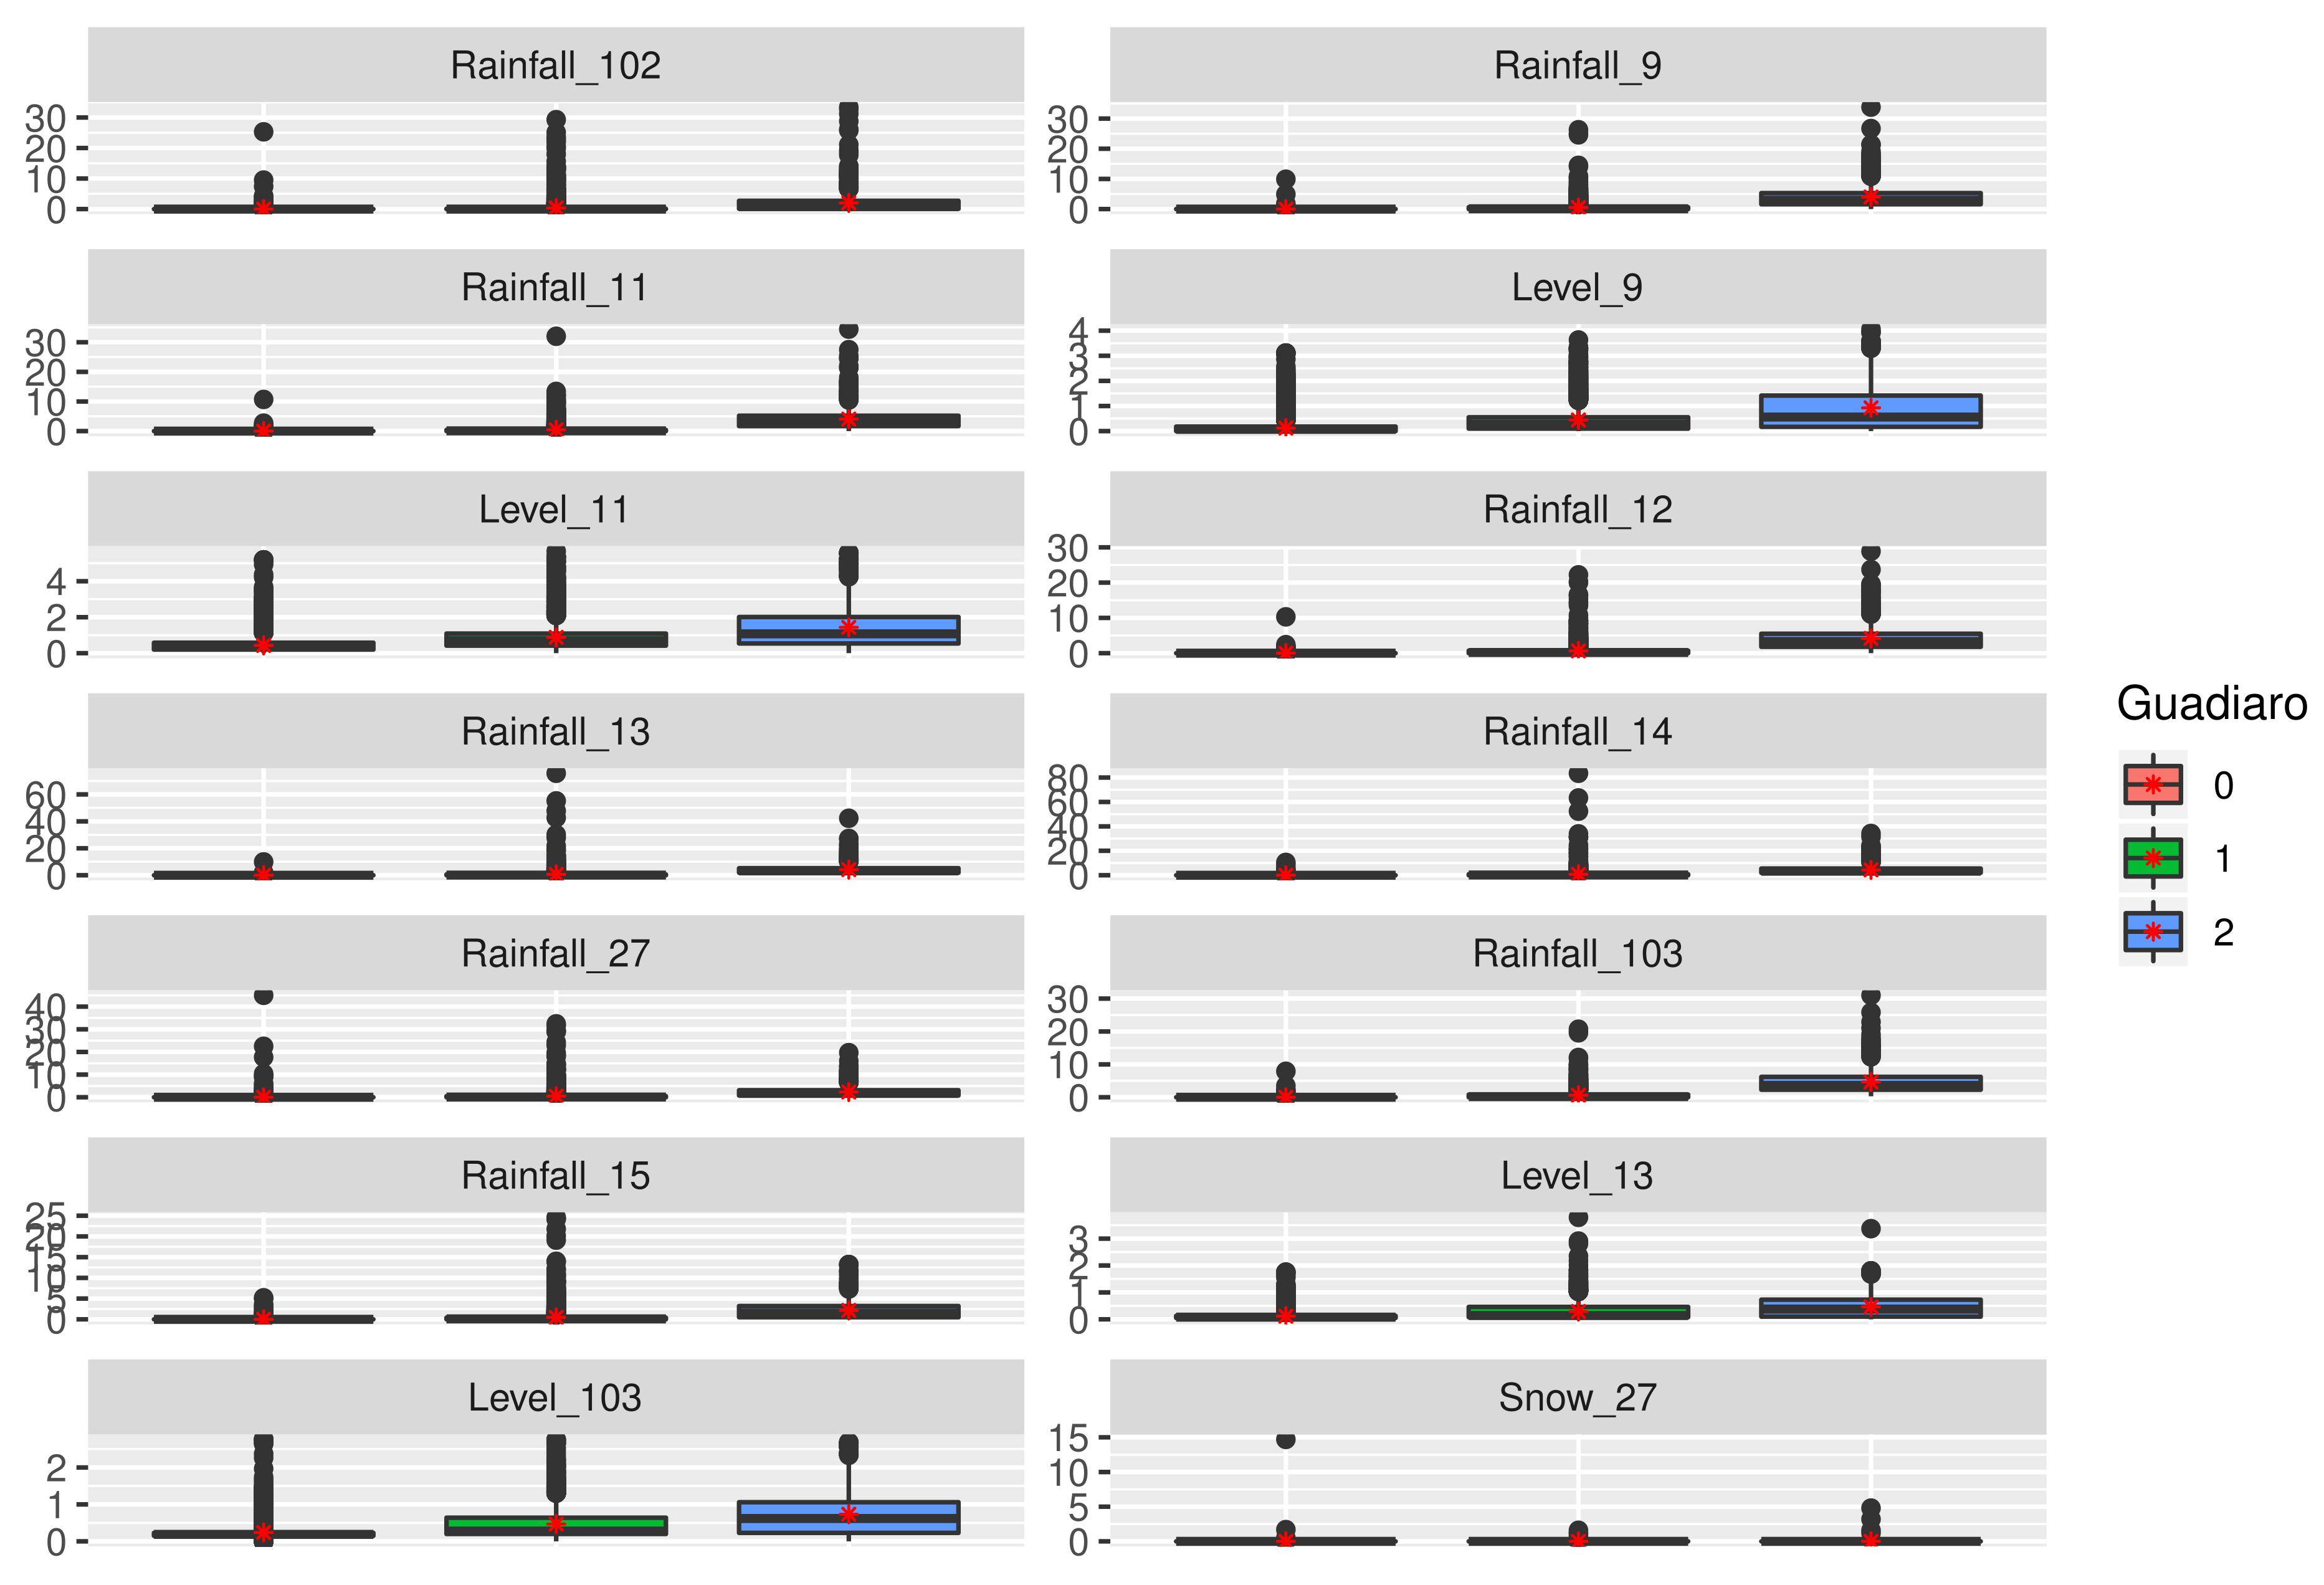
4.2. The Guadiaro River
- Cluster 0. This sector (or cluster) includes most of the observations (Table 5). Rainfall variables are really low, with values around 0, which implies river variables also keep low levels. This cluster could be called a “dry situation” or even “normal situation”. Even when this area comprises one of the highest rainfall values, it is in a Mediterranean area, characterized by a long period of dry conditions with a set of short, humid periods.
- Cluster 1. With 7% of data (Table 5), rainfall variables present higher values than the previous cluster, with an important number of outliers. This is more evident in points located in the upper area (data-collection points 13, 14, 27 and 15). This suggests river levels increase their ranges and mean values (marked with a red point). As explained before, the Mediterranean area often presents storm events that feed riverbeds. In this case, the majority of rainfall lies in the upper areas of the mountain and flows down all the riverbeds, increasing its level. However, this kind of storm very often does not imply really dangerous consequences, since the reached values do not overcome the security threshold of the river. Therefore, this group or cluster could be entitled “storm situation”.
- Cluster 2. Finally, with 2% of the observations, all rainfall variables reach really high values, mainly those collected from points located in the middle of the river area (points 9, 11, 12 and 103). These are situated on the low side of the mountains, where storms coming from the Mediterranean and Atlantic seas are retained. In these cases, storms are shorter in time, but with higher volumes of rainfall, which can be observed in Figure 9. In this situation, river levels rise, reaching the highest values in comparison with other clusters. This could be called “extreme situation”.
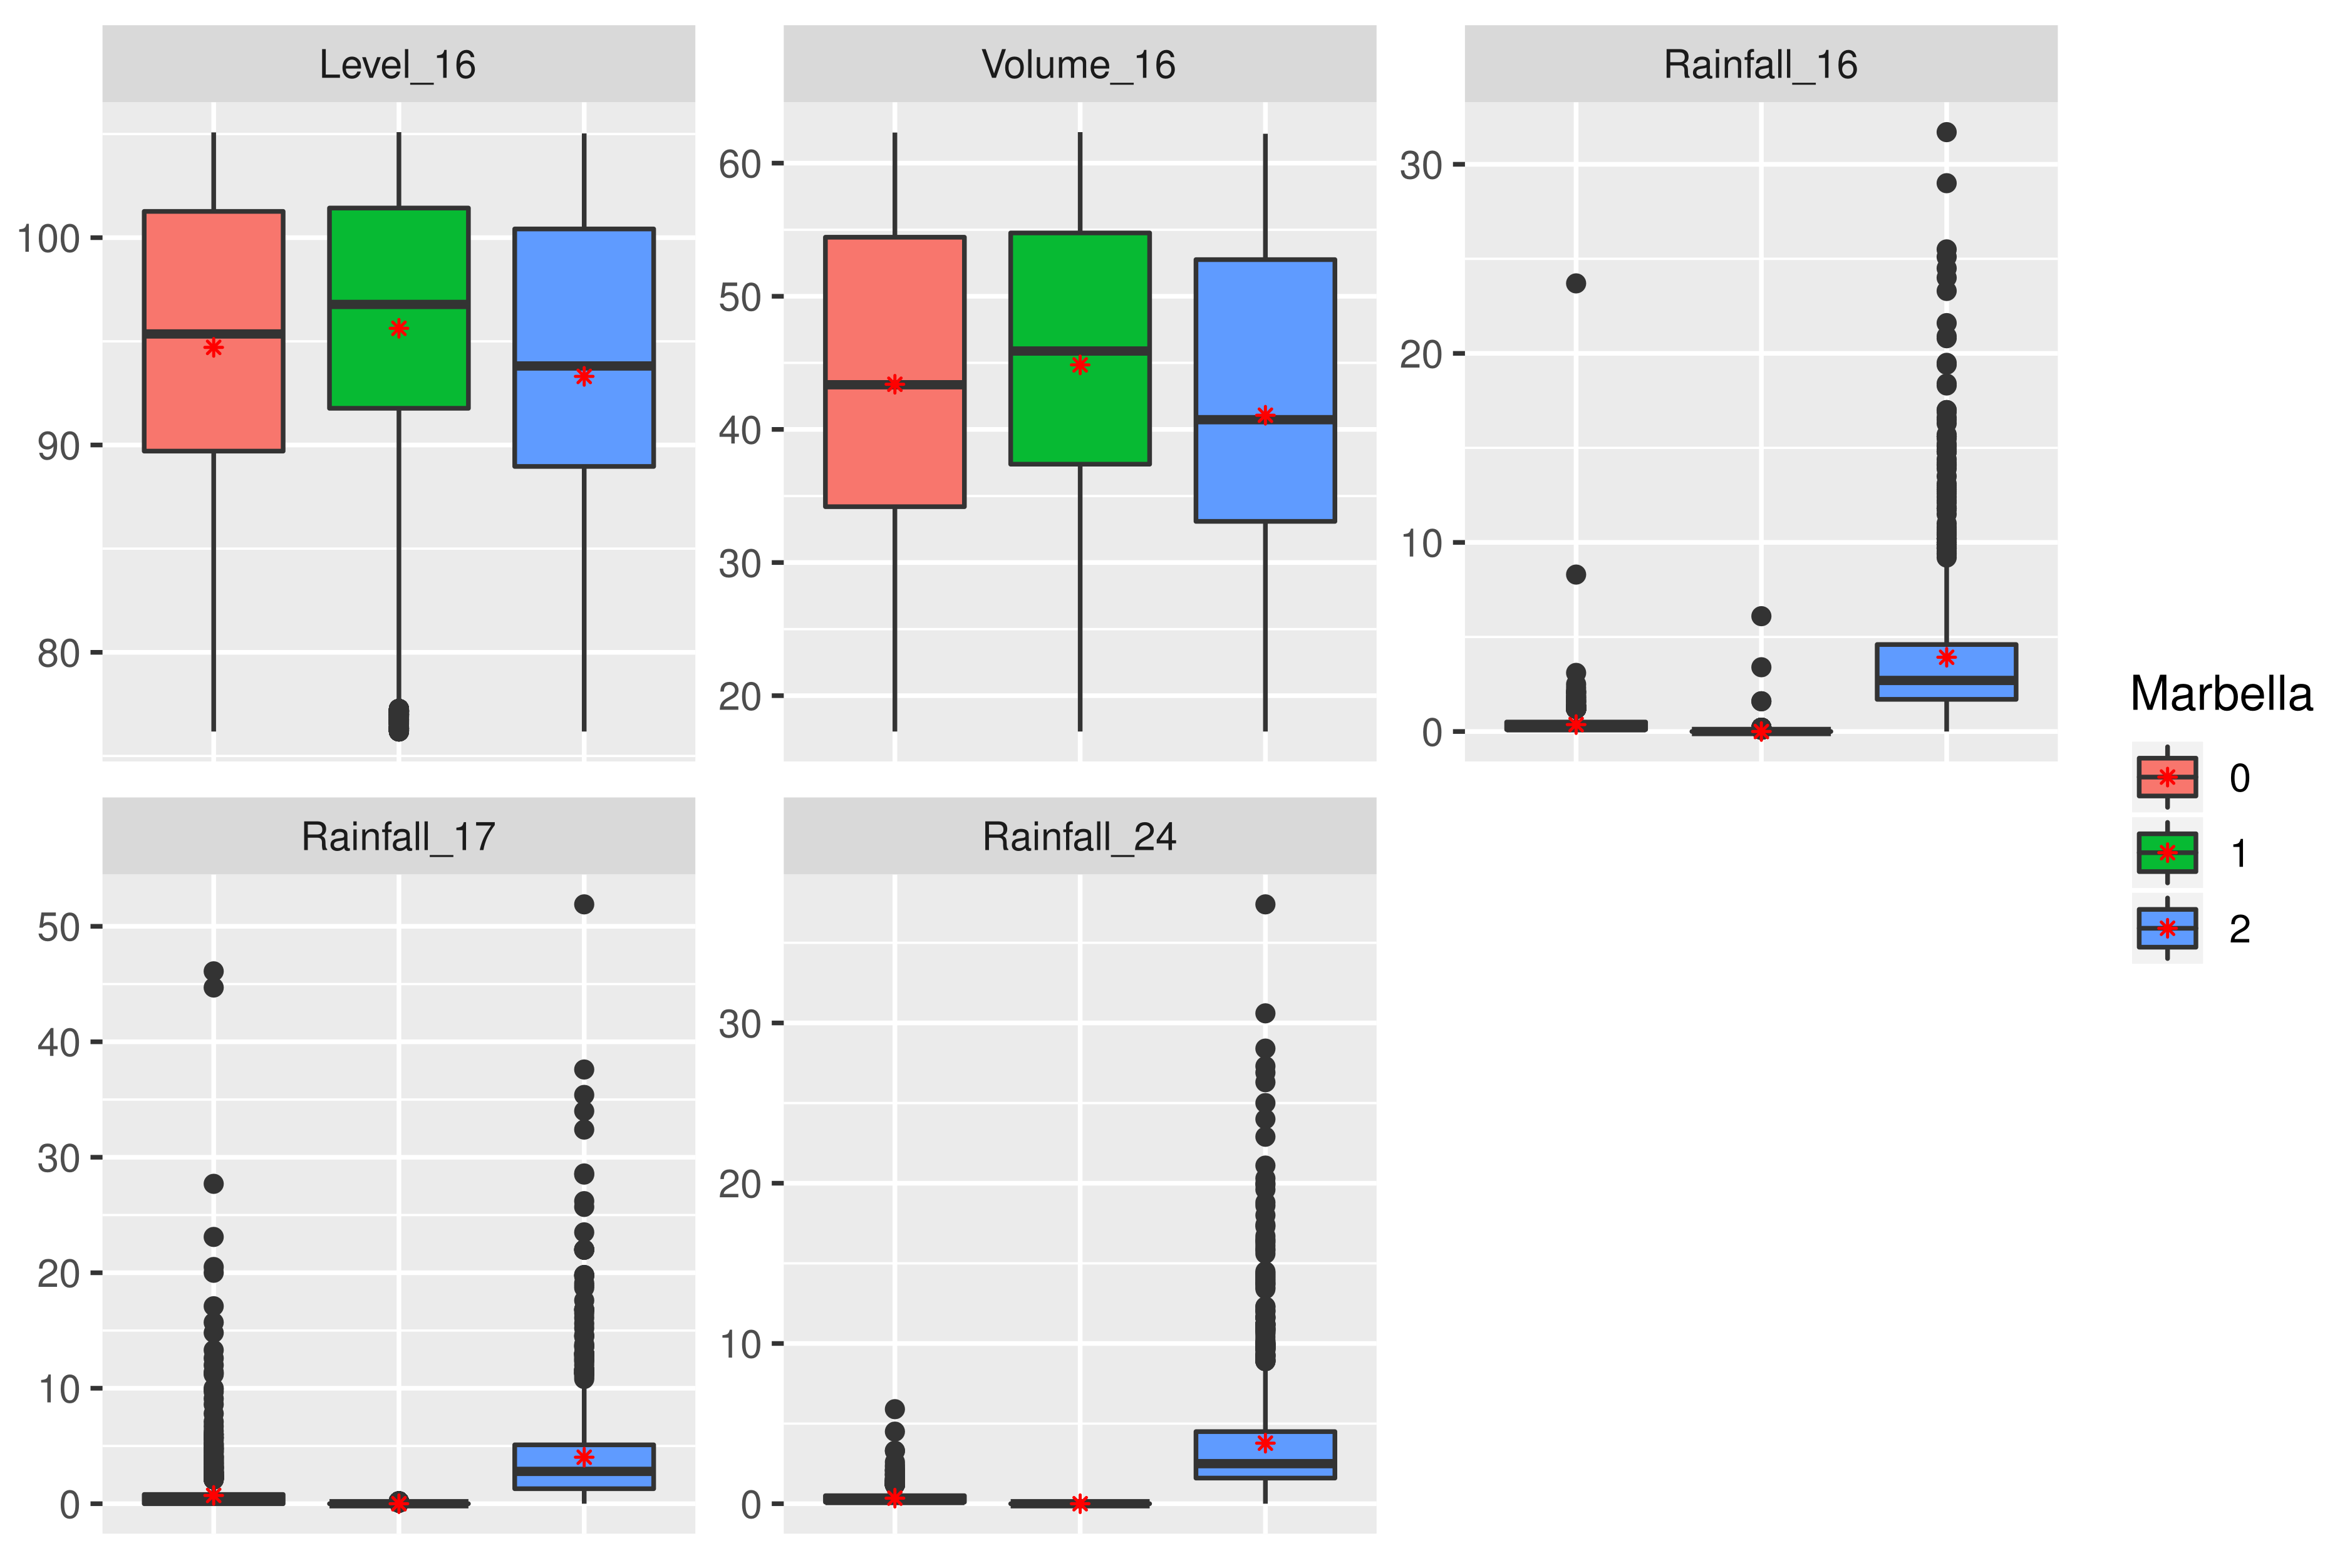
4.3. The Marbella Area
- Cluster 0. Even when values are low, they represent short events of rainfall with mean values around 0.3–0.5 mm. Therefore, this group could be called “drizzle situation”.
- Cluster 1. In this case, rainfall is equal to zero, with just some higher values in the case of point 16 (located in the dam). Therefore, this group could be called “dry situation”, which comprises % of the data (Table 6).
- Cluster 2. This cluster presents a clear difference with respect to the others, with rainfall values very high with mean values between 3 and 5 mm. Additionally, some outliers reach 30 or even 50 mm. This group is related to “extreme storm situation”. This cluster comprises % of the data.
5. Conclusions
Author Contributions
Funding
Institutional Review Board Statement
Informed Consent Statement
Data Availability Statement
Conflicts of Interest
References
- Marhavilas, P.; Koulouriotis, D.; Gemeni, V. Risk analysis and assessment methodologies in the work sites: On a review, classification and comparative study of the scientific literature of the period 2000–2009. J. Loss Prev. Process Ind. 2011, 24, 477–523. [Google Scholar] [CrossRef]
- Apel, H.; Aronica, G.; Kreibich, H.; Thieken, A. Flood risk analyses-how detailed do we need to be? Nat. Hazards 2009, 49, 79–98. [Google Scholar] [CrossRef]
- Jonkmand, S.; Bockarjova, M.; Kok, M.; Bernardini, P. Integrated hydrodynamic and economic modelling of flood damage in the Netherlands. Ecol. Econ. 2008, 66, 77–90. [Google Scholar] [CrossRef]
- Kaikkonen, L.; Tuuli, P.; Rahikainen, M.; Uusitalo, L.; Lehikoinen, A. Bayesian Networks in Environmental Risk Assessmen: A review. Integr. Environ. Assess. Manag. 2021, 17, 62–78. [Google Scholar] [CrossRef] [PubMed]
- Lavender, L.K. Plastics in the Marine Environment. Mar. Sci. 2017, 9, 205–229. [Google Scholar]
- McDermott, T.; Surminski, S. How normative interpretations of climate risk assessment affect local decision-making: An exploratory study at the city scale in Cork, Ireland. Philos. Trans. A 2018, 376, 20170300. [Google Scholar] [CrossRef] [Green Version]
- Kuklicke, C.; Demeritt, D. Adaptative and risk-based approaches to climate change and the management of uncertainty and institutional risk: The case of future flooding in Engiand. Glob. Environ. Chang. 2016, 37, 56–68. [Google Scholar] [CrossRef] [Green Version]
- Hodgson, E.E.; Essington, T.E.; Samhouri, J.; Allison, E.; Bennett, N.; Bostrom, A.; Cullen, A.; Kasperski, S.; Levin, P.; Poe, M. Integrated Risk Assessment for the Blue Economy. Front. Mar. Sci. 2019, 6, 1–14. [Google Scholar] [CrossRef]
- Morss, R.E.; Wilhelmi, O.; Downton, M.; Gruntfest, E. Flood risk, uncerttainty, and scientific information for decision making. Lessons from an interdisciplinary project. Am. Meteorol. Soc. 2005, 1593–1601. [Google Scholar] [CrossRef]
- Caballero-Gallardo, K.; Alcala-Orozco, M.; Barraza-Quiroz, D.; la Rosa, J.D.; Olivero-Verbel, J. Environmental risks associated with trace elements in sediments from Cartagena Bay, an industrialized site at the Caribbean. Chemosphere 2020, 242, 1–12. [Google Scholar] [CrossRef]
- CEA. Reducing the Social and Economic Impact of Climate Change and Natural Catastrophes: Insurance Solutions and Public-Private Partnerships; Technical Report; European Insurance and Reinsurance Federation: Brussels, Belgium, 2007. [Google Scholar]
- Kundzewicz, Z.; Krysanova, V.; Dankers, R.; Hirabayashi, Y.; Kanae, S.; Hattermann, F.; Huang, S.; Milly, P.; Stoffel, M.; Driessen, P.; et al. Differences in flood hazard projections in Europe - their causes and consequences for decision making. Hydrol. Sci. J. 2017, 62, 1–14. [Google Scholar] [CrossRef] [Green Version]
- Bertola, M.; Viglione, A.; Vorogushyn, S.; Lun, D.; Merz, B.; Bloschl, G. Do small and large floods have the same drivers of change? A regional attribution analysis in Europe. Hydrol. Earth Syst. Sci. 2021, 25, 1347–1364. [Google Scholar] [CrossRef]
- Arnell, N.; Gosling, S. The impacts of climate change on river flood risk at the global scale. Clim. Chang. 2016, 134, 387–401. [Google Scholar] [CrossRef] [Green Version]
- Nicholls, R.J.; Hoozemans, F.M.; Marchand, M. Increasing flood risk and wetland losses due to global sea-level rise: Regional and global analyses. Glob. Environ. Chang. 1999, 9, 69–87. [Google Scholar] [CrossRef]
- Moel, H.; Aerts, J. Effect of uncertainty in land use, damage models and inundation depth on flood damage estimates. Nat. Hazards 2011, 58, 407–425. [Google Scholar] [CrossRef] [Green Version]
- Moel, H.; van Alphen, J.; Aerts, J. Flood maps in Europe-methods, availability and use. Nat. Hazards Earth Syst. Sci. 2009, 9, 289–301. [Google Scholar] [CrossRef] [Green Version]
- Masuda, M.M.; Sackorb, A.S.; Alamc, A.F.; Al-Amind, A.Q.; Ghanif, A.B.A. Community responses to flood risk management—An empirical Investigation of the Marine Protected Areas (MPAs) in Malaysia. Mar. Policy 2018, 97, 119–126. [Google Scholar] [CrossRef]
- Sairam, N.; Schroter, K.; Ludtke, S.; Merz, B.; Kreibich, H. Quantifying Flood Vulnerability Reduction via Private Precaution. Earth’s Future 2019, 7, 235–249. [Google Scholar] [CrossRef]
- Lechowska, E. What determines flood risk perception? A review of factors of flood risk perception and relations between its basic elements. Nat. Hazards 2018, 94, 1341–1366. [Google Scholar] [CrossRef] [Green Version]
- Alfieri, L.; Feyen, L.; Dottori, F.; Bianchi, A. Ensemble flood risk assessment in Europe under high end climate scenarios. Glob. Environ. Chang. 2015, 35, 199–212. [Google Scholar] [CrossRef]
- Guhathakurta, P.; Sreejith, O.; Menon, P. Impact of climate change on extreme rainfall events and flood risk in India. J. Earth Syst. Sci. 2011, 120, 359–373. [Google Scholar] [CrossRef]
- Lyu, H.; Sun, W.; Shen, S.; Arulrajah, A. Flood risk assessment in metro systems of mega-cities using a GIS-based modelling approach. Sci. Total Environ. 2018, 626, 1012–1025. [Google Scholar] [CrossRef] [PubMed]
- Guillen, J.D.H.; del Rey, A.M.; Casado-Vara, R. Propagation of the Malware Used in APTs Based on Dynamic Bayesian Networks. Mathematics 2021, 9, 3097. [Google Scholar]
- Maldonado, A.D.; Morales, M.; Navarro, F.; Sánchez-Martos, F.; Aguilera, P.A. Modeling Semiarid River–Aquifer Systems with Bayesian Networks and Artificial Neural Networks. Mathematics 2022, 10, 107. [Google Scholar] [CrossRef]
- Rodríguez-Martínez, A.; Vitoriano, B. Probability-BasedWildfire Risk Measure for Decision-Making. Mathematics 2020, 8, 557. [Google Scholar] [CrossRef]
- Aguilera, P.A.; Fernández, A.; Fernández, R.; Rumí, R.; Salmerón, A. Bayesian networks in environmental modelling. Environ. Model. Softw. 2011, 26, 1376–1388. [Google Scholar] [CrossRef]
- Niazi, M.; Morales Nápoles, O.; vanWesenbeeck, B. Probabilistic Characterization of the Vegetated Hydrodynamic System using Non-Parametric Bayesian Networks. Water 2021, 13, 398. [Google Scholar] [CrossRef]
- Paprotny, D.; Kreibich, H.; Morales-Nápoles, O.; Wagenaar, D.; Castellarin, A.; Carisi, F.; Bertin, X.; Merz, B.; Schroter, K. A probabilistic approach to estimating residential losses from different flood types. Nat. Hazards 2021, 105, 2569–2601. [Google Scholar] [CrossRef]
- Wu, Z.; Shen, Y.; Wang, H.; Wu, M. Urban flood disaster risk evaluation based on ontology and Bayesian Network. J. Hydrol. 2020, 583, 1–15. [Google Scholar] [CrossRef]
- Paprotny, D.; Morales-Nápoles, O. Estimating extreme river discharges in Europe through a Bayesian network. Hydrol. Earth Syst. Sci. 2017, 21, 2615–2636. [Google Scholar] [CrossRef] [Green Version]
- Yuji, R.; Heo, G.; Whang, S.E. A survey on data collection for machine learning: A big data- AI intregration perspective. IEEE Trans. Knowl. Data Eng. 2021, 33, 1328–1347. [Google Scholar]
- Lecomte, J.; Benoit, H.; Etienne, M.; Bel, L.; Parent, E. Modeling the habitat associations and spatial distribution of benthic macroinvertebrates: A hierarchical Bayesian model for zero-inflated biomass data. Ecol. Model. 2013, 265, 74–84. [Google Scholar] [CrossRef]
- Maldonado, A.; Aguilera, P.A.; Salmerón, A.; José-Miguel Sánchez-Pérez, A.R.E. (Eds.) An Experimental Comparison of Methods to Handle Missing Values in Environmental Datasets. In Proceedings of the International Environmental Modelling and Software Society (iEMSs) 8th International Congress on Environmental Modelling and Software, Toulouse, France, 10–14 July 2016. [Google Scholar]
- Ropero, R.F.; Renooij, S.; van der Gaag, L. Discretizing environmental data for learning Bayesian-network classifiers. Ecol. Model. 2018, 368, 391–403. [Google Scholar] [CrossRef]
- Langseth, H.; Nielsen, T.D.; Rumí, R.; Salmerón, A. Mixtures of Truncated Basis Functions. Int. J. Approx. Reason. 2012, 53, 212–227. [Google Scholar] [CrossRef] [Green Version]
- Shenoy, P.P.; West, J.C. Inference in hybrid Bayesian networks using mixtures of polynomials. Int. J. Approx. Reason. 2011, 52, 641–657. [Google Scholar] [CrossRef] [Green Version]
- Rumí, R. Modelos de Redes Bayesianas con Variables Discretas y Continuas. Ph.D. Thesis, Universidad de Almería, Almería, Spain, 2003. [Google Scholar]
- Moral, S.; Rumí, R.; Salmerón, A. Mixtures of Truncated Exponentials in Hybrid Bayesian Networks. In Lecture Notes in Artificial Intelligence, Proceedings of the ECSQARU’01, Toulouse, France, 19–21 September 2001; Springer: Berlin/Heidelberg, Germany, 2001; Volume 2143, pp. 156–167. [Google Scholar]
- Cobb, B.R.; Rumí, R.; Salmerón, A. Bayesian Networks Models with Discrete and Continuous Variables. In Advances in Probabilistic Graphical Models; Studies in Fuzziness and Soft Computing; Springer: Berlin/Heidelberg, Germany, 2007; pp. 81–102. [Google Scholar]
- Rumí, R.; Salmerón, A. Approximate probability propagation with mixtures of truncated exponentials. Int. J. Approx. Reason. 2007, 45, 191–210. [Google Scholar] [CrossRef] [Green Version]
- Rumí, R.; Salmerón, A.; Moral, S. Estimating mixtures of truncated exponentials in hybrid Bayesian networks. Test 2006, 15, 397–421. [Google Scholar] [CrossRef]
- Flores, J.; Ropero, R.F.; Rumí, R. Assessment of flood risk in Mediterranean catchments: An approach based on Bayesian networks. Stoch. Environ. Res. Risk Assess. 2019, 33, 1991–2005. [Google Scholar] [CrossRef]
- Maldonado, A.; Aguilera, P.; Salmerón, A. Continuous Bayesian networks for probabilistic environmental risk mapping. Stoch. Environ. Res. Risk Assess. 2016, 30, 1441–1455. [Google Scholar] [CrossRef]
- Minsky, M. Steps towards artificial intelligence. Comput. Thoughts 1961, Volume 49, 8–30. [Google Scholar] [CrossRef]
- Friedman, N.; Geiger, D.; Goldszmidt, M. Bayesian Network Classifiers. Mach. Learn. 1997, 29, 131–163. [Google Scholar] [CrossRef] [Green Version]
- Ropero, R.F.; Aguilera, P.A.; Fernández, A.; Rumí, R. Regression using hybrid Bayesian networks: Modelling landscape-socioeconomy relationships. Environ. Model. Softw. 2014, 57, 127–137. [Google Scholar] [CrossRef]
- Li, Z.; D’Ambrosio, B. Efficient inference in Bayes networks as a combinatorial optimization problem. Int. J. Approx. Reason. 1994, 11, 55–81. [Google Scholar] [CrossRef] [Green Version]
- Dechter, R. Bucket elimination: A unifying framework for probabilistic inference algorithms. In Proceedings of the Twelfth Conference on Uncertainty in Artificial Intelligence, Portland, OR, USA, 1–4 August 1996; pp. 211–219. [Google Scholar]
- Zhang, N.L.; Poole, D. Exploiting causal independence in Bayesian network inference. J. Artif. Intell. Res. 1996, 5, 301–328. [Google Scholar] [CrossRef] [Green Version]
- Morales, M.; Rodríguez, C.; Salmerón, A. Selective naïve Bayes for regression using mixtures of truncated exponentials. Int. J. Uncertain. Fuzziness Knowl. Based Syst. 2007, 15, 697–716. [Google Scholar] [CrossRef]
- Moral, S.; Rumí, R.; Salmerón, A. Approximating conditional MTE distributions by means of mixed trees. In Lecture Notes in Artificial Intelligence, Proceedings of the ECSQARU’03, Aalborg, Denmark, 2–5 July 2003; Springer: Berlin/Heidelberg, Germany, 2003; Volume 2711, pp. 173–183. [Google Scholar]
- Cobb, B.R.; Shenoy, P.P.; Rumí, R. Approximating Probability Density Functions with Mixtures of Truncated Exponentials. Stat. Comput. 2006, 16, 293–308. [Google Scholar] [CrossRef] [Green Version]
- Romero, V.; Rumí, R.; Salmerón, A. Learning hybrid Bayesian networks using mixtures of truncated exponentials. Int. J. Approx. Reason. 2006, 42, 54–68. [Google Scholar] [CrossRef] [Green Version]
- Fernández, A.; Gámez, J.A.; Rumí, R.; Salmerón, A. Data clustering using hidden variables in hybrid Bayesian networks. Prog. Artif. Intell. 2014, 2, 141–152. [Google Scholar] [CrossRef] [Green Version]
- Ropero, R.F.; Aguilera, P.A.; Rumí, R. Analysis of the socioecological structure and dynamics of the territory using a hybrid Bayesian network classifier. Ecol. Model. 2015, 311, 73–87. [Google Scholar] [CrossRef]
- Aguilera, P.A.; Fernández, A.; Ropero, R.F.; Molina, L. Groundwater quality assessment using data clustering based on hybrid Bayesian networks. Stoch. Environ. Res. Risk Assess. 2013, 27, 435–447. [Google Scholar] [CrossRef]
- Tanner, M.A.; Wong, W.H. The calculation of posterior distributions by data augmentation. J. Am. Stat. Assoc. 1987, 82, 528–550. [Google Scholar] [CrossRef]
- Elvira-Consortium. Elvira: An Environment for Creating and Using Probabilistic Graphical Models. In Proceedings of the First European Workshop on Probabilistic Graphical Models, Cuenca, Spain, 6–8 November 2002; pp. 222–230. [Google Scholar]


| Area | Variable | Min | 1st Qu | Mean | 3rd Qu | Max |
|---|---|---|---|---|---|---|
| Marbella | Level 16 | 76.18 | 91.66 | 95.56 | 101.42 | 105.09 |
| Volume 16 | 17.31 | 37.21 | 44.75 | 54.74 | 62.33 | |
| Rainfall 16 | 0 | 0 | 0.07108 | 0 | 31.7 | |
| Rainfall 17 | 0 | 0 | 0.08334 | 0 | 51.9 | |
| Rainfall 24 | 0 | 0 | 0.06778 | 0 | 37.4 | |
| Guadiaro | Rainfall 102 | 0 | 0 | 0.05783 | 0 | 33.4 |
| Rainfall 9 | 0 | 0 | 0.09427 | 0 | 33.8 | |
| Rainfall 11 | 0 | 0 | 0.09039 | 0 | 34.4 | |
| Level 9 | 0 | 0.01 | 0.1548 | 0.2 | 4.06 | |
| Level 11 | 0 | 0.21 | 0.47 | 0.62 | 5.67 | |
| Rainfall 12 | 0 | 0 | 0.1086 | 0 | 28.9 | |
| Rainfall 13 | 0 | 0 | 0.1042 | 0 | 75.7 | |
| Rainfall 14 | 0 | 0 | 0.1197 | 0 | 83.5 | |
| Rainfall 27 | 0 | 0 | 0.07038 | 0 | 45 | |
| Rainfall 103 | 0 | 0 | 0.1123 | 0 | 31 | |
| Rainfall 15 | 0 | 0 | 0.0663 | 0 | 24.6 | |
| Level 13 | 0 | 0.05 | 0.1328 | 0.14 | 3.79 | |
| Level 103 | 0 | 0.15 | 0.263 | 0.25 | 2.76 | |
| Snow 27 | 0 | 0 | 4.70 × 10 | 0 | 14.7 | |
| Guadarranque | Level 8 | 50.84 | 60.98 | 65.7 | 69.57 | 73.39 |
| Volume 8 | 17.59 | 45.2 | 61.28 | 73.86 | 88.97 | |
| Rainfall 23 | 0 | 0 | 0.087 | 0 | 55.6 | |
| Rainfall 8 | 0 | 0 | 0.08665 | 0 | 40.5 | |
| Rainfall 10 | 0 | 0 | 0.1151 | 0 | 34.7 |
| Dataset | #Var. | Type | Rainfall | Level/Vol. | Snow |
|---|---|---|---|---|---|
| Guadarranque | 6 | C | 4 | 2 | 0 |
| Guadiaro | 14 | H | 9 * | 4 | 1 * |
| Marbella | 5 | H | 3 * | 2 | 0 |
| Total | 25 | - | 16 | 8 | 1 |
| Observation | Group 1 | Group 2 | Group 3 |
|---|---|---|---|
| 1 | 0.9 | 0.05 | 0.05 |
| 2 | 0.1 | 0.6 | 0.3 |
| 3 | 0.4 | 0.4 | 0.2 |
| 4 | 0.05 | 0.01 | 0.94 |
| Model | rmse | Variance | MBE |
|---|---|---|---|
| Real | |||
| NB Imputed | |||
| TAN Imputed |
| Cluster | Observations | % |
|---|---|---|
| Dry situation (0) | 69,710 | 91 |
| Storm situation (1) | 5558 | 7 |
| Extreme situation (2) | 1094 | 2 |
| Cluster | Observations | % |
|---|---|---|
| Drizzle situation (0) | 2294 | 3 |
| Dry situation (1) | 72,909 | |
| Extreme storm situation (2) | 1159 |
Publisher’s Note: MDPI stays neutral with regard to jurisdictional claims in published maps and institutional affiliations. |
© 2022 by the authors. Licensee MDPI, Basel, Switzerland. This article is an open access article distributed under the terms and conditions of the Creative Commons Attribution (CC BY) license (https://creativecommons.org/licenses/by/4.0/).
Share and Cite
Ropero, R.F.; Flores, M.J.; Rumí, R. Bayesian Networks for Preprocessing Water Management Data. Mathematics 2022, 10, 1777. https://doi.org/10.3390/math10101777
Ropero RF, Flores MJ, Rumí R. Bayesian Networks for Preprocessing Water Management Data. Mathematics. 2022; 10(10):1777. https://doi.org/10.3390/math10101777
Chicago/Turabian StyleRopero, Rosa Fernández, María Julia Flores, and Rafael Rumí. 2022. "Bayesian Networks for Preprocessing Water Management Data" Mathematics 10, no. 10: 1777. https://doi.org/10.3390/math10101777
APA StyleRopero, R. F., Flores, M. J., & Rumí, R. (2022). Bayesian Networks for Preprocessing Water Management Data. Mathematics, 10(10), 1777. https://doi.org/10.3390/math10101777