
Log Transformed Coherency Matrix for Differentiating Scattering Behaviour of Oil Spill Emulsions Using SAR Images

 ,
,  and
and
Abstract
:1. Introduction
1.1. Motivation
1.2. Novelty and Scientific Contribution
1.3. Organization
2. State-of-the-Art
3. Proposed Approach
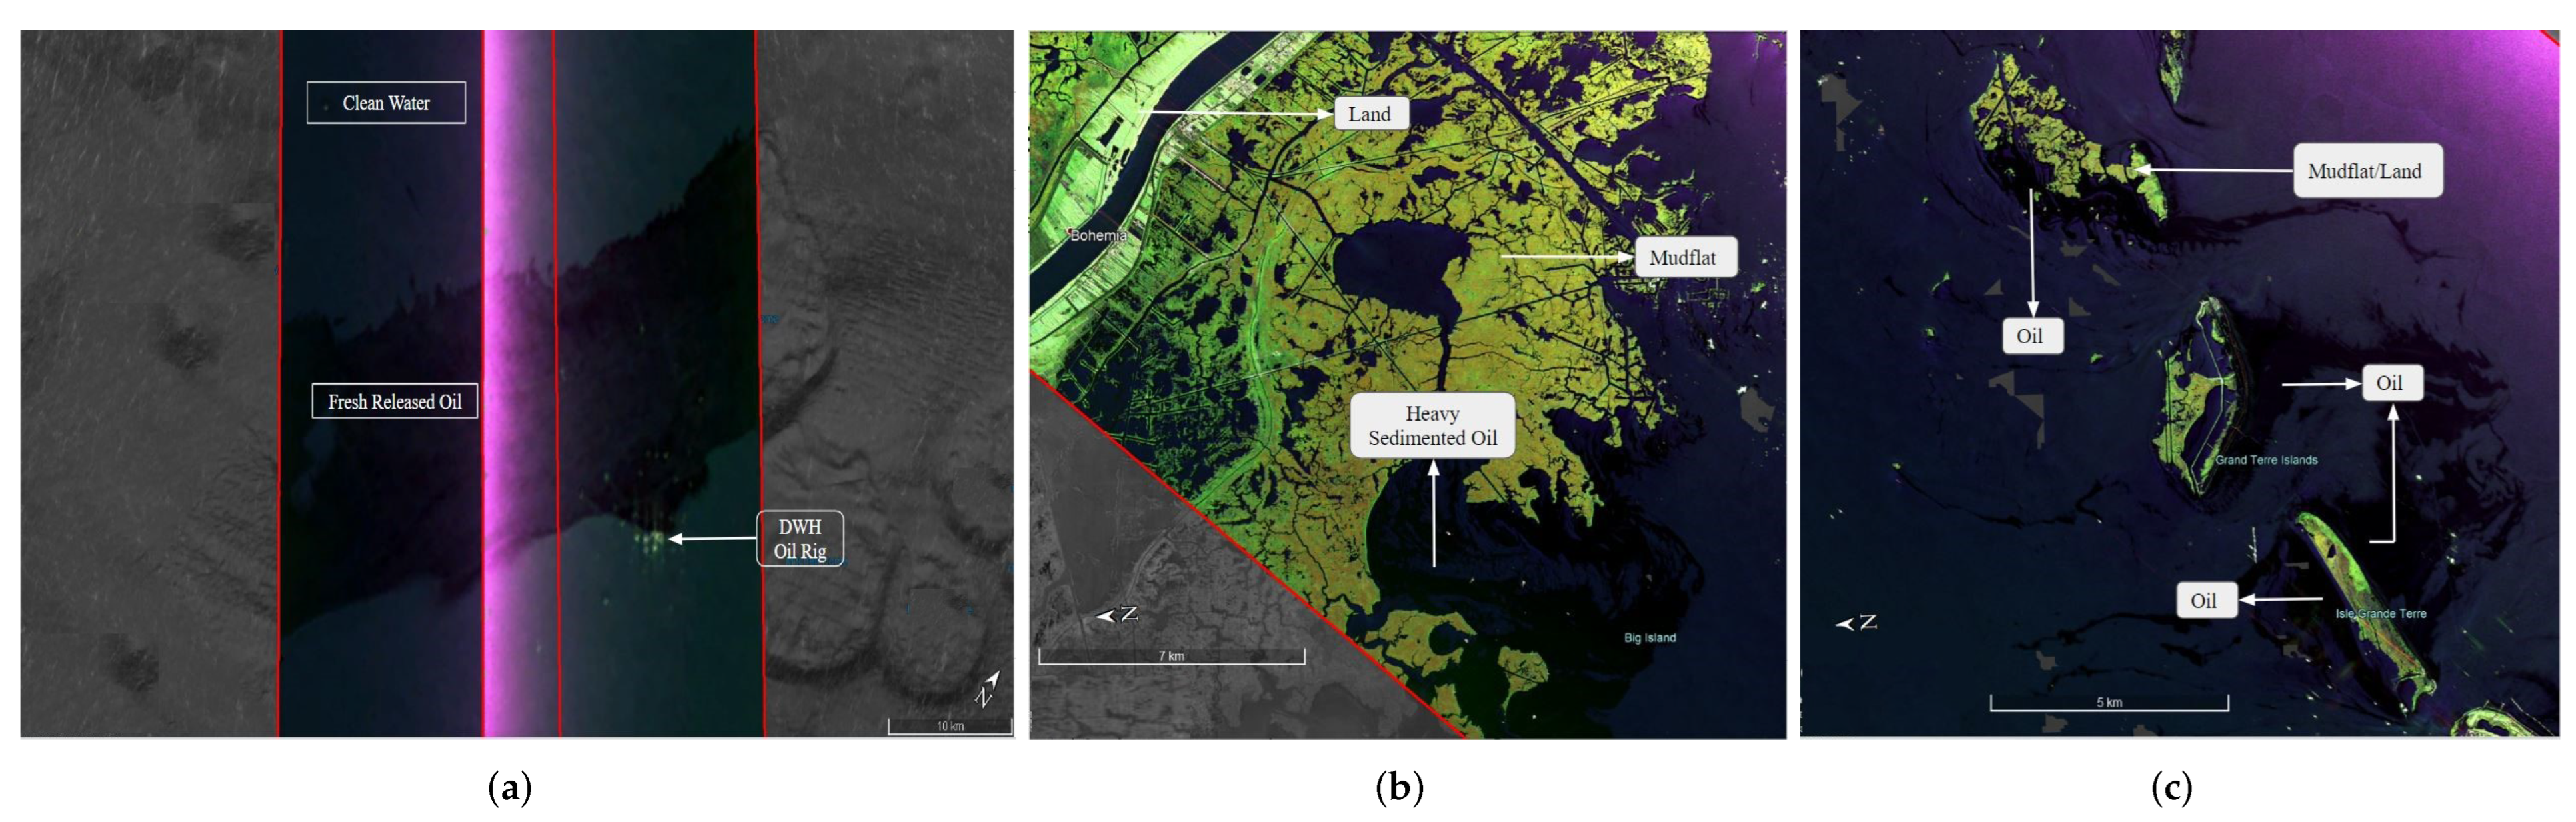
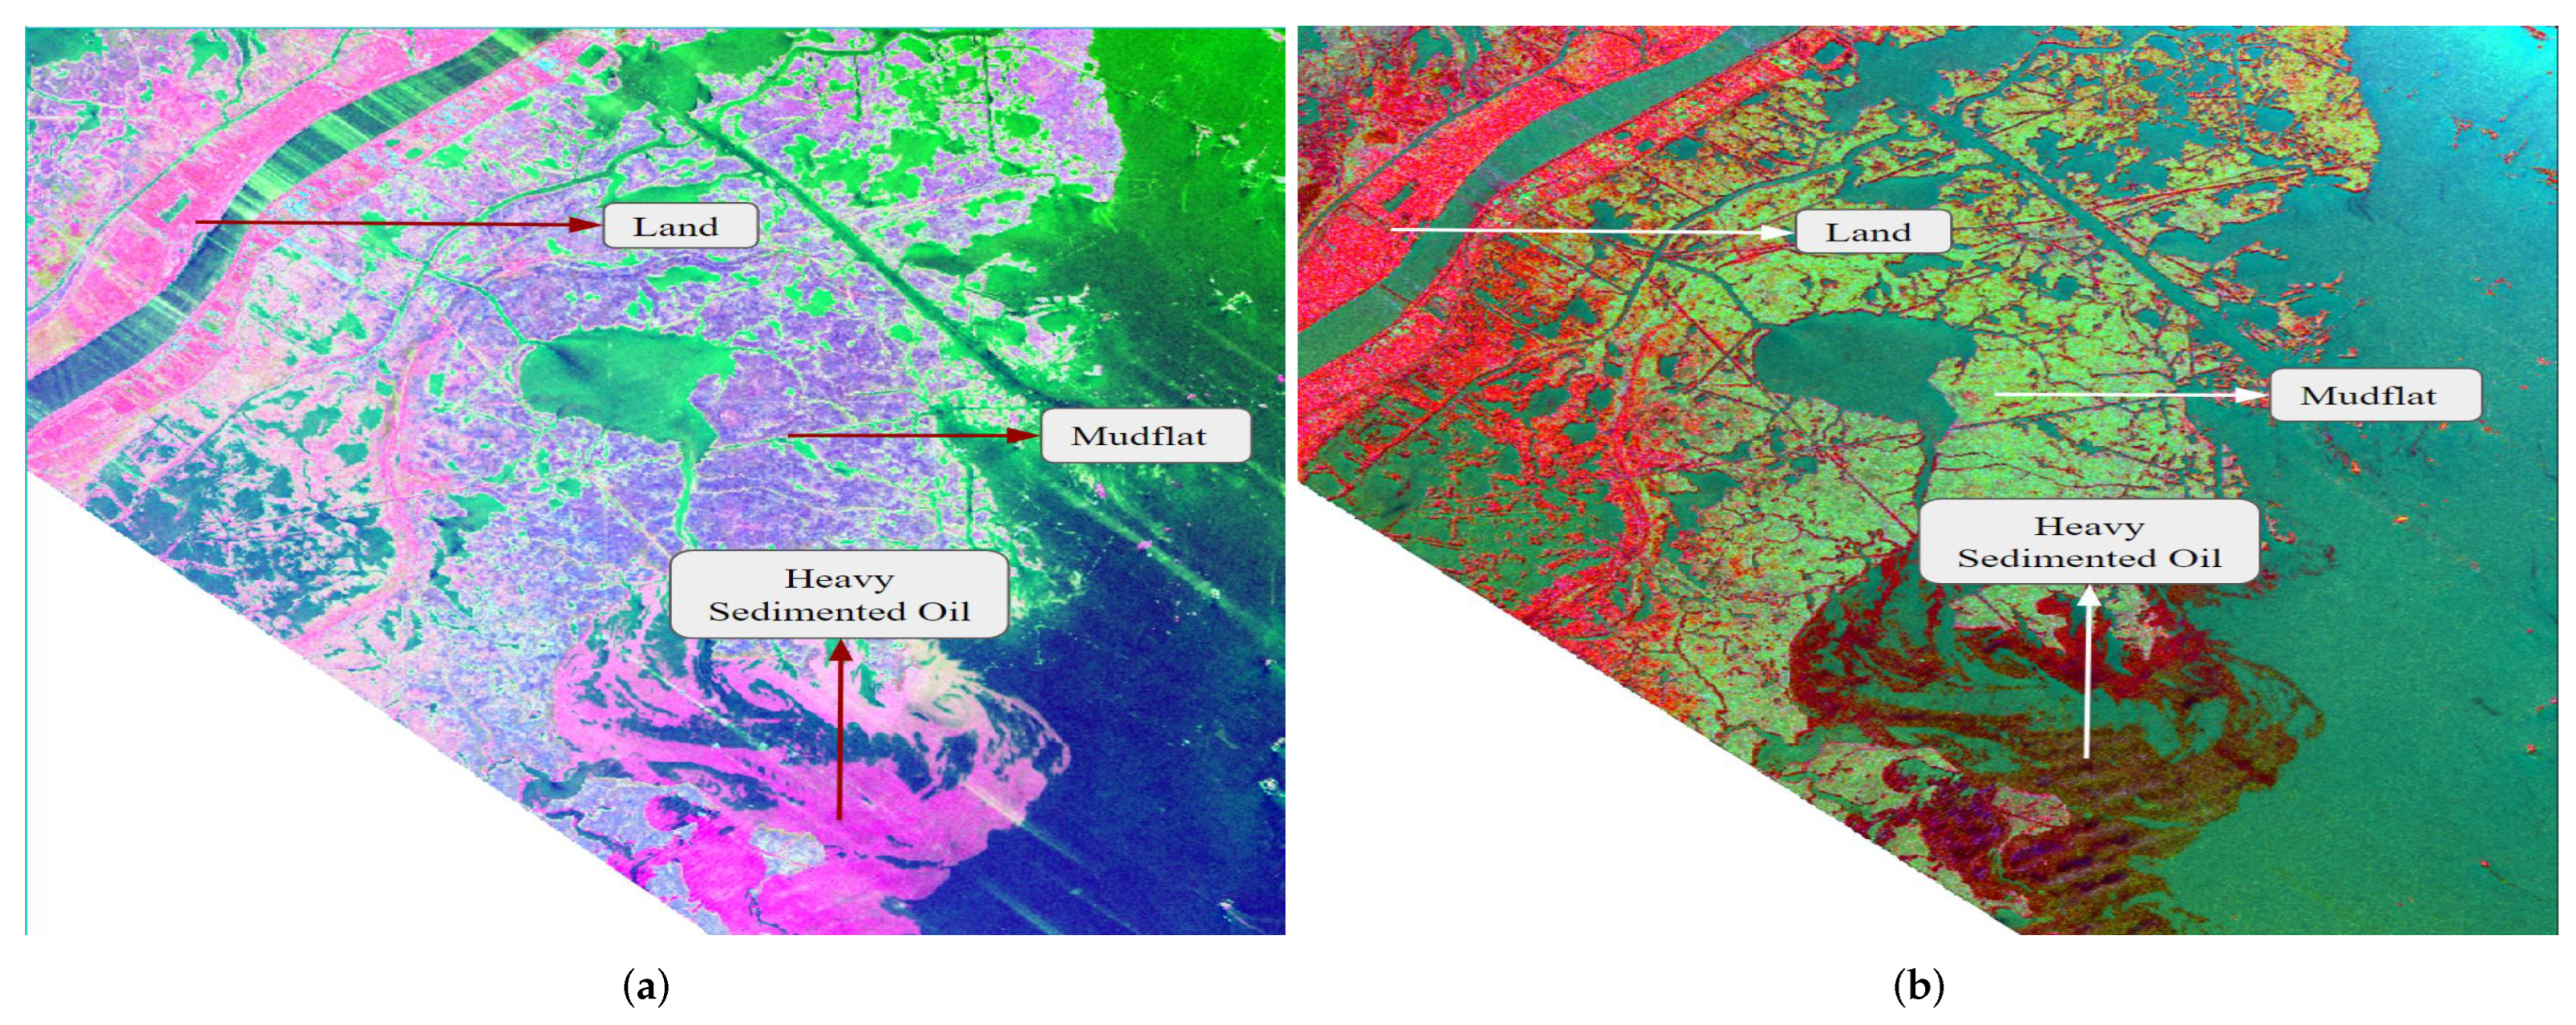
3.1. Input Dataset
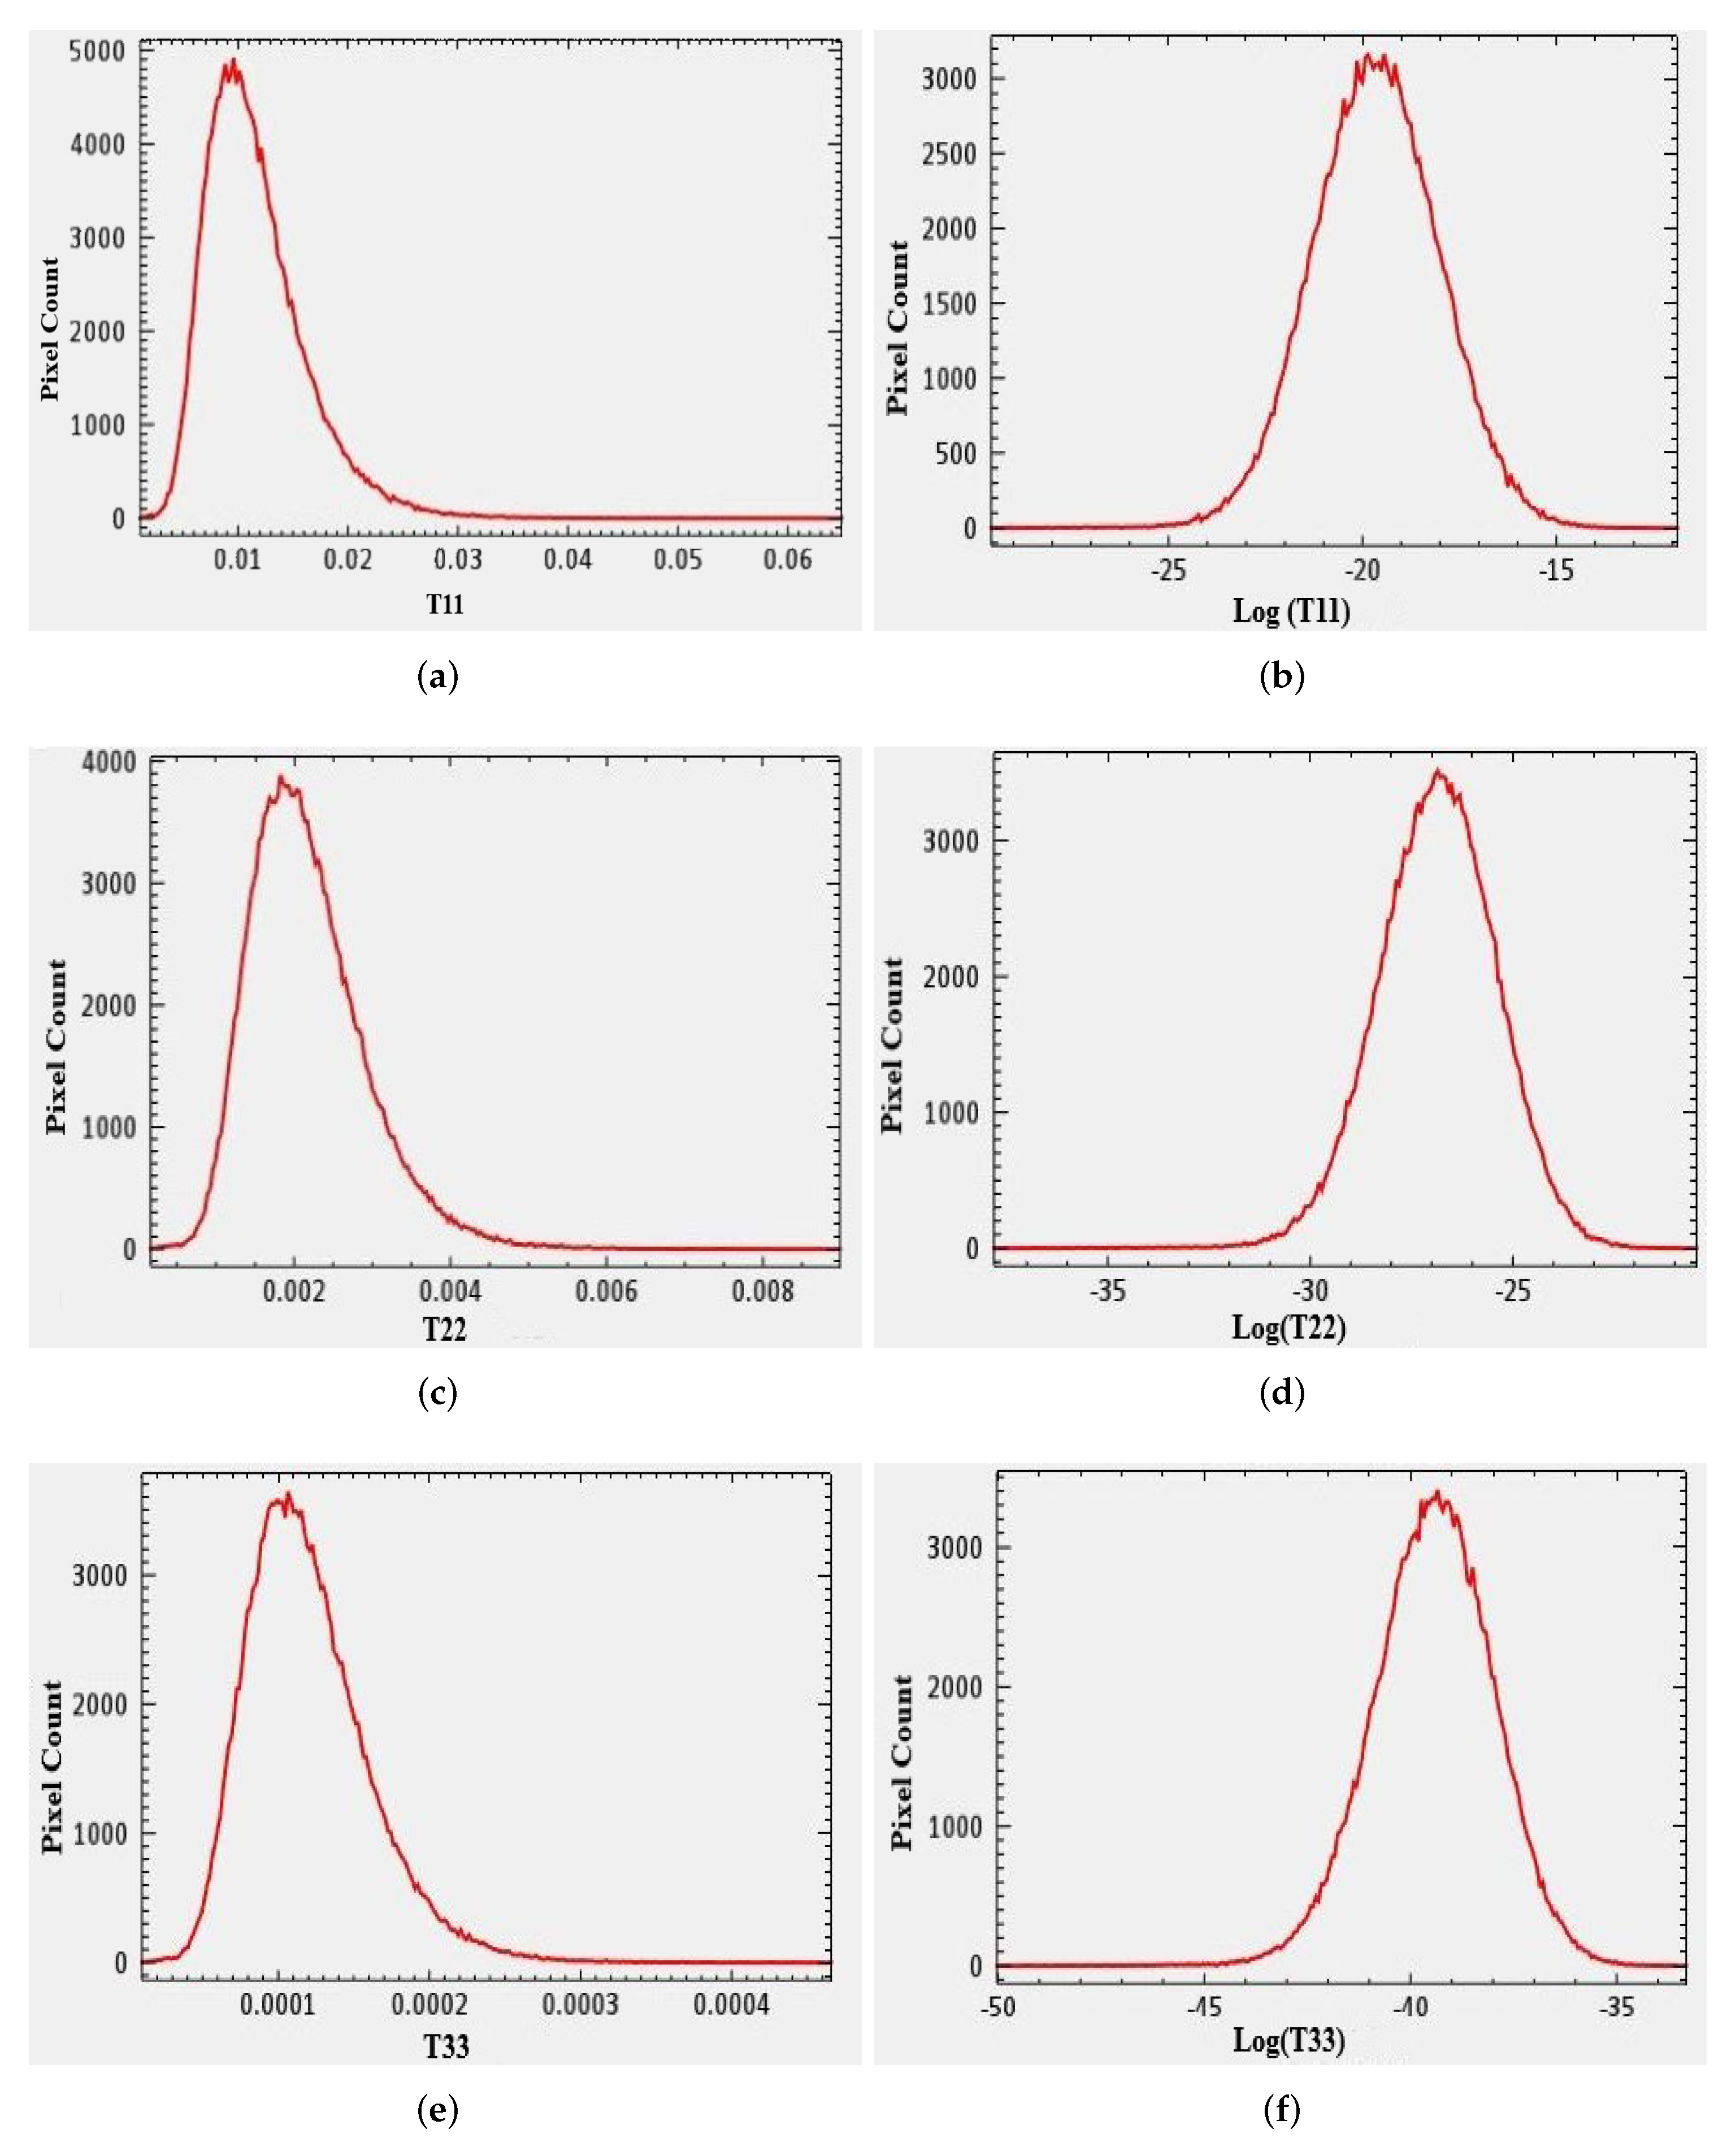
3.2. Significance of Log Transformed T3 Matrix
- (i)
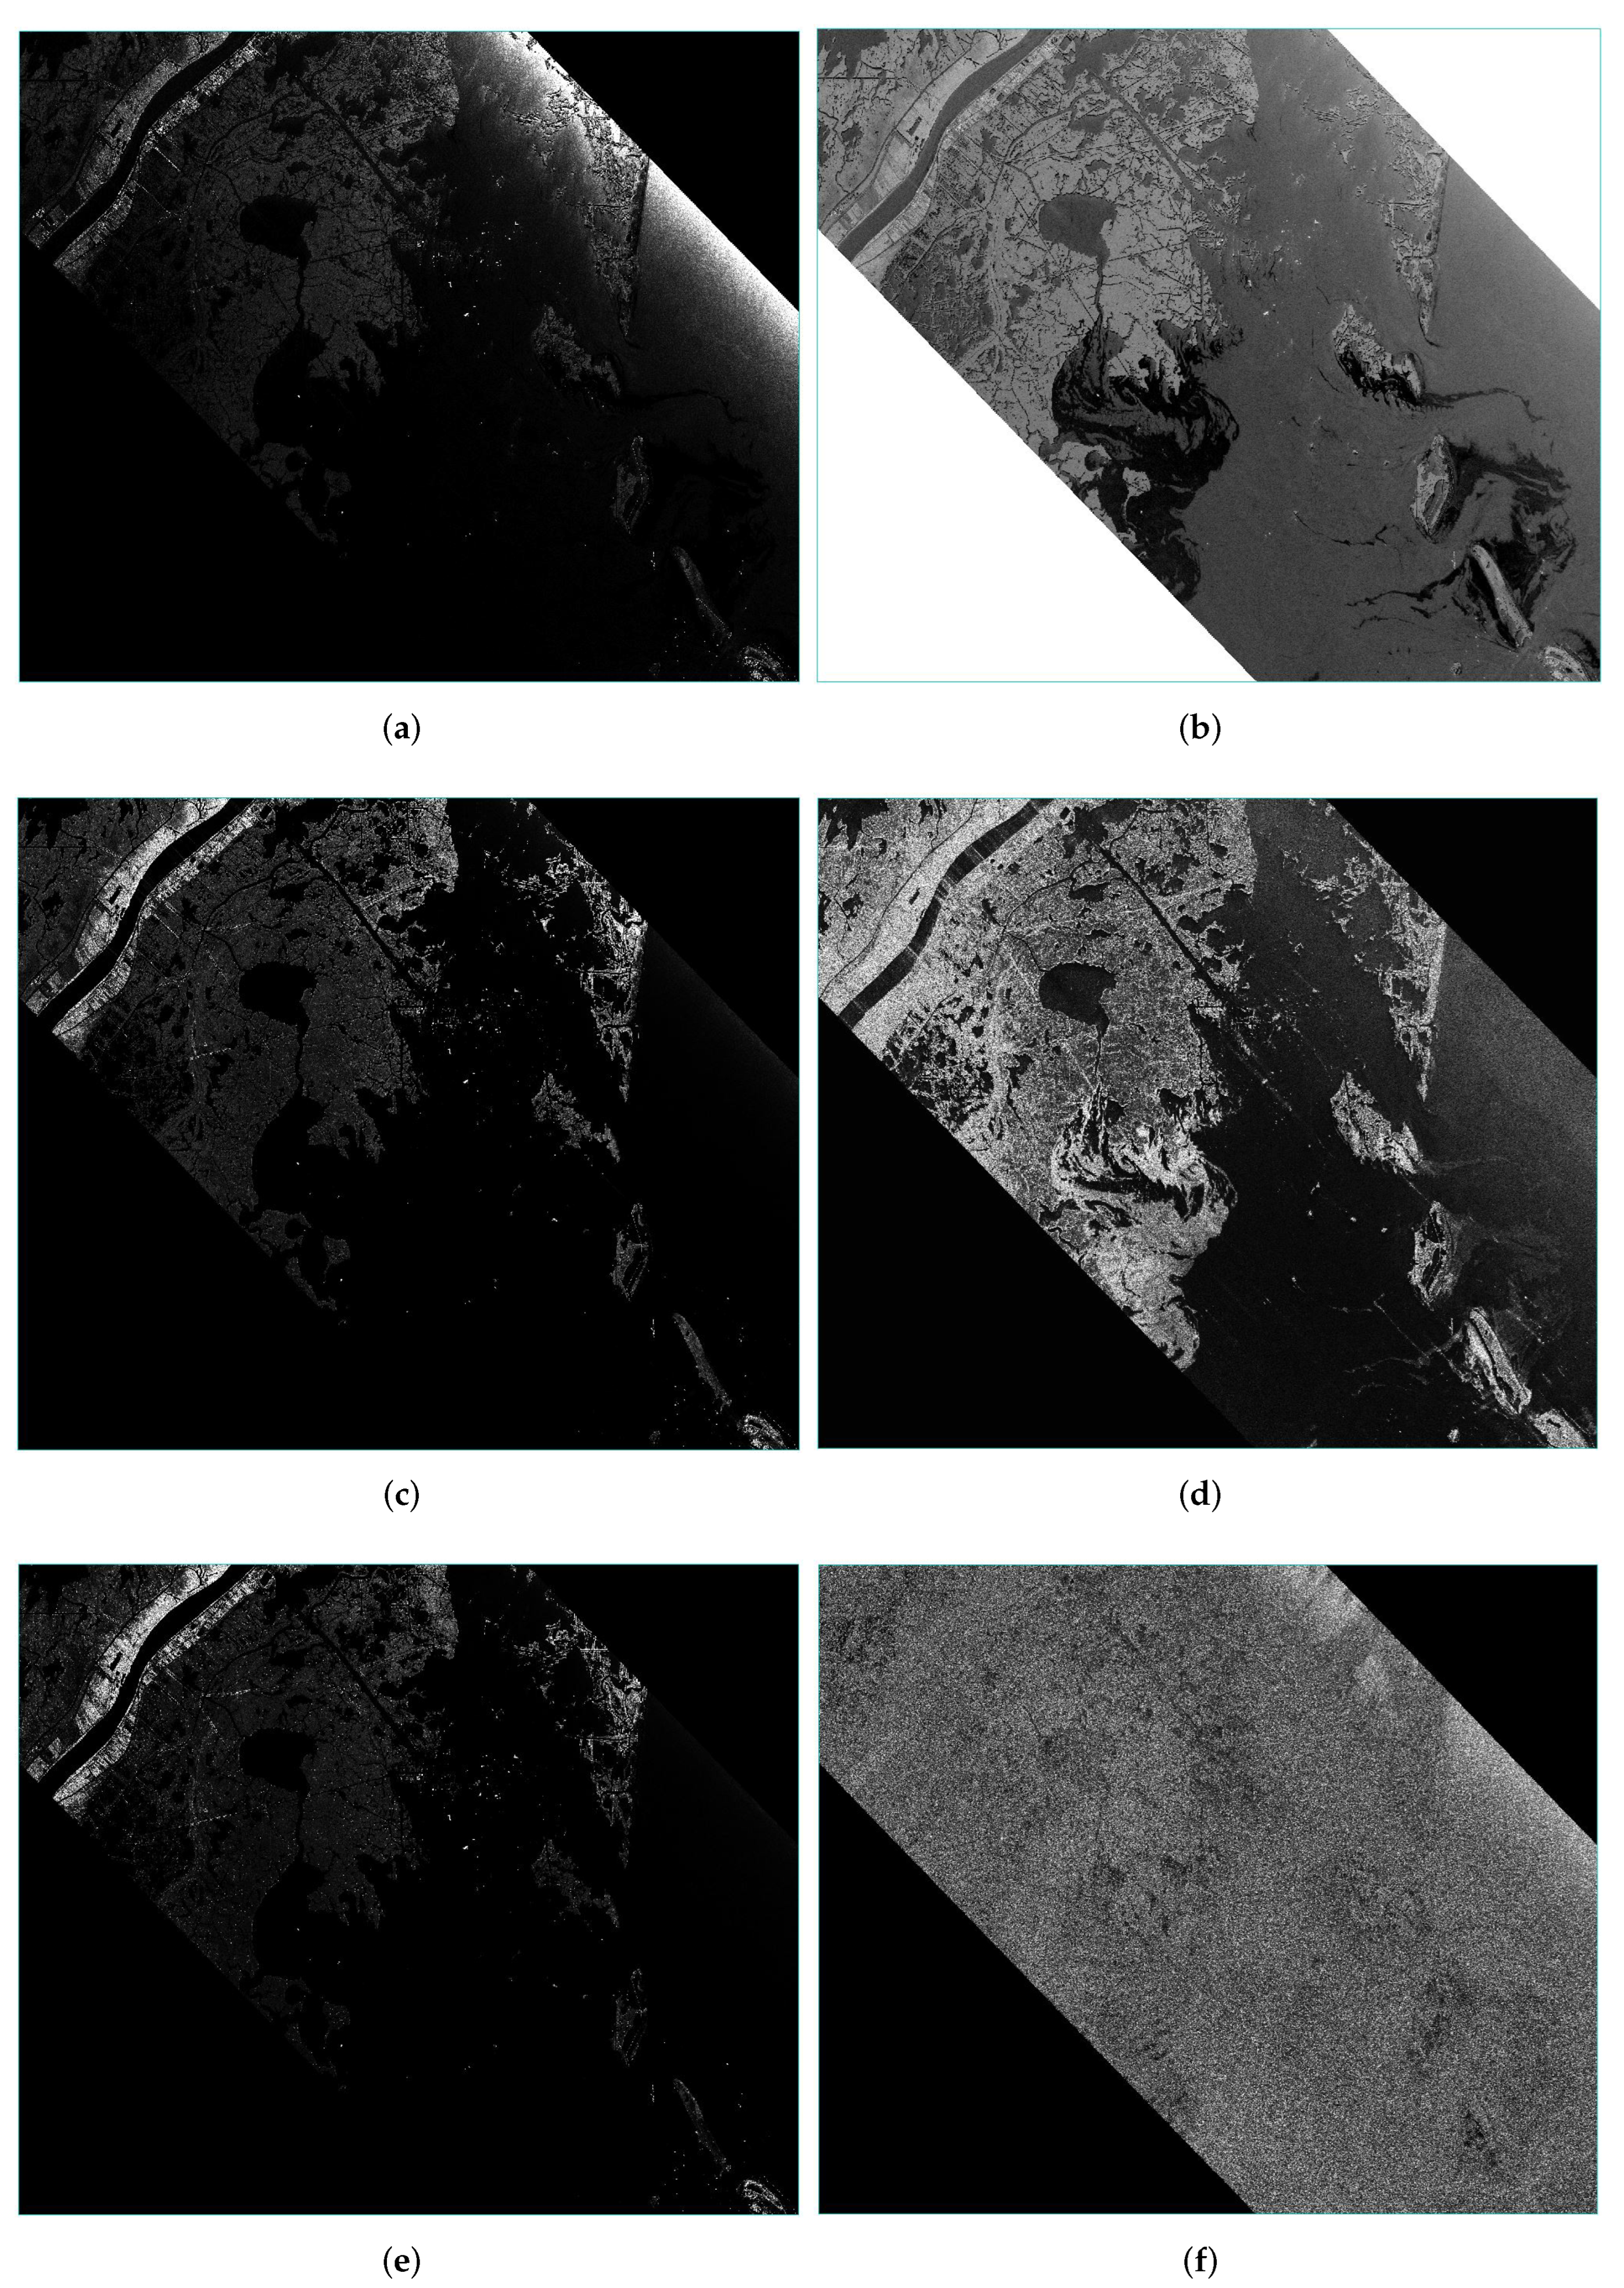
- It is observed from the computed using conventional T3 in Figure 7a and using log-transformed T3 in Figure 7b that oil slicks are clearly visible and easily distinguishable from surrounding water in log-transformed version as compared to the conventional version. In Figure 7a, all the features of the water and oil are suppressed in the dark region due to low backscatter, and the area of water and oil are not discriminated due to minor variation in their ranges. The log-transformed version gives superior results due to the enhancement of lower pixel values which enhances the ranges of oil and water in the image resulting in the proper visible distinction between oil and water in the image as shown in Figure 7a.
- (ii)
- Comparison of using conventional T3 and log-transformed T3 in Figure 7c,d has led to a very interesting and important observation: Image of of log-transformed T3 also highlights slicks of oil along with mudflats and man-made houses present on along sides of canal structure seen at the top of the image. As the oil slicks present in these patches are mixed with sediments (refer Section 3.1) and thus exhibit double-bounce scattering along with surface scattering. of conventional T3 fails to capture this signature.
- (iii)
- Image of Figure 7f calculated using log-transformed T3 reveals no particular structure as there may not be any object present that exhibits volume scattering dominantly. Thus, a clear distinction of features is possible due to eigenvalues of log scaled T3, resulting in better discrimination among different emulsified slicks based on the calculated Entropy, Anisotropy, and Alpha angle.
3.3. H/A/ Decomposition
4. Experiments and Results Analysis
4.1. Experimental Setup and Parameters
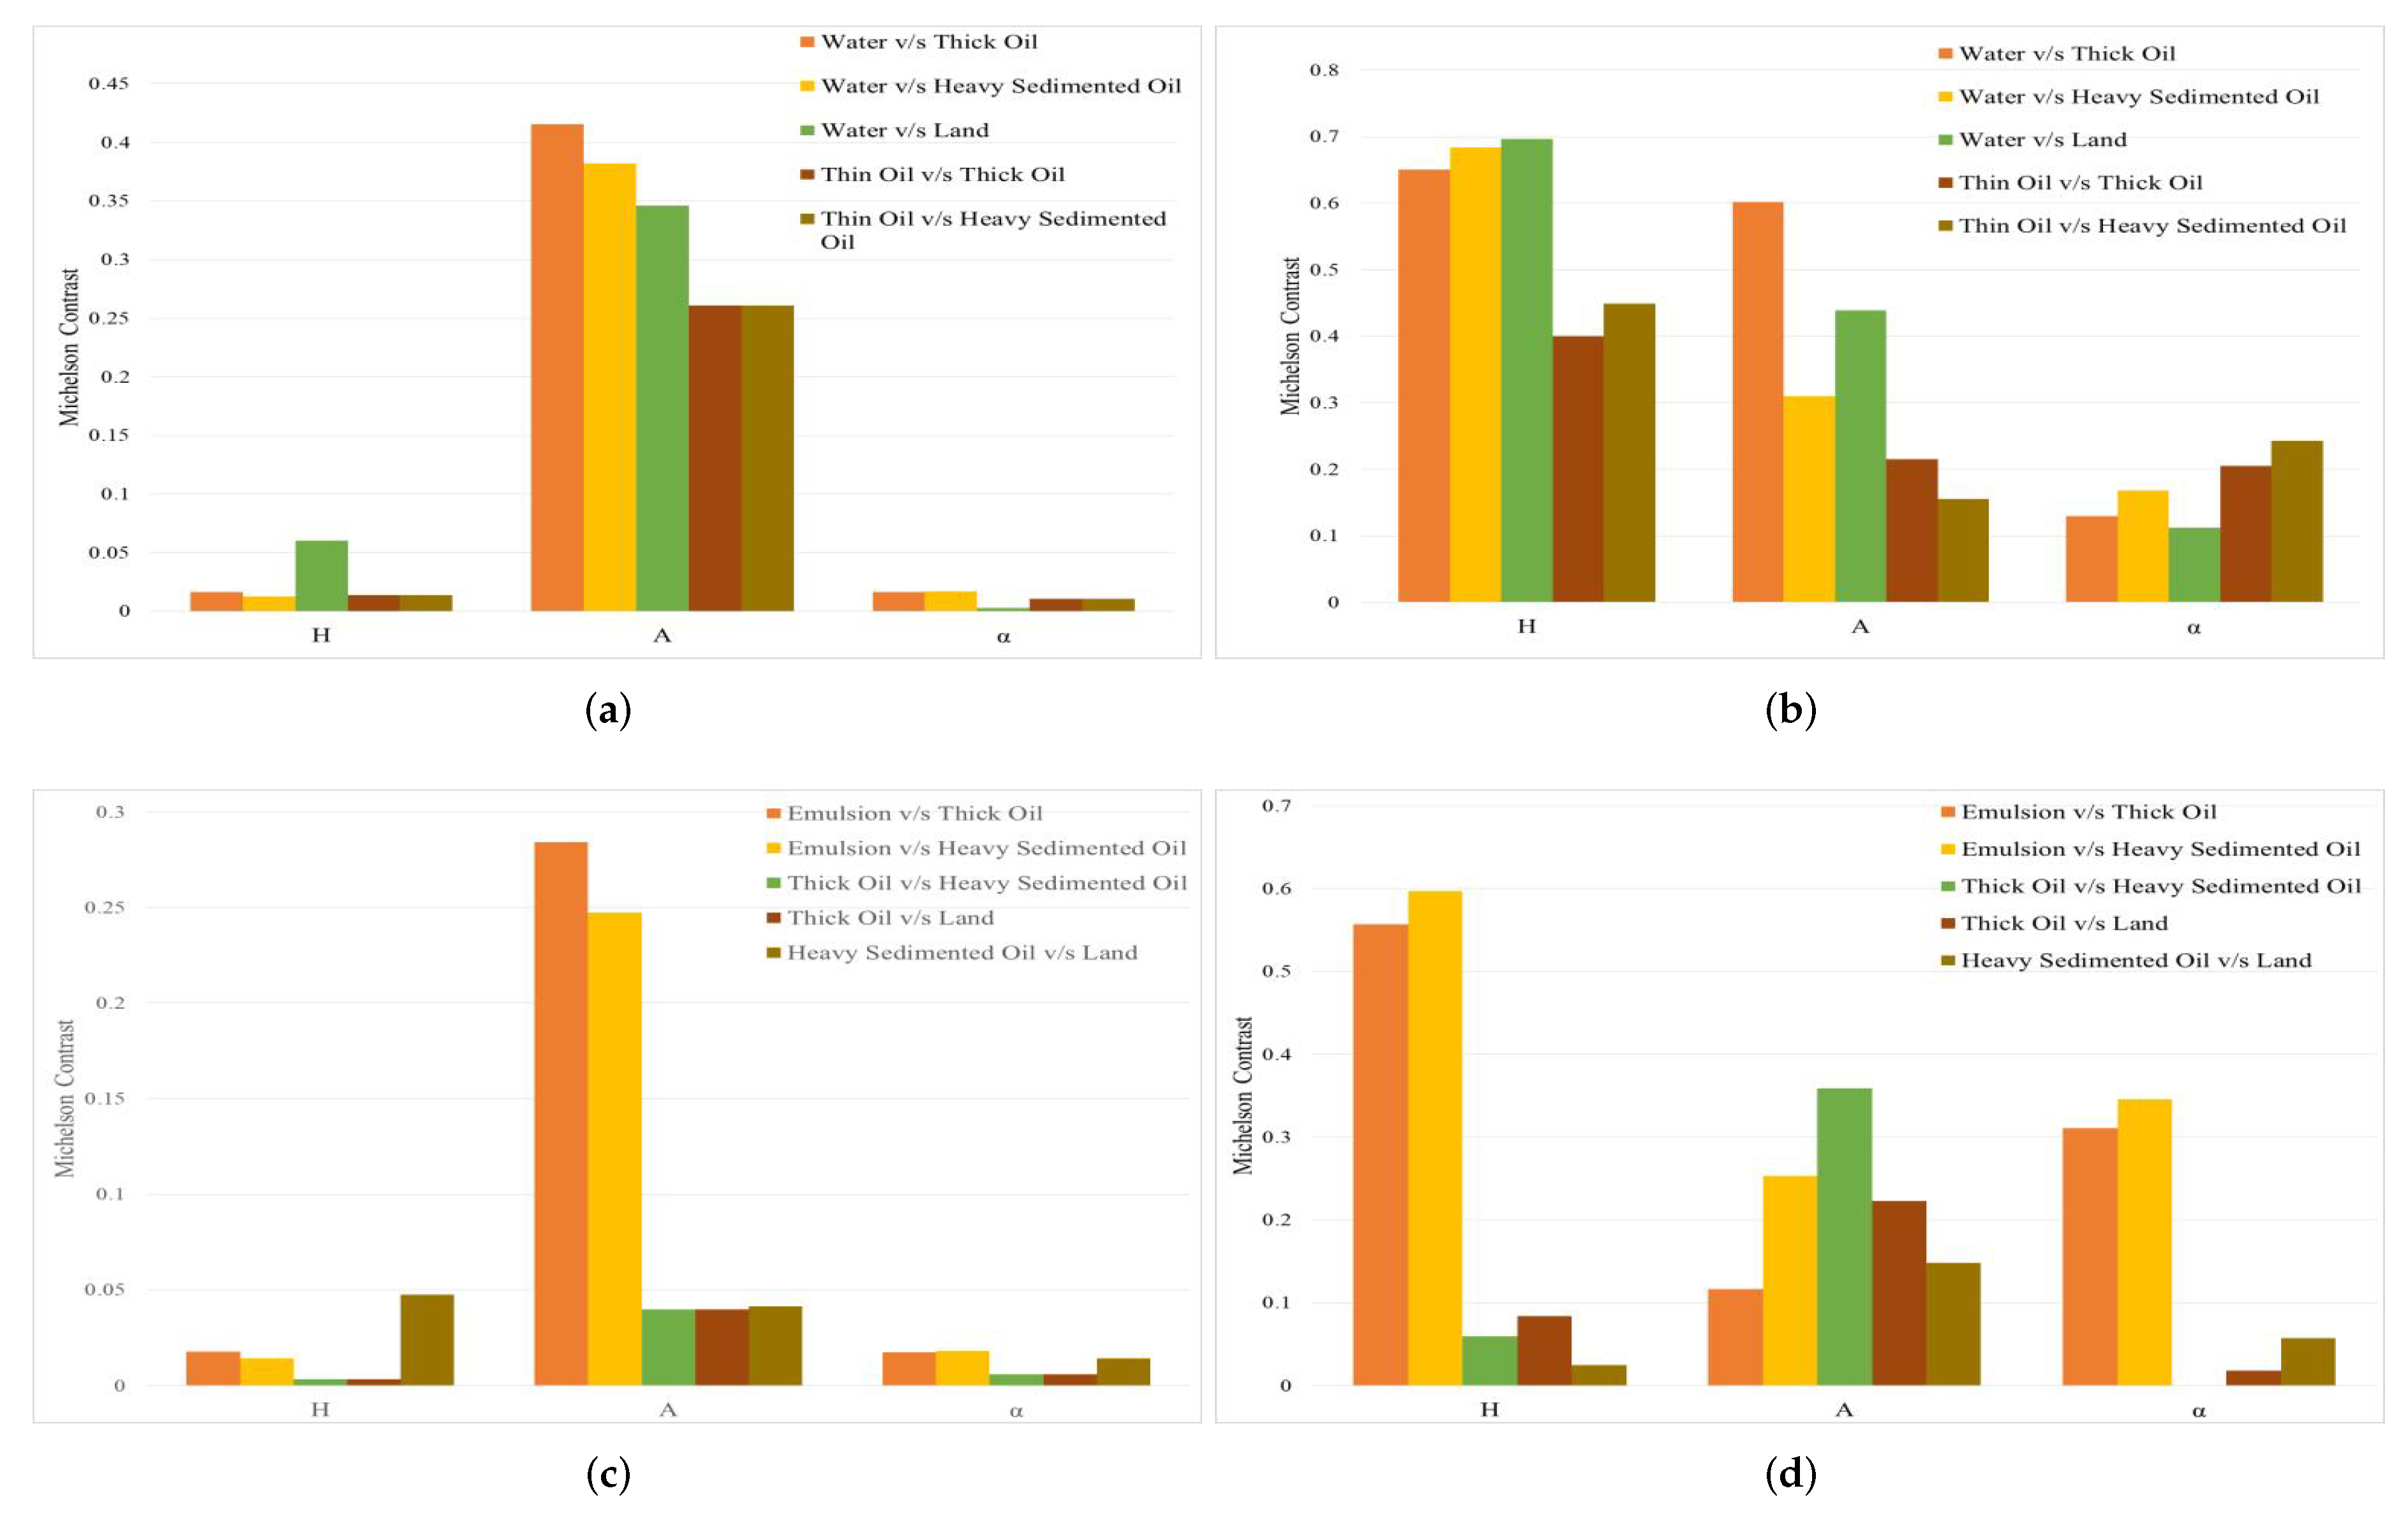
- Michelson Contrast (MC)MC is one of the general criteria for evaluating target separability. It has thus been used to quantitatively define and evaluate contrasts between oil slicks and seawater under various polarimetric feature spaces [19]. MC is calculated as Equation (7).Here and indicate the maximum and minimum mean polarimetric feature values between the two target samples being tested, respectively, and the value range of MC is [0, 1].
- M-Statistic (MS)The MS assesses the degree of discrimination between the two-pixel groups. It operates by evaluating the separation between the histograms produced by plotting the frequency of all the pixel values within the two classes [49]. The M-statistic can be calculated using the mean and standard deviation of two targets to be tested, respectively, as shown in Equation (8)A value of M < 1 denotes that the histograms significantly overlap and the ability to separate (or discriminate) the two regions is poor. A value of M > 1 denotes that the histogram means are well separated and that the two regions are relatively easy to discriminate.
4.2. H/A/ Decomposition Result Analysis
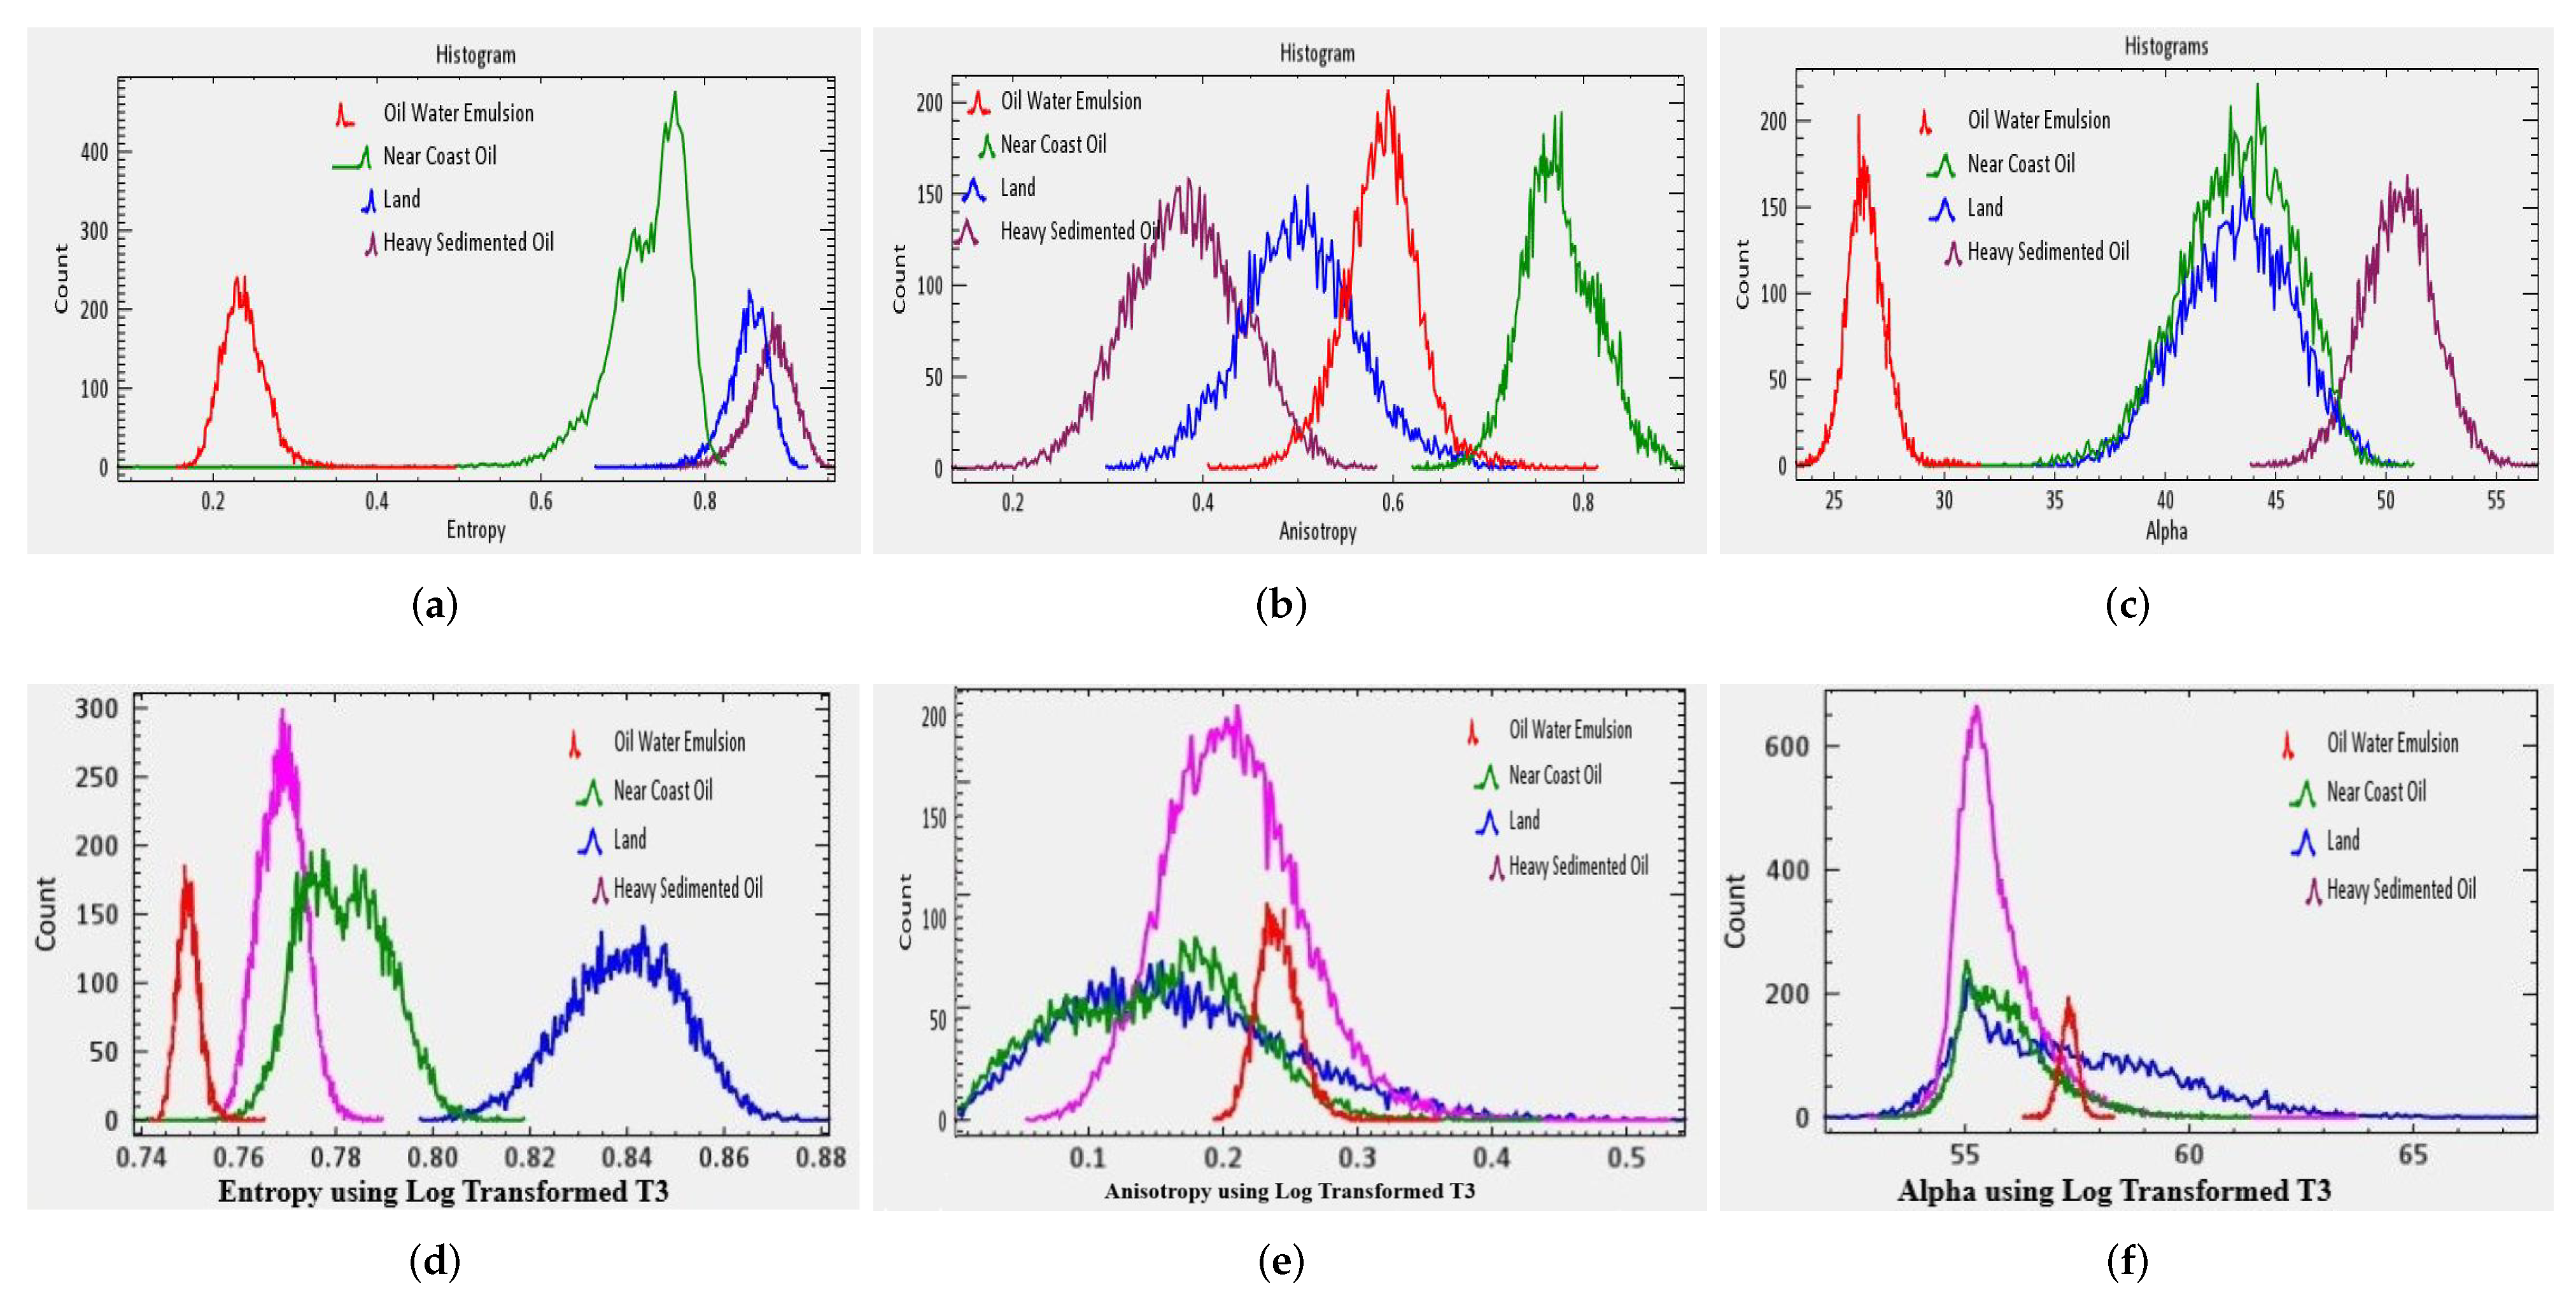
- Entropy calculated using log-transformed T3 Figure 11d captures subtle contrast changes in oil-contaminated patches resulting due to different stages of emulsification which is not the case with entropy calculated using classical T3 Figure 11a. As shown in the histogram in Figure 11d, the oil-water emulsion has a range of 0.74 to 0.76 in the log-transformed approach. It can also differentiate between oil-water emulsion, thick oil, and heavy sedimented oil with an extended upper bound of the range. Further, the entropy values increase gradually from moderate weathering stage oil to high emulsified oil. However, the entropy range calculated using classical T3 Figure 11a for oil-water emulsion is 0.2 to 0.4, roughly which is the same as clean water and surface oil1. This indicates that it does not differentiate between fresh and weakly weathered oil. Further, it also fails to capture minor changes in physical and electrical properties of thick oil and heavy sedimented oil as both have the same range. The blue line in the histogram is for a sample taken of mudflat/shrub/building present near Barataria Bay (BB), Louisiana. It can be clearly seen that the log-transformed T3 gives a different entropy range for highly mixed sedimented oil and mudflat/building regions even though both exhibit a similar scattering mechanism - moderate entropy double bounce. The separation between values of entropy for highly mixed sedimented oil and mudflat/building region is not that clear in the case of classical T3.
- Anisotropy values in Figure 11e calculated using log-transformed T3 show opposite behaviour than classical T3 in Figure 11b. Anisotropy calculated using log-transformed T3 has higher values for clean water and surface oil, which reduce from weakly emulsified oil to highly emulsified oil. However, the anisotropy values calculated using classical T3 cannot differentiate between clean water and any oil sample; it does not show a separate range for building/mudflat samples. On the other hand, anisotropy calculated using log-transformed T3 differentiates between clean water/surface water (Bragg scattering) from different emulsified oils (non-Bragg scattering). However, it fails to differentiate between building/mudflat and oil mixed with partial sediments.
- Alpha values Figure 11f calculated using log-transformed T3 do not show any favorable result in capturing differences between the type of scattering mechanism exhibited by water and different emulsified oils. It shows that clean water and all kinds of oil samples were taken to follow the double bounce scattering. On the other hand, though, Alpha values Figure 11c calculated using classical T3 show surface scattering for clean water and surface oil; double-bounce scattering for oil mixed with sediments. However, it fails to differentiate between thick oil from surface oil/clean water and mudflat/building from oil mixed with sediments.
4.3. Statistical Analysis and Accuracy Assessment
4.4. SVM Classification
5. Conclusions
Author Contributions
Funding
Institutional Review Board Statement
Informed Consent Statement
Data Availability Statement
Conflicts of Interest
References
- Transportation Research Board and National Research Council. Oil in the Sea III: Inputs, Fates, and Effects; National Academies Press (US): Washington, DC, USA, 2003. [Google Scholar]
- Skrunes, S.; Brekke, C.; Eltoft, T. Characterization of marine surface slicks by radarsat-2 multipolarization features. IEEE Trans. Geosci. Remote Sens. 2014, 52, 5302–5319. [Google Scholar] [CrossRef] [Green Version]
- Velotto, D.; Migliaccio, M.; Nunziata, F.; Lehner, S. Dual-polarized TerraSAR-X data for oil-spill observation. IEEE Trans. Geosci. Remote Sens. 2011, 49, 4751–4762. [Google Scholar] [CrossRef]
- Kudryavtsev, V.N.; Chapron, B.; Myasoedov, A.G.; Collard, F.; Johannessen, J.A. On dual co-polarized SAR measurements of the ocean surface. IEEE Geosci. Remote Sens. Lett. 2012, 10, 761–765. [Google Scholar] [CrossRef]
- Skrunes, S.; Brekke, C.; Eltoft, T.; Kudryavtsev, V. Comparing near-coincident C-and X-band SAR acquisitions of marine oil spills. IEEE Trans. Geosci. Remote Sens. 2014, 53, 1958–1975. [Google Scholar] [CrossRef]
- ASCE Task Committee on Modeling of Oil Spills. State-of-the-art review of modeling transport and fate of oil spills. J. Hydraul. Eng. 1996, 122, 594–609. [Google Scholar] [CrossRef]
- Jones, C.E.; Holt, B. Experimental L-band airborne SAR for oil spill response at sea and in coastal waters. Sensors 2018, 18, 641. [Google Scholar] [CrossRef] [Green Version]
- Alpers, W.; Holt, B.; Zeng, K. Oil spill detection by imaging radars: Challenges and pitfalls. Remote Sens. Environ. 2017, 201, 133–147. [Google Scholar] [CrossRef]
- Leifer, I.; Lehr, W.J.; Simecek-Beatty, D.; Bradley, E.; Clark, R.; Dennison, P.; Hu, Y.; Matheson, S.; Jones, C.E.; Holt, B.; et al. State of the art satellite and airborne marine oil spill remote sensing: Application to the BP Deepwater Horizon oil spill. Remote Sens. Environ. 2012, 124, 185–209. [Google Scholar] [CrossRef] [Green Version]
- Al-Ruzouq, R.; Gibril, M.B.A.; Shanableh, A.; Kais, A.; Hamed, O.; Al-Mansoori, S.; Khalil, M.A. Sensors, features, and machine learning for oil spill detection and monitoring: A review. Remote Sens. 2020, 12, 3338. [Google Scholar] [CrossRef]
- Masud, M.; Alshehri, M.; Alroobaea, R.; Mohammad, S. Leveraging Convolutional Neural Network for COVID-19 Disease Detection Using CT Scan Images. Intell. Autom. Soft Comput. 2021, 29, 1–13. [Google Scholar] [CrossRef]
- Topouzelis, K.; Singha, S. Oil spill detection: Past and future trends. In Proceedings of the ESA Living Planet Symposium, Prague, Czech Republik, 9–13 May 2016; European Space Agency (Special Publication): Paris, Frence, 2016. [Google Scholar]
- Zhang, Y.; Li, Y.; Lin, H. Oil-Spill Pollution Remote Sensing by Synthetic Aperture Radar. In Advanced Geoscience Remote Sensing; IntechOpen: London UK, 2014; pp. 27–50. [Google Scholar] [CrossRef] [Green Version]
- Müllenhoff, O.; Bulgarelli, B.; Ferraro, G.; Perkovic, M.; Topouzelis, K.; Sammarini, V. Geospatial modelling of metocean and environmental ancillary data for the oil spill probability assessment in SAR images. Remote Sens. Environ. Monit. Gis Appl. Geol. VIII 2008, 7110, 71100R. [Google Scholar] [CrossRef]
- Leifer, I.; Clark, R.; Jones, C.; Holt, B.; Svejkovsky, J.; Swayze, G. Satellite and airborne oil spill remote sensing: State of the art and application to the BP DeepWater Horizon oil spill. In Proceedings of the 34th AMOP Technical Seminar on Environmental Contamination and Response, Banff, AB, Canada, 4–6 October 2011; pp. 270–295. [Google Scholar]
- Carvalho, G.d.A.; Minnett, P.J.; Ebecken, N.F.; Landau, L. Oil Spills or Look-Alikes? Classification Rank of Surface Ocean Slick Signatures in Satellite Data. Remote Sens. 2021, 13, 3466. [Google Scholar] [CrossRef]
- Sun, S.; Hu, C. The challenges of interpreting oil–water spatial and spectral contrasts for the estimation of oil thickness: Examples from satellite and airborne measurements of the deepwater horizon oil spill. IEEE Trans. Geosci. Remote Sens. 2018, 57, 2643–2658. [Google Scholar] [CrossRef]
- Garcia-Pineda, O.; Staples, G.; Jones, C.E.; Hu, C.; Holt, B.; Kourafalou, V.; Graettinger, G.; DiPinto, L.; Ramirez, E.; Streett, D.; et al. Classification of oil spill by thicknesses using multiple remote sensors. Remote Sens. Environ. 2020, 236, 111421. [Google Scholar] [CrossRef]
- Li, G.; Li, Y.; Hou, Y.; Wang, X.; Wang, L. Marine Oil Slick Detection Using Improved Polarimetric Feature Parameters Based on Polarimetric Synthetic Aperture Radar Data. Remote Sens. 2021, 13, 1607. [Google Scholar] [CrossRef]
- Cloude, S.R.; Pottier, E. A review of target decomposition theorems in radar polarimetry. IEEE Trans. Geosci. Remote Sens. 1996, 34, 498–518. [Google Scholar] [CrossRef]
- Cloude, S.R.; Pottier, E.; Boerner, W. Unsupervised Image Classification using the Entropy/Alpha/Anisotropy Method in Radar Polarimetry. In Proceedings of the NASA-JPL, AIRSAR-02 Workshop, Pasadena, CA, USA, 4–6 March 2002; Volume 44, pp. 4–6. [Google Scholar]
- Belore, R.; Trudel, K.; Morrison, J. Weathering, emulsification, and chemical dispersibility of Mississippi Canyon 252 crude oil: Field and laboratory studies. In Proceedings of the International Oil Spill Conference Proceedings (IOSC), Virtual, 10–14 May 2011; American Petroleum Institute: Washington, DC, USA, 2011; Volume 2011, p. abs247. [Google Scholar]
- Kolian, S.R.; Porter, S.A.; Sammarco, P.W.; Birkholz, D.; Cake, E.W.; Subra, W.A. Oil in the Gulf of Mexico after the capping of the BP/Deepwater Horizon Mississippi Canyon (MC-252) well. Environ. Sci. Pollut. Res. 2015, 22, 12073–12082. [Google Scholar] [CrossRef] [Green Version]
- French-McCay, D.P.; Spaulding, M.L.; Crowley, D.; Mendelsohn, D.; Fontenault, J.; Horn, M. Validation of oil trajectory and fate modeling of the Deepwater Horizon oil spill. Front. Mar. Sci. 2021, 8, 136. [Google Scholar] [CrossRef]
- An, W.; Cui, Y.; Yang, J.; Member, S. Three-Component Model-Based Decomposition for Polarimetric SAR Data. IEEE Trans. Geosci. Remote Sens. 2014, 48, 2732–2739. [Google Scholar] [CrossRef]
- Freeman, A.; Member, S.; Durden, S.L. A Three-Component Scattering Model for Polarimetric SAR Data. IEEE Trans. Geosci. Remote Sens. 1998, 36, 963–973. [Google Scholar] [CrossRef] [Green Version]
- Migliaccio, M.; Nunziata, F.; Buono, A. SAR polarimetry for sea oil slick observation. Int. J. Remote Sens. 2015, 36, 3243–3273. [Google Scholar] [CrossRef] [Green Version]
- Tong, S.; Liu, X.; Chen, Q.; Zhang, Z.; Xie, G. Multi-feature based ocean oil spill detection for polarimetric SAR data using random forest and the self-similarity parameter. Remote Sens. 2019, 11, 451. [Google Scholar] [CrossRef] [Green Version]
- Li, G.; Li, Y.; Liu, B.; Hou, Y.; Fan, J. Analysis of Scattering Properties of Continuous Slow-Release Slicks on the Sea Surface Based on Polarimetric Synthetic Aperture Radar. ISPRS Int. J. -Geo-Inf. 2018, 7, 237. [Google Scholar] [CrossRef] [Green Version]
- Song, D.; Ding, Y.; Li, X.; Zhang, B.; Xu, M. Ocean oil spill classification with RADARSAT-2 SAR based on an optimized wavelet neural network. Remote Sens. 2017, 9, 799. [Google Scholar] [CrossRef] [Green Version]
- Shamsudeen, T.Y. Advances in remote sensing technology, machine learning and deep learning for marine oil spill detection, prediction and vulnerability assessment. Remote Sens. 2020, 12, 3416. [Google Scholar]
- Prajapati, K.; Prajapati, P.; Ramakrishnan, R.; Mahajan, A.; Bhavsar, M. Feature Combination of Pauli and H/A/Alpha Decomposition for Improved Oil Spill Detection Using SAR. In Proceedings of the International Conference on Recent Trends in Image Processing and Pattern Recognition, Aurangabad, India, 3–4 January 2020; pp. 134–147. [Google Scholar]
- Minchew, B.; Jones, C.E.; Holt, B. Polarimetric analysis of backscatter from the deepwater horizon oil spill using l-band synthetic aperture radar. IEEE Trans. Geosci. Remote Sens. 2012, 50, 3812–3830. [Google Scholar] [CrossRef]
- Angelliaume, S.; Dubois-Fernandez, P.C.; Jones, C.E.; Holt, B.; Minchew, B.; Amri, E.; Miegebielle, V. SAR imagery for detecting sea surface slicks: Performance assessment of polarization-dependent parameters. IEEE Trans. Geosci. Remote Sens. 2018, 56, 4237–4257. [Google Scholar] [CrossRef] [Green Version]
- Singha, S.; Ressel, R.; Velotto, D.; Lehner, S. A Combination of Traditional and Polarimetric Features for Oil Spill Detection Using TerraSAR-X. IEEE J. Sel. Top. Appl. Earth Obs. Remote Sens. 2016, 9, 4979–4990. [Google Scholar] [CrossRef] [Green Version]
- Singha, S.; Ressel, R. Offshore platform sourced pollution monitoring using space-borne fully polarimetric C and X band synthetic aperture radar. Mar. Pollut. Bull. 2016, 112, 327–340. [Google Scholar] [CrossRef] [Green Version]
- Krestenitis, M.; Orfanidis, G.; Ioannidis, K.; Avgerinakis, K.; Vrochidis, S.; Kompatsiaris, I. Oil spill identification from satellite images using deep neural networks. Remote Sens. 2019, 11, 1762. [Google Scholar] [CrossRef] [Green Version]
- Matias, Í.d.O.; Genovez, P.C.; Torres, S.B.; Ponte, F.F.d.A.; Oliveira, A.J.S.d.; Miranda, F.P.d.; Avellino, G.M. Improved Classification Models to Distinguish Natural from Anthropic Oil Slicks in the Gulf of Mexico: Seasonality and Radarsat-2 Beam Mode Effects under a Machine Learning Approach. Remote Sens. 2021, 13, 4568. [Google Scholar] [CrossRef]
- Zhu, Q.; Zhang, Y.; Li, Z.; Yan, X.; Guan, Q.; Zhong, Y.; Zhang, L.; Li, D. Oil Spill Contextual and Boundary-Supervised Detection Network Based on Marine SAR Images. IEEE Trans. Geosci. Remote Sens. 2021, 60, 5213910. [Google Scholar] [CrossRef]
- Mera, D.; Bolon-Canedo, V.; Cotos, J.M.; Alonso-Betanzos, A. On the use of feature selection to improve the detection of sea oil spills in SAR images. Comput. Geosci. 2017, 100, 166–178. [Google Scholar] [CrossRef]
- Zhang, J.; Feng, H.; Luo, Q.; Li, Y.; Wei, J.; Li, J. Oil spill detection in quad-polarimetric SAR Images using an advanced convolutional neural network based on SuperPixel model. Remote Sens. 2020, 12, 944. [Google Scholar] [CrossRef] [Green Version]
- Fornaro, G.; Verde, S.; Reale, D.; Pauciullo, A. CAESAR: An approach based on covariance matrix decomposition to improve multibaseline-multitemporal interferometric SAR processing. IEEE Trans. Geosci. Remote Sens. 2015, 53, 2050–2065. [Google Scholar] [CrossRef]
- Jones, C.E.; Minchew, B.; Holt, B.; Hensley, S. Studies of the Deepwater Horizon Oil Spill With the UAVSAR Radar. In Monitoring and Modeling the Deepwater Horizon Oil Spill: A Record Breaking Enterprise; Geophysical Monograph. No. 195; American Geophysical Union: Washington, DC, USA, 2013; pp. 33–50. [Google Scholar] [CrossRef] [Green Version]
- Svejkovsky, J.; Hess, M.; Muskat, J.; Nedwed, T.J.; McCall, J.; Garcia, O. Characterization of surface oil thickness distribution patterns observed during the Deepwater Horizon (MC-252) oil spill with aerial and satellite remote sensing. Mar. Pollut. Bull. 2016, 110, 162–176. [Google Scholar] [CrossRef]
- Garcia-Pineda, O.; MacDonald, I.R.; Li, X.; Jackson, C.R.; Pichel, W.G. Oil spill mapping and measurement in the Gulf of Mexico with textural classifier neural network algorithm (TCNNA). IEEE J. Sel. Top. Appl. Earth Obs. Remote Sens. 2013, 6, 2517–2525. [Google Scholar] [CrossRef]
- Xu, B.; Cui, Y.; Li, Z.; Zuo, B.; Yang, J.; Song, J. Patch Ordering-Based SAR Image Despeckling Via Transform-Domain Filtering. IEEE J. Sel. Top. Appl. Earth Obs. Remote Sens. 2015, 8, 1682–1695. [Google Scholar] [CrossRef]
- Gonzalez, R.C.; Woods, R.E. Digital Image Processing; Pearson Education Inc.: Upper Saddle River, NJ, USA, 2002. [Google Scholar]
- Sumaiya, M.N.; Kumari, R.S.S. Logarithmic mean-based thresholding for SAR image change detection. IEEE Geosci. Remote Sens. Lett. 2016, 13, 1726–1728. [Google Scholar] [CrossRef]
- Kaufman, Y.J.; Remer, L.A. Detection of forests using mid-IR reflectance: An application for aerosol studies. IEEE Trans. Geosci. Remote Sens. 1994, 32, 672–683. [Google Scholar] [CrossRef]


| Ref. | Dataset | Approach | Objective and Outcome |
|---|---|---|---|
| [8] | Envisat ASAR, ERS-1 ERS-2, AVHRR | Oil spill Detection and Lookalike Discrimination |
|
| [30] | RadarSat-2 | Oil Spill Detection and Classification |
|
| [7] | Full Pol UAVSAR | Oil Spill Thickness discrimination |
|
| [18] | UAVSAR, RADARSAT-2, Worldview-2 | Oil Spill Thickness Classification |
|
| [36] | Dual-Pol TerraSAR-X | Oil spill detection and Lookalike Discrimination |
|
| [37] | C Band Sentinel-1 | Oil Spill detection and Segmentation using Deep Learning |
|
| [28] | Radarsat-2, UAVSAR | Oil spill detection and Lookalike Discrimination |
|
| [19] | RADARSAT 2 | Oil Spill Classification based on thickness |
|
| [38] | RADARSAT-2 | Impact of seasons on oil spill detection |
|
| [39] | Deep SAR Oil Dataset | Oil Spill Segmentation using CBD-Net |
|
| [40] | ERS SAR, ENVISAT 2 SAR | Feature Selection for efficient Oil spill Detection |
|
| [41] | RADARSAT-2, SIR-C/X SAR | Oil spill Detection |
|
Publisher’s Note: MDPI stays neutral with regard to jurisdictional claims in published maps and institutional affiliations. |
© 2022 by the authors. Licensee MDPI, Basel, Switzerland. This article is an open access article distributed under the terms and conditions of the Creative Commons Attribution (CC BY) license (https://creativecommons.org/licenses/by/4.0/).
Share and Cite
Prajapati, K.; Ramakrishnan, R.; Bhavsar, M.; Mahajan, A.; Narmawala, Z.; Bhavsar, A.; Raboaca, M.S.; Tanwar, S. Log Transformed Coherency Matrix for Differentiating Scattering Behaviour of Oil Spill Emulsions Using SAR Images. Mathematics 2022, 10, 1697. https://doi.org/10.3390/math10101697
Prajapati K, Ramakrishnan R, Bhavsar M, Mahajan A, Narmawala Z, Bhavsar A, Raboaca MS, Tanwar S. Log Transformed Coherency Matrix for Differentiating Scattering Behaviour of Oil Spill Emulsions Using SAR Images. Mathematics. 2022; 10(10):1697. https://doi.org/10.3390/math10101697
Chicago/Turabian StylePrajapati, Kinjal, Ratheesh Ramakrishnan, Madhuri Bhavsar, Alka Mahajan, Zunnun Narmawala, Archana Bhavsar, Maria Simona Raboaca, and Sudeep Tanwar. 2022. "Log Transformed Coherency Matrix for Differentiating Scattering Behaviour of Oil Spill Emulsions Using SAR Images" Mathematics 10, no. 10: 1697. https://doi.org/10.3390/math10101697
APA StylePrajapati, K., Ramakrishnan, R., Bhavsar, M., Mahajan, A., Narmawala, Z., Bhavsar, A., Raboaca, M. S., & Tanwar, S. (2022). Log Transformed Coherency Matrix for Differentiating Scattering Behaviour of Oil Spill Emulsions Using SAR Images. Mathematics, 10(10), 1697. https://doi.org/10.3390/math10101697