Article

Node Screening Method Based on Federated Learning with IoT in Opportunistic Social Networks

1
School of Computer Science and Engineering, Central South University, Changsha 410083, China
2
Research Center for Artificial Intelligence, Monash University, Clayton, Melbourne, VIC 3800, Australia
*
Authors to whom correspondence should be addressed.
Mathematics 2022, 10(10), 1669; https://doi.org/10.3390/math10101669
Submission received: 12 April 2022 / Revised: 5 May 2022 / Accepted: 9 May 2022 / Published: 13 May 2022
(This article belongs to the Special Issue Complex Network Modeling: Theory and Applications)

Abstract

:
With the advent of the 5G era, the number of Internet of Things (IoT) devices has surged, and the population’s demand for information and bandwidth is increasing. The mobile device networks in IoT can be regarded as independent “social nodes”, and a large number of social nodes are combined to form a new “opportunistic social network”. In this network, a large amount of data will be transmitted and the efficiency of data transmission is low. At the same time, the existence of “malicious nodes” in the opportunistic social network will cause problems of unstable data transmission and leakage of user privacy. In the information society, these problems will have a great impact on data transmission and data security; therefore, in order to solve the above problems, this paper first divides the nodes into “community divisions”, and then proposes a more effective node selection algorithm, i.e., the FL node selection algorithm based on Distributed Proximal Policy Optimization in IoT (FABD) algorithm, based on Federated Learning (FL). The algorithm is mainly divided into two processes: multi-threaded interaction and a global network update. The device node selection problem in federated learning is constructed as a Markov decision process. It takes into account the training quality and efficiency of heterogeneous nodes and optimizes it according to the distributed near-end strategy. At the same time, malicious nodes are screened to ensure the reliability of data, prevent data loss, and alleviate the problem of user privacy leakage. Through experimental simulation, compared with other algorithms, the FABD algorithm has a higher delivery rate and lower data transmission delay and significantly improves the reliability of data transmission.

1. Introduction

In recent years, with the rapid development of society, people’s lives have begun to center around the Internet. Online social networks and e-commerce have developed rapidly, and online life has become an indispensable part of modern life. With the popularity of mobile devices and wearable devices, the device nodes in the network have also become diverse, and the rapidly increasing number of device nodes has higher requirements for network bandwidth and data transmission efficiency. This laid the groundwork for the arrival of the 5G era [1].
5G introduces more key technologies and significantly improves spectrum efficiency and capacity. Its communication transmission speed, efficiency, and quality have been greatly improved, delay and power consumption control are better, and more new services are associated with it. The IoT technology under the 5G network is one of them. With a high-speed and stable 5G network, IoT technology can use sensor technology and embedded technology to intelligently identify, locate, track, and monitor objects, so that it can fully realize the interconnection of the human, machine, and things at any time and place [2,3,4]. Because 5G technology has high-speed data transmission efficiency and a long transmission distance, in actual operation, it can effectively improve the original cellular data module [5], and it can also enrich the communication mode of the terminal and broaden the network frequency band. Therefore, on a 5G network, the coverage area of the IoT can be expanded, and the IoT has found huge development opportunities in the era of 5G networks.
With the advent of the 5G era, the population’s mobile data traffic is increasing rapidly, and the demand for network bandwidth and information is also increasing [6]. There are more and more types and numbers of devices in the IoT [7,8,9,10]. Opportunistic network is a self-organizing network in which a complete path does not need to exist between the source node and the destination node, and the communication between the networks can be carried out through encounters in the process of node movement. In this network, two nodes exchange data in the way of “storage-carry-forward” to realize communication between nodes. Individual members in social networks have a relatively stable relationship system due to interaction, and interaction will also affect social behavior. The opportunistic social network combines the characteristics of the above two networks. With the rapid transmission of large-capacity data in the 5G network, the efficiency and reliability of data transmission at the edge are difficult to guarantee. Therefore, it is necessary to find a routing algorithm that can improve the efficiency of data transmission and ensure data reliability.
Many researchers found that suitable node selection algorithms can effectively improve the delivery rate of data transmission and reduce the transmission delay. However, due to a lack of experience in dealing with complex social relations in opportunistic social networks, they often have difficulty in proposing effective node selection schemes. With the advent of edge intelligence, more and more intelligent applications will be trained and executed on the edge side, and node selection algorithms based on edge computing have become a hot topic in research. However, previous researchers did not notice that the size of the data set on the terminal is often different [11], and the data may not meet the independent distribution characteristics, which makes the training quality of the local model different [12]. At the same time, not all terminal devices tested at the edge are perfect, and some malicious nodes may tamper with the training results, which will cause data loss and poor data reliability. Therefore, how to reasonably select equipment to participate in the calculation to complete node selection is an urgent problem to be solved [8,9,10,11]. Many materials use deep learning algorithms such as Q learning, deep Q learning, etc., but these algorithms still have the problems of difficulty in determining the learning rate and low convergence rate [12].
To solve the problems of low data transmission efficiency, unstable transmission, and user privacy leakage in opportunistic social networks, combined with the relevant characteristics of the nodes in the opportunistic social network, this paper decided to adopt a distributed model training architecture based on federated learning (FL) to deal with the problem of node selection during message transmission. This paper proposes a FABD, FL node selection algorithm based on Distributed Proximal Policy Optimization in IoT algorithm based on federated learning. Under the FL-based distributed training architecture, edge-tested terminal devices can use the data collected by themselves to perform training tasks locally, and then upload the trained local model parameters to the cloud server for model aggregation. After completing the aggregation, evaluate the heterogeneous data quality and training capabilities of the terminal equipment, and select nodes based on the training data. In the opportunistic social network environment, our FABD algorithm can also obtain the optimal set of nodes more efficiently. The main work of this paper is as follows:
  • In order to achieve high-quality data transmission, it is necessary to evaluate nodes. Therefore, this paper establishes a community model in opportunistic social networks, divides nodes into different communities according to their evaluation results and node properties, and studies nodes within the community. Select relevant content to improve the efficiency of data transfer.
  • To realize the screening of malicious nodes and the selection of heterogeneous device nodes, this paper establishes the FL distributed training system architecture based on deep reinforcement learning. Then, a node selection-oriented accuracy optimization problem model is constructed, which aims at minimizing the overall loss function of the participating equipment during each FL iteration process and satisfies the constraints including transmission and calculation delays.
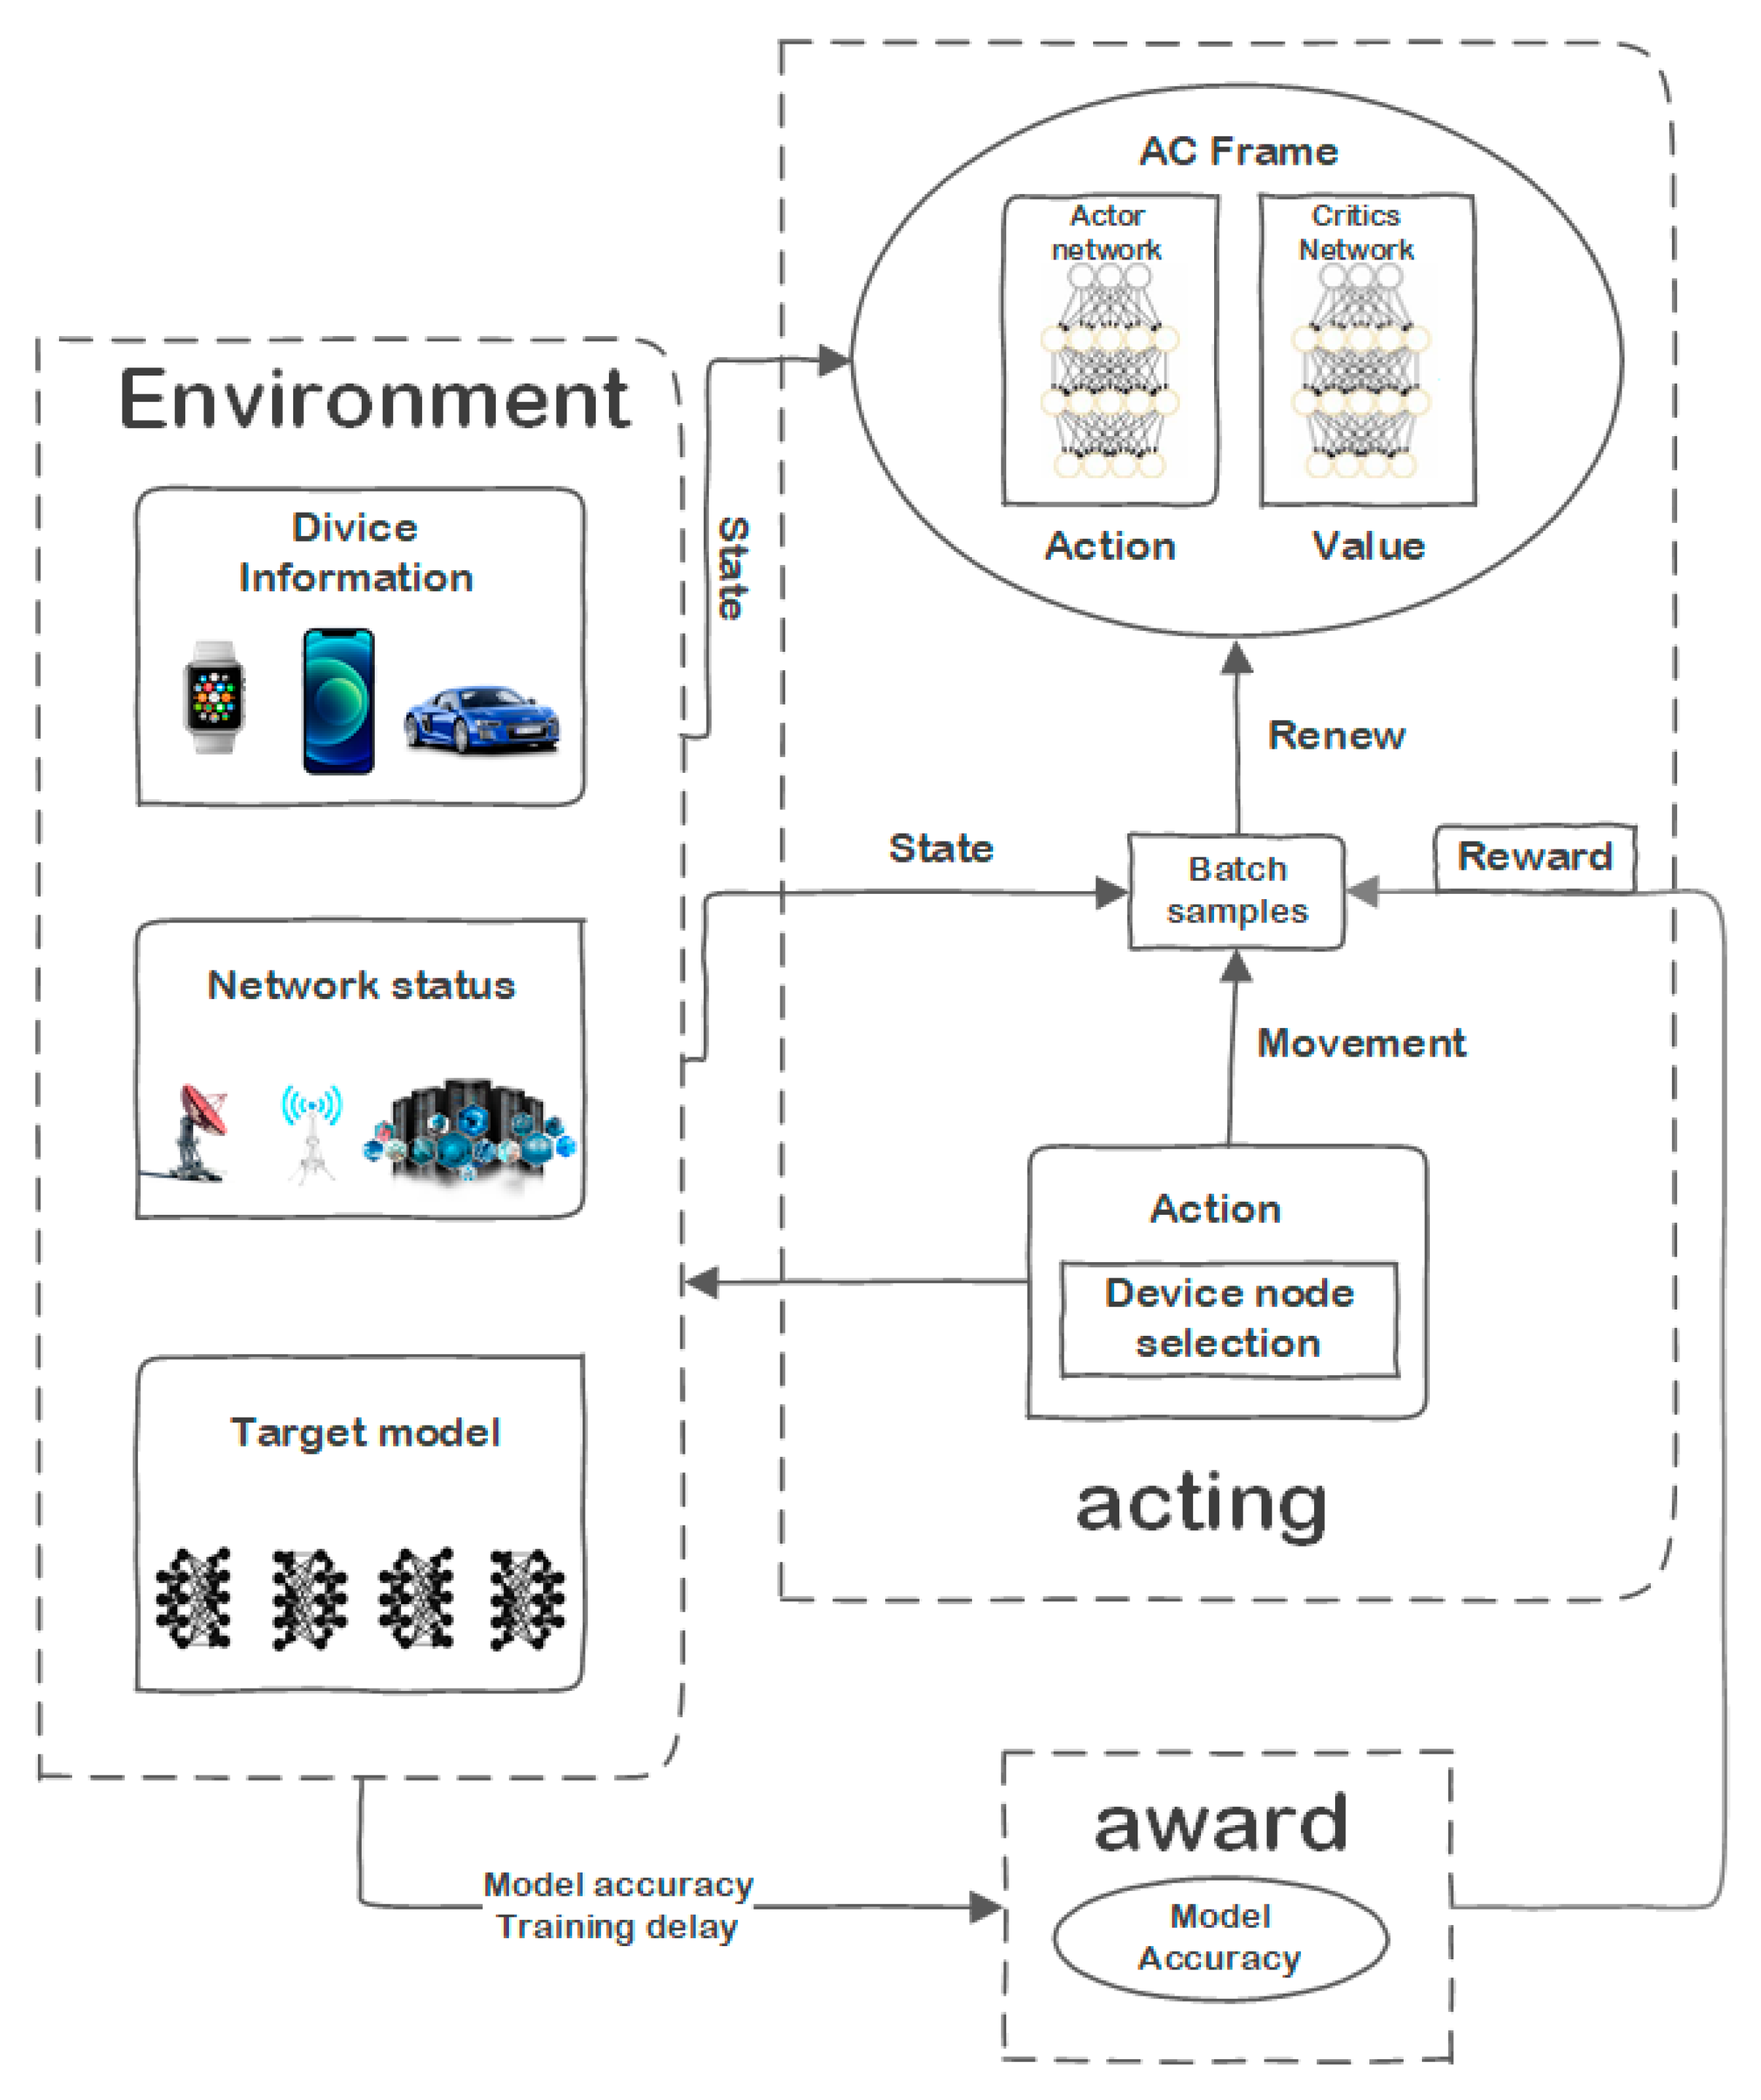
  • A node selection algorithm based on distributed near-end strategy optimization is designed, and the device node selection problem in federated learning is constructed as Markov decision optimization (MDP), and actions, state spaces, and reward functions are defined. Based on the thread and PPO algorithm, a DPPO-based node selection algorithm is designed to optimize the problem and solve it.
  • Based on a variety of data sets and diversified simulation training, the proposed algorithm and other routing algorithms are simulated experimentally to verify the performance. The experimental results show that the model and data transmission method proposed in this paper has a higher delivery rate, better delay performance, so it can improve data transmission reliability than other algorithms in different environments. At the same time, the algorithm has good convergence and robustness.
The rest of this paper is as follows: In the second part, some representative research on data transmission routing algorithms in opportunistic social networks will be introduced. In the third part, some terms, concepts, and algorithm models used in this paper will be introduced. The fourth section of this paper will introduce the setup of simulation experiments, the performance of our proposed model will be verified in this section, too. The full text will be discussed and summarized at the end of the article.

2. Related Work

Recently, the research of data transmission in opportunistic social networks has become a hot issue; how to improve the efficiency and reliability of transmission is worthy of further investigation. Up to now, many people proposed routing algorithms based on data transmission in opportunistic social networks. Here are some of the well-known routing algorithms.
The main idea of Yovita and Restu [13] was to use the First Contact algorithm [11] on the delay-tolerant network. The basic idea of the algorithm was to copy the message it carries, and then hand it to other nodes that are encountered first. Li and Chen proposed the Floyd shortest path algorithm [14]. The algorithm took into account the time factor of the wireless link, and it can obtain the shortest delay path more effectively than the First Contact and Direct Delivery algorithms. Aung and Ho [15] believed that data transmission in opportunistic networks needs robustness and flexibility to deal with mobility issues caused by fading. They proposed new data transmission solutions to ensure low latency and low overhead and control unnecessary transmission/duplication, which mainly include two main algorithms: storage-carry-coordinated forwarding routing and information popularity control.
Eshghi [16] studied epidemic routing in energy-constrained delay-tolerant networks (DTN); they found that the optimal dynamic forwarding decision follows a simple threshold-based structure in the mean-field state. Lenando and Alrfaay [17] noticed an important social feature of epidemic routing and forwarding strategies in their research, namely degree centrality, and then proposed the EpSoc hybrid routing protocol, which uses the TTL of the message according to the centrality of the node. Rango et al. [18] proposed an expansion method optimized for the reasons of energy consumption and message transmission when studying the epidemic algorithm, to solve the problem that the source node in the network cannot be guaranteed. In the study by DTN, Karimi, and Darmani [19], they found that when the message is transmitted between nodes, the replication process consumes a lot of network resources, so they developed two different transmission paths and two Energy-saving probability forwarding methods for heterogeneous node sets with different available numbers.
Among routing algorithms, the flooding routing algorithm is a simple and effective method, but this strategy will generate a large number of duplicate packets, which will greatly occupy network resources. To reduce the cost of flooding in delay-tolerant networks, McGeehan et al. [20] proposed the ChitChat system, which is a new message routing system based on social context and focuses on sparse connections. Various factors such as buffer space, energy limitation, node density, and sparse network will affect the message transmission, so Sharma et al. [21] proposed a new routing protocol that put forward the concept of supernodes on the basis of flooding, and organized the network in the form of clusters to limit flooding. However, in mobile opportunistic networks, connection interruptions caused by node mobility and unreliable wireless links may trigger flooding operations in the route repair process. Therefore, Prabhavat et al. [22] proposed the LOFT algorithm on the basis of flooding, which reduces routing expansion based on the efficient cost of querying localized routing protocols, thus controlling the propagation of routing data packets in the routing discovery and routing repair mechanism.
Spyropoulos et al. [10] proposed an algorithm called “Spray and Wait”. This new algorithm can avoid the performance dilemma of practical solutions based on complexity, and also overcome the epidemic and flooding algorithms’ drawbacks. Derakhshanfard and Sabaei [23] noticed the superiority of this algorithm when studying opportunistic networks, and improved them, then proposed a method of continuously selecting the next node and considering the number of copies that a node can deliver. To enhance the performance of “Spray and Wait”. Cui [24] proposed a new metric called Quality of Node (QoN) to measure the ability of a node to forward messages, and then proposed an adaptive Spray and Wait for routing algorithm based on QoN. Wu et al. [25] combined the Spray and Wait strategy with social relations and proposed the SC-SS algorithm, which is an adaptive multi-jet waiting routing algorithm.
In the actual network environment, the amount and priority of traffic are different, so the research on priority in routing strategy is valuable. Zhang and Zhou [26] proposed a new routing algorithm based on an efficient path routing strategy, it aimed to overcome the network congestion which is caused by a large number of traffic with different priorities. Cabaniss and Vulli [27] believed that in networks such as mobile ad hoc networks, messages are transmitted from node to node. From node to a base station, dynamic social grouping (DSG) can reduce bandwidth and delivery time. Therefore, the efficiency of the routing algorithm based on the grouping strategy is better.
In the study of opportunistic social networks, Wu and Chen [7] proposed a method called the effective data packet iteration and transmission algorithm (EDPIT) to avoid the death of nodes. Yang and Wu [3] found in their research that the information transmission between nodes can be carried out through the broadcast model, so they proposed a low-latency algorithm based on continuous interference cancellation technology for opportunistic networks to improve propagation delay. Based on the symmetry problem in opportunistic social networks, Xiao and Wu [6] established a message repetitive adaptive distribution and jet routing strategy (MDASRS) algorithm model, which used social pressure to measure the strength of connections between nodes to achieve the effect of reducing network burden and network overhead.
The above research on routing algorithms have discussed how to improve the efficiency of message transmission in opportunistic social networks from various perspectives, but none of them reconstruct the social network according to the actual situation, and the quality of message transmission is not high. In this paper, researchers established a community model in an opportunistic social network, and established a FL distributed training system architecture based on deep reinforcement learning within the community to realize the screening of malicious nodes and the selection of heterogeneous device nodes. In contrast to previous scholars’ work, such preparations can ensure the efficiency of message transmission in opportunistic social networks and improve the performance of node selection algorithms. The rest of this paper will mainly introduce the node selection method and FABD algorithm based on federated learning.

3. Methods

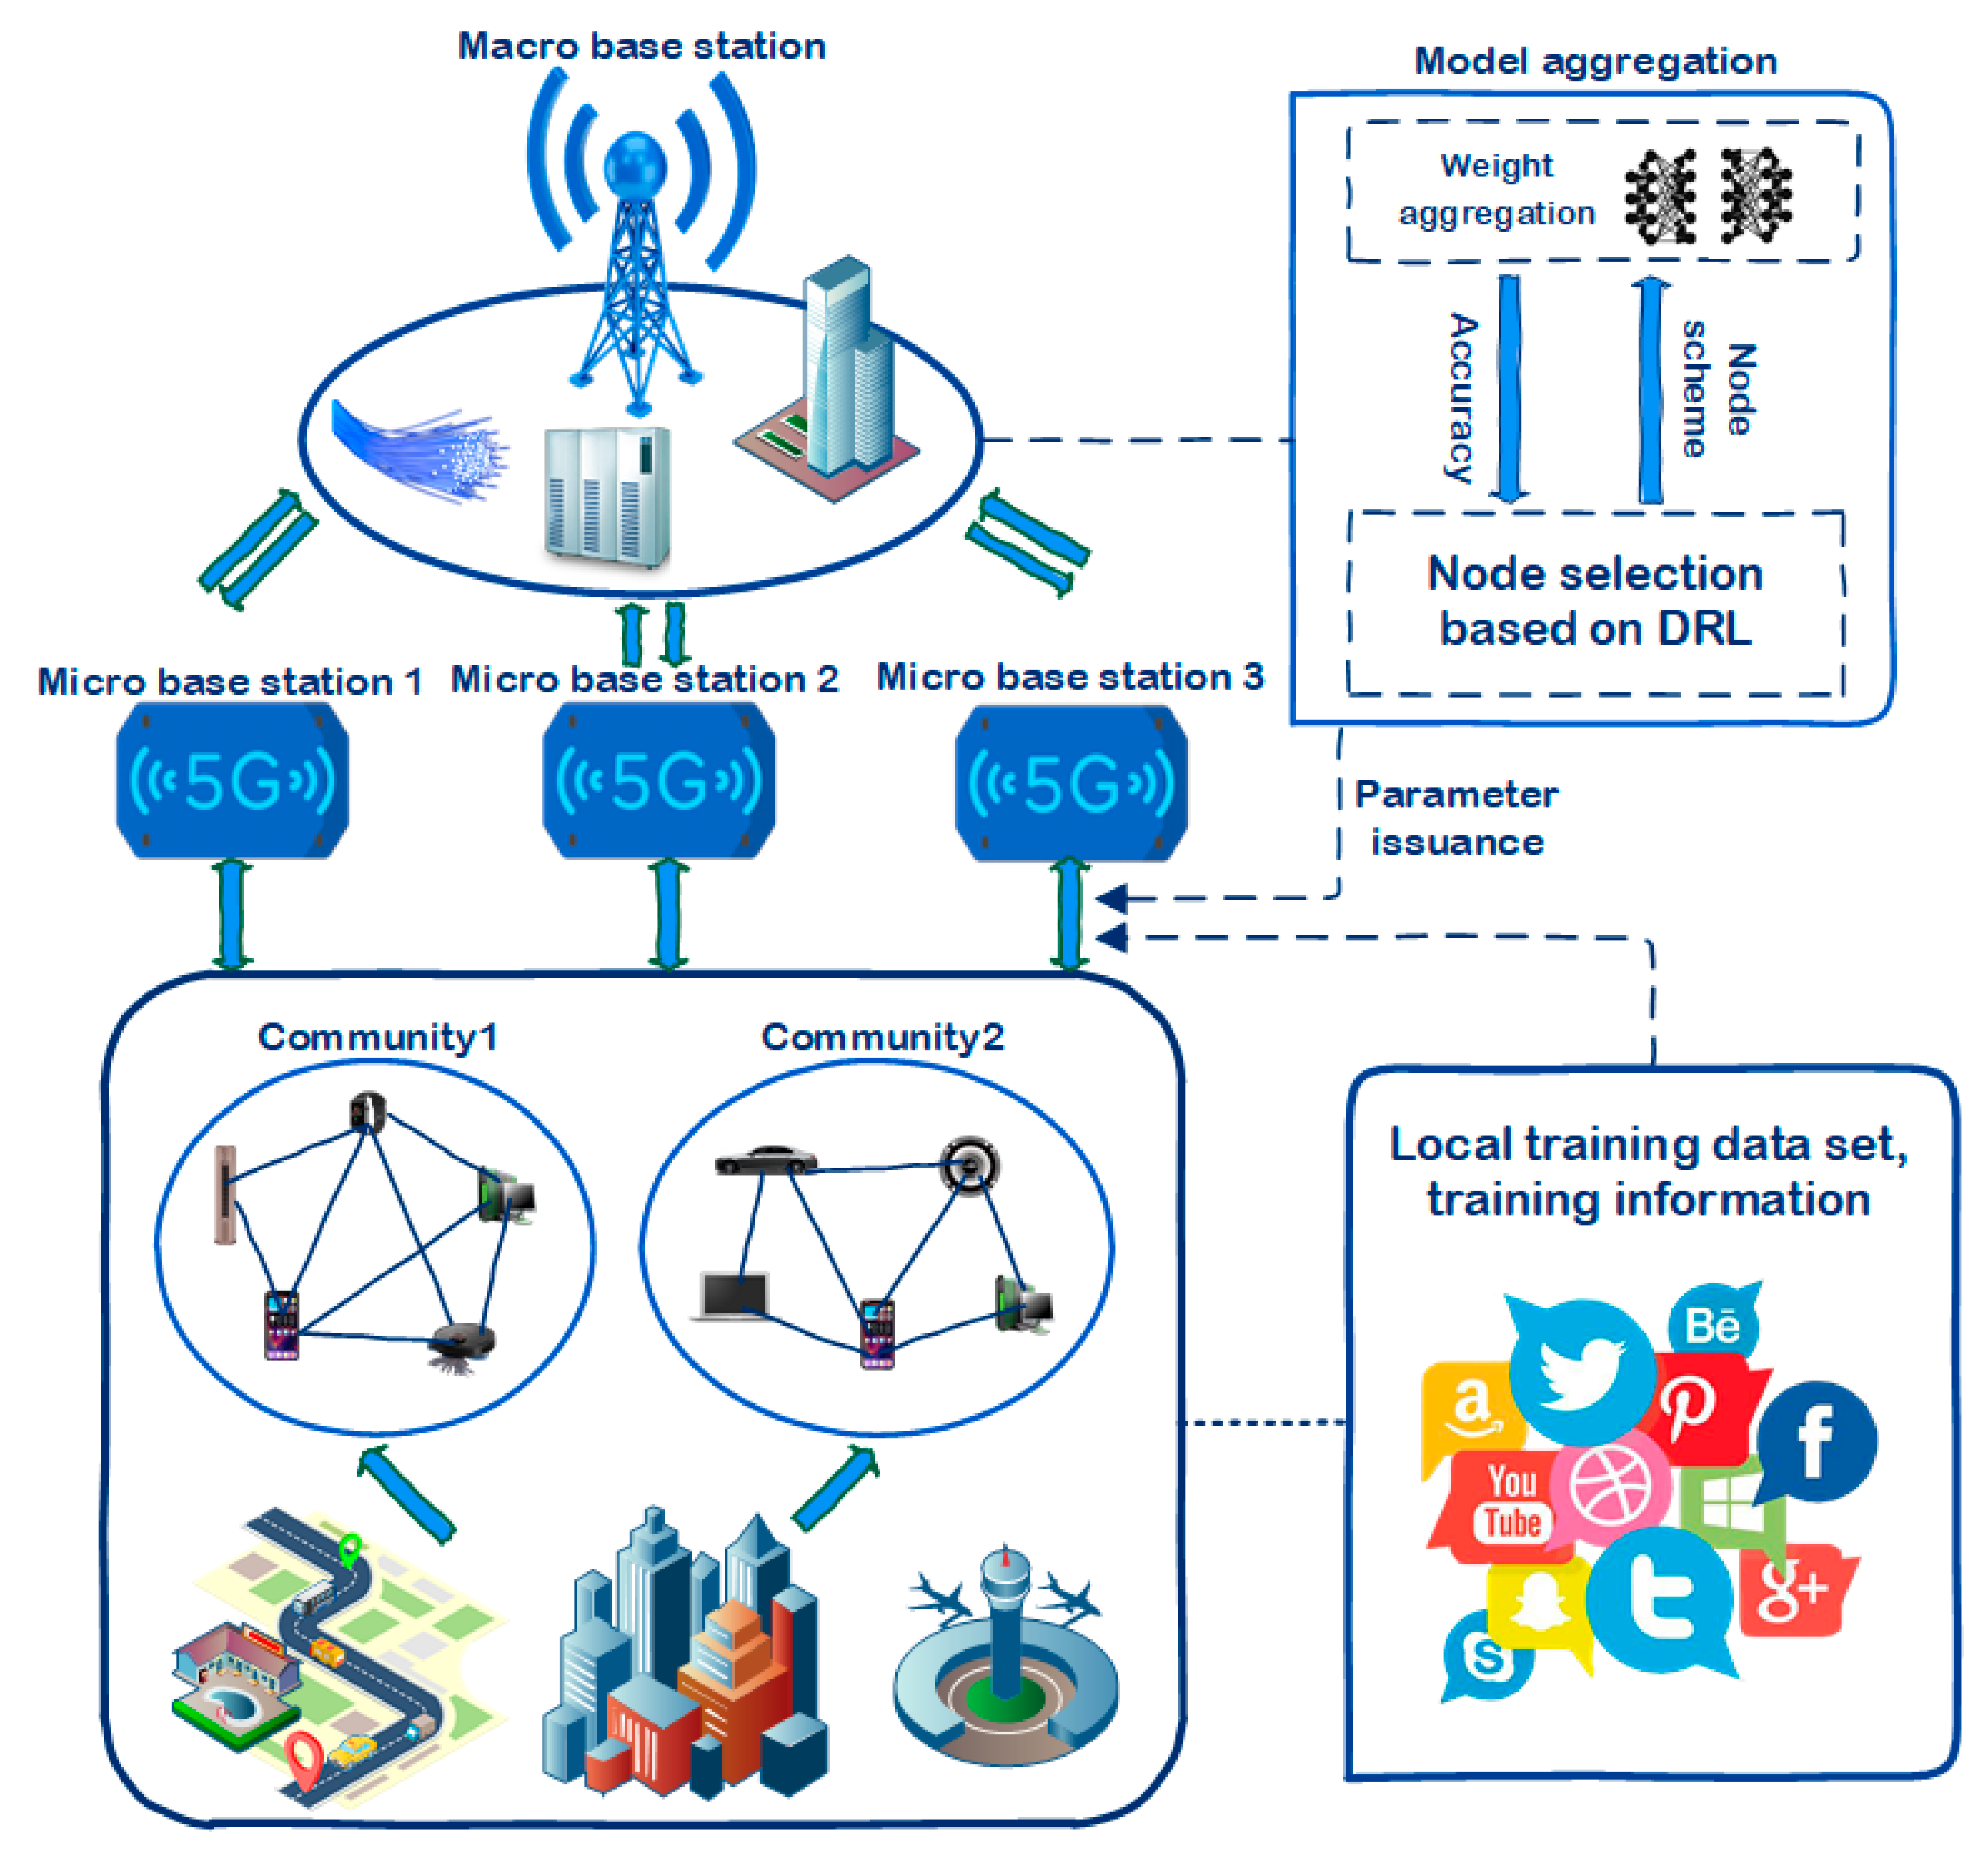
3.1. Model Description

The basis of this paper is the opportunistic social network, and the data transmission model in the opportunistic social network is a very important aspect [28]. In the era of the IoT, the number of devices in opportunistic networks has increased dramatically, and data transmission between devices has become more complicated. Figure 1 is the overall model design diagram, which simulates the real scenes of various mobile devices and computing servers such as mobile phones and personal computers in the context of the IoT. The letters used in the model design of this paper and their definitions are listed in Table 1.
In the opportunistic social network, we define P = (N, D, w), where N represents the set of terminal device nodes in the opportunistic network, and D is the set of edges between nodes, which can also be expressed as D = {(u,v)|uN, vN}, w represents the weight between u and v. In the IoT network, multiple devices will be controlled by different servers for data transmission. The server will be stored in micro base stations and higher-level macro base stations. We set the set of these servers as M, and each server mM has certain computing power. It covers several terminal devices through adjacent servers. U m , n ={ x m , n , y m , n } to represent the data set of terminal n covered by server z.
To ensure the high speed and stability of data transmission, we need to use a better node selection method during the transmission process, which can also reduce the loss during the transmission process and improve the accuracy of the transmission [29]. In the IoT network, many devices including a large number of handheld devices are nodes in the network, and the data transmission between them has a certain degree of randomness and instability [30,31,32]. In this article, we mainly discuss the influence of node selection on data transmission during the forwarding process, and propose a FABD, FL node selection algorithm based on DPPO in IoT algorithm based on federated learning. It can ensure the reliability and high efficiency of data transmission and can make the selection of nodes fast and high-quality in the IoT network with a huge number of nodes.

3.2. Community Model Design

In opportunistic social networks, communication between nodes is generally carried out through the store-carry-forward mode, so it also has a certain degree of mobility and randomness. When analyzing the problem of data transmission in the opportunistic social network, we must first have a certain understanding of the structure of the opportunistic social network. In the traditional opportunity network, each node seems to be independent of each other; however, due to the existence of various social relationships, nodes may aggregate into a community, and this will be explored through a few inferences.
According to the definition of the weighted network above, the current degree of community structure is defined as:
Ψ ( t ) = κ a Κ φ s ( 2 Κ ) 2  
where Ψ represents the degree of modularity of the community, Κ represents the total weight, κ a represents the total weight of all edges in the community a , and φ s represents the sum of the degrees adjacent to the node s in the community.
Theorem 1.
In an opportunistic social network, increasing the weight can increase the degree of association with the community.
Theorem 2.
If the connection weights of two sub-communities have the following relationship.
φ i φ j 2 Κ < κ i j < Δ κ + φ i φ j + φ s Δ κ + Δ κ 2 2 ( Κ + Δ κ )
then these two communities are separate.
Theorem 3.
When the weight of an edge decreases, two nodes are connected by this edge, and this edge is the only edge of one of the nodes. If the weight of this side changes, then the community is not divided.
The proof of the above theorem is attached in the Appendix A. From the above several theorems and their proofs, we can obtain some characteristics of the opportunistic social network, and the most important one is its “community” nature. There are many relationships between nodes in the opportunistic network, such as social relationships, because these nodes will be divided into communities. There will be more connections between nodes in the same community, and the data transmission between them is more changeable. Therefore, below we will focus on the data transmission scheme between nodes in the same community.

3.3. Description of the Transmission Process

The focus of the transmission process in the community lies in the selection of nodes. In terms of node selection, we mainly design and select schemes and algorithms based on federated learning. As mentioned above, the composition of a computing network includes terminal equipment, micro base stations, macro base stations, and computing servers. In the terminal equipment, we must first perform local training. For a task λ Λ , define the total data set related to the task as
U λ = m M λ n N λ U m , n
When the terminal device n is performing the local training task λ, the loss function can be expressed as
U λ = m M λ n N λ U m , n
When the terminal device n is performing the local training task λ, the loss function can be expressed as d m , n λ ( x m , n , y m , n ; μ m , n ) , This can represent the difference between its predicted value on the sample data set U m , n and the true value, so the loss function of task t in all data sets can be defined as:
D λ ( μ ) = 1 | U λ | m M λ d m , n λ ( x m , n , y m , n ; μ m , n )
where μ is the weight of the current training model | U λ | represents the size of the training data set. The main purpose of federated learning in this transmission model is to minimize the loss function D λ ( μ ) of the task to optimize the global model parameters, which can be expressed as:
μ = a r g m i n D λ ( μ )
The parameters of federated learning in this article need to be updated, and the method of updating is gradient descent. This can also be expressed as randomly selecting a piece of data { x m , n , y m , n } to update each time. This method can greatly reduce the amount of calculation, but because it is randomly selected, we also need to carry out enough local training to take care of the quality of the model. The update of model parameters can be expressed as
μ m , n p = μ m , n p σ d ( μ m , n p 1 )
Among them, σ represents the learning rate when the parameters are updated, and p is the number of iterations.
When the local model calculation reaches a certain amount or the number of iterations reaches a certain amount, the server of the macro base station can perform global model aggregation on the local model. The specific weight aggregation can be expressed as:
μ a * = μ a + m M λ n N λ | U m , n | ( μ m , n * μ m , n ) | U λ |
Among them, U m , n represents the size of the data set of the terminal device n participating in the federated learning task. It can be seen that a terminal device with a larger data set has a larger weight.
The selection of device nodes is affected by many factors. First, the differentiated computing and communication capabilities of terminal devices will directly affect the local training and data transmission delays. Second, the size of the data set of each terminal device in the opportunistic social network is also different, so this paper constructs a model of the optimal accuracy problem for node selection.
The first thing to pay attention to is the accuracy rate. For a federated learning task λ   ϵ   Λ , its training quality is defined as the test accuracy rate of the aggregated global model on the test data set. This article uses the sum of the loss functions of the test data set to express the test accuracy rate, it can be expressed as:
S λ = D λ ( x t e s t , y t e s t ; μ a )
Then consider the issue of time delay. The total delay of each model aggregation will include the training delay of the data on the terminal equipment and the transmission delay on the link. The transmission rate of the parameter data of the federated learning task t between the terminal equipment and micro base station and which between the micro base station and the macro base station can be expressed as
v λ n = W n w ( 1 + e n C n N 0 W n ) , n N λ
v λ m = W m w ( 1 + e m C m N 0 W m ) , m M λ
Among them, W n and W m respectively represent the available bandwidth between the device and the micro base station and between the device and the macro base station. C n is respectively expressed as the channel gain between the device and the micro base station and C m means that between the micro base station and the macro base station. e n and e m represent respectively the transmit power of the device and the micro base station, N 0 represents the noise power spectral density.
Therefore, the total transmission time for the device to upload the local parameters to the model aggregation server is
t λ t r a = | μ m , n * | v λ n + | μ m , n * | v λ m ,   n N λ , m M λ
where μ m , n * represents the size of the local model parameter to be uploaded by the terminal device λ. The calculation delay of the terminal equipment can be expressed as
t λ c o m = | U m , n | F λ f m , n ,   n N λ , m M λ
where | U m , n | F λ represents the number of CPU cycles required to complete the federated learning task λ on the terminal n, and f m , n represents the CPU frequency when the terminal device executes the federated learning task. The total delay of each round of federated learning is determined by the terminal device with the largest delay. Therefore, the total delay is defined as
t d e l a y = min { 1 Λ λ ϵ Λ S λ }
For a federated learning task λ   ϵ   Λ , the node selection problem can be summarized as selecting the node set N λ   ϵ   N for each iteration, so that the accuracy of this training is the best, which means the total loss function is the smallest, and the constraints are the training and transmission delays. They must be controlled within a certain range. It can be seen that the above problem is a typical NP problem.
In a changeable edge network, the node selection strategy needs to be changed as the environmental status information changes. The DRL-based node selection framework [33,34,35,36,37,38] can continuously interact with the environment and learn node selection strategies to obtain the greatest return. The DRL-based node selection framework proposed in this paper is shown in Figure 2. It consists of three parts: environment, agency, and reward. The environment mainly includes network status, terminal equipment, and target model information. The agent interacts with the environment, starts from a state, chooses actions according to its strategy distribution, and obtains rewards. Agents obtain batch samples of actions, rewards, and environmental status to update the actor-critic (AC, actor-critic) network.
There are often a large number of terminal devices participating in FL training in edge networks. When dealing with node selection problems, the learning rate of the traditional AC algorithm is difficult to determine, this problem easily leads to slow or premature convergence [39,40,41,42,43,44]. The convergence performance is not ideal. Therefore, this paper designs a DPPO-based node selection algorithm based on the idea of multithreading and PPO algorithm design. As shown in Figure 3, PPO, as a reinforcement learning algorithm based on the AC framework, limits the policy update range by means of regular terms, which solves the problem that the traditional policy gradient update step size is difficult to determine [45,46,47,48,49,50]. To further improve the convergence speed, the DPPO-based node selection algorithm uses multiple threads to collect data in the environment, and multiple threads share a global PPO network.
In this paper, the federated learning node selection problem is expressed as an MDP model, and then a DPPO-based node selection algorithm is designed to solve the problem. The specific design is described in detail below.
State space. The environmental state E λ t at time t can be represented by a four-tuple E λ t = { I λ , R λ t , U λ t 1 , z λ t 1 } , where I λ represents the federated learning task λ information, R λ t represents the resources that the terminal device can use for the federated learning task λ at time t, U λ t 1 represents the data set of the terminal device at the previous time, and z λ t 1 represents the previous Node selection scheme at the moment.
Action space. In the action selection of each step, the agent is only allowed to adapt one node selection scheme, and the node selection scheme of the federated learning task λ at time t is modeled as a 0–1 binary vector γ λ t = { b λ , 1 , b λ , 2 , b λ , 3 , , b λ , n } , b λ , n   ϵ   { 0 , 1 } , where b λ , n = 1 means that the device numbered n is selected in this node selection, and 0 means it is not selected. Therefore, the weight aggregation after node selection is expressed as
μ a * = μ a λ + m M λ n N | U m , n | ( μ m , n * μ m , n ) | U λ | b λ , n
Reward function. When the agent executes a certain action according to a certain node selection strategy, the environmental information will change accordingly and obtain a reward value for evaluating this behavior. This paper considers the design of the reward function based on the test accuracy of federated learning and sets the maximum delay as the constraint of each action selection. The reward function can be expressed as
υ λ t = 1 n ϵ N b λ , n D λ ( x t e s t , y t e s t ; μ a λ )
The source of the executive action above is a strategy θ, which is a mapping from the state space to the action space, it can be expressed as
F λ t = θ ( E λ t )
The goal of the MDP model is to obtain an optimization strategy, i.e., after taking corresponding actions according to the strategy in the corresponding state, the goal of reinforcement learning-the expectation of cumulative return will be the largest, i.e., solving
θ * = a r g m a x θ T [ t = 0 ϕ t υ λ t ]
where ϕ t is the discount factor, and its value decreases with the increase of time.
The following describes the node selection algorithm based on DPPO-based federal learning. There are two Actor networks (Actor1 and Actor2) and a Critic network in the global PPO network. Actor1 represents the current latest strategy θ and is responsible for guiding each thread to interact. The Critic network evaluates the current strategy according to the rewards obtained after the agent performs the node selection action, and realizes the update of Critic network’s parameters through the back propagation. Actor2 represents the old strategy θ o l d . After the circle step is trained, Actor2 is updated with the parameters of Actor1, and the above process is repeated until it finally converges.
Compared with the traditional policy gradient algorithm, PPO first improves the algorithm gradient, and the equation for updating the original parameters of the policy gradient is
π n e w = π o l d + ρ π Y
Among them, π n e w   and   π o l d respectively represent the policy parameters after and before the update, ρ represents the learning rate, and π Y represents the objective function gradient. PPO decomposes the reward function of the new strategy into the reward function corresponding to the old strategy plus other items. To achieve the monotonic return function, it is necessary to ensure that the other items in the new strategy are greater than or equal to 0, which can be expressed as
Y ( θ ˜ ) = Y ( θ ) + T E 0 , z 0 , , θ ˜ [ t = 0 ϕ t A d v θ ( E λ t , z λ t ) ]
where Y represents the reward function of the current strategy, θ represents the old strategy, θ ˜ represents the new strategy, and A d v θ ( E λ t , z λ t 1 ) represents the advantage function. Based on the above analysis, it can be obtained that the optimization goal of PPO is to update the parameter π to satisfy
m a x π T [ θ π ( z | E ) θ π o l d ( z | E ) A d v π o l d ( E λ t , z λ t ) ]
Among them, θ π ( z | E ) is the probability of taking action z in state E based on the strategy θ, and D K L m a x ( π o l d , π ) ς , The left part of the above formula represents the maximum value of relative entropy between the parameters of the old strategy and the new strategy, relative entropy is used to measure the similarity between the probability distributions of the two parameters π o l d and π, and then to control the update range of the strategy.
D K L P E N ( π ) = T t [ θ π ( z | E ) θ π o l d ( z | E ) A d v π o l d ( E λ t , z λ t ) λ l a g K L [ θ π o l d , θ π ˜ ] ]
After considering the constraints, the initial strategy based on the Lagrangian multiplier method in PPO is as the above formula. To solve the problem that the hyperparameter λ l a g is difficult to determine, this paper considers using the ratio of the new strategy at time t to the old strategy to measure the strategy’s update range, expressed as
e x t e n t t ( π ) = θ π ( z 1 | E 1 ) θ π o l d ( z 1 | E 1 )
When the strategy has not changed, e x t e n t t ( π ) = 1 . Use the cutting function cut to limit the update range between the new and old strategies. The improved strategy update method is
D C U T ( π ) = T t [ min ( e x t e n t t ( π ) A d v t , c u t ( e x t e n t t ( π ) ) , 1 ξ , 1 + ξ ) A d v t ]
Among them, ξ   ϵ   [ 0 , 1 ] is a hyperparameter, and the clipping function constrains the value of e x t e n t t ( π ) within the interval [ 1 ξ , 1 + ξ ] . Based on the above analysis of PPO, combined with the idea of multi-threading, we proposed the FABD (FL node selection algorithm based on DPPO in IoT) algorithm based on federated learning, which is mainly divided into two processes: multi-thread interaction and global network update.
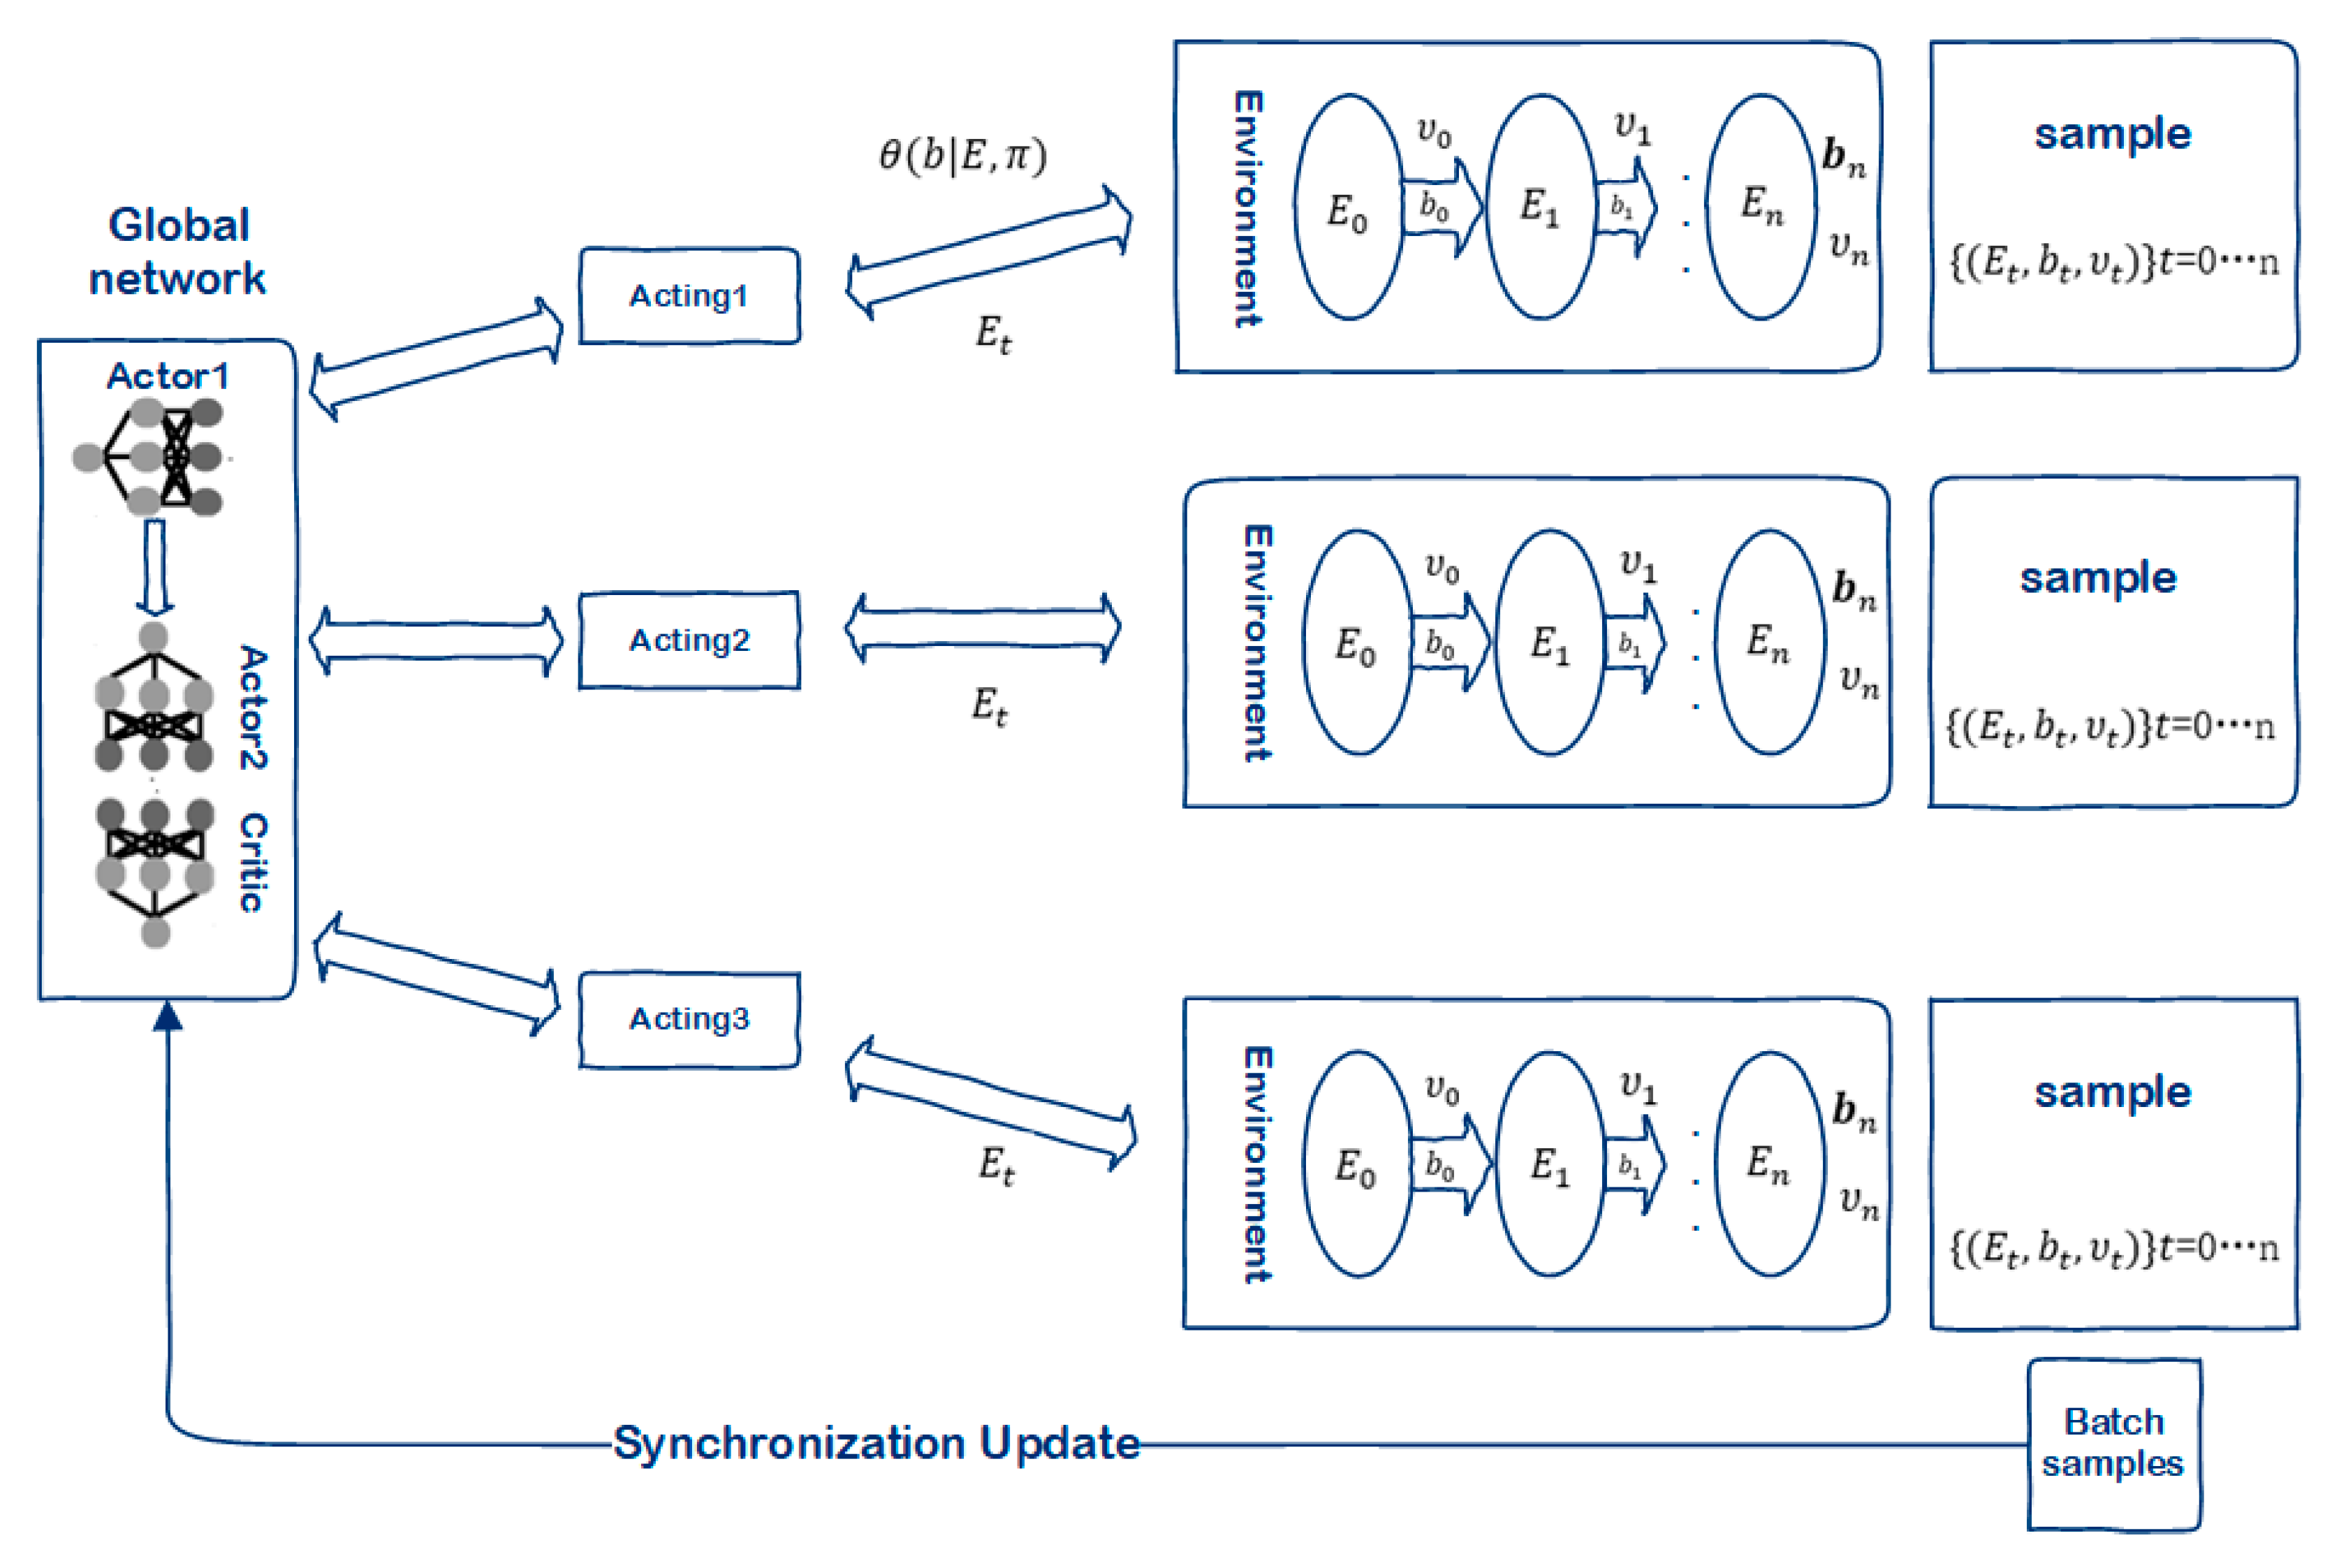
  • Multithreaded Interaction.
Step 1 Input the initial state into the Actor1 network, and each thread selects an action to interact with the environment based on the strategy θ o l d , which is z λ t = θ ( E λ t ) .
Step 2 Each thread interacts with the environment several times in succession, collects samples containing actions, states, and rewards, and transmits batches of samples to the PPO network simultaneously.
  • Global Network Update.
Step 1. The global network uses the above formula to calculate the advantage function of each time step, namely
A d v t = y > t ϕ y t υ λ t Q σ ( E λ t )
Among them, Q is the state value function, and σ is the Critic network parameter.
Step 2. Use D ( I ) = t = 1 t n ( y > t ϕ y t υ λ t Q σ ( E λ t ) ) 2 to calculate the loss function of the Critic network, and back-propagate to update the parameter σ of the Critic network.
Step 3. Use D C U T ( π ) and the advantage function to update the parameters of the Actor1 network.
Step 4. After the circle step, use the network parameters in Actor1 to update the parameters of Actor2.
Step 5. Repeat steps 1–4 until the model converges.
After the global network model converges, it can guide the agent to obtain corresponding actions in different environmental states, and then select a reasonable set of nodes to participate in the federated learning aggregation. The detailed FABD Algorithm 1 is as follows:
Algorithm 1. FABD, FL node selection algorithm based on DPPO in IOT algorithm
Input: The initial state of the network, federated learning task information
Output: Node selection scheme
1. Initialize network, equipment, and task information, randomly initialize system status and global network parameters
2. FOR move ϵ {1,2,…, MO}
3. FOR sub_move ϵ {1,2,…, MO s }
4. Each agent executes the node selection action z λ , t according to the global PPO strategy z λ , t = θ ( E t )
5. Each agent obtains the reward υ t and the next state E t + 1 according to Equation (16) and saves the current state, state, action, and reward as a sample
6. Update current network and device status information
7. END FOR
8. Each agent will synchronously upload the collected data to the global network
9. Update Actor1 network parameter π according to Formula (25) advantage function and Formula (24)
10. Update the parameter σ of the Critic network according to D ( I ) backpropagation
11. IF sub_move%circle==0
12. Use the function in Actor1 to update Actor2
13. END IF
14. END FOR

4. Results

4.1. Experimental Setup

After the design of the FABD algorithm is completed, the research needed to evaluate its performance. In the evaluation, the research used a simulation tool called ONE [51], which can quantitatively evaluate indicators such as the transmission ratio and average cost of data transmission in the opportunistic social network. In the evaluation process, the FABD algorithm and DMPPD (data delivery based on multi perceived domain) algorithm [2], SECM (status estimation and cache management) algorithm [36], ICMT (information cache management and data transmission) algorithm [37], Spray and Wait [45] algorithms are compared, the principles of these comparison algorithms are introduced below:
  • DDMPD: This algorithm is a transmission scheme based on multi-sensing domains. The available node accepts and stores some data of the source node S to itself, and then converts it into a relay node. This new relay node can transmit information widely to other nodes. When the source node moves, it can search for available nodes nearby and convert them into relay nodes according to the above method, which can effectively save overhead and ensure the security of information.
  • SECM: This is an algorithm that improves the environment based on user nodes and neighbors in an opportunistic network. Such a network can identify neighbors around it, and then evaluate the probability of the nodes, so as to evaluate the neighbors to ensure that the node has a high probability of obtaining information first, this can realize cache adjustment, so that the node cache can be reasonably distributed. At the same time, the cooperation of neighboring nodes and the sharing of the node’s cache task can effectively distribute data, improve the cache use rate of the node, reduce the delay of data transmission, and improve the overall efficiency.
  • ICMT: This algorithm is a method of node identification used to evaluate the probability. It adjusts the priority of the nodes that meet the high probability and rebuilds the cache space. To prevent accidental deletion of cached verses, the node’s cache task is collaboratively shared by neighboring nodes, to achieve the purpose of buffer adjustment, to ensure the effective transmission of data.
  • Spray and Wait: The algorithm is an improved algorithm based on the flooding strategy. It is divided into Spray and Wait stages. Some data packets in the source node are spread first. In the second stage, if the target node is not found during the spray process, the node containing the data packet will use the Direct Delivery method to deliver the data packet to the target node. This algorithm is a kind of traditional algorithm, but the transmission delay is small, and it can maintain better algorithm performance.
In the opportunistic network, this research generally used the following parameters to measure the data transmission effect of the opportunistic social network:
(1)
Transmission ratio: Probability of relay node being selected (during transmission).
(2)
Overhead on average refers to the average cost of two nodes in the community during the information transmission process.
(3)
Energy consumption: The node’s energy consumption during transmission.
(4)
End-to-end delay: The average delay of information transmission between two nodes in the community.
In the parameter setting stage of the experiment, according to the relevant situation of the Reality Mining Dataset [52], we input the relevant terrain and building distribution of the collection area of the dataset into the ONE system, and input the values of some parameters (such as the energy required to send a single data packet) into the ONE system with appropriate idealization [46,47,48,49,50]. The experimental parameter settings were automatically generated by the platform, as shown in Table 2.
Dataset: For the experimental data, we used the Reality Mining Dataset, which was constructed by studying the social data of 100 students from MIT’s Media Lab and Sloan School of Business. These studies consist of one hundred Nokia 6600 smart phones pre-installed with several pieces of developed software developed, as well as a version of the Context application from the University of Helsinki (Raento et al. (2005)). The information collected includes call logs, Bluetooth devices in proximity, cell tower IDs, application usage, and phone status (such as charging and idle), which comes primarily from the Context application. The study generated data collected by one hundred human subjects over the course of nine months and represent approximately 500,000 h of data on users’ location, communication, and device usage behavior.

4.2. Experimental Results

After the simulation parameters are determined, the simulation analysis is performed, and the analysis is completed to generate an analysis report. The degree of correlation between time and the four parameters is shown in Figure 4, Figure 5, Figure 6 and Figure 7.
The delivery ratio and simulation time’s relationship in this simulation is shown in Figure 4. The transmission rate of the traditional Spray and wait algorithm is the lowest, fluctuating between 0.32 and 0.365, because the traditional Spray and Wait algorithm is used in the transmission process in the flooding strategy. In addition, the copy ratio in its simulation is 30. Because a lot of duplicate information is copied, there will be a lot of information loss and redundancy in such a community, so the delivery is relatively low. For the SECM algorithm, it is also an algorithm based on the flooding strategy, so there is also the problem of high information loss rate, and the delivery ratio will not be very high, floating in the range of 0.36 to 0.39. The ICMT algorithm evaluates the probability of nodes, rebuilds the buffer space, controls the transmission rate of forwarded information, and makes the data transmission more stable. Therefore, the delivery is also improved compared to the previous two algorithms; it fluctuates between 0.498 and 0.568. Compared with the traditional algorithm Spray and Wait, the delivery rate has increased by about 55%. DDMPD uses a combination of multi-sensing communities and mobile nodes to increase the transmission rate in opportunistic social networks and reduce data loss, so the transmission is relatively high, fluctuating in the range of 0.55 to 0.63. The FABD algorithm is based on federated learning, because of the precise selection of nodes based on DPPO during the transmission process and the loss of the transmission process is relatively small; the delivery ratio is also better. The lowest value is 0.59, which exceeds 50%, and the highest is 0.692, The best performance among all comparison algorithms.
Figure 5 shows the relationship between routing overhead and time. From the results of the simulation experiment, it can be seen that the routing overhead of the Spray and Wait algorithm is the largest among all algorithms, floating in the range of 151–297 Mb. Although the traditional algorithm is easy to understand and implement, its usability is very poor, so the routing overhead is correspondingly high. The routing cost of the SECM algorithm is between 140 and 221. Its cost is relatively stable most of the time, but there will be a certain flooding situation around 2 h. The usability is better than the traditional algorithm, but it still cannot meet the requirements. The principle of the ICMT algorithm is to select nodes based on probability evaluation, while controlling the frequency of sending information. Its maximum routing overhead appears within 2 h. It has a better control effect on overhead, and the average overhead is lower than the above two algorithms. When the DDMPD algorithm is applied to an opportunistic social network, as time increases, the number of nodes and communities participating in the propagation will increase accordingly, so the routing overhead remains relatively stable, between 105 and 116. The routing overhead of the FABD algorithm is stable and low, keeping it between 88 and 106. Because when the data transmission in the opportunistic social network adopts the FABD algorithm, the appropriate node selection will be made according to the current situation until the selected node is optimal. This will minimize the useless overhead of routing, so the algorithm performs best in controlling routing overhead.
Figure 6 shows the relationship between energy consumption and time. As time increases, the increase in energy consumption of each algorithm and the trend of change are somewhat different. The energy consumption of the Spray and wait algorithm has always been the highest among all the algorithms. Because the algorithm is based on a flooding strategy, every node in the network needs to transmit information through Spray. The energy consumption surges within 1.5 to 3 h of the simulation. The total energy consumption for 6 h exceeds 500. Both SECM and ICMT algorithms are routing algorithms for node identification through probability evaluation, so their energy consumption gap is not large, because of their selectivity, the energy consumption is greatly reduced compared to the Spray and Wait algorithm. However, as the simulation time increases, the usability of the algorithm decreases. After 3 h, the energy consumption increases significantly. The energy consumption of the DDMPD and FABD algorithms is much lower than the energy consumption of the above-mentioned algorithms, and the energy consumption gap between FABD and other algorithms in the early stage of the simulation is not very large, but after 3.5 h, the energy consumption of the FABD algorithm is still relatively stable; however, the energy consumption of other algorithms will increase sharply to varying degrees.
Figure 7 shows the average end-to-end delay and time of the above-mentioned algorithms in opportunistic social networks’ relation. It can be seen that the average delay of the SECM is the highest because this algorithm uses a large amount of copy information in the data transmission in the community, which increases the delay. Its time delay fluctuates in the range of 232–272. The ICMT algorithm controls the time interval of information transmission, but it still consumes more time in the process of evaluating the probability, so its time delay is relatively high, concentrated in the interval of 200–220. The DDMPD algorithm will have a large amount of information transfer process in the process of sending a message, which occupies a part of network resources, so its delay is relatively high. The FABD algorithm needs to select nodes in the process of data transmission. In node selection, there will be a certain amount of time consumption during the local calculation and uploading to the base station for calculation, so the delay will increase accordingly. The delay of the FABD algorithm is slightly lower than that of the DDMPD algorithm for most of the time, fluctuating in the range of 180 to 196. Because the process of the traditional spray and wait algorithm is relatively simple and does not have many additional calculation processes, the information diffusion capability is also relatively strong, and the delay is relatively low, which fluctuates in the range of 180 to 196.
From the above simulation, we can conclude that the FABD algorithm has a faster transmission rate, lower routing overhead, and lower energy consumption compared with other existing algorithms, but compared to traditional algorithms, its delay is slightly increased, but it is still lower than other algorithms. All in all, the FABD algorithm has an excellent performance in experimental simulations and is better than other algorithms in most of the performance indicators.
In opportunistic social networks, another important factor is node caching, which has a direct impact on the transmission efficiency of the algorithm, so it is important to combine the impact of node caching to conduct a new round of evaluation of the four algorithms. Here to test its performance.
Figure 8 reflects the relation between delivery ratio and cache. It can be seen that the delivery ratio of the FABD is better than other algorithms. Because the FABD algorithm uses federal learning for node selection when the node increases the cache, the higher the cache, the better the delivery rate. Traditional algorithms such as Spray and Wait use flooding to transmit information on community nodes, so the information loss rate is also very high, and the transmission rate is also very low, floating in the range of 0.33–0.52. The delivery rates of ICMT and DDMPD algorithms are relatively close, the former is in the range of 0.58–0.78, and the latter is in the range of 0.63–0.78. The delivery rate of the SEMC algorithm is lower than the above two algorithms, but due to its mechanism of identifying neighbors around, the transmission ratio is still slightly better than the traditional algorithm.
Figure 9 shows the relation between routing overhead and cache. With the increase of cache, the routing overhead of the five algorithms is significantly reduced. In the case of a low cache, the Spray and Wait algorithm has a slightly larger overhead than the SECM algorithm. However, as the cache increases, its cost becomes smaller than the SECM algorithm, but the routing cost of these two algorithms is still higher than other algorithms. The ICMT algorithm based on the probability evaluation mechanism makes its cost lower than the traditional algorithm, but it is still slightly higher than the DMPPD and FABD algorithms. The overhead of the DDMPD algorithm and the FABD algorithm is the same as the cache changes, and overhead of the FABD is less than which in the DDMPD. The routing cost of the FABD algorithm is in the range of 15 to 201. Therefore, increasing the cache of nodes can increase the routing overhead in the community, and FABD is also superior to several other algorithms in terms of routing overhead control.
Figure 10 reflects the relation between energy consumption and cache. From the figure, it can be seen that the energy consumption of the traditional algorithm Spray and Wait increases with the increase of the cache, and in the case of a high cache, its energy consumption is very high. This is because each node of the algorithm transmits information to each neighbor in the community, so as the cache of the node increases, the energy consumption of the node increases sharply. The energy consumption of the ICMT algorithm and the SECM algorithm are basically the same, floating in the range of 52 to 175. Like the SECM algorithm, it uses the occasional transmission method to copy information through a single copy, so the energy optimization effect is better than the traditional algorithm. The energy consumption control of the DDMPD algorithm is better than the above algorithms. The main reason is that the DDMPD algorithm uses the information transmission method provided by the community, which significantly reduces energy consumption. With the increase of the cache, the energy consumption of the FABD algorithm has been stable at about 45, which shows that the node selection method of federated learning has great advantages in energy consumption control.
Figure 11 shows the relations between the end-to-end delay and the cache. From the simulation results, it can be seen that as the cache increases, the end-to-end delay of all algorithms decreases. The delay of the Spray and Wait algorithm is the highest, but in the case of high cache, the delay is not much different from the SECM algorithm, and finally stabilized at about 85 s. The delay of the ICMT is reduced from 178 to 51, which of the DDMPD and the FABD are reduced from 96 and 81 to 43 and 31, respectively. The experimental results show that as the cache increases, the end-to-end delay in the opportunistic social network will decrease. At the same time, among several comparison algorithms, the delay of FABD is also the smallest.
In the actual environment, the information transmission method is not single, and different information transmission methods may also have a certain impact on the information transmission performance of the algorithm. Below this research choose three mobile models to test the performance of the FABD algorithm. These three models are Shortest Path Map-Based Movement), RWP (random way point), and RM (random walk) models.
The delivery ratio of the FABD in different mobile models is shown in Figure 12. In the SPMBM mobile model, the receiving rate of the opportunistic network is the highest, followed by RWP, and RM is the lowest. In about 3 h, the transmission rate of the SPMBM mobile model reached the maximum value, about 0.67, the transmission ratio of the RWP model reached the maximum value at 4 h, about 0.625, and the transmission rate of the RM model reached the maximum value at 3 h. The value is 0.587 and then floats around 0.53. After simulation, this research found that the best delivery rate is the FABD algorithm under the SPMBM mobile model.
Figure 13 shows the average overhead of the FABD algorithm under the three mobility models. From the simulation results, it can be seen that the routing cost of the FABD algorithm is less affected by the mobility model. The routing cost of the three models is in the range of 110 to 118, this is because in the process of node selection, due to the continuous progress of calculations, the community has formed a large number of tasks for nodes to share information in the process of information transmission.
Figure 14 shows the energy consumption of FABD under different mobile models. Because the FABD algorithm has a firm transmission function, when the model changes, the method will not change greatly. This view has been verified to be correct in the simulation. The simulation results of the three models have little difference in energy consumption.
Figure 15 shows the average delay of the FABD algorithm under the three mobile models. The simulation results show that the delay difference between the three community models is not obvious. The average delay under the SPMBM mobile model will be slightly lower, and the average delay of RWP will be slightly higher. The delays of the three models are all within the range of 180–215.

5. Conclusions

In summary, when studying the data transmission problem in the opportunistic social network, this paper communicates the social network of opportunities, and proposes an effective node selection scheme based on federated learning, which greatly improves the transmission efficiency and improves the reliability of data transmission. On the Reality Mining dataset, this paper compares the FABD algorithm with four existing algorithms, and the results show that FADB has the highest delivery rate, the lowest energy consumption, and the lowest average overhead, although the end-to-end delay of FADB is not the lowest, it can be concluded that its comprehensive performance is excellent.
In the 5G era, IoT technology is developing rapidly, and good data transmission capabilities have become an important factor in improving user experience and network stability. In the future, the FABD algorithm proposed in this paper will have broad application prospects in improving data transmission efficiency and reducing node energy consumption. In future work, as the number of terminals in the opportunistic social network increases and computing power increases, our FABD algorithm will have greater practical advantages. We will also collect real data sets in social scenarios, optimize and improve them, and continue to improve the performance of the algorithm.

Author Contributions

Writing—original draft, Y.S.; Writing—review & editing, F.G. and J.W. All authors designed this works. All authors have read and agreed to the published version of the manuscript.

Funding

This work was supported in The Hunan Provincial Natural Science Foundation of China (2018JJ3299, 2018JJ3682).

Institutional Review Board Statement

Not applicable.

Informed Consent Statement

Not applicable.

Data Availability Statement

Not applicable.

Conflicts of Interest

The authors declare no conflict of interest.

Appendix A

According to the definition of the weighted network above, the current degree of community structure is defined as:
Ψ ( t ) = κ a Κ φ s ( 2 Κ ) 2
Theorem A1
. In an opportunistic social network, increasing the weight can increase the degree of association with the community.
Proof of Theorem A1.
At time t, the degree of modularity of the community is  Ψ ( t ) , and the degree of modularity after some time can be expressed as
Ψ ( t + 1 ) = κ a + Δ κ   Κ + Δ κ ( φ s + 2 Δ κ ) 2 4 ( Κ + Δ κ )
Use (30) − (1) to get
Ψ ( t + 1 ) Ψ ( t ) = κ a + Δ κ   Κ + Δ κ ( φ s + 2 Δ κ ) 2 4 ( Κ + Δ κ ) ( κ a Κ φ s ( 2 Κ ) 2 ) = 4 Κ 3 Δ κ 0 4 Κ 2 φ s Δ κ 4 Κ 2 κ a Δ κ + 2 Κ 2 φ s Δ κ 4 Κ 2 ( Κ + Δ κ ) 2 4 Κ φ s Δ κ 2 ( φ s Δ κ ) 2 2 Κ 2 ( Κ + Δ κ ) 2 4 Κ 3 Δ κ 6 Κ 2 φ s Δ κ + 2 Κ 2 φ s Δ κ 2 Κ 2 φ s Δ κ + ( φ s Δ κ ) 2 4 Κ 2 ( Κ + Δ κ ) 2 = Δ κ 4 Κ 3 6 Κ 2 φ s + 2 Κ 2 φ s 2 Κ 2 φ s + φ s 2 Δ κ 4 Κ 2 ( Κ + Δ κ ) 2
= Δ κ ( 2 Κ 2 2 Κ φ s φ s Δ κ ) × ( 2 Κ φ s ) 4 Κ 2 ( Κ + Δ κ ) 2
Because we assume Δ κ > 0, in order to prove that (A2)-(A1) is greater than zero, we only need to prove
( 2 Κ 2 2 Κ φ s φ s Δ κ ) × ( 2 Κ φ s ) > 0
In other words
  { 2 Κ 2 2 Κ φ s φ s Δ κ > 0 2 Κ φ s > 0 { 2 Κ 2 2 Κ φ s φ s Δ κ > 0 2 Κ φ s > 0 Δ κ > 0     { 0 < Δ κ < 2 Κ ( Κ φ s 1 ) φ s < 2 Κ { 0 < Δ κ < 2 ( Κ φ s 1 ) 2 ( Κ φ s 1 ) > 0 φ s < 2 Κ     { 0 < Δ κ < 2 ( Κ φ s 1 ) φ s < Κ
Because 2 Ψ is the sum of the degrees in the entire network, the sum of the degrees of the communities in the network does not exceed 2 Ψ , so from the above proof, we can know that in the social opportunistic network, increasing the weight can increase the degree of relevance to the community. □
Theorem A2.
If the connection weights of two sub-communities have the following relationship.
φ i φ j + φ i Δ κ 2 ( Κ + Δ κ ) φ i φ j Κ = φ i Δ κ ( Κ φ i ) Κ ( Κ + Δ κ ) < 0
φ i φ j 2 Κ < κ i j < Δ κ + φ i φ j + φ s Δ κ + Δ κ 2 2 ( Κ + Δ κ )  
then these two communities are separate.
Proof of Theorem A2.
Assuming that the original N of the community is divided into  η i   and   η j due to the decrease in weight, then the relationship is as follows:
{ Κ i + Κ j < Κ ε i Κ φ i 2 4 Κ 2 + ε j Κ φ j 2 4 Κ 2 < φ i + φ j + κ i j Κ ( φ i + φ j ) 2 4 Κ 2 κ i j > φ i φ j 2 Κ
In this way, the total weight will decrease, which can be expressed by the formula:
Κ i * + Κ j * > Κ *
κ i j < Δ κ + φ i φ j + φ s Δ φ + Δ φ 2 2 ( Κ + Δ κ )
Therefore, when the sub-communities η i   and   η j of community N have a φ i φ j 2 Κ < κ i j < Δ κ + φ i φ j + φ s Δ κ + Δ κ 2 2 ( Κ + Δ κ ) relationship, the communities have been separated. □
Theorem A3.
When the weight of an edge decreases, two nodes are connected by this edge, and this edge is the only edge of one of the nodes. If the weight of this side changes, then the community is not divided.
Proof of Theorem A3.
For an edge  ( u , v ) , the weight of this is Δ κ . If the community must be separated, the following three conditions should be met:
{ Κ i + Κ j < Κ ε i Κ φ i 2 4 Κ 2 + ε j Κ φ j 2 4 Κ 2 < φ i + φ j + κ i j Κ ( φ i + φ j ) 2 4 Κ 2 κ i j > φ i φ j 2 Κ
After changing the weight, the weight of the community becomes
{ Κ i * + Κ j * > Κ * κ i j < Δ κ + φ i φ j + φ s Δ φ + Δ φ 2 2 ( Κ + Δ κ )
This formula can also be seen as
φ i φ j 2 Κ < κ i j < φ i ( φ j + Δ κ ) 2 ( Κ + Δ κ ) = φ i φ j + φ i Δ κ 2 ( Κ + Δ κ )
Because
φ i φ j + φ i Δ κ 2 ( Κ + Δ κ ) φ i φ j Κ = φ i Δ κ ( Κ φ i ) Κ ( Κ + Δ κ ) < 0
So we can get:
φ i φ j + φ i Δ κ 2 ( Κ + Δ κ ) < φ i φ j Κ
In other words, φ i φ j 2 Κ < κ i j < Δ κ + φ i φ j + φ s Δ κ + Δ κ 2 2 ( Κ + Δ κ ) does not hold, so the community is not separated. From this proof, we can know that the weight of an edge is reduced, two nodes are connected by this edge, and this is the only edge of one of the nodes, then the community is not divided. □

References

  1. Deng, Y.; Gou, F.; Wu, J. Hybrid data transmission scheme based on source node centrality and community reconstruction in opportunistic social networks. Peer-to-Peer Netw. Appl. 2021, 14, 3460–3472. [Google Scholar] [CrossRef]
  2. Luo, J.; Wu, J.; Yang, W. A relationship matrix resolving model for identifying vital nodes based on community in opportunistic social networks. Trans. Emerg. Telecommun. Technol. 2021, 33, e4389. [Google Scholar] [CrossRef]
  3. Yang, W.; Wu, J.; Luo, J. Effective Data Transmission and Control Based on Social Communication in Social Opportunistic Complex Networks. Complexity 2020, 2020, 3721579. [Google Scholar] [CrossRef]
  4. Wu, J.; Gou, F.; Xiong, W.; Zhou, X. A Reputation Value-Based Task-Sharing Strategy in Opportunistic Complex Social Networks. Complexity 2021, 2021, 8554351. [Google Scholar] [CrossRef]
  5. Yin, S.; Xiao, Y.; Yu, G. Effective Data Selection and Management Method Based on Dynamic Regulation in Opportunistic Social Networks. Electronics 2020, 9, 1271. [Google Scholar] [CrossRef]
  6. Xiao, Y.; Wu, J. Data Transmission and Management Based on Node Communication in Opportunistic Social Networks. Symmetry 2020, 12, 1288. [Google Scholar] [CrossRef]
  7. Chen, Z.; Zhao, M. An efficient data packet iteration and transmission algorithm in opportunistic social networks. J. Ambient Intell. Humaniz. Comput. 2020, 11, 3141–3153. [Google Scholar] [CrossRef]
  8. Wu, J.; Gou, F.; Tan, Y. A staging auxiliary diagnosis model for non-small cell lung cancer based the on intelligent medical system. Comput. Math. Methods Med. 2021, 2021, 6654946. [Google Scholar] [CrossRef]
  9. Wu, J.; Gou, F.; Tian, X. Disease Control and Prevention in Rare Plants Based on the Dominant Population Selection Method in Opportunistic Social Networks. Comput. Intell. Neurosci. 2022, 2022, 1489988. [Google Scholar] [CrossRef]
  10. Spyropoulos, T.; Psounis, K.; Raghavendra, C.S. Spray and wait: An efficient routing scheme for intermittently connected mobile networks. In Proceedings of the 2005 ACM SIGCOMM Workshop on Delay-Tolerant Networking, ACM, New York, NY, USA, 26 August 2005; pp. 252–259. [Google Scholar] [CrossRef]
  11. Rahman, S.A.; Tout, H.; Ould-Slimane, H.; Mourad, A.; Talhi, C.; Guizani, M. A Survey on Federated Learning: The Journey from Centralized to Distributed On-Site Learning and Beyond. IEEE Internet Things J. 2020, 8, 5476–5497. [Google Scholar] [CrossRef]
  12. Wang, H.; Kaplan, Z.; Niu, D.; Li, B. Optimizing Federated Learning on Non-IID Data with Reinforcement Learning. In Proceedings of the IEEE INFOCOM 2020-IEEE Conference on Computer Communications, Toronto, ON, Canada, 6–9 July 2020; pp. 1698–1707. [Google Scholar] [CrossRef]
  13. Yovita, L.V.; Restu, J.N. Analisis Performansi Algoritma Routing First Contact dengan Stationary Relay Node pada Delay Tolerant Network. J. Tek. Energi Elektr. Tek. Telekomun. Tek. Elektron. 2018, 4, 123. [Google Scholar] [CrossRef]
  14. Lin, S.; Li, Y.; Chen, P.S. Research on Improved Floyd Routing Algorithm in Opportunistic Networks. Appl. Mech. Mater. 2014, 519–520, 227–230. [Google Scholar] [CrossRef]
  15. Aung, C.Y.; Ho, I.W.-H.; Chong, P.H.J. Store-Carry-Cooperative Forward Routing with Information Epidemics Control for Data Delivery in Opportunistic Networks. IEEE Access 2017, 5, 6608–6625. [Google Scholar] [CrossRef]
  16. Khouzani, M.; Eshghi, S.; Sarkar, S.; Shroff, N.B.; Venkatesh, S.S. Optimal energy-aware epidemic routing in DTNs. EEE Trans. Autom. Control. 2012, 60, 175–182. [Google Scholar] [CrossRef] [Green Version]
  17. Lenando, H.; Alrfaay, M. EpSoc: Social-Based Epidemic-Based Routing Protocol in Opportunistic Mobile Social Net-work. Mob. Inf. Syst. 2018, 2018, 6462826. [Google Scholar] [CrossRef] [Green Version]
  18. De Rango, F.; Amelio, S.; Fazio, P. Enhancements of Epidemic Routing in Delay Tolerant Networks from an energy perspective. In Proceedings of the 9th International Wireless Communications and Mobile Computing Conference, Sardinia, Italy, 1–5 July 2013; pp. 731–735. [Google Scholar] [CrossRef]
  19. Karimi, S.; Darmani, Y. p-Epidemic forwarding method for heterogeneous delay-tolerant networks. J. Supercomput. 2019, 75, 7244–7264. [Google Scholar] [CrossRef]
  20. McGeehan, D.; Madria, S.; Lin, D. Effective social-context based message delivery using ChitChat in sparse delay tolerant networks. Distrib. Parallel Databases 2019, 38, 401–438. [Google Scholar] [CrossRef]
  21. Sharma, D.K.; Kukreja, D.; Chugh, S.; Kumaram, S. Supernode routing: A grid-based message passing scheme for sparse opportunistic networks. J. Ambient Intell. Humaniz. Comput. 2018, 10, 1307–1324. [Google Scholar] [CrossRef]
  22. Prabhavat, S.; Narongkhachavana, W.; Thongthavorn, T.; Phankaew, C. Low Overhead Localized Routing in Mobile Ad Hoc Networks. Wirel. Commun. Mob. Comput. 2019, 2019, 9652481. [Google Scholar] [CrossRef]
  23. Derakhshanfard, N.; Sabaei, M.; Rahmani, A.M. Sharing spray and wait routing algorithm in opportunistic net-works. Wirel. Netw. 2016, 22, 2403–2414. [Google Scholar] [CrossRef]
  24. Cui, J.; Cao, S.; Chang, Y.; Wu, L.; Liu, D.; Yang, Y. An Adaptive Spray and Wait Routing Algorithm Based on Quality of Node in Delay Tolerant Network. IEEE Access 2020, 7, 35274–35286. [Google Scholar] [CrossRef]
  25. Wu, L.; Cao, S.; Chen, Y.; Cui, J.; Chang, Y. An adaptive multiple spray-and-wait routing algorithm based on social circles in delay tolerant net-works. Comput. Netw. 1999, 189, 107901. [Google Scholar] [CrossRef]
  26. Zhang, X.; Zhou, Z.; Cheng, D. Efficient path routing strategy for flows with multiple priorities on scale-free networks. PLoS ONE 2017, 12, e0172035. [Google Scholar] [CrossRef] [Green Version]
  27. Cabaniss, R.; Vulli, S.S.; Madria, S. Social group detection based routing in Delay Tolerant Networks. Wirel. Netw. 2013, 19, 1979–1993. [Google Scholar] [CrossRef]
  28. Wu, J.; Xia, J.; Gou, F. Information transmission mode and IoT community reconstruction based on user influence in opportunistic s ocial networks. Peer-to-Peer Netw. Appl. 2022, 15, 1398–1416. [Google Scholar] [CrossRef]
  29. Li, L.; Gou, F.; Wu, J. Modified Data Delivery Strategy Based on Stochastic Block Model and Community Detection with IoT in Opportunistic Social Network. Wirel. Commun. Mob. Comput. 2022, 2022, 5067849. [Google Scholar] [CrossRef]
  30. Yang, W.; Luo, J.; Wu, J. Application of Information Transmission Control Strategy Based on Incremental Community Division in IoT Platform. IEEE Sens. J. 2021, 21, 21968–21978. [Google Scholar] [CrossRef]
  31. Gou, F.; Wu, J. Triad link prediction method based on the evolutionary analysis with IoT in opportunistic social networks. Comput. Commun. 2021, 181, 143–155. [Google Scholar] [CrossRef]
  32. Gou, F.; Wu, J. Message Transmission Strategy Based on Recurrent Neural Network and Attention Mechanism in Iot System. J. Circuits Syst. Comput. 2022, 31, 2250126. [Google Scholar] [CrossRef]
  33. Yang, Z.; Merrick, K.; Jin, L.; Abbass, H.A. Hierarchical Deep Reinforcement Learning for Continuous Action Control. IEEE Trans. Neural Netw. Learn. Syst. 2018, 29, 5174–5184. [Google Scholar] [CrossRef]
  34. Liang, X.; Du, X.; Wang, G.; Han, Z. A Deep Reinforcement Learning Network for Traffic Light Cycle Control. IEEE Trans. Veh. Technol. 2019, 68, 1243–1253. [Google Scholar] [CrossRef] [Green Version]
  35. Liu, C.F.; Bennis, M.; Debbah, M.; Poor, H.V. Dynamic task offloading and resource allocation for ultra-reliable low-latency edge computing. IEEE Trans. Commun. 2019, 67, 4132–4150. [Google Scholar] [CrossRef] [Green Version]
  36. Wu, J.; Chen, Z.; Zhao, M. SECM: Status estimation and cache management algorithm in opportunistic networks. J. Supercomput. 2018, 75, 2629–2647. [Google Scholar] [CrossRef]
  37. Wu, J.; Chen, Z.; Zhao, M. Information cache management and data transmission algorithm in opportunistic social networks. Wirel. Netw. 2019, 25, 2977–2988. [Google Scholar] [CrossRef]
  38. Sharda, S.; Singh, M.; Sharma, K. Demand side management through load shifting in IoT based HEMS: Overview, challenges and opportunities. Sustain. Cities Soc. 2020, 65, 102517. [Google Scholar] [CrossRef]
  39. Verma, P.; Sharma, K.; Walia, G.S. Depression Detection among Social Media Users Using Machine Learning. In Proceedings of the Inter-national Conference on Innovative Computing and Communications, New Delhi, India, 19–20 February 2021; Gupta, D., Khanna, A., Bhattacharyya, S., Hassanien, A.E., Anand, S., Jaiswal, A., Eds.; Springer: Singapore, 2021; pp. 865–874. [Google Scholar]
  40. Zhao, Z.; Cumino, P.; Esposito, C.; Xiao, M.; Rosário, D.; Braun, T.; Cerqueira, E.; Sargento, S. Smart Unmanned Aerial Vehicles as base stations placement to improve the mobile network operations. Comput. Commun. 2022, 181, 45–57. [Google Scholar] [CrossRef]
  41. Esposito, C.; Choi, C. Signaling game based strategy for secure positioning in wireless sensor networks. Pervasive Mob. Comput. 2017, 40, 611–627. [Google Scholar] [CrossRef]
  42. Xia, W.; Neware, R.; Kumar, S.D.; Karras, D.A.; Rizwan, A. An optimization technique for intrusion detection of industrial control network vulnerabilities based on BP neural network. Int. J. Syst. Assur. Eng. Manag. 2022, 13, 576–582. [Google Scholar] [CrossRef]
  43. Rizwan, A.; Serbaya, S.H.; Saleem, M.; Alsulami, H.; Karras, D.A.; Alamgir, Z. A Preliminary Analysis of the Perception Gap between Employers and Vocational Students for Career Sustainability. Sustainability 2021, 13, 11327. [Google Scholar] [CrossRef]
  44. Chauda, G.; Segalman, D.J. A First Violation Contact Algorithm that Correctly Captures History Dependence. Int. J. Mech. Sci. 2021, 198, 106375. [Google Scholar] [CrossRef]
  45. Shen, Y.; Gou, F.; Dai, Z. Osteosarcoma MRI Image-Assisted Segmentation System Base on Guided Aggregated Bilateral Network. Mathematics 2022, 10, 1090. [Google Scholar] [CrossRef]
  46. Yin, S.; Wu, J.; Yu, G. Low energy consumption routing algorithm based on message importance in opportunistic social networks. Peer-to-Peer Netw. Appl. 2021, 14, 948–961. [Google Scholar] [CrossRef]
  47. Wu, J.; Qu, J.; Yu, G. Behavior prediction based on interest characteristic and user communication in opportunistic social networks. Peer-to-Peer Netw. Appl. 2021, 14, 1006–1018. [Google Scholar] [CrossRef]
  48. Wu, J.; Yang, S.; Gou, F.; Zhou, Z.; Xie, P.; Xu, N.; Dai, Z. Intelligent Segmentation Medical Assistance System for MRI Images of Osteosarcoma in Developing Countries. Comput. Math. Methods Med. 2022, 2022, 6654946. [Google Scholar] [CrossRef]
  49. Wu, J.; Tian, X.; Tan, Y. Hospital evaluation mechanism based on mobile health for IoT system in social networks. Comput. Biol. Med. 2019, 109, 138–147. [Google Scholar] [CrossRef]
  50. Fang, Z.; Chang, L.; Luo, J.; Wu, J. A Data Transmission Algorithm Based on Triangle Link Structure Prediction in Opportunistic Social Networks. Electronics 2021, 10, 1128. [Google Scholar] [CrossRef]
  51. Desta, M.S.; Hyytiä, E.; Keränen, A.; Kärkkäinen, T.; Ott, J. Evaluating (Geo) content sharing with the ONE simulator. In Proceedings of the 11th ACM International Symposium on Mobility Management and Wireless Access MobiWac ’13, Barcelona Spain, 3–8 November 2013. [Google Scholar]
  52. Eagle, N.; Pentland, A. Reality mining: Sensing complex social systems. Pers. Ubiquitous Comput. 2006, 10, 255–268. [Google Scholar] [CrossRef]
Figure 1. Overall model design.
Mathematics 10 01669 g001
Figure 2. DRL-based node selection framework.
Mathematics 10 01669 g002
Figure 3. Restriction strategy update range indication.
Mathematics 10 01669 g003
Figure 4. The relationship between delivery ratio and time.
Mathematics 10 01669 g004
Figure 5. The relationship between average cost and time.
Mathematics 10 01669 g005
Figure 6. The relationship between energy consumption and time.
Mathematics 10 01669 g006
Figure 7. The relationship between end-to-end delay and time.
Mathematics 10 01669 g007
Figure 8. The relationship between delivery ratio and cache.
Mathematics 10 01669 g008
Figure 9. The relationship between routing overhead and cache.
Mathematics 10 01669 g009
Figure 10. The relationship between energy consumption and cache.
Mathematics 10 01669 g010
Figure 11. The relationship between the end-to-end delay and the cache.
Mathematics 10 01669 g011
Figure 12. The receiving rate of the FABD algorithm in different mobile models.
Mathematics 10 01669 g012
Figure 13. The routing cost of the FABD algorithm under the three mobility models.
Mathematics 10 01669 g013
Figure 14. The energy consumption of FABD under different mobile models.
Mathematics 10 01669 g014
Figure 15. The average delay of the FABD algorithm under the three mobile models.
Mathematics 10 01669 g015
Table 1. Symbol explanation.
SymbolDescription
N A collection of nodes representing terminal equipment in an opportunistic network
D The set of edges between nodes
w u , v w represents the weight between u and v
M Collection of servers
Λ Collection of training tasks
U m , n The data set of the terminal covered by the server z
Ψ ( t ) The degree of community modularity at time t
Κ Indicates the total weight of the community node
κ a The total weight of all edges in the community a
φ s Represents the sum of degrees adjacent to node s in the community
U λ Represents the total data set related to the task λ
μ The weight of the current training model represents the size of the training data set
S λ The sum of the loss function of task λ
W n Available bandwidth between device and micro base station
W m Available bandwidth between the device and the macro base station
C n Channel gain between device and micro base station
C m Channel gain between the micro base station and macro base station
e n The transmission power of the device
e m Transmit power of the micro base station
N 0 Noise power spectral density
t λ t r a The total transmission time for the device to upload local parameters to the model aggregation server
t λ c o m Computational delay of terminal equipment
f m , n The CPU frequency when the terminal device executes the federated learning task
T λ Total delay
E λ t The state of the environment at time t in the MDP model
I λ Information about the federated learning task λ
R λ t The terminal equipment can be used for the resources of the federated learning task λ at time t
U λ t 1 The data set of the terminal device at the last moment
z λ t 1 Node selection scheme at the last moment
γ λ t The node selection scheme of the federated learning task λ at time t is modeled as a 0–1 binary vector
υ λ t Reward function of task λ at time t
θ A strategy, a mapping from state space to action space
ϕ t Discount factor
π n e w Updated strategy parameters
π o l d Strategy parameters before the update
π Y Objective gradient function
Y ( θ ) The reward function under the strategy θ
A d v θ ( E λ t , z λ t 1 ) Dominance function
θ π ( z | E ) Probability of taking action z in state E based on policy θ
Table 2. Numerical values of experimental parameters.
Simulation ParametersValue
Simulation time1–7 h
Network area4600 m × 3400 m
Number of nodes400
Node moving speed0.5–1.5 m/s
The maximum amount of cached information5 M
Maximum transmission domain 12   m 2
Data packet sending interval25–35 s
Transmission speed251 kb/s
Node initial energy100 J
Sending a single data packet requires energy1 J
Publisher’s Note: MDPI stays neutral with regard to jurisdictional claims in published maps and institutional affiliations.

