Proteomic Analysis of 3T3-L1 Adipocytes Treated with Insulin and TNF-α

 and
and 
Abstract
1. Introduction
2. Materials and Methods
2.1. Cell Culture
2.2. Cell Lysis and Protein Extraction
2.3. Trypsin/LysC Digestion
2.4. Mass Spectrometry Analysis
2.5. Data Analysis
2.6. Gene Ontology (GO), Statistical, and Cluster Analysis
3. Result and Discussion
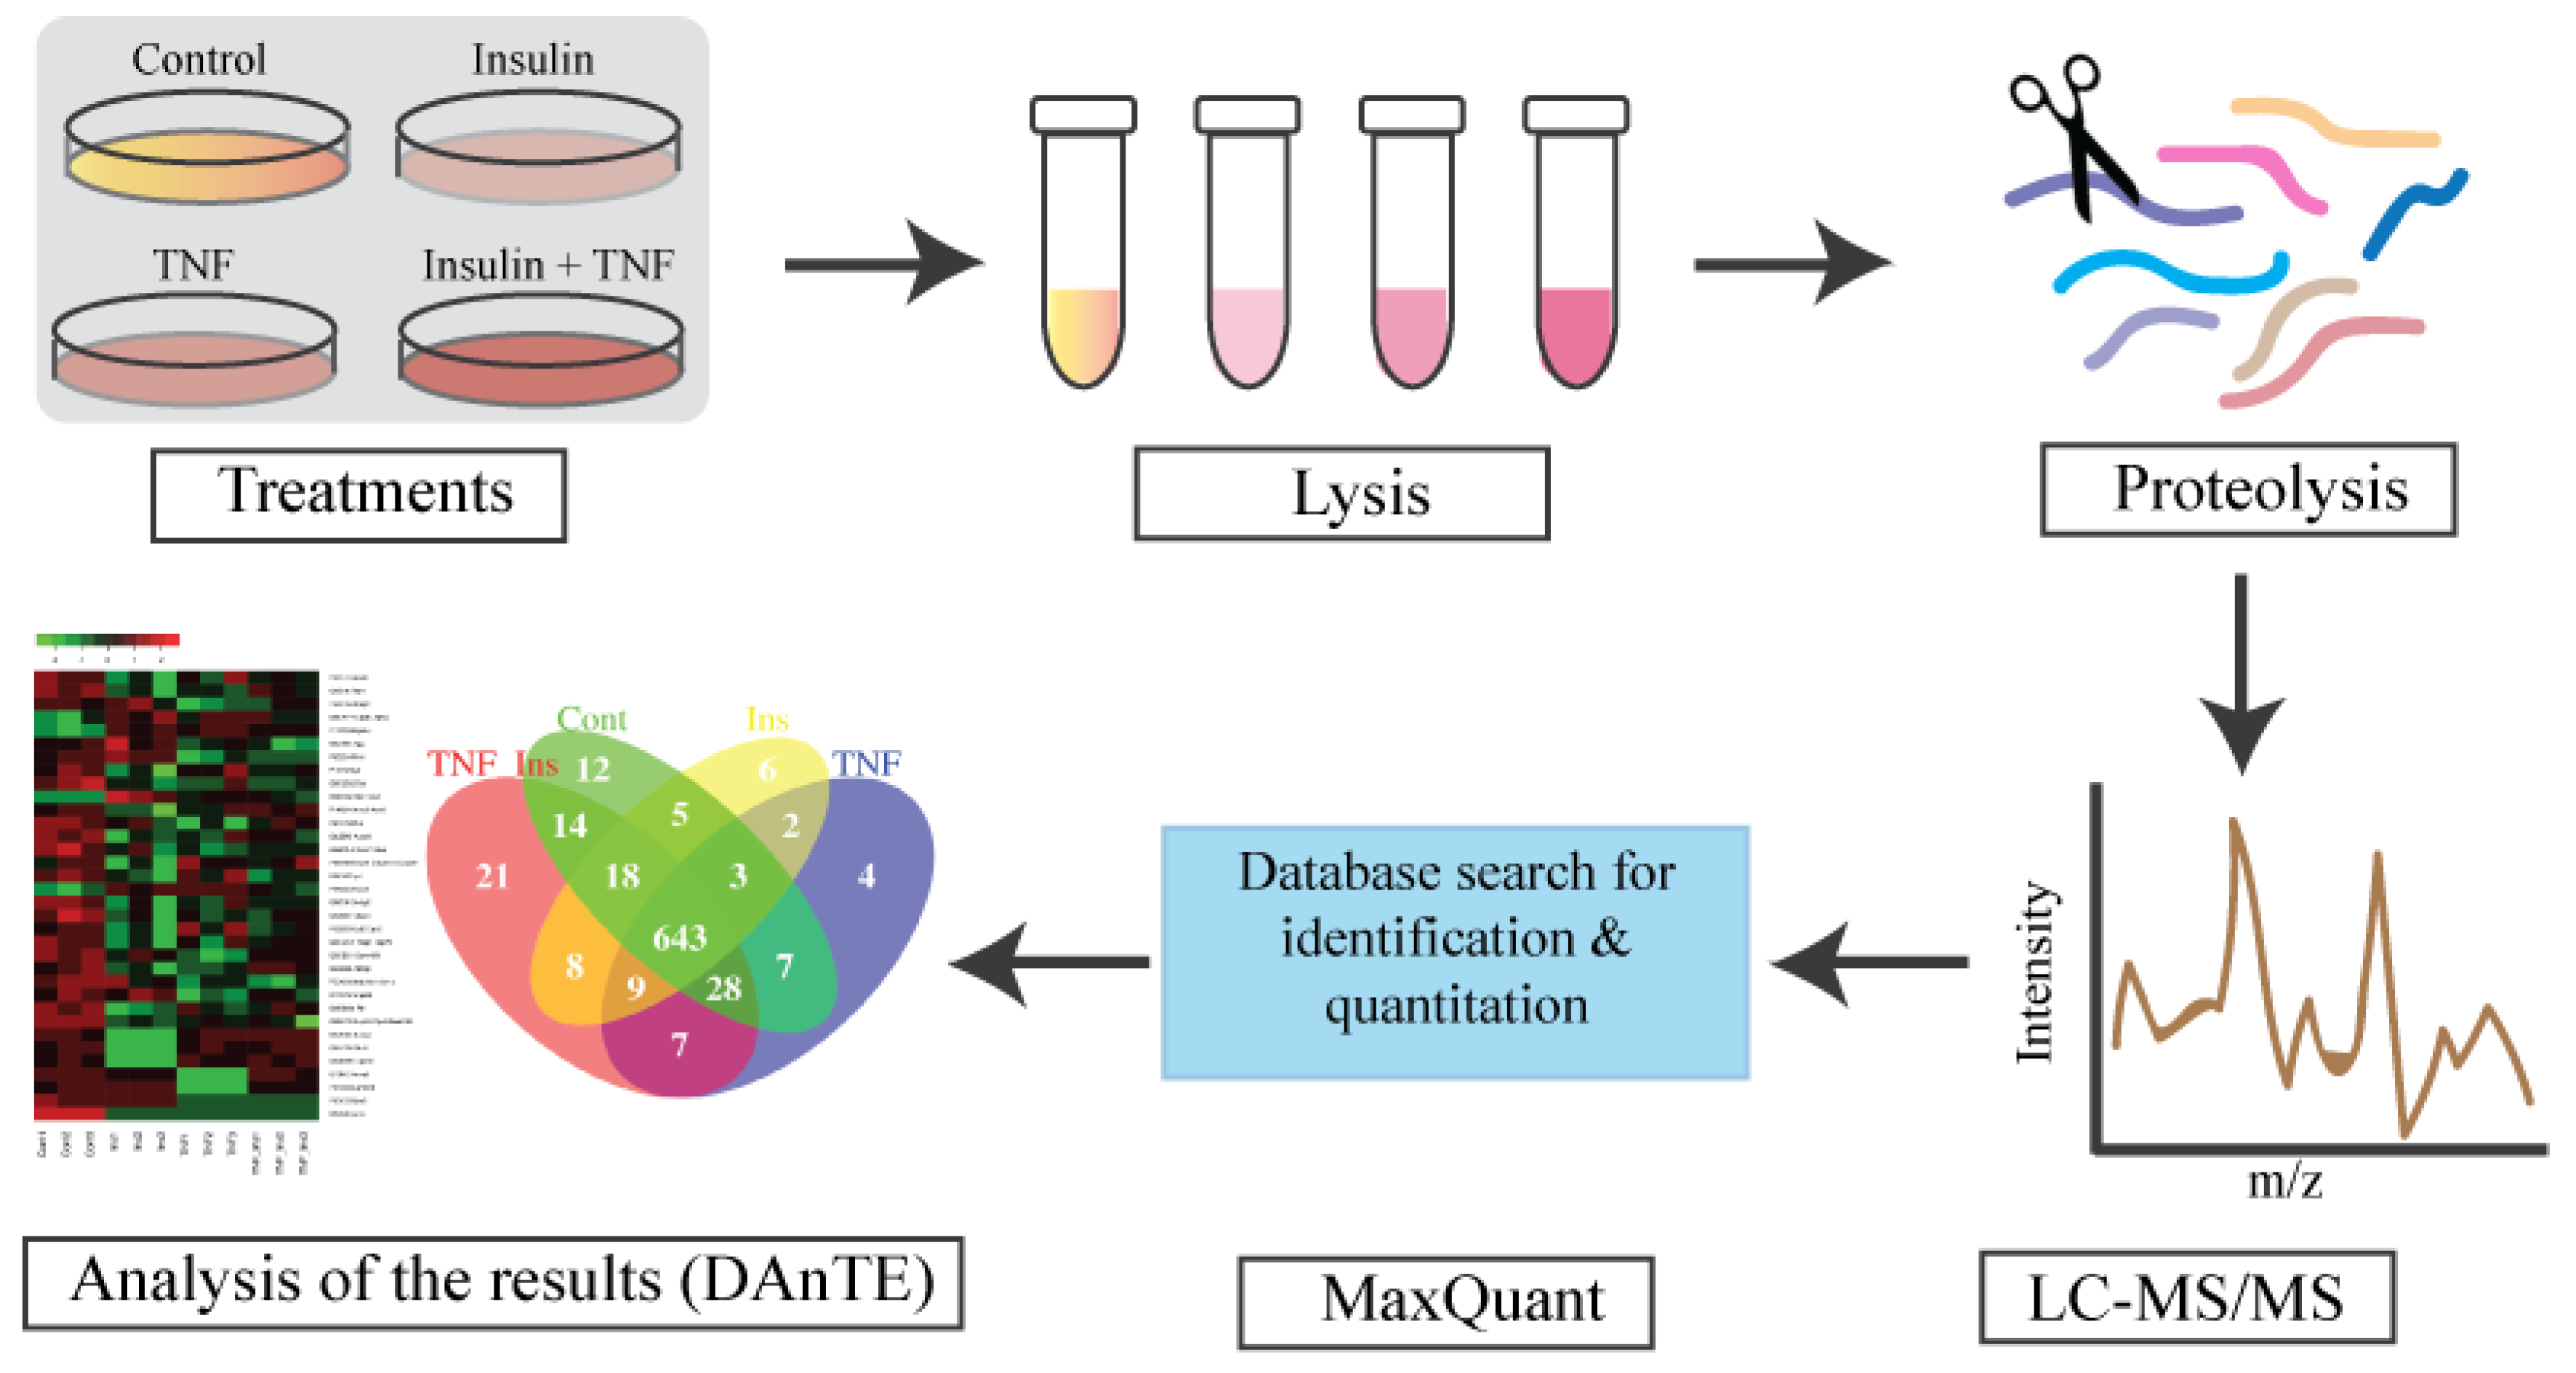
3.1. Experimental Overview and LC-MS Reproducibility
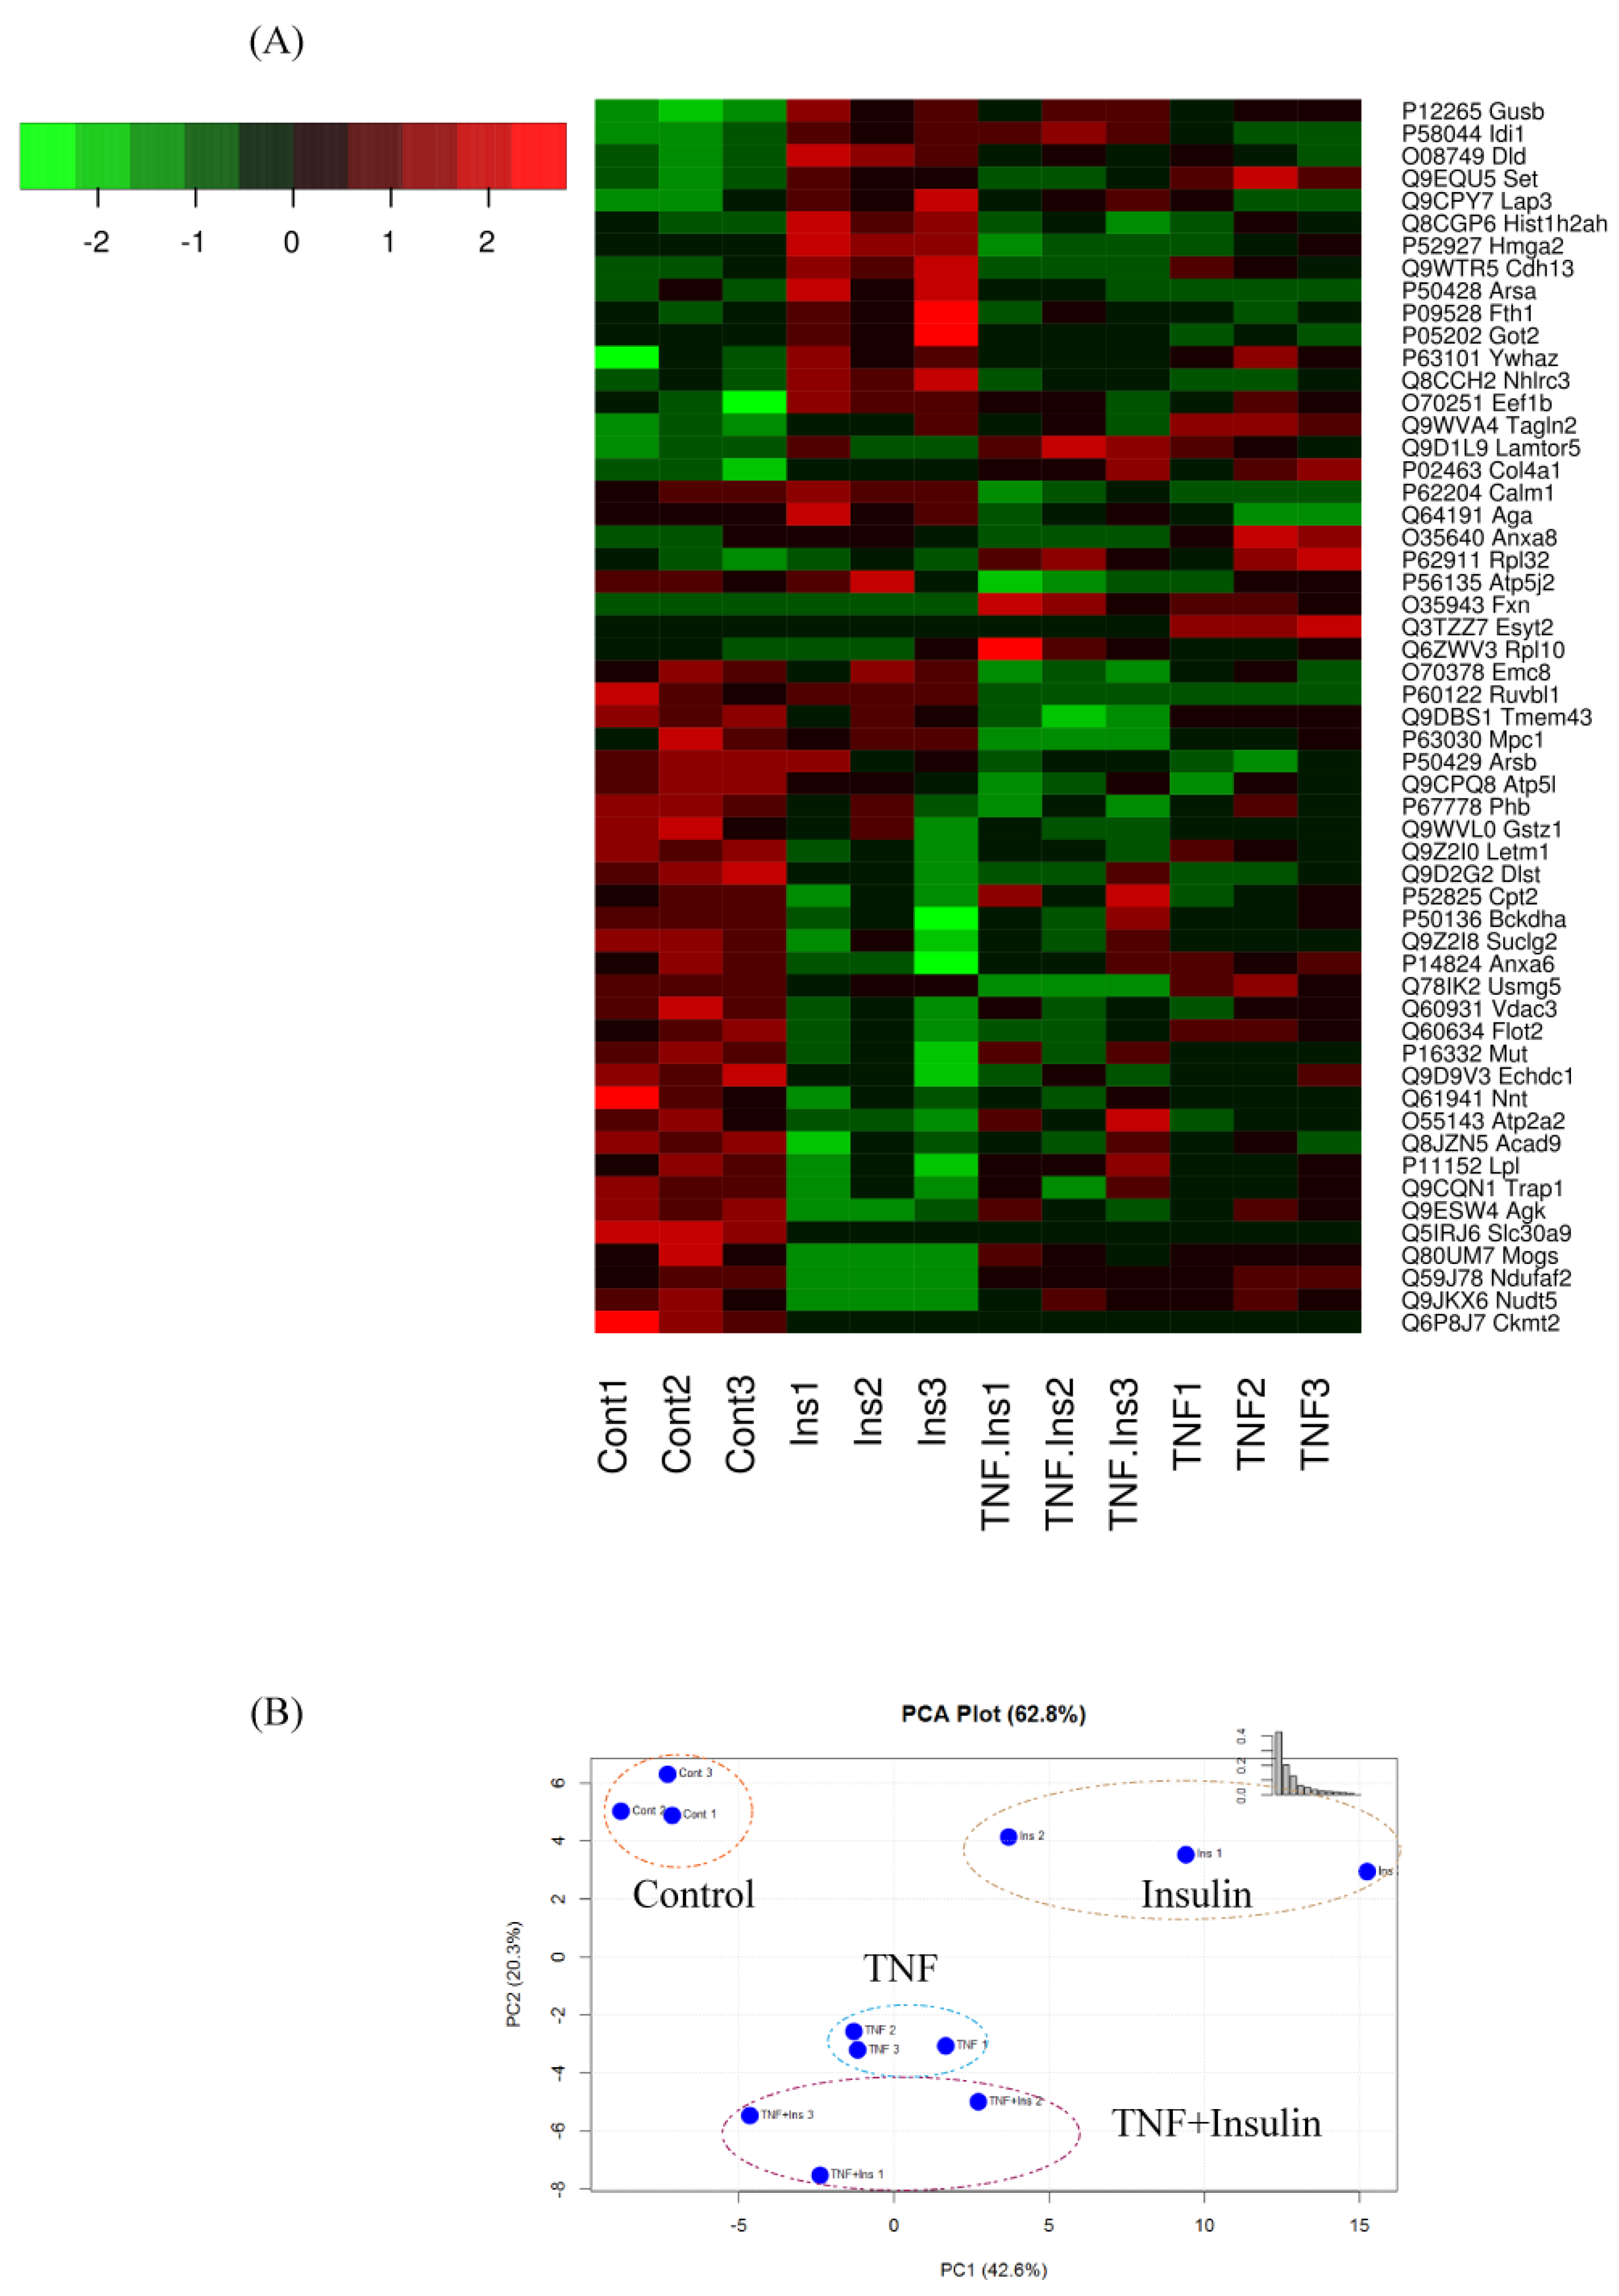
3.2. Analysis of Differentially Expressed Proteins
3.3. Differentially Expressed Mitochondrial Proteins
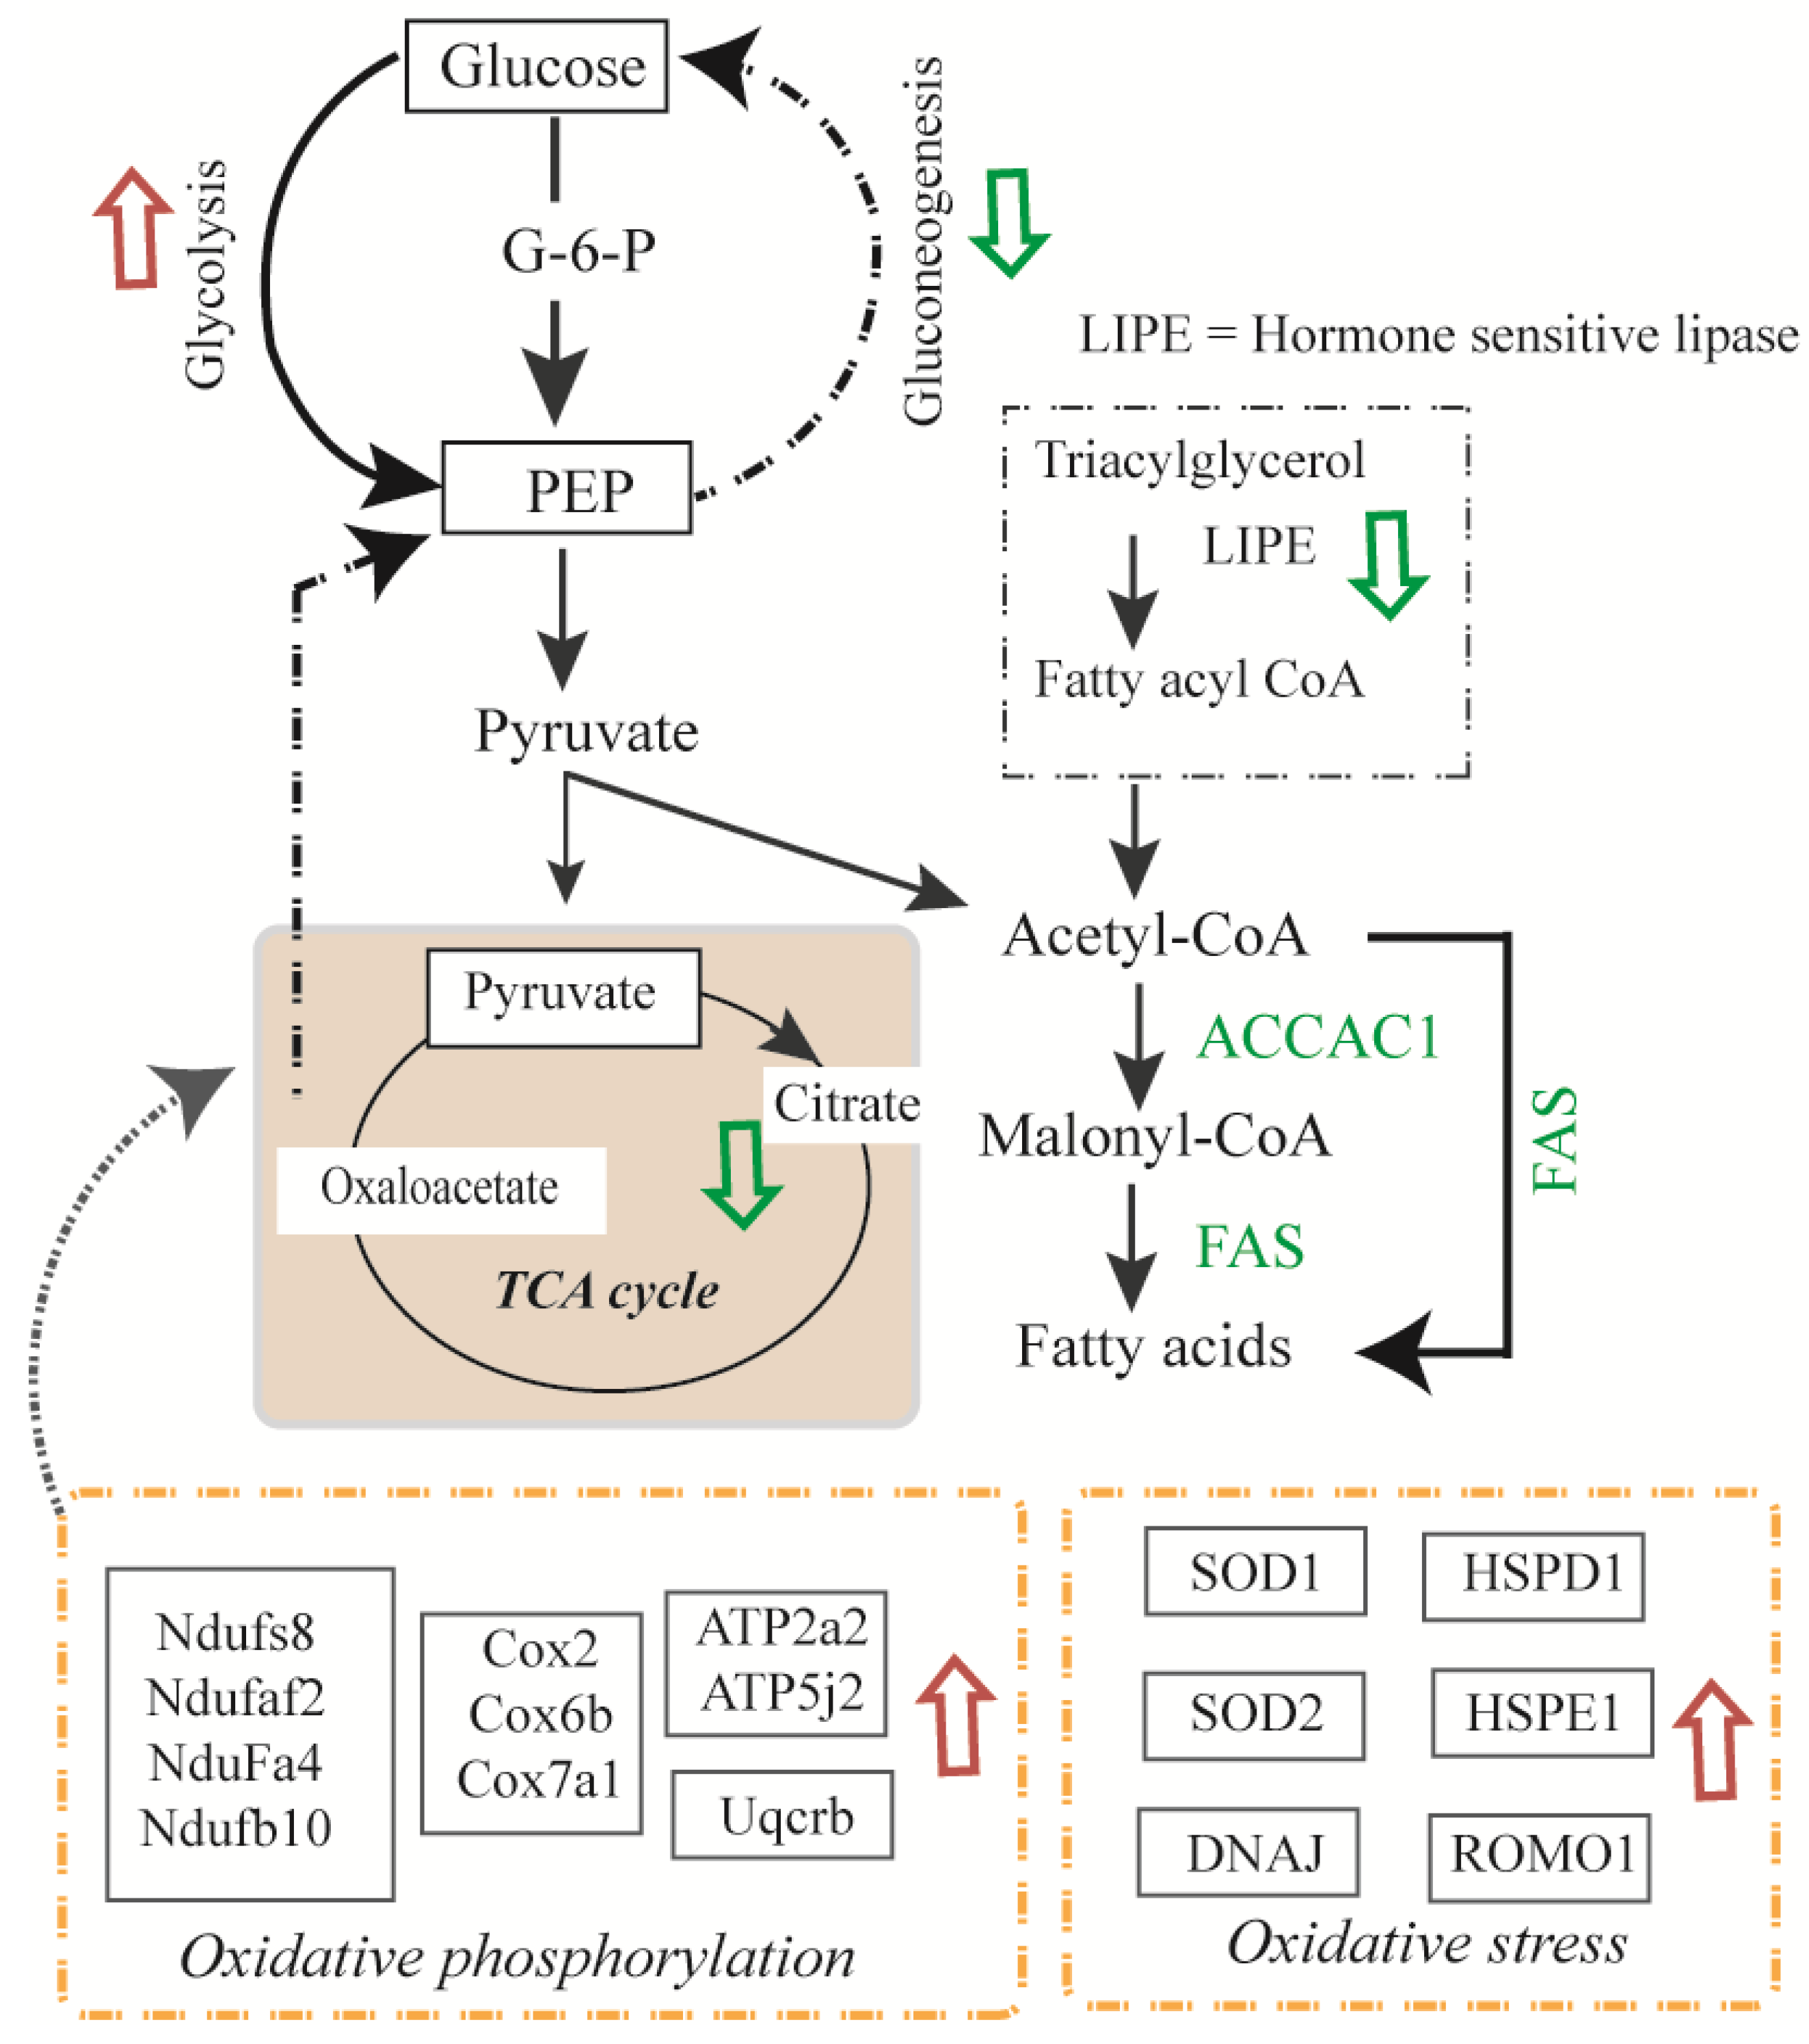
3.4. Glycolysis and Glycogenesis
3.5. Transport, Translation, and Oxidative Stress Responses
4. Summary
Supplementary Materials
Author Contributions
Funding
Conflicts of Interest
Abbreviations
| ER | Endoplasmic Reticulum |
| LC-MS/MS | liquid chromatography tandem MS |
| DMEM | Dulbecco’s modified eagle medium |
| FBS | Fetal bovine serum |
| TNFα | Tumor necrosis Factor-alpha |
| LFQ | Label free quantitation |
| PMSF | Phenylmethylsulfonyl fluoride |
| GO | Gene Ontology |
| HPLC | High Pressure Liquid Chromatography |
| DTT | Dithiothreitol |
| IAA | Iodoacetamide |
| BCA | Bicinchonic Acid |
| CAN | Acetonitril |
| FA | Formic acid |
| HCD | High Energy C-trap Dissociation |
| HF | High Filed |
| ANOVA | Analysis of Variance |
| TCA | Tricarboxylic acid |
| T2D | Type 2 diabetes |
| ROS | Reactive oxygen species |
| kDa | Kilodalton |
| CV | coefficient of variation |
References
- Wilcox, G. Insulin and insulin resistance. Clin. Biochem. Rev. 2005, 26, 19–39. [Google Scholar] [PubMed]
- Moller, D.E.; Flier, J.S. Insulin resistance—Mechanisms, syndromes, and implications. N. Engl. J. Med. 1991, 325, 938–948. [Google Scholar] [CrossRef] [PubMed]
- Nathan, D.M.; Cleary, P.A.; Backlund, J.Y.; Genuth, S.M.; Lachin, J.M.; Orchard, T.J.; Raskin, P.; Zinman, B.; Diabetes Control and Complications Trial/Epidemiology of Diabetes Interventions and Complications (DCCT/EDIC) Study Research Group. Intensive diabetes treatment and cardiovascular disease in patients with type 1 diabetes. N. Engl. J. Med. 2005, 353, 2643–2653. [Google Scholar] [CrossRef] [PubMed]
- Noguchi, R.; Kubota, H.; Yugi, K.; Toyoshima, Y.; Komori, Y.; Soga, T.; Kuroda, S. The selective control of glycolysis, gluconeogenesis and glycogenesis by temporal insulin patterns. Mol. Syst. Biol. 2013, 9, 664. [Google Scholar] [CrossRef] [PubMed]
- Okar, D.A.; Manzano, A.; Navarro-Sabate, A.; Riera, L.; Bartrons, R.; Lange, A.J. PFK-2/FBPase-2: Maker and breaker of the essential biofactor fructose-2,6-bisphosphate. Trends Biochem. Sci. 2001, 26, 30–35. [Google Scholar] [CrossRef]
- Yabaluri, N.; Bashyam, M.D. Hormonal regulation of gluconeogenic gene transcription in the liver. J. Biosci. 2010, 35, 473–484. [Google Scholar] [CrossRef]
- Nakae, J.; Park, B.C.; Accili, D. Insulin stimulates phosphorylation of the forkhead transcription factor FKHR on serine 253 through a Wortmannin-sensitive pathway. J. Biol. Chem. 1999, 274, 15982–15985. [Google Scholar] [CrossRef]
- Sutherland, C.L.; Heath, A.W.; Pelech, S.L.; Young, P.R.; Gold, M.R. Differential activation of the ERK, JNK, and p38 mitogen-activated protein kinases by CD40 and the B cell antigen receptor. J. Immunol. 1996, 157, 3381–3390. [Google Scholar]
- Bollen, M.; Keppens, S.; Stalmans, W. Specific features of glycogen metabolism in the liver. Biochem. J. 1998, 336, 19–31. [Google Scholar] [CrossRef]
- Aiston, S.; Hampson, L.J.; Arden, C.; Iynedjian, P.B.; Agius, L. The role of protein kinase B/Akt in insulin-induced inactivation of phosphorylase in rat hepatocytes. Diabetologia 2006, 49, 174–182. [Google Scholar] [CrossRef]
- Srivastava, A.K.; Pandey, S.K. Potential mechanism(s) involved in the regulation of glycogen synthesis by insulin. Mol. Cell Biochem. 1998, 182, 135–141. [Google Scholar] [CrossRef] [PubMed]
- Ferre, T.; Pujol, A.; Riu, E.; Bosch, F.; Valera, A. Correction of diabetic alterations by glucokinase. Proc. Natl. Acad. Sci. USA 1996, 93, 7225–7230. [Google Scholar] [CrossRef] [PubMed]
- Ribaux, P.G.; Iynedjian, P.B. Analysis of the role of protein kinase B (cAKT) in insulin-dependent induction of glucokinase and sterol regulatory element-binding protein 1 (SREBP1) mRNAs in hepatocytes. Biochem. J. 2003, 376, 697–705. [Google Scholar] [CrossRef] [PubMed]
- Van Schaftingen, E.; Detheux, M.; Veiga da Cunha, M. Short-term control of glucokinase activity: Role of a regulatory protein. FASEB J. 1994, 8, 414–419. [Google Scholar] [CrossRef]
- Dendup, T.; Feng, X.; Clingan, S.; Astell-Burt, T. Environmental Risk Factors for Developing Type 2 Diabetes Mellitus: A Systematic Review. Int. J. Environ. Res. Public Health 2018, 15, 78. [Google Scholar] [CrossRef]
- Stephens, J.M.; Lee, J.; Pilch, P.F. Tumor necrosis factor-alpha-induced insulin resistance in 3T3-L1 adipocytes is accompanied by a loss of insulin receptor substrate-1 and GLUT4 expression without a loss of insulin receptor-mediated signal transduction. J. Biol. Chem. 1997, 272, 971–976. [Google Scholar] [CrossRef]
- Kahn, S.E.; Hull, R.L.; Utzschneider, K.M. Mechanisms linking obesity to insulin resistance and type 2 diabetes. Nature 2006, 444, 840–846. [Google Scholar] [CrossRef]
- Chen, Y.L.; Qiao, Y.C.; Xu, Y.; Ling, W.; Pan, Y.H.; Huang, Y.C.; Geng, L.J.; Zhao, H.L.; Zhang, X.X. Serum TNF-alpha concentrations in type 2 diabetes mellitus patients and diabetic nephropathy patients: A systematic review and meta-analysis. Immunol. Lett. 2017, 186, 52–58. [Google Scholar] [CrossRef]
- Hotamisligil, G.S.; Shargill, N.S.; Spiegelman, B.M. Adipose expression of tumor necrosis factor-alpha: Direct role in obesity-linked insulin resistance. Science 1993, 259, 87–91. [Google Scholar] [CrossRef]
- Kern, P.A.; Saghizadeh, M.; Ong, J.M.; Bosch, R.J.; Deem, R.; Simsolo, R.B. The expression of tumor necrosis factor in human adipose tissue. Regulation by obesity, weight loss, and relationship to lipoprotein lipase. J. Clin. Investig. 1995, 95, 2111–2119. [Google Scholar] [CrossRef]
- Hotamisligil, G.S.; Arner, P.; Caro, J.F.; Atkinson, R.L.; Spiegelman, B.M. Increased adipose tissue expression of tumor necrosis factor-alpha in human obesity and insulin resistance. J. Clin. Investig. 1995, 95, 2409–2415. [Google Scholar] [CrossRef] [PubMed]
- Yoon, J.H.; Song, P.; Jang, J.H.; Kim, D.K.; Choi, S.; Kim, J.; Ghim, J.; Kim, D.; Park, S.; Lee, H.; et al. Proteomic analysis of tumor necrosis factor-alpha (TNF-alpha)-induced L6 myotube secretome reveals novel TNF-alpha-dependent myokines in diabetic skeletal muscle. J. Proteome Res. 2011, 10, 5315–5325. [Google Scholar] [CrossRef] [PubMed]
- Thomson, M.J.; Williams, M.G.; Frost, S.C. Development of insulin resistance in 3T3-L1 adipocytes. J. Biol. Chem. 1997, 272, 7759–7764. [Google Scholar] [CrossRef] [PubMed]
- Stephens, J.M.; Pekala, P.H. Transcriptional repression of the GLUT4 and C/EBP genes in 3T3-L1 adipocytes by tumor necrosis factor-alpha. J. Biol. Chem. 1991, 266, 21839–21845. [Google Scholar] [PubMed]
- Pedersen, O.; Bak, J.F.; Andersen, P.H.; Lund, S.; Moller, D.E.; Flier, J.S.; Kahn, B.B. Evidence against altered expression of GLUT1 or GLUT4 in skeletal muscle of patients with obesity or NIDDM. Diabetes 1990, 39, 865–870. [Google Scholar] [CrossRef] [PubMed]
- Garvey, W.T.; Maianu, L.; Hancock, J.A.; Golichowski, A.M.; Baron, A. Gene expression of GLUT4 in skeletal muscle from insulin-resistant patients with obesity, IGT, GDM, and NIDDM. Diabetes 1992, 41, 465–475. [Google Scholar] [CrossRef] [PubMed]
- Nandi, A.; Kitamura, Y.; Kahn, C.R.; Accili, D. Mouse models of insulin resistance. Physiol. Rev. 2004, 84, 623–647. [Google Scholar] [CrossRef]
- Hotamisligil, G.S. The role of TNFalpha and TNF receptors in obesity and insulin resistance. J. Intern. Med. 1999, 245, 621–625. [Google Scholar] [CrossRef]
- Hotamisligil, G.S. Mechanisms of TNF-alpha-induced insulin resistance. Exp. Clin. Endocrinol. Diabetes 1999, 107, 119–125. [Google Scholar] [CrossRef]
- Ruan, H.; Hacohen, N.; Golub, T.R.; Van Parijs, L.; Lodish, H.F. Tumor necrosis factor-alpha suppresses adipocyte-specific genes and activates expression of preadipocyte genes in 3T3-L1 adipocytes: Nuclear factor-kappaB activation by TNF-alpha is obligatory. Diabetes 2002, 51, 1319–1336. [Google Scholar] [CrossRef]
- Ruan, H.; Miles, P.D.; Ladd, C.M.; Ross, K.; Golub, T.R.; Olefsky, J.M.; Lodish, H.F. Profiling gene transcription in vivo reveals adipose tissue as an immediate target of tumor necrosis factor-alpha: Implications for insulin resistance. Diabetes 2002, 51, 3176–3188. [Google Scholar] [CrossRef] [PubMed]
- Green, H.; Kehinde, O. An established preadipose cell line and its differentiation in culture. II. Factors affecting the adipose conversion. Cell 1975, 5, 19–27. [Google Scholar] [CrossRef]
- Richard, A.J.; Fuller, S.; Fedorcenco, V.; Beyl, R.; Burris, T.P.; Mynatt, R.; Ribnicky, D.M.; Stephens, J.M. Artemisia scoparia enhances adipocyte development and endocrine function in vitro and enhances insulin action in vivo. PLoS ONE 2014, 9, e98897. [Google Scholar] [CrossRef] [PubMed]
- Mittal, L.; Aryal, U.K.; Camarillo, I.G.; Ferreira, R.M.; Sundararajan, R. Quantitative proteomic analysis of enhanced cellular effects of electrochemotherapy with Cisplatin in triple-negative breast cancer cells. Sci. Rep. 2019, 9, 13916. [Google Scholar] [CrossRef]
- Sooreshjani, M.A.; Gursoy, U.K.; Aryal, U.K.; Sintim, H.O. Proteomic analysis of RAW macrophages treated with cGAMP or c-di-GMP reveals differentially activated cellular pathways. RSC Adv. 2018, 8, 36840–36851. [Google Scholar] [CrossRef]
- Cox, J.; Mann, M. MaxQuant enables high peptide identification rates, individualized p.p.b.-range mass accuracies and proteome-wide protein quantification. Nat. Biotechnol. 2008, 26, 1367–1372. [Google Scholar] [CrossRef]
- Cox, J.; Hein, M.Y.; Luber, C.A.; Paron, I.; Nagaraj, N.; Mann, M. Accurate proteome-wide label-free quantification by delayed normalization and maximal peptide ratio extraction, termed MaxLFQ. Mol. Cell Proteom. 2014, 13, 2513–2526. [Google Scholar] [CrossRef]
- Cox, J.; Neuhauser, N.; Michalski, A.; Scheltema, R.A.; Olsen, J.V.; Mann, M. Andromeda: A peptide search engine integrated into the MaxQuant environment. J. Proteome Res. 2011, 10, 1794–1805. [Google Scholar] [CrossRef]
- Polpitiya, A.D.; Qian, W.J.; Jaitly, N.; Petyuk, V.A.; Adkins, J.N.; Camp, D.G.; Anderson, G.A.; Smith, R.D. DAnTE: A statistical tool for quantitative analysis of -omics data. Bioinformatics 2008, 24, 1556–1558. [Google Scholar] [CrossRef]
- Deng, W.J.; Nie, S.; Dai, J.; Wu, J.R.; Zeng, R. Proteome, phosphoproteome, and hydroxyproteome of liver mitochondria in diabetic rats at early pathogenic stages. Mol. Cell Proteom. 2010, 9, 100–116. [Google Scholar] [CrossRef]
- Cobos, E.J.; Entrena, J.M.; Nieto, F.R.; Cendan, C.M.; Del Pozo, E. Pharmacology and therapeutic potential of sigma (1) receptor ligands. Curr. Neuropharmacol. 2008, 6, 344–366. [Google Scholar] [CrossRef] [PubMed]
- Silvera, D.; Formenti, S.C.; Schneider, R.J. Translational control in cancer. Nat. Rev. Cancer 2010, 10, 254–266. [Google Scholar] [CrossRef] [PubMed]
- Cheng, W.; Chen, G.; Jia, H.; He, X.; Jing, Z. DDX5 RNA Helicases: Emerging Roles in Viral Infection. Int. J. Mol. Sci. 2018, 19, 1122. [Google Scholar] [CrossRef] [PubMed]
- Zhang, D.; Liu, Z.X.; Choi, C.S.; Tian, L.; Kibbey, R.; Dong, J.; Cline, G.W.; Wood, P.A.; Shulman, G.I. Mitochondrial dysfunction due to long-chain Acyl-CoA dehydrogenase deficiency causes hepatic steatosis and hepatic insulin resistance. Proc. Natl. Acad. Sci. USA 2007, 104, 17075–17080. [Google Scholar] [CrossRef] [PubMed]
- Zhang, D.; Christianson, J.; Liu, Z.X.; Tian, L.; Choi, C.S.; Neschen, S.; Dong, J.; Wood, P.A.; Shulman, G.I. Resistance to high-fat diet-induced obesity and insulin resistance in mice with very long-chain acyl-CoA dehydrogenase deficiency. Cell Metab. 2010, 11, 402–411. [Google Scholar] [CrossRef] [PubMed]
- Keung, W.; Ussher, J.R.; Jaswal, J.S.; Raubenheimer, M.; Lam, V.H.; Wagg, C.S.; Lopaschuk, G.D. Inhibition of carnitine palmitoyltransferase-1 activity alleviates insulin resistance in diet-induced obese mice. Diabetes 2013, 62, 711–720. [Google Scholar] [CrossRef] [PubMed]
- Mracek, T.; Drahota, Z.; Houstek, J. The function and the role of the mitochondrial glycerol-3-phosphate dehydrogenase in mammalian tissues. Biochim. Biophys. Acta 2013, 1827, 401–410. [Google Scholar] [CrossRef]
- Wang, Z.; Jiang, H.; Chen, S.; Du, F.; Wang, X. The mitochondrial phosphatase PGAM5 functions at the convergence point of multiple necrotic death pathways. Cell 2012, 148, 228–243. [Google Scholar] [CrossRef]
- Guimier, A.; Gordon, C.T.; Godard, F.; Ravenscroft, G.; Oufadem, M.; Vasnier, C.; Rambaud, C.; Nitschke, P.; Bole-Feysot, C.; Masson, C.; et al. Biallelic PPA2 Mutations Cause Sudden Unexpected Cardiac Arrest in Infancy. Am. J. Hum. Genet. 2016, 99, 666–673. [Google Scholar] [CrossRef]
- Kennedy, H.; Haack, T.B.; Hartill, V.; Matakovic, L.; Baumgartner, E.R.; Potter, H.; Mackay, R.; Alston, C.L.; O’Sullivan, S.; McFarland, R.; et al. Sudden Cardiac Death Due to Deficiency of the Mitochondrial Inorganic Pyrophosphatase PPA2. Am. J. Hum. Genet. 2016, 99, 674–682. [Google Scholar] [CrossRef]
- Watanabe, K.; Thandavarayan, R.A.; Gurusamy, N.; Zhang, S.; Muslin, A.J.; Suzuki, K.; Tachikawa, H.; Kodama, M.; Aizawa, Y. Role of 14-3-3 protein and oxidative stress in diabetic cardiomyopathy. Acta Physiol. Hung. 2009, 96, 277–287. [Google Scholar] [CrossRef] [PubMed]
- Vandecaetsbeek, I.; Vangheluwe, P.; Raeymaekers, L.; Wuytack, F.; Vanoevelen, J. The Ca2+ pumps of the endoplasmic reticulum and Golgi apparatus. Cold Spring Harb. Perspect. Biol. 2011, 3, a004184. [Google Scholar] [CrossRef] [PubMed]
- Newsholme, P.; Cruzat, V.F.; Keane, K.N.; Carlessi, R.; de Bittencourt, P.I. Molecular mechanisms of ROS production and oxidative stress in diabetes. Biochem. J. 2016, 473, 4527–4550. [Google Scholar] [CrossRef] [PubMed]
- Lee, C.P.; Eubel, H.; Millar, A.H. Diurnal changes in mitochondrial function reveal daily optimization of light and dark respiratory metabolism in Arabidopsis. Mol. Cell Proteom. 2010, 9, 2125–2139. [Google Scholar] [CrossRef] [PubMed]
- Tahara, E.B.; Barros, M.H.; Oliveira, G.A.; Netto, L.E.; Kowaltowski, A.J. Dihydrolipoyl dehydrogenase as a source of reactive oxygen species inhibited by caloric restriction and involved in Saccharomyces cerevisiae aging. FASEB J. 2007, 21, 274–283. [Google Scholar] [CrossRef] [PubMed]
- Ristow, M.; Pfister, M.F.; Yee, A.J.; Schubert, M.; Michael, L.; Zhang, C.Y.; Ueki, K.; Michael, M.D.; Lowell, B.B.; Kahn, C.R. Frataxin activates mitochondrial energy conversion and oxidative phosphorylation. Proc. Natl. Acad. Sci. USA 2000, 97, 12239–12243. [Google Scholar] [CrossRef] [PubMed]


| Protein ID | Protein Name | Gene | p-Value | Ins | TNF | TNF + Ins |
|---|---|---|---|---|---|---|
| Q5IRJ6 | Zinc transporter 9 | Slc30a9 | 4.0 × 10⁻¹⁴ | − | − | − |
| Q59J78 | NADH dehydrogenase [ubiquinone] 1 alpha2 | Ndufaf2 | 1.3 × 10⁻¹¹ | − | − | − |
| Q78IK2 | Up-regulated skeletal muscle growth protein 5 | Usmg5 | 1.5 × 10⁻¹⁰ | − | − | − |
| Q9JKX6 | ADP-sugar pyrophosphatase | Nudt5 | 2.3 × 10⁻⁸ | − | − | − |
| P60122 | RuvB-like 1 | Ruvbl1 | 8.0 × 10⁻⁸ | + | − | − |
| Q80UM7 | Mannosyl-oligosaccharide glucosidase | Mogs | 8.6 × 10⁻⁸ | − | − | − |
| P63030 | Mitochondrial pyruvate carrier 1 | Mpc1 | 4.3 × 10⁻⁷ | − | − | − |
| P12265 | Beta-glucuronidase | Gusb | 0.00006079 | + | + | + |
| P51912 | Neutral amino acid transporter B(0) | Slc1a5 | 0.00009307 | − | − | − |
| O08749 | Dihydrolipoyl dehydrogenase, mito. | Dld | 0.0001839 | + | + | + |
| P52927 | High mobility group protein HMGI-C | Hmga2 | 0.0002093 | + | − | − |
| Q8CCH2 | NHL repeat-containing protein 3 | Nhlrc3 | 0.0002316 | + | + | − |
| Q9DBS1 | Transmembrane protein 43 | Tmem43 | 0.0003764 | − | − | − |
| Q9EQU5 | Protein SET | Set | 0.0004052 | + | + | + |
| P58044 | Isopentenyl-diphosphate Delta-isomerase 1 | Idi1 | 0.0004929 | + | + | + |
| P62204 | Calmodulin (CaM) | Calm1 | 0.0005279 | + | − | − |
| Q9WTR5 | Cadherin-13 | Cdh13 | 0.0008161 | + | + | + |
| P63028 | Translationally-controlled tumor protein | Tpt1 | 0.001126 | + | + | − |
| O35326 | Serine/arginine-rich splicing factor 5 | Srsf5 | 0.001389 | + | − | − |
| P02463 | Collagen alpha-1(IV) chain | Col4a1 | 0.001912 | + | + | + |
| O70378 | ER membrane protein complex subunit 8 | Emc8 | 0.003163 | − | − | − |
| Q9ESW4 | Acylglycerol kinase, mitochondrial | Agk | 0.003542 | − | − | − |
| O35640 | Annexin A8 | Anxa8 | 0.003733 | + | − | + |
| Q8BX10 | Serine/threonine-protein phosphatase, mito. | Pgam5 | 0.004051 | − | − | + |
| Q9WVA4 | Transgelin-2 | Tagln2 | 0.004956 | + | + | + |
| Q60634 | Flotillin-2 | Flot2 | 0.005462 | − | − | − |
| P11087 | Collagen alpha-1(I) chain | Col1a1 | 0.005898 | + | + | + |
| Q9Z2I0 | Mito. proton/calcium exchanger protein | Letm1 | 0.006284 | − | − | − |
| Q9WVJ3 | Carboxypeptidase Q | Cpq | 0.006917 | + | − | − |
| O55143 | Sarcoplasmic/ER calcium ATPase 2 | Atp2a2 | 0.008952 | − | + | − |
| Q9D8E6 | 60S ribosomal protein L4 | Rpl4 | 0.01043 | − | − | + |
| P05202 | Aspartate aminotransferase, mito. | Got2 | 0.01057 | + | + | − |
| P20152 | Vimentin | Vim | 0.01185 | + | + | + |
| P50428 | Arylsulfatase A | Arsa | 0.0131 | + | + | − |
| P62911 | 60S ribosomal protein L32 | Rpl32 | 0.01327 | + | + | + |
| Q8BH59 | Calcium-binding mito. carrier protein Aralar1 | Slc25a12 | 0.01336 | − | − | − |
| Q6ZWV3 | 60S ribosomal protein L10 | Rpl10 | 0.01399 | − | + | + |
| P17751 | Triosephosphate isomerase | Tpi1 | 0.01403 | + | + | + |
| P13020 | Gelsolin | Gsn | 0.01572 | + | + | + |
| P50429 | Arylsulfatase B | Arsb | 0.01641 | − | − | − |
| Q8K0D5 | Elongation factor G, mito. | Gfm1 | 0.0175 | − | − | − |
| P14824 | Annexin A6 | Anxa6 | 0.01751 | − | − | − |
| Q5SWU9 | Acetyl-CoA carboxylase 1 | Acaca | 0.01889 | − | + | − |
| Q91VM9 | Inorganic pyrophosphatase 2, mitochondrial | Ppa2 | 0.0189 | − | − | − |
| Q9CZ13 | Cytochrome b-c1 complex subunit 1, mito. | Uqcrc1 | 0.01899 | − | + | + |
| Q9D1L9 | Ragulator complex protein LAMTOR5 | Lamtor5 | 0.01905 | + | + | + |
| Q9WTI7 | Unconventional myosin-Ic | Myo1c | 0.01961 | − | − | − |
| Q99M71 | Mammalian ependymin-related protein 1 | Epdr1 | 0.01999 | + | − | − |
| Q8CGP6 | Histone H2A type 1-H | Hist1h2ah | 0.02045 | + | − | + |
| O70251 | Elongation factor 1-beta | Eef1b | 0.02205 | + | + | + |
| P27659 | 60S ribosomal protein L3 | Rpl3 | 0.02291 | − | + | + |
| Q8BGH2 | Sorting & assembly component 50 homolog | Samm50 | 0.02302 | − | − | − |
| Q8JZN5 | Acyl-CoA dehydrogenase 9, mitochondrial | Acad9 | 0.02304 | − | − | − |
| P68040 | Receptor of activated protein C kinase 1 | Rack1 | 0.02396 | − | + | + |
| P09528 | Ferritin heavy chain | Fth1 | 0.02567 | + | − | + |
| Q9D2G2 | Dihydrolipoyllysine succinyltransferase, mito. | Dlst | 0.02608 | − | − | − |
| Q64191 | N(4)-(beta-N-acetylglucosaminyl)-L-asparaginase | Aga | 0.02636 | + | − | − |
| P67778 | Prohibitin | Phb | 0.02667 | − | − | − |
| P52825 | Carnitine O-palmitoyltransferase 2, mito. | Cpt2 | 0.02965 | − | − | − |
| Q9CQ40 | 39S ribosomal protein L49, mito. | Mrpl49 | 0.03098 | − | − | + |
| P29391 | Ferritin light chain 1 | Ftl1 | 0.03142 | + | − | − |
| Q9CPY7 | Cytosol aminopeptidase | Lap3 | 0.03145 | + | + | + |
| P08207 | Protein S100-A10 | S100a10 | 0.03288 | + | + | + |
| Q99KI3 | ER membrane protein complex subunit 3 | Emc3 | 0.03398 | + | − | + |
| P56135 | ATP synthase subunit f, mito. | Atp5j2 | 0.03428 | − | − | − |
| Q9WTM5 | RuvB-like 2 | Ruvbl2 | 0.03593 | − | − | + |
| P09411 | Phosphoglycerate kinase 1 | Pgk1 | 0.03644 | + | − | + |
| Q9DBJ1 | Phosphoglycerate mutase 1 | Pgam1 | 0.03647 | + | + | + |
| P11152 | Lipoprotein lipase | Lpl | 0.03691 | − | − | − |
| Q9Z2I8 | Succinate-CoA ligase beta, mito. | Suclg2 | 0.03695 | − | − | − |
| P51174 | Long-chain acyl-CoA dehydrogenase, mito. | Acadl | 0.03766 | − | - | - |
| Q60931 | Voltage-dependent anion- channel protein 3 | Vdac3 | 0.03796 | - | − | − |
| Q8BJ71 | Nuclear pore complex protein Nup93 | Nup93 | 0.04064 | − | − | − |
| P63101 | 14-3-3 protein zeta/delta | Ywhaz | 0.04158 | + | + | + |
| Q9CQN1 | Heat shock protein 75 kDa, mito. | Trap1 | 0.04341 | − | − | − |
| Q9WVL0 | Maleylacetoacetate isomerase | Gstz1 | 0.04534 | − | − | − |
| P31324 | cAMP-dependent protein kinase type II-beta | Prkar2b | 0.04755 | + | + | + |
| P70296 | Phosphatidylethanolamine-binding protein 1 | Pebp1 | 0.04982 | + | + | + |
© 2019 by the authors. Licensee MDPI, Basel, Switzerland. This article is an open access article distributed under the terms and conditions of the Creative Commons Attribution (CC BY) license (http://creativecommons.org/licenses/by/4.0/).
Share and Cite
Chan, H.; Bhide, K.P.; Vaidyam, A.; Hedrick, V.; Sobreira, T.J.P.; Sors, T.G.; Grant, R.W.; Aryal, U.K. Proteomic Analysis of 3T3-L1 Adipocytes Treated with Insulin and TNF-α. Proteomes 2019, 7, 35. https://doi.org/10.3390/proteomes7040035
Chan H, Bhide KP, Vaidyam A, Hedrick V, Sobreira TJP, Sors TG, Grant RW, Aryal UK. Proteomic Analysis of 3T3-L1 Adipocytes Treated with Insulin and TNF-α. Proteomes. 2019; 7(4):35. https://doi.org/10.3390/proteomes7040035
Chicago/Turabian StyleChan, Hayley, Ketaki P. Bhide, Aditya Vaidyam, Victoria Hedrick, Tiago Jose Paschoal Sobreira, Thomas G. Sors, Ryan W. Grant, and Uma K. Aryal. 2019. "Proteomic Analysis of 3T3-L1 Adipocytes Treated with Insulin and TNF-α" Proteomes 7, no. 4: 35. https://doi.org/10.3390/proteomes7040035
APA StyleChan, H., Bhide, K. P., Vaidyam, A., Hedrick, V., Sobreira, T. J. P., Sors, T. G., Grant, R. W., & Aryal, U. K. (2019). Proteomic Analysis of 3T3-L1 Adipocytes Treated with Insulin and TNF-α. Proteomes, 7(4), 35. https://doi.org/10.3390/proteomes7040035