Article

The Proteome of Tetrasphaera elongata is adapted to Changing Conditions in Wastewater Treatment Plants

by
Florian-Alexander Herbst
,
Morten S. Dueholm
,
Reinhard Wimmer
and
Per Halkjær Nielsen
*
Center for Microbial Communities, Department of Chemistry and Bioscience, Fredrik Bajers Vej 7H, Aalborg University, DK-9220 Aalborg, Denmark
*
Author to whom correspondence should be addressed.
Proteomes 2019, 7(2), 16; https://doi.org/10.3390/proteomes7020016
Submission received: 16 March 2019 / Revised: 19 April 2019 / Accepted: 23 April 2019 / Published: 25 April 2019
(This article belongs to the Special Issue Microbial Proteomics II)

Abstract

:
The activated sludge in wastewater treatment plants (WWTP) designed for enhanced biological phosphorus removal (EBPR) experiences periodically changing nutrient and oxygen availability. Tetrasphaera is the most abundant genus in Danish WWTP and represents up to 20–30% of the activated sludge community based on 16S rRNA amplicon sequencing and quantitative fluorescence in situ hybridization analyses, although the genus is in low abundance in the influent wastewater. Here we investigated how Tetrasphaera can successfully out-compete most other microorganisms in such highly dynamic ecosystems. To achieve this, we analyzed the physiological adaptations of the WWTP isolate T. elongata str. LP2 during an aerobic to anoxic shift by label-free quantitative proteomics and NMR-metabolomics. Escherichia coli was used as reference organism as it shares several metabolic capabilities and is regularly introduced to wastewater treatment plants without succeeding there. When compared to E. coli, only minor changes in the proteome of T. elongata were observed after the switch to anoxic conditions. This indicates that metabolic pathways for anaerobic energy harvest were already expressed during the aerobic growth. This allows continuous growth of Tetrasphaera immediately after the switch to anoxic conditions. Metabolomics furthermore revealed that the substrates provided were exploited far more efficiently by Tetrasphaera than by E. coli. These results suggest that T. elongata prospers in the dynamic WWTP environment due to adaptation to the changing environmental conditions.

1. Introduction

Engineered environments allow for the enrichment of beneficial microorganisms by applying specific environmental conditions that benefit their function. In nature, the microorganisms may encounter changes in temperature or substrate, for example, as well as electron acceptor availability, and many of these changes follow irregular dynamic schedules. Microorganisms have developed different physiological adaptations to cope with such changes in carbon and electron donor/acceptor availability and they include the use of storage compounds such as polyhydroxyalkanoate (PHA), lipids, glycogen, poly-phosphate (poly-P), elemental sulphur, and nitrate [1,2,3]. Very often adaptation also involves the expression of specific sets of genes [4], for example, for acquisition and recycling pathways in case of substrate limitations [5], chaperones and proteases in case of heat [6], catalase or superoxide dismutase in case of oxidative stress [7], or expression of genes for alternative electron acceptors and fermentation in the absence of oxygen [8].
The adaptation of the microbial community to cope with dynamic conditions is exploited in modern wastewater treatment plants (WWTPs). By applying oxic/anoxic alternating phases and/or substrate rich and poor phases (feast–famine) as selective pressures, different microorganisms are enriched that efficiently remove carbon (C), nitrogen (N), and phosphorus (P) from domestic and industrial wastewater [2]. N is removed efficiently by nitrification/denitrification (oxic/anoxic) cycles which convert surplus N to inert N2 or biomass [9]. P is removed by enhanced biological phosphorus removal (EBPR) by including an anaerobic tank in addition to tanks for nitrification/denitrification and these plants can reach a high effluent water quality in respect to P with no or minimal chemical supplementation. In EBPR plants, poly-P accumulating organisms (PAOs) are enriched [10] and they store excess amounts of intracellular poly-P [2]. The general model assumes that poly-P is used for energy production during an anaerobic phase to take up carbon substrates. These are then stored as PHAs which are later oxidized aerobically in carbon-limited oxic phases for growth and poly-P regeneration. Over time P is depleted from the wastewater as the poly-P production is overall net-positive, and additional P is also incorporated into the biomass. Both can be removed as excess sludge and P can be recovered as raw material, for example, before [11] or after anaerobic digestion [12].
The general EBPR model is primarily based on studies on the betaproteobacterial Candidatus Accumulibacter and the uptake of volatile fatty acids (VFA), mainly acetate, during an anaerobic phase, storage as PHA, and later oxidation in the aerobic phase [13,14]. Recently, another mechanism was revealed in PAOs belonging to the actinobacterial genus Tetrasphaera. Its members carry out aerobic heterotrophic growth and nitrate respiration, but they can also ferment. All these processes are important for a well-working EBPR process. Surprisingly, Tetrasphaera are not able to produce and store PHAs [15]. Instead, experiments using T. elongata str. Lp2 under dynamic anaerobic/aerobic conditions showed that they could accumulate free amino acids such as glycine for later oxidation in the aerobic phase [16]. The general model is undoubtedly appropriate for Ca. Accumulibacter and may explain many lab-scale and full-scale observations. However, microbial community analyses by fluorescence in situ hybridization (FISH) and 16S rRNA gene amplicon sequencing indicate that Ca. Accumulibacter accounts for only a small fraction of the PAO population in many EBPR plants and that Tetrasphaera is more abundant, occasionally reaching 20–30% of the biomass [17,18,19].
The aim of this study was to understand how Tetrasphaera can successfully compete in highly dynamic EBPR plants. Therefore, the proteome and extracellular metabolome (exometabolome) of aerobically grown T. elongata str. Lp2 cells before and after a 3 h anoxic phase were analyzed. E. coli str. K-12 was treated in the same way to serve as reference. E. coli was chosen as it can grow anaerobically by fermentation and nitrate reduction and it is being introduced in high amounts by incoming wastewater without constituting any major fraction in WWTPs [18]. Also, E. coli is generally very versatile and can survive under many different conditions. This specific strain is further one of the best described microorganisms and good annotations as well as literature are available. For most bacteria, the expression of the necessary genes for anaerobic energy harvest is strictly hierarchically controlled [8,20] and adaptation needs some time. The acquired data indicates that this is not the case for T. elongata and that it does indeed show a high level of metabolic robustness and readiness. This, together with poly-P as energy storage compound and a metabolic diversity, could partly explain continuous growth and successful competition in the dynamic WWTP environment.

2. Materials and Methods

2.1. Cultivation and Sampling

T. elongata str. Lp2 and E. coli str. K-12 were cultivated in a modified R2A (minimal) medium [16] to be comparable with previous studies. Inoculation was performed from liquid overnight cultures to an optical density (OD) at 600 nm of 0.01. Initial oxic cultivation was done in 50 mL medium within 250 mL conical flasks (25°C, 150 rpm). For the 3 h of anoxic incubation, cultures were transferred to serum flasks, and oxygen was removed by repeatedly replacing the headspace with >99.9% pure N2. Cultivations were performed in quadruplicates, and whole cultures were sacrificed at the end of the aerobic or anaerobic phase. Growth was determined by measuring the change in OD at 600 nm of 1 mL culture broth in a cuvette and with total protein concentration (see below).

2.2. Metabolomics & Proteomics

All metabolomic and proteomic samples were obtained and measured as four biological replicates. Extracellular metabolites were extracted and analyzed by 600 MHZ NMR as previously described [21]. In short, 15 mL of culture supernatant were lyophilized, rehydrated in 600 µL D2O with TSP as standard, adjusted to a pH of 7, and recorded as 1D-NOESY at 298.1 K on a BRUKER AVIII-600 MHz NMR spectrometer (Bruker, Billeric, MA, USA) equipped with a 5 mm cryogenic inverse triple resonance probe. NMR signals were identified and quantified using ChenomX and the known TSP concentration as reference.
For protein extraction, cells were lysed (in 1% sodium deoxycholate, 50 mM triethylammonium bicarbonate) using the FastPrep-96 Instrument (MP Biomedicals, Eschwege, Germany) for 1 min at 1600 rpm and the All FastDNA-96 (MP Biomedicals) lysis matrix. Protein concentrations were assessed by BCA method in triplicates, and approximately 20 µg of protein was subjected to a polyvinylidene fluoride membrane-based proteomic sample preparation [22]. The protocol was adjusted to 20 µg of protein, and the membranes were washed twice with 66% acetonitrile before equilibration with an 8 M urea solution. Tryptic peptides were measured by nLC-MS/MS (Ultimate 3000 coupled to a Q Exactive, Thermo Fisher Scientific, Waltham, MA, USA) applying a 3 h method (~140 min elution window). Details can be found elsewhere [21]. Mass spectra were analyzed by MaxQuant (v. 1.5.3.30) [23] as previously described [21], but with up to four allowed missed cleavages. Organism-specific protein databases in FASTA file format were obtained from UniProt [24]. Proteins were kept if they could be quantified (at least two peptides) in at least three replicates in one condition (aerobic or anaerobic). Label-free quantification (LFQ) values were used to compare the relative changes. The abundance data was log2 transformed and missing values were replaced by imputation from the normal distribution before statistical analysis. Significant changes in abundance were identified by t-test (two-tailed, permutation-based correction, 250 randomizations, FDR < 5%) in Perseus [25]. Plots were created using R [26] and the ggplot2 package [27]. The mass spectrometry proteomics data have been deposited to the ProteomeXchange Consortium (http://www.proteomexchange.org/) via the PRIDE partner repository [28] with the dataset identifier PXD005211.

3. Results and Discussion

The genus Tetrasphaera is repeatedly observed as the most abundant genus in many EBPR plants [17,18,19]. Since dynamic conditions with oxic/anoxic changes of roughly 3–4 h duration are fundamental to these plants, the reaction to oxygen deprivation under controlled conditions was investigated using T. elongata str. Lp2. This species has been used as the model organism for this clade of PAOs as it has a relatively high similarity on 16S rRNA gene level to in situ abundant phylotypes [17].

3.1. Efficient Growth under Anoxic Conditation

Pure cultures of E. coli and T. elongata were grown in modified R2A medium (without starch) and they showed, as expected, different growth patterns. T. elongata grew considerably slower than E. coli and required approximately three times as long time to reach a similar amount of biomass before the start of the anaerobic phase (24 vs 7 hours). During the anoxic growth period, relative and absolute growth were at least as high for T. elongata as for E. coli as determined by biomass differences, assessed by the changes in OD and total protein concentration (Table 1).

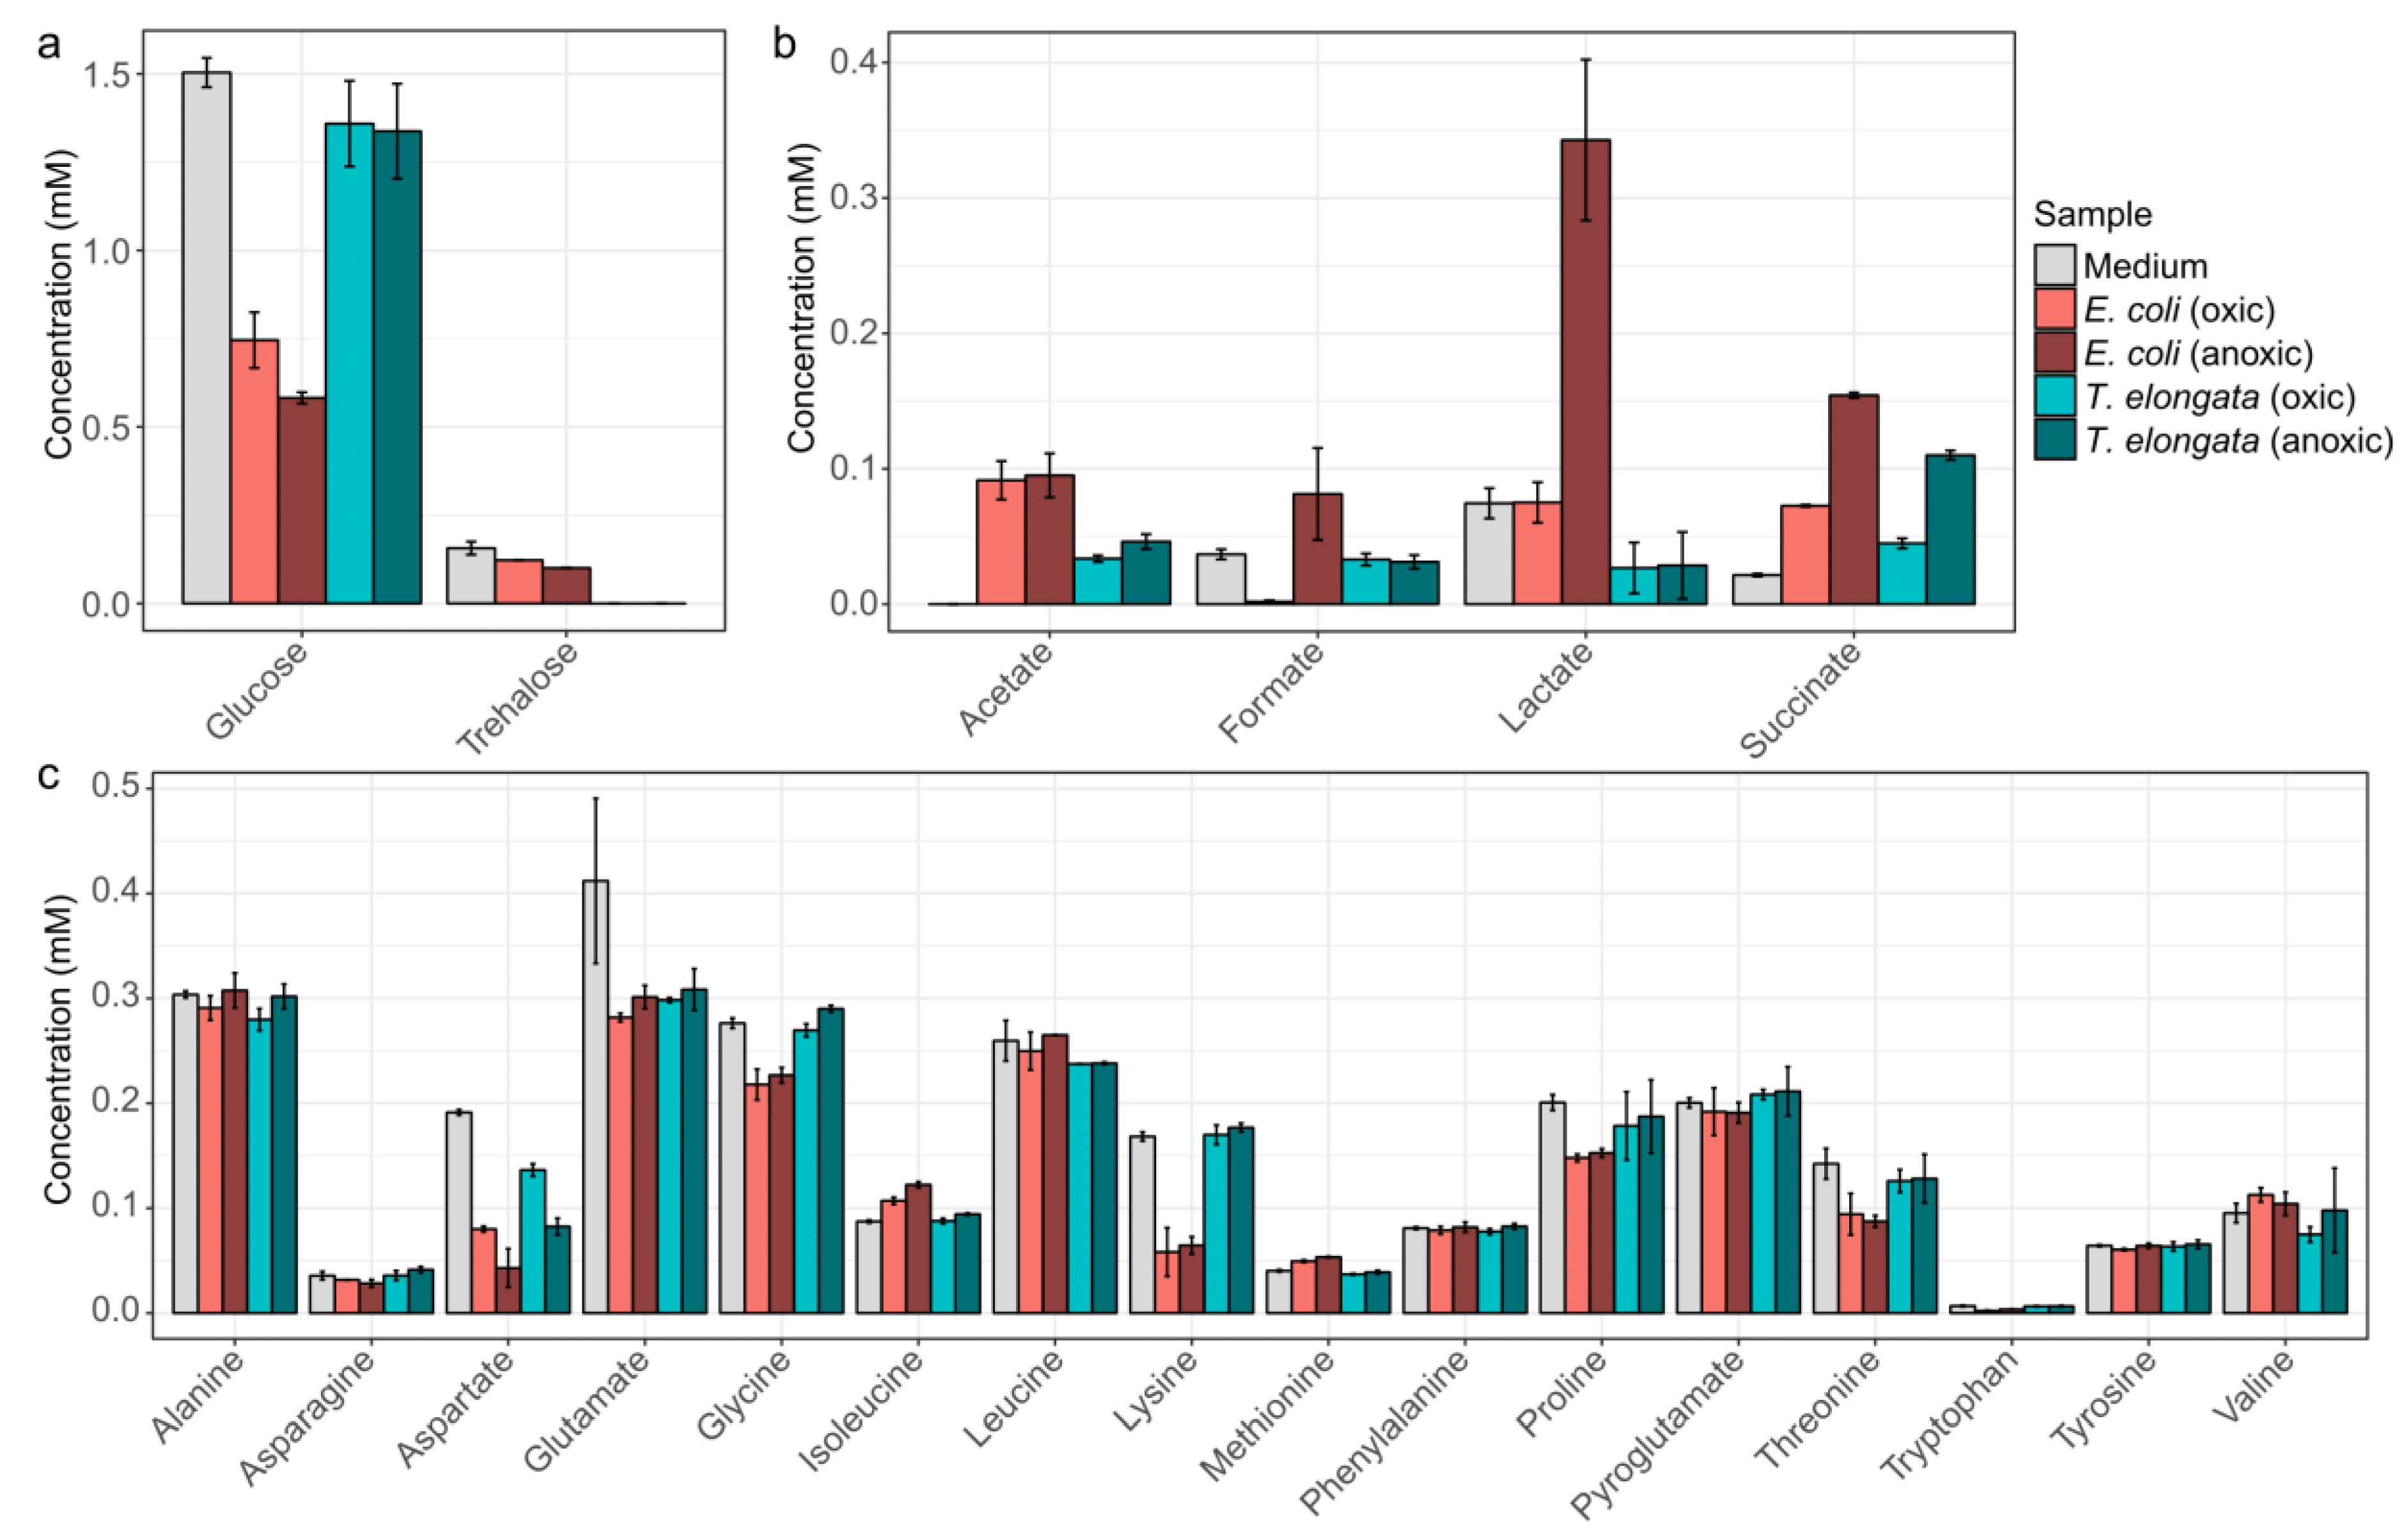
3.2. Cost-Effective Use of Substrates

To obtain detailed information of the substrate usage and the production of fermentation products, the medium was analyzed by NMR at different growth stages (Figure 1). T. elongata was found to use considerably less sugars and amino acids for growth compared to E. coli. Surprisingly, T. elongata first depleted trehalose in the medium and subsequently exploited glucose and aspartate. Other amino acids were not visibly used as substrates, although T. elongata can metabolize all the measured amino acids in glucose-free medium. Previous genomic analyses suggested that T. elongata might produce lactate as fermentation product [15]. This could not be observed in this study and emphasizes the need for methods that provide direct information about phenotypic behaviour, such as metabolomics. Under the conditions applied, the only fermentation product observed in significant amounts was succinate. Both E. coli and T. elongata showed increased succinate production during anaerobic incubation.
Substrates were not a limiting factor in the experiments (Figure 1), although provided in low concentrations as they are in WWTPs, and thus the oxic/anoxic switch can be seen as the primary environmental variable.

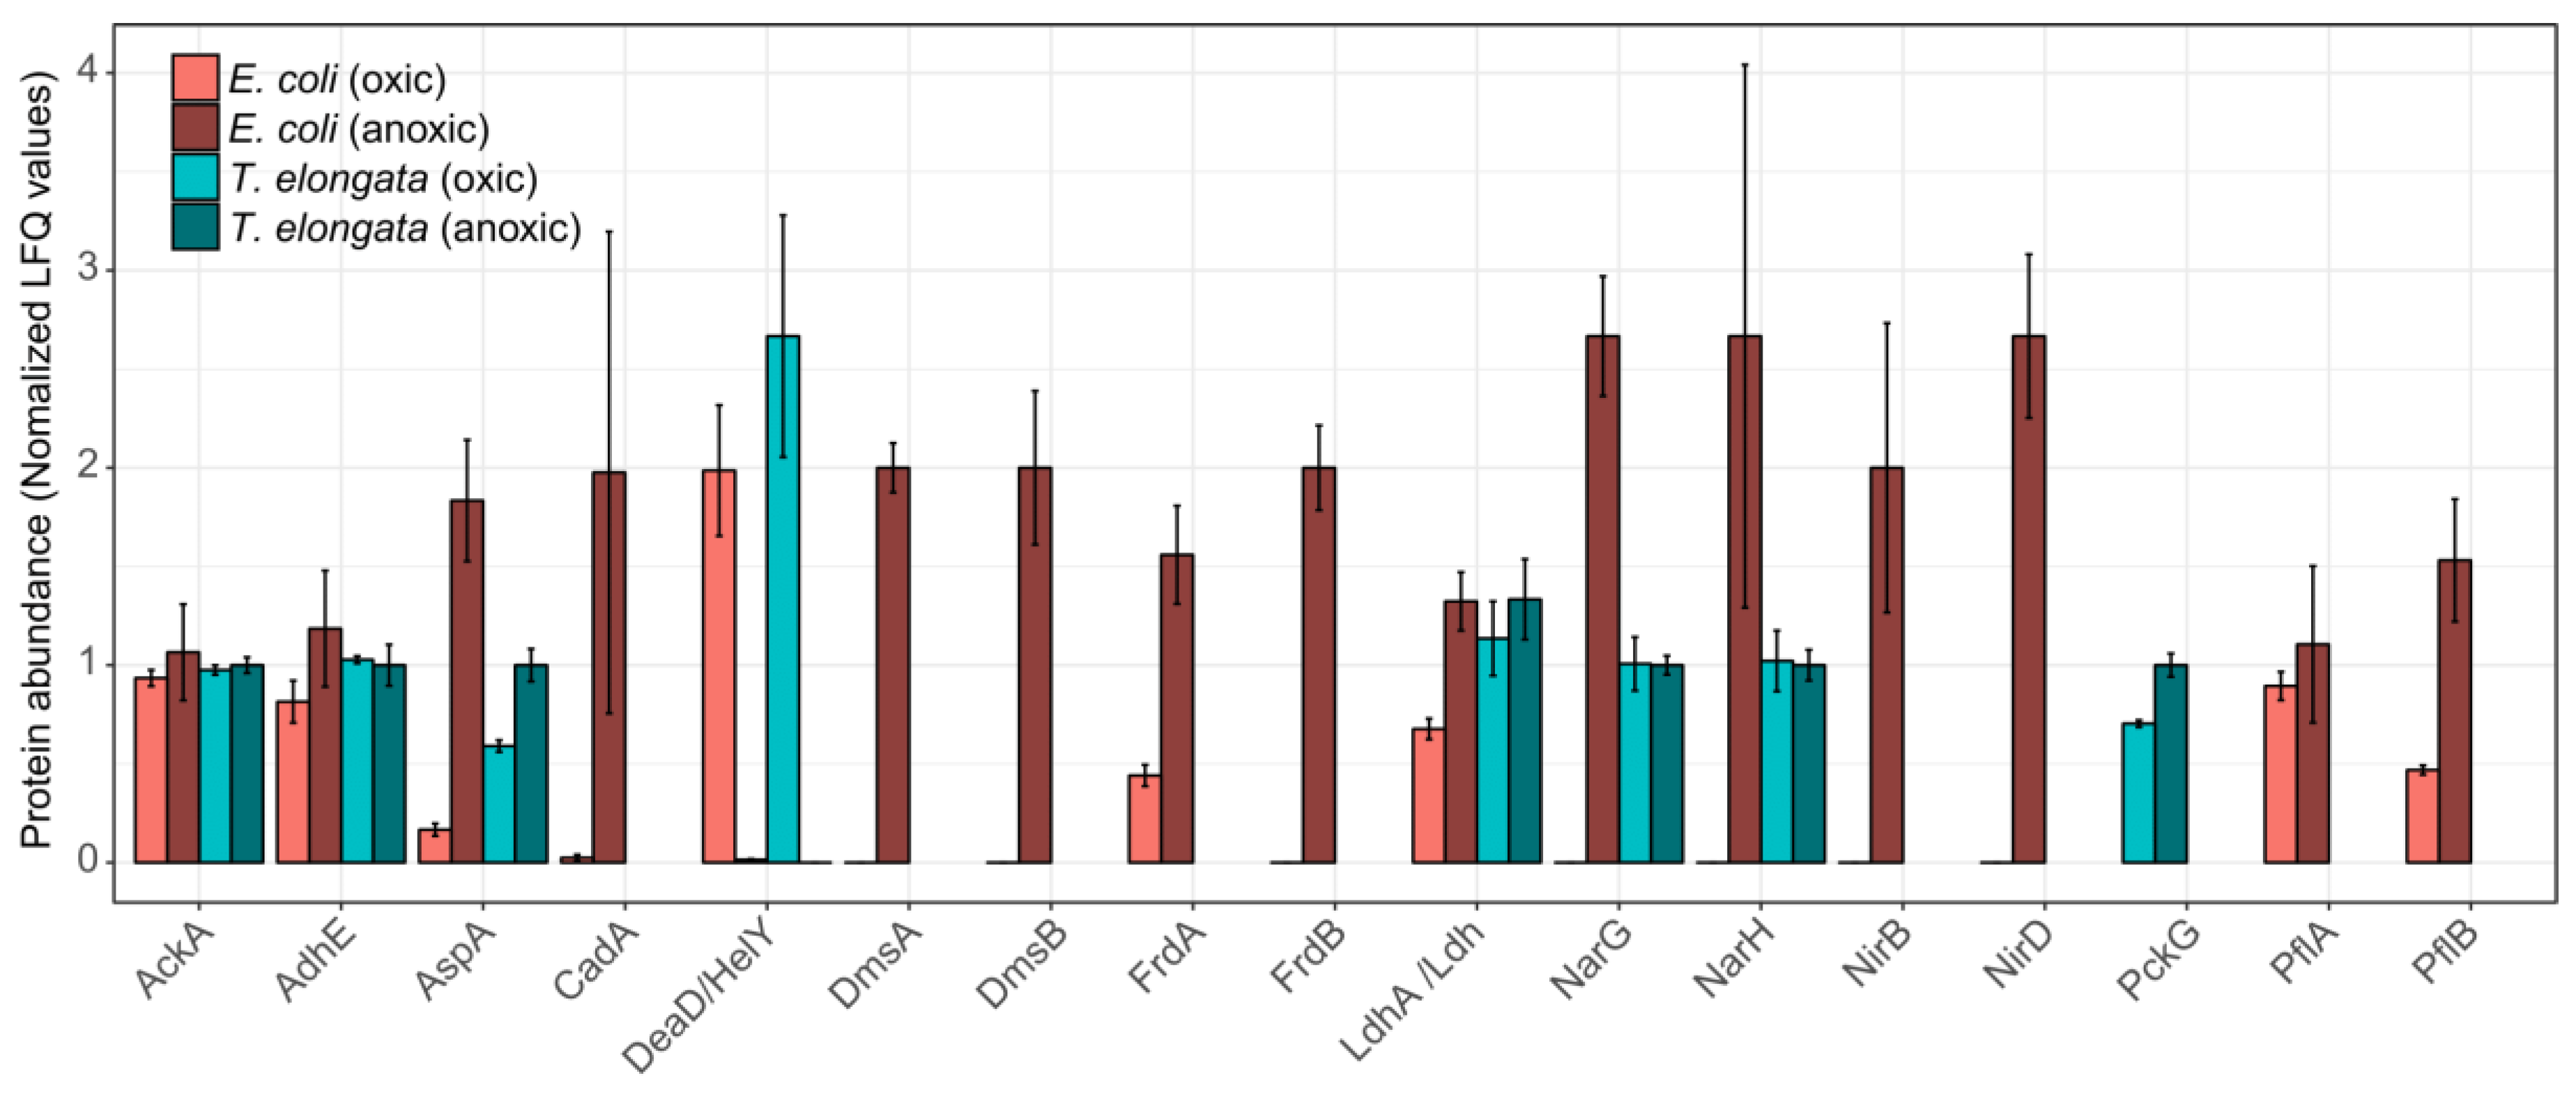
3.3. Minor Changes in the Proteomes Upon Shift to Anoxic Conditions

It was possible to quantify 1318 and 1224 proteins, or 42.7% and 28.5%, of the theoretical proteome for T. elongata and E. coli, respectively (up to 1703 identified proteins, see Supplementary Material). Out of these, 228 and 171 were significantly altered in abundance (FDR 5%), but with higher maximum fold changes in E. coli (Figure 2a). Classification of the differentially expressed proteins based on COG (Clusters of Orthologous Groups) class IDs [29] revealed considerable larger changes in the abundance of proteins related to energy production and conversion, amino acid metabolism and transport, carbohydrate metabolism and transport, and inorganic ion transport and metabolism for E. coli compared to T. elongata (Figure 2b).
Looking at specific changes for proteins involved in energy production and stress response, the proteomic similarities between the two organisms were primarily restricted to an aspartate ammonia-lyase (AspA) and, interestingly, to an ATP-dependent RNA helicase, which was the most significantly down-regulated protein in both proteomes: DeaD and HelY in E. coli and T. elongata, respectively. These RNA helicases are required to adapt to different environmental situations [30]. AspA provides fumarate, presumably for reduction to succinate, from aspartate. For E. coli, it has been shown that AspA is part of the NarL regulon [20]. These proteomic adaptations fit the observed depletion of aspartate in the medium. The aspartate–succinate conversion has been reported for several bacteria [31,32,33] and yeast [34] and might be a general anaerobic adaptation and be preferred to the phosphoenolpyruvate to oxaloacetate conversion (slight, but significant up-regulation in T. elongata of PckG). Although succinate was undoubtedly the dominant fermentative product for T. elongata, no fumarate reductase for fermentation is annotated in its genome [35]. For Bacillus subtilis it was shown that the ‘aerobic’ succinate dehydrogenase could fulfil this role [36] and T. elongata might do likewise. No other fermentation products were of importance to T. elongata. Although it depleted lactate under aerobic conditions, it did not produce any during anaerobic incubation. However, the lactate dehydrogenase (Ldh) could be identified in both conditions. E. coli did produce high amounts of lactate in the absence of oxygen (and other terminal electron acceptors), and the necessary lactate dehydrogenase (LdhA) was significantly more abundant. This assumingly led to additional acidic stress which was compensated by the expression of a lysine decarboxylase (CadA), which is regarded as a major acid stress enzyme [37]. Apart from the increased abundance of AspA, the hierarchical control of anaerobic gene expression [20,38] was evident only for E. coli (Figure 3). Enzymes for fermentation or nitrate reduction were identified already under aerobic conditions for T. elongata and did not change significantly in their relative abundance during anaerobic incubation. In contrast to this, enzymes for nitrate reduction or fermentation were not identified before or showed clear up-regulation during anaerobic incubation for E. coli (Figure 3). The presence of the anaerobic metabolic machinery for energy production in T. elongata explains their ability to ignore the anaerobic shock and keep a steady growth. Under relatively stable conditions like in the human gut this would probably be a costly disadvantage, but in dynamic systems like wastewater treatment plants with regular environmental changes, this might be a major cost-saving advantage.

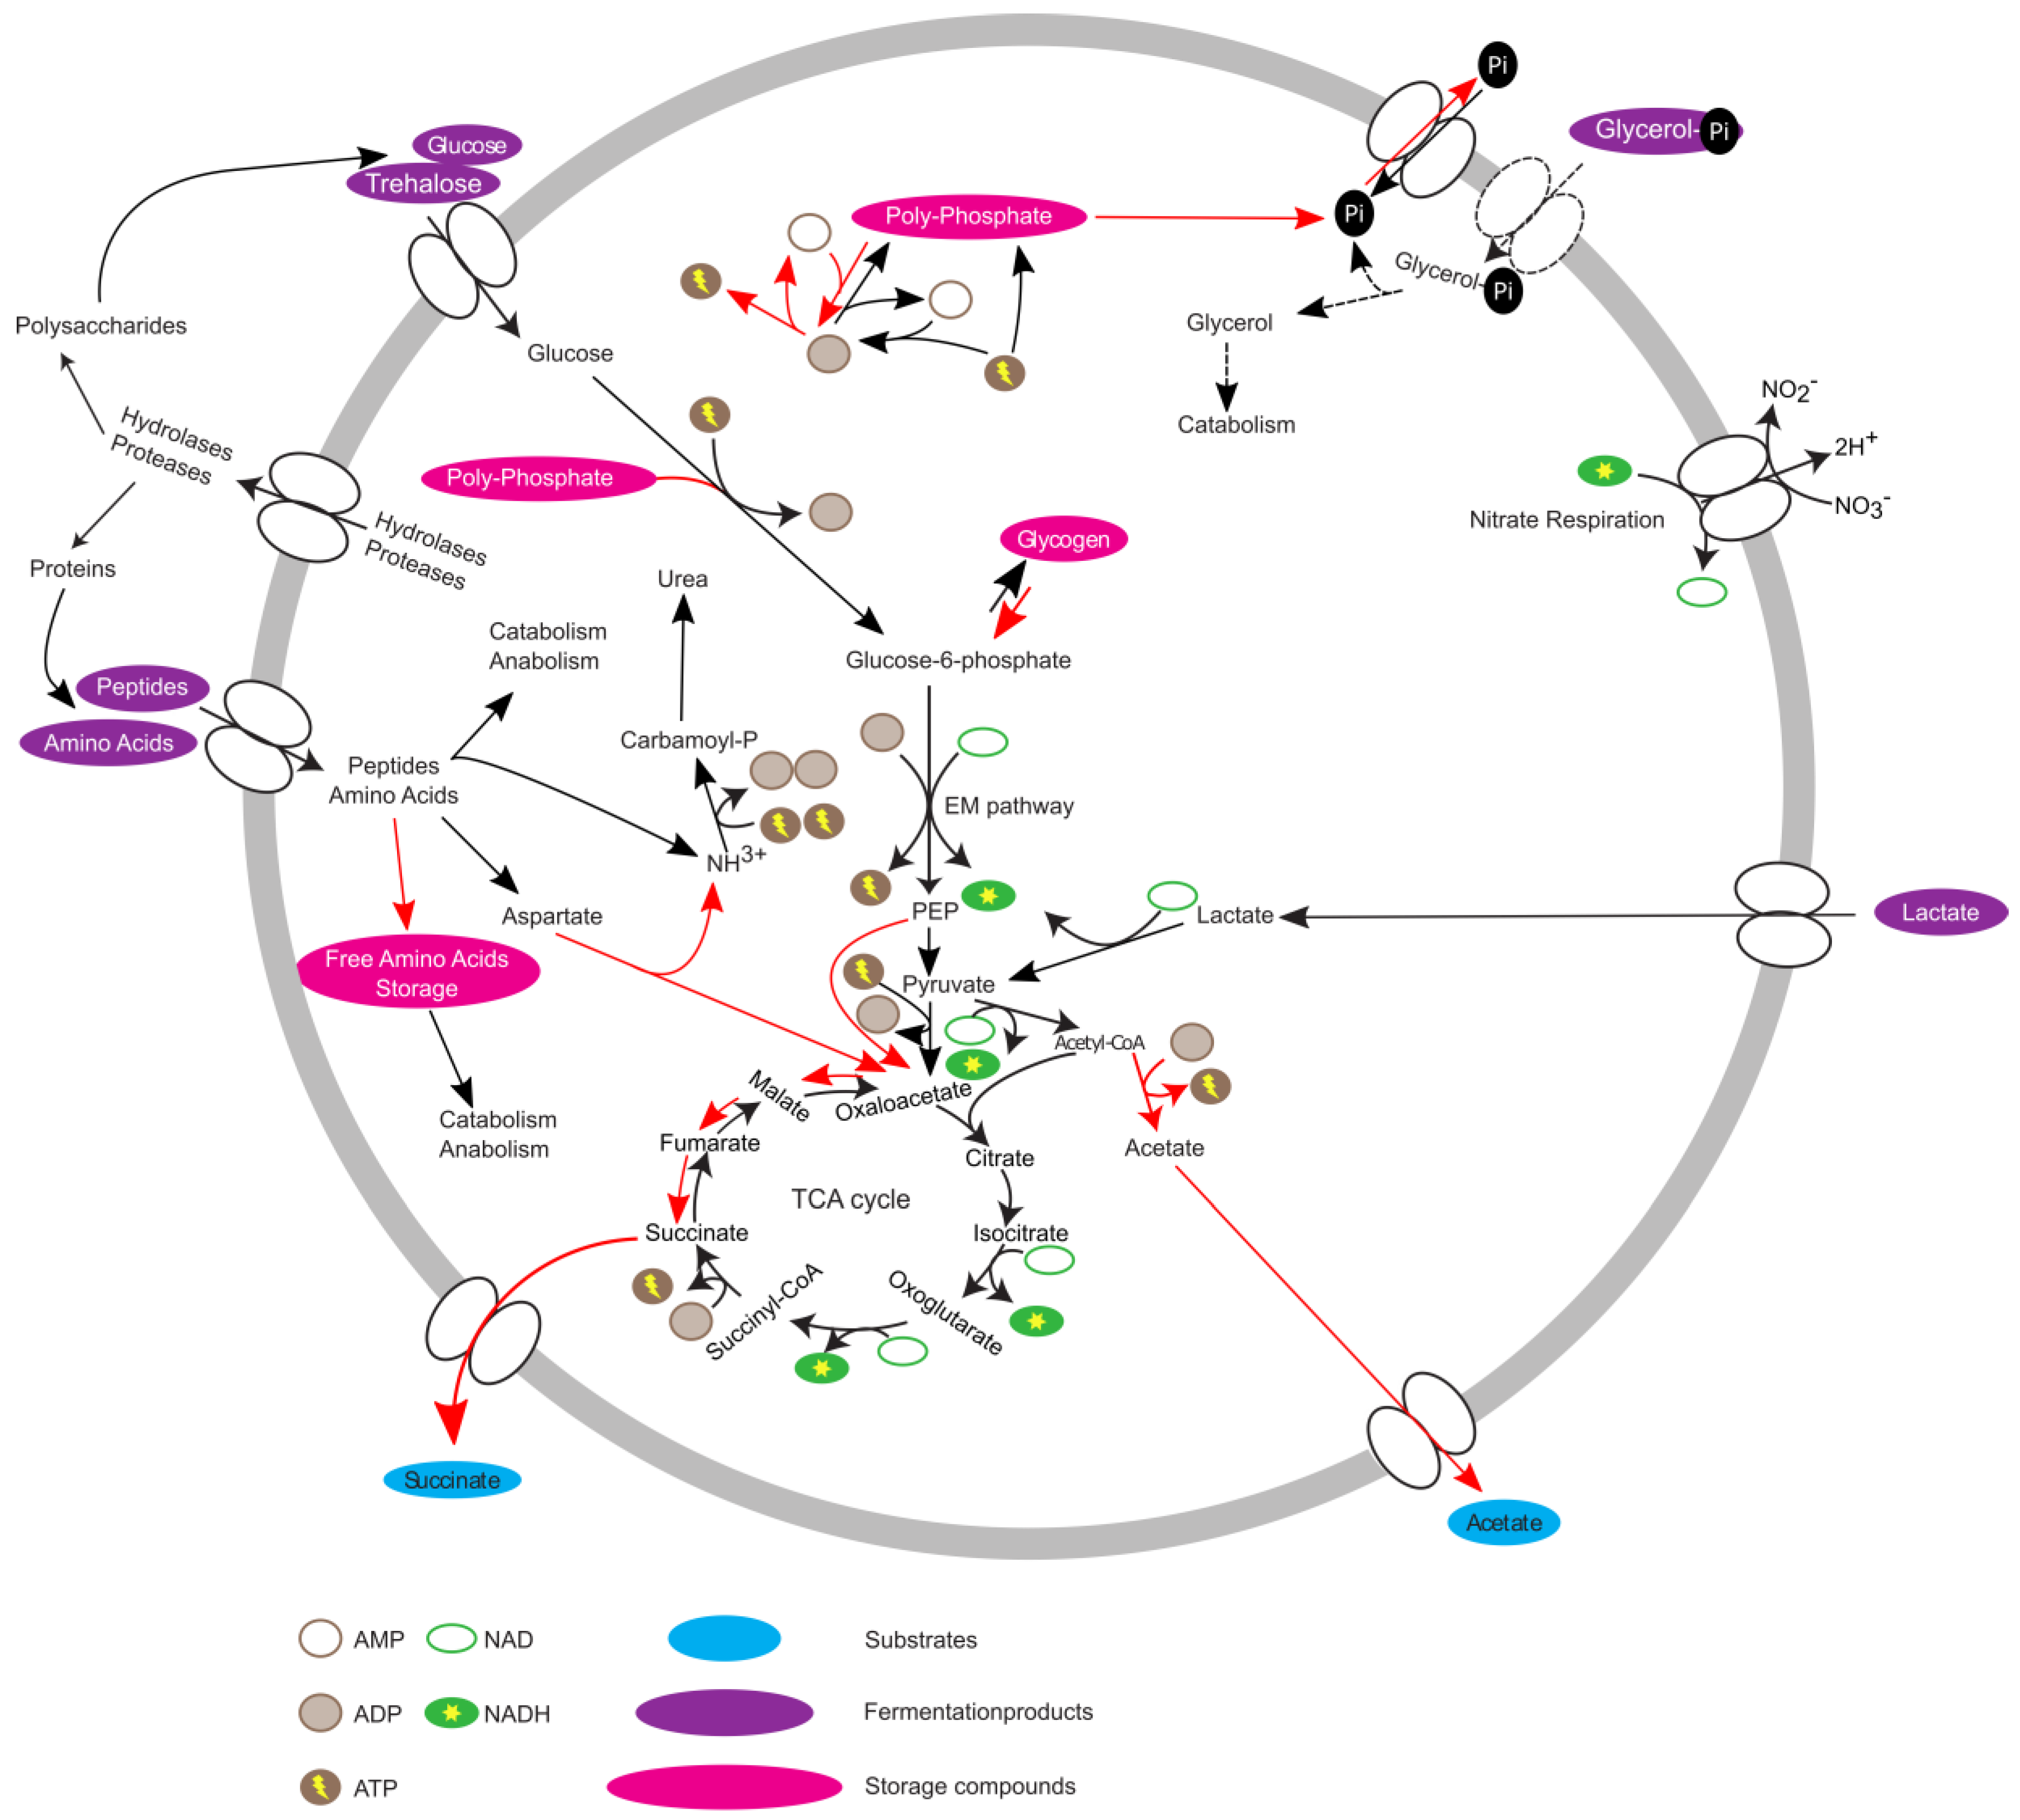
3.4. PAO-Metabolism in T. elongata

As a PAO, poly-P accumulation and degradation in T. elongata are of special interest. One central protein, which might be indicative of a PAO physiology, is the low-affinity Pit phosphate transporter [39]. In the well-described PAO Ca. Accumulibacter, Pit seems to drive VFA uptake in the anaerobic phase [40]. In accordance with previously described observations, the abundance of Pit did not show any significant change between oxic and anaerobic conditions for T. elongata. Neither did the high-affinity Pst system. A small (~1.3 fold), but significant, up-regulation in the anaerobic phase was observed for the polyphosphate kinase Ppk2. In contrast to Ppk1, which is widely conserved in bacteria [41] and did not show any significant change, Ppk2 regenerates GTP [42] as well as ATP [43] by utilizing poly-P, potentially providing additional energy during anaerobic conditions. Another poly-P utilizing enzyme which was slightly, but significantly, more abundant was the polyphosphate glucokinase PpgK. PpgK serves as an alternative hexokinase, which can phosphorylate glucose to glucose-6-phosphate by exploiting poly-P instead of ATP [44], thus, providing glucose-6-phosphate for glycolysis while preserving ATP. Apart from poly-P, glycogen is supposed to be the major element in Tetrasphaera’s PAO metabolism. Based on genomic and biochemical analyses, free amino acids and glycogen are the major C storage under anaerobic conditions [15,45]. A recent comprehensive in situ study using Raman microspectroscopy could not verify the accumulation of glycogen in Tetrasphaera [46]. In this study, several putative glycogen related enzymes for synthesis (GlgB, GlgC, N0E1Q7, N0E176) and degradation (GlgX, GlgP) were identified. Only N0E1Q7, a 1,4-alpha-glucan branching enzyme, showed a statistically significant, but very small (~1.2 fold) change in abundance under aerobic conditions. This change was contrary to the assumption that glycogen synthesis is required during anaerobic conditions and carbon storage in Tetrasphaera remains a question of interest.
Overall, the data suggest that T. elongata, in contrast to E. coli, is pre-adapted to anaerobic conditions with the pathways necessary for energy production at the ready. If oxygen as a terminal electron acceptor is unavailable, E. coli reacts by first using alternative electron acceptors like nitrate or fumarate and ultimately relies on fermentation. For most bacteria, the expression of the necessary genes is strictly hierarchically controlled [8,20] and adaptation needs time. The acquired data indicated that this is not the case for T. elongata and that it does indeed show a high level of metabolic robustness and readiness [47]. The theoretical advantage of being able to keep growing without major metabolic adaptations is enhanced under in situ conditions as T. elongata can store excessive amounts of poly-P for rapid supplementation of energy or accumulation of carbon substrates under anaerobic conditions [16]. The proteomic and metabolomic data helps to complement the existing metabolic model [15] (Figure 4), and gives an explanation for the abundance of Tetrasphaera. Although Ca. Accumulibacter and Tetrasphaera differ in central aspects of their metabolism and substrate preferences, they might follow a similar strategy. In that sense, no marked effects on relative protein abundances were observed across an EBPR cycle for Ca. Accumulibacter [48,49]. On the other hand, clear indications of regulation could be found on transcriptome level for Ca. Accumulibacter [50] which might not have been recognizable due to sample complexity and technical challenges. Unfortunately, transcription and translation do not always correlate [51] or are at least time-delayed [52] and conclusions can be challenging. Here, it was possible to observe the small but significant effects on a proteome level which might not be observable in complex in situ experiments. A question that arises is if the observations are entirely correct on the single-cell level, or if community level adaptations are responsible. T. elongata has a more pronounced tendency to aggregate compared to E. coli. This is an advantage in WWTPs, but a disadvantage for cultivation in the laboratory. This study was performed at low cell-densities, vigorous shaking in large flasks with little culture volume to reduce aggregation and its impact on physiology. Nevertheless, aggregates cannot be excluded which would lead to pre-adaptation of some T. elongata cells which enable constant growth in regularly changing environments. In favor of the results reflecting single-cell adaptations is that the nitrate reductase (alpha and beta subunits) did not change in abundance, which might be expected if all cells were challenged with oxygen limitation (instead of a minor fraction that was already expressing the enzyme) as was observed for E. coli. T. elongata’s behaviour is somewhat paradoxical. T. elongata preventively expresses unnecessary genes (e.g., nitrate reduction) while showing an economical metabolism with relatively low growth rates and without strong reactions to environmental stimuli (at least oxygen limitation). Of course, predicting in situ responses from in vitro data must be done carefully, but the observations and the concluded hypothesis fit in situ observations and will guide future enrichment reactor and in situ studies.

4. Concluding Remarks

As expected, E. coli grew initially faster than T. elongata, but T. elongata grew consistently during the 3 h anaerobic switch. T. elongata behaved more economically to produce similar amounts of biomass. Furthermore, T. elongata mainly used succinate fermentation as an electron sink, whereas E. coli produced succinate, acetate, formate/CO2, and high amounts of lactate. The proteomic data led to the identification of roughly 200 statistically significantly regulated proteins for both organisms, but the regulation in T. elongata resembled more a fine-tuning of already present pathways whereas E. coli underwent major rearrangements. Analyses of enriched pathways in E. coli showed a clear down-regulation of pathways necessary for translation and aerobic respiration as well as an up-regulation of anaerobic respiration, fermentation, and severe stress (probably due to lactic acid production) when challenged with oxygen limitation. At the same time, T. elongata already expressed necessary pathways under aerobic conditions, ignoring the classic hierarchical control of anaerobic gene expression and just fine-tuned its metabolism. While this strategy might not be suitable for many natural environments, it seems well suited for engineered habitats like WWTPs and their scheduled dynamics.

Supplementary Materials

The following are available online at https://www.mdpi.com/2227-7382/7/2/16/s1, Dataset S1: Proteomic results and analysis data.

Author Contributions

Protein preparation, data analysis, and visualization of results were carried out by F.-A.H. and M.S.D.; P.H.N., R.W., and F.-A.H. were responsible for conceptualization; writing of the draft was carried out by F.-A.H.; figures were prepared by F.-A.H. and M.S.D.; all authors were responsible for reviewing the manuscript.

Funding

This study was supported by the Danish Research Council for Independent Research (FNU), grant No. 4002-00455B.

Acknowledgments

The NMR laboratory at Aalborg University is supported by the Obelske Family Foundation, Spar Nord Foundation, and Carlsberg Foundation. We thank the PRIDE team for providing data deposition support.

Conflicts of Interest

The authors have declared no conflict of interest.

References

  1. van Loosdrecht, M.C.M.; Pot, M.A.; Heijnen, J.J. Importance of bacterial storage polymers in bioprocesses. Water Sci. Technol. 1997, 35. [Google Scholar] [CrossRef]
  2. Nielsen, P.H.; Saunders, A.M.; Hansen, A.A.; Larsen, P.; Nielsen, J.L. Microbial communities involved in enhanced biological phosphorus removal from wastewater--a model system in environmental biotechnology. Curr. Opin. Biotechnol. 2012, 23, 452–459. [Google Scholar] [CrossRef]
  3. Salman, V.; Bailey, J.V.; Teske, A. Phylogenetic and morphologic complexity of giant sulphur bacteria. Antonie Van Leeuwenhoek 2013, 104, 169–186. [Google Scholar] [CrossRef] [PubMed]
  4. López-Maury, L.; Marguerat, S.; Bähler, J. Tuning gene expression to changing environments: from rapid responses to evolutionary adaptation. Nat. Rev. Genet. 2008, 9, 583–593. [Google Scholar] [CrossRef]
  5. Merchant, S.S.; Helmann, J.D. Elemental economy: microbial strategies for optimizing growth in the face of nutrient limitation. Adv. Microb. Physiol. 2012, 60, 91–210. [Google Scholar]
  6. Rosen, R.; Ron, E.Z. Proteome analysis in the study of the bacterial heat-shock response. Mass Spectrom. Rev. 2002, 21, 244–265. [Google Scholar] [CrossRef] [PubMed]
  7. Cabiscol, E.; Tamarit, J.; Ros, J. Oxidative stress in bacteria and protein damage by reactive oxygen species. Int. Microbiol. 2000, 3, 3–8. [Google Scholar] [PubMed]
  8. Unden, G.; Becker, S.; Bongaerts, J.; Schirawski, J.; Six, S. Oxygen regulated gene expression in facultatively anaerobic bacteria. Antonie Van Leeuwenhoek 1994, 66, 3–22. [Google Scholar] [CrossRef] [PubMed]
  9. Seviour, R.J.; Nielsen, P.H. Microbial Ecology of Activated Sludge; IWA Publishing: London, UK, 2010; ISBN 9781843390329. [Google Scholar]
  10. Nielsen, P.H.; Mielczarek, A.T.; Kragelund, C.; Nielsen, J.L.; Saunders, A.M.; Kong, Y.; Hansen, A.A.; Vollertsen, J. A conceptual ecosystem model of microbial communities in enhanced biological phosphorus removal plants. Water Res. 2010, 44, 5070–5088. [Google Scholar] [CrossRef]
  11. Takiguchi, N.; Kishino, M.; Kuroda, A.; Kato, J.; Ohtake, H. A laboratory-scale test of anaerobic digestion and methane production after phosphorus recovery from waste activated sludge. J. Biosci. Bioeng. 2004, 97, 365–368. [Google Scholar] [CrossRef]
  12. Nyberg, U.; Aspegren, H.; Andersson, B.; Jorgensen, P.E.; Jansen, J. la C. Circulation of phosphorus in a system with biological p-removal and sludge digestion. Water Sci. Technol. 1994, 30, 293–302. [Google Scholar] [CrossRef]
  13. García Martín, H.; Ivanova, N.; Kunin, V.; Warnecke, F.; Barry, K.W.; McHardy, A.C.; Yeates, C.; He, S.; Salamov, A.A.; Szeto, E.; et al. Metagenomic analysis of two enhanced biological phosphorus removal (EBPR) sludge communities. Nat. Biotechnol. 2006, 24, 1263–1269. [Google Scholar] [CrossRef]
  14. McMahon, K.D.; Read, E.K. Microbial contributions to phosphorus cycling in eutrophic lakes and wastewater. Annu. Rev. Microbiol. 2013, 67, 199–219. [Google Scholar] [CrossRef] [PubMed]
  15. Kristiansen, R.; Nguyen, H.T.T.; Saunders, A.M.; Nielsen, J.L.; Wimmer, R.; Le, V.Q.; McIlroy, S.J.; Petrovski, S.; Seviour, R.J.; Calteau, A.; et al. A metabolic model for members of the genus Tetrasphaera involved in enhanced biological phosphorus removal. ISME J. 2013, 7, 543–554. [Google Scholar] [CrossRef]
  16. Nguyen, H.T.T.; Kristiansen, R.; Vestergaard, M.; Wimmer, R.; Nielsen, P.H. Intracellular accumulation of glycine in polyphosphate-accumulating organisms in activated sludge, a novel storage mechanism under dynamic anaerobic-aerobic conditions. Appl. Environ. Microbiol. 2015, 81, 4809–4818. [Google Scholar] [CrossRef] [PubMed]
  17. Nguyen, H.T.T.; Le, V.Q.; Hansen, A.A.; Nielsen, J.L.; Nielsen, P.H. High diversity and abundance of putative polyphosphate-accumulating Tetrasphaera-related bacteria in activated sludge systems. FEMS Microbiol. Ecol. 2011, 76, 256–267. [Google Scholar] [CrossRef] [PubMed]
  18. McIlroy, S.J.; Saunders, A.M.; Albertsen, M.; Nierychlo, M.; McIlroy, B.; Hansen, A.A.; Karst, S.M.; Nielsen, J.L.; Nielsen, P.H. MiDAS: the field guide to the microbes of activated sludge. Database 2015, 2015, bav062. [Google Scholar] [CrossRef] [PubMed]
  19. Stokholm-Bjerregaard, M.; McIlroy, S.J.; Nierychlo, M.; Karst, S.M.; Albertsen, M.; Nielsen, P.H. A critical assessment of the microorganisms proposed to be important to enhanced biological phosphorus removal in full-scale wastewater treatment systems. Front. Microbiol. 2017, 8, 718. [Google Scholar] [CrossRef]
  20. Goh, E.-B.; Bledsoe, P.J.; Chen, L.-L.; Gyaneshwar, P.; Stewart, V.; Igo, M.M. Hierarchical control of anaerobic gene expression in Escherichia coli K-12: the nitrate-responsive NarX-NarL regulatory system represses synthesis of the fumarate-responsive DcuS-DcuR regulatory system. J. Bacteriol. 2005, 187, 4890–4899. [Google Scholar] [CrossRef] [PubMed]
  21. Herbst, F.-A.; Danielsen, H.N.; Wimmer, R.; Nielsen, P.H.; Dueholm, M.S. Label-free quantification reveals major proteomic changes in Pseudomonas putida F1 during the exponential growth phase. Proteomics 2015, 15, 3244–3252. [Google Scholar] [CrossRef] [PubMed]
  22. Berger, S.T.; Ahmed, S.; Muntel, J.; Cuevas Polo, N.; Bachur, R.; Kentsis, A.; Steen, J.; Steen, H. MStern blotting–Hhgh throughput polyvinylidene fluoride (PVDF) membrane-based proteomic sample preparation for 96-well plates. Mol. Cell. Proteomics 2015, 14, 2814–2823. [Google Scholar] [CrossRef]
  23. Cox, J.; Mann, M. MaxQuant enables high peptide identification rates, individualized p.p.b.-range mass accuracies and proteome-wide protein quantification. Nat. Biotechnol. 2008, 26, 1367–1372. [Google Scholar] [CrossRef]
  24. Uniprot Consortium Activities at the Universal Protein Resource (UniProt). Nucleic Acids Res. 2014, 42, D191–D198. [CrossRef]
  25. Tyanova, S.; Temu, T.; Sinitcyn, P.; Carlson, A.; Hein, M.Y.; Geiger, T.; Mann, M.; Cox, J. The Perseus computational platform for comprehensive analysis of (prote)omics data. Nat. Methods 2016. [Google Scholar] [CrossRef]
  26. R Core Team. R: A Language and Environment for Statistical Computing; R Foundation for Statistical Computing: Vienna, Austria, 2014. [Google Scholar]
  27. Wickham, H. ggplot2: Elegant Graphics for Data Analysis; Springer: New York, NY, USA, 2009; ISBN 978-0-387-98140-6. [Google Scholar]
  28. Vizcaíno, J.A.; Côté, R.G.; Csordas, A.; Dianes, J.A.; Fabregat, A.; Foster, J.M.; Griss, J.; Alpi, E.; Birim, M.; Contell, J.; et al. The PRoteomics IDEntifications (PRIDE) database and associated tools: Status in 2013. Nucleic Acids Res. 2013, 41, D1063–D1069. [Google Scholar] [CrossRef] [PubMed]
  29. Tatusov, R.L.; Galperin, M.Y.; Natale, D.A.; Koonin, E.V. The COG database: A tool for genome-scale analysis of protein functions and evolution. Nucleic Acids Res. 2000, 28, 33–36. [Google Scholar] [CrossRef] [PubMed]
  30. Redder, P.; Hausmann, S.; Khemici, V.; Yasrebi, H.; Linder, P. Bacterial versatility requires DEAD-box RNA helicases. FEMS Microbiol. Rev. 2015, 39, 392–412. [Google Scholar] [CrossRef]
  31. Laanbroek, H.J.; Lambers, J.T.; de Vos, W.M.; Veldkamp, H. L-Aspartate fermentation by a free-living Campylobacter species. Arch. Microbiol. 1978, 117, 109–114. [Google Scholar] [CrossRef]
  32. Crow, V.L. Metabolism of Aspartate by Propionibacterium freudenreichii subsp. shermanii: Effect on Lactate Fermentation. Appl. Environ. Microbiol. 1986, 52, 359–365. [Google Scholar]
  33. Mendz, G.L.; Hazell, S.L. Aminoacid utilization by Helicobacter pylori. Int. J. Biochem. Cell Biol. 1995, 27, 1085–1093. [Google Scholar] [CrossRef]
  34. Camarasa, C.; Grivet, J.-P.; Dequin, S. Investigation by 13C-NMR and tricarboxylic acid (TCA) deletion mutant analysis of pathways for succinate formation in Saccharomyces cerevisiae during anaerobic fermentation. Microbiology 2003, 149, 2669–2678. [Google Scholar] [CrossRef]
  35. Cecchini, G.; Schröder, I.; Gunsalus, R.P.; Maklashina, E. Succinate dehydrogenase and fumarate reductase from Escherichia coli. Biochim. Biophys. Acta - Bioenerg. 2002, 1553, 140–157. [Google Scholar] [CrossRef]
  36. Schnorpfeil, M.; Janausch, I.G.; Biel, S.; Kröger, A.; Unden, G. Generation of a proton potential by succinate dehydrogenase of Bacillus subtilis functioning as a fumarate reductase. Eur. J. Biochem. 2001, 268, 3069–3074. [Google Scholar] [CrossRef]
  37. Harden, M.M.; He, A.; Creamer, K.; Clark, M.W.; Hamdallah, I.; Martinez, K.A.; Kresslein, R.L.; Bush, S.P.; Slonczewski, J.L. Acid-adapted strains of Escherichia coli K-12 obtained by experimental evolution. Appl. Environ. Microbiol. 2015, 81, 1932–1941. [Google Scholar] [CrossRef] [PubMed]
  38. Iuchi, S.; Lin, E.C.C. Adaptation of Escherichia coli to redox environments by gene expression. Mol. Microbiol. 1993, 9, 9–15. [Google Scholar] [CrossRef] [PubMed]
  39. McIlroy, S.J.; Albertsen, M.; Andresen, E.K.; Saunders, A.M.; Kristiansen, R.; Stokholm-Bjerregaard, M.; Nielsen, K.L.; Nielsen, P.H. ‘Candidatus Competibacter’-lineage genomes retrieved from metagenomes reveal functional metabolic diversity. ISME J. 2014, 8, 613–624. [Google Scholar] [PubMed]
  40. Saunders, A.M.; Mabbett, A.N.; McEwan, A.G.; Blackall, L.L. Proton motive force generation from stored polymers for the uptake of acetate under anaerobic conditions. FEMS Microbiol. Lett. 2007, 274, 245–251. [Google Scholar] [CrossRef] [PubMed]
  41. Zhang, H.; Ishige, K.; Kornberg, A. A polyphosphate kinase (PPK2) widely conserved in bacteria. Proc. Natl. Acad. Sci. 2002, 99, 16678–16683. [Google Scholar] [CrossRef]
  42. Ishige, K.; Zhang, H.; Kornberg, A. Polyphosphate kinase (PPK2), a potent, polyphosphate-driven generator of GTP. Proc. Natl. Acad. Sci. 2002, 99, 16684–16688. [Google Scholar] [CrossRef] [PubMed]
  43. Nocek, B.; Kochinyan, S.; Proudfoot, M.; Brown, G.; Evdokimova, E.; Osipiuk, J.; Edwards, A.M.; Savchenko, A.; Joachimiak, A.; Yakunin, A.F. Polyphosphate-dependent synthesis of ATP and ADP by the family-2 polyphosphate kinases in bacteria. Proc. Natl. Acad. Sci. 2008, 105, 17730–17735. [Google Scholar] [CrossRef]
  44. Szymona, M.; Ostrowski, W. Inorganic polyphosphate glucokinase of Mycobacterium phlei. Biochim. Biophys. Acta 1964, 85, 283–295. [Google Scholar] [CrossRef]
  45. Marques, R.; Santos, J.; Nguyen, H.; Carvalho, G.; Noronha, J.P.; Nielsen, P.H.; Reis, M.A.M.; Oehmen, A. Metabolism and ecological niche of Tetrasphaera and Ca. Accumulibacter in enhanced biological phosphorus removal. Water Res. 2017, 122, 159–171. [Google Scholar] [CrossRef]
  46. Fernando, E.Y.; McIlroy, S.J.; Nierychlo, M.; Herbst, F.-A.; Petriglieri, F.; Schmid, M.C.; Wagner, M.; Nielsen, J.L.; Nielsen, P.H. Resolving the individual contribution of key microbial populations to enhanced biological phosphorus removal with Raman–FISH. ISME J. 2019, 1. [Google Scholar] [CrossRef] [PubMed]
  47. Félix, M.-A.; Barkoulas, M. Pervasive robustness in biological systems. Nat. Rev. Genet. 2015, 16, 483–496. [Google Scholar] [CrossRef] [PubMed]
  48. Wilmes, P.; Andersson, A.F.; Lefsrud, M.G.; Wexler, M.; Shah, M.; Zhang, B.; Hettich, R.L.; Bond, P.L.; VerBerkmoes, N.C.; Banfield, J.F. Community proteogenomics highlights microbial strain-variant protein expression within activated sludge performing enhanced biological phosphorus removal. ISME J. 2008, 2, 853–864. [Google Scholar] [CrossRef] [PubMed]
  49. Wexler, M.; Richardson, D.J.; Bond, P.L. Radiolabelled proteomics to determine differential functioning of Accumulibacter during the anaerobic and aerobic phases of a bioreactor operating for enhanced biological phosphorus removal. Environ. Microbiol. 2009, 11, 3029–3044. [Google Scholar] [PubMed]
  50. Oyserman, B.O.; Noguera, D.R.; del Rio, T.G.; Tringe, S.G.; McMahon, K.D. Metatranscriptomic insights on gene expression and regulatory controls in Candidatus Accumulibacter phosphatis. ISME J. 2016, 10, 810–822. [Google Scholar] [CrossRef] [PubMed]
  51. Taniguchi, Y.; Choi, P.J.; Li, G.-W.; Chen, H.; Babu, M.; Hearn, J.; Emili, A.; Xie, X.S. Quantifying E. coli proteome and transcriptome with single-molecule sensitivity in single cells. Science 2010, 329, 533–538. [Google Scholar] [CrossRef] [PubMed]
  52. Gedeon, T.; Bokes, P. Delayed protein synthesis reduces the correlation between mRNA and protein fluctuations. Biophys. J. 2012, 103, 377–385. [Google Scholar] [CrossRef]
Figure 1. NMR-quantified exometabolites. (a) Carbohydrates, (b) fermentative products, and (c) amino acids in the initial medium as well as for the end of the aerobic and anoxic cultivations of E. coli and T. elongata. Error bars represent standard deviation of quantified metabolite levels (n = 4).
Proteomes 07 00016 g001
Figure 2. Overview of differentially expressed proteins for the end of the aerobic and anoxic cultivations of E. coli and T. elongata. (a) Volcano plot for quantified (after imputation) proteins from T. elongata and E. coli. Significance testing was corrected for multiple hypotheses testing at an FDR of 5%. Vertical red lines indicate a twofold change in abundance. The horizontal line reflects a p-value threshold of 0.05. (b) Classification of differentially expressed proteins based on COG functional classes. One-letter abbreviations for the functional categories: C, energy production and conversion; D, cell division and chromosome partitioning; E, amino acid metabolism and transport; F, nucleotide metabolism and transport; G, carbohydrate metabolism and transport; H, coenzyme metabolism; I, lipid metabolism; J, translation, including ribosome structure and biogenesis; K, transcription; L, replication, recombination and repair; M, cell wall structure and biogenesis and outer membrane; N, secretion, motility and chemotaxis; O, molecular chaperones and related functions; P, inorganic ion transport and metabolism; R, general functional prediction only; T, signal transduction; S and “-“, no functional prediction.
Proteomes 07 00016 g002
Figure 3. Normalized abundance of selected proteins for the end of the aerobic and anoxic cultivations of E. coli and T. elongata. The estimated abundance of each protein in each organism is based on label-free quantification (LFQ) values, normalized based on the average abundance of that protein across samples. Error bars represent standard deviation of protein abundance levels (n = 4).
Proteomes 07 00016 g003
Figure 4. Updated metabolic model of Tetrasphaera elongata str. Lp2. Red arrows indicate increased activity under anaerobic conditions.
Proteomes 07 00016 g004
Table 1. Growth of E. coli and T. elongata after shift to anoxic conditions. Growth was determined by optical density (OD) at 600 nm and protein concentration after cell lysis. The mean and standard deviation of four measurement is presented.
OD600nmProtein Concentration
E. coliT. elongataE. coliT. elongata
Aerobic phase (t = 0 h)0.183 ± 0.003 0.174 ± 0.026 107.8 ± 0.8 µg/mL 78.4 ± 3.1 µg/mL
Anoxic phase (t = 3 h)0.214 ± 0.009 0.209 ± 0.032 114.0 ± 5.1 µg/mL88.7 ± 1.8 µg/mL
Absolute increase0.031 ± 0.009 0.036 ± 0.015 6.2 ± 5.3 µg/µL10.3 ± 3.8 µg/µL
Relative increase16.8 ± 4.8%20.7 ± 9.2%5.8 ± 5.0%13.2 ± 5.3%

