Proteases Shape the Chlamydomonas Secretome: Comparison to Classical Neuropeptide Processing Machinery

 , and
, and
Abstract
1. Introduction
2. Material and Methods
2.1. Strains and Growth Conditions
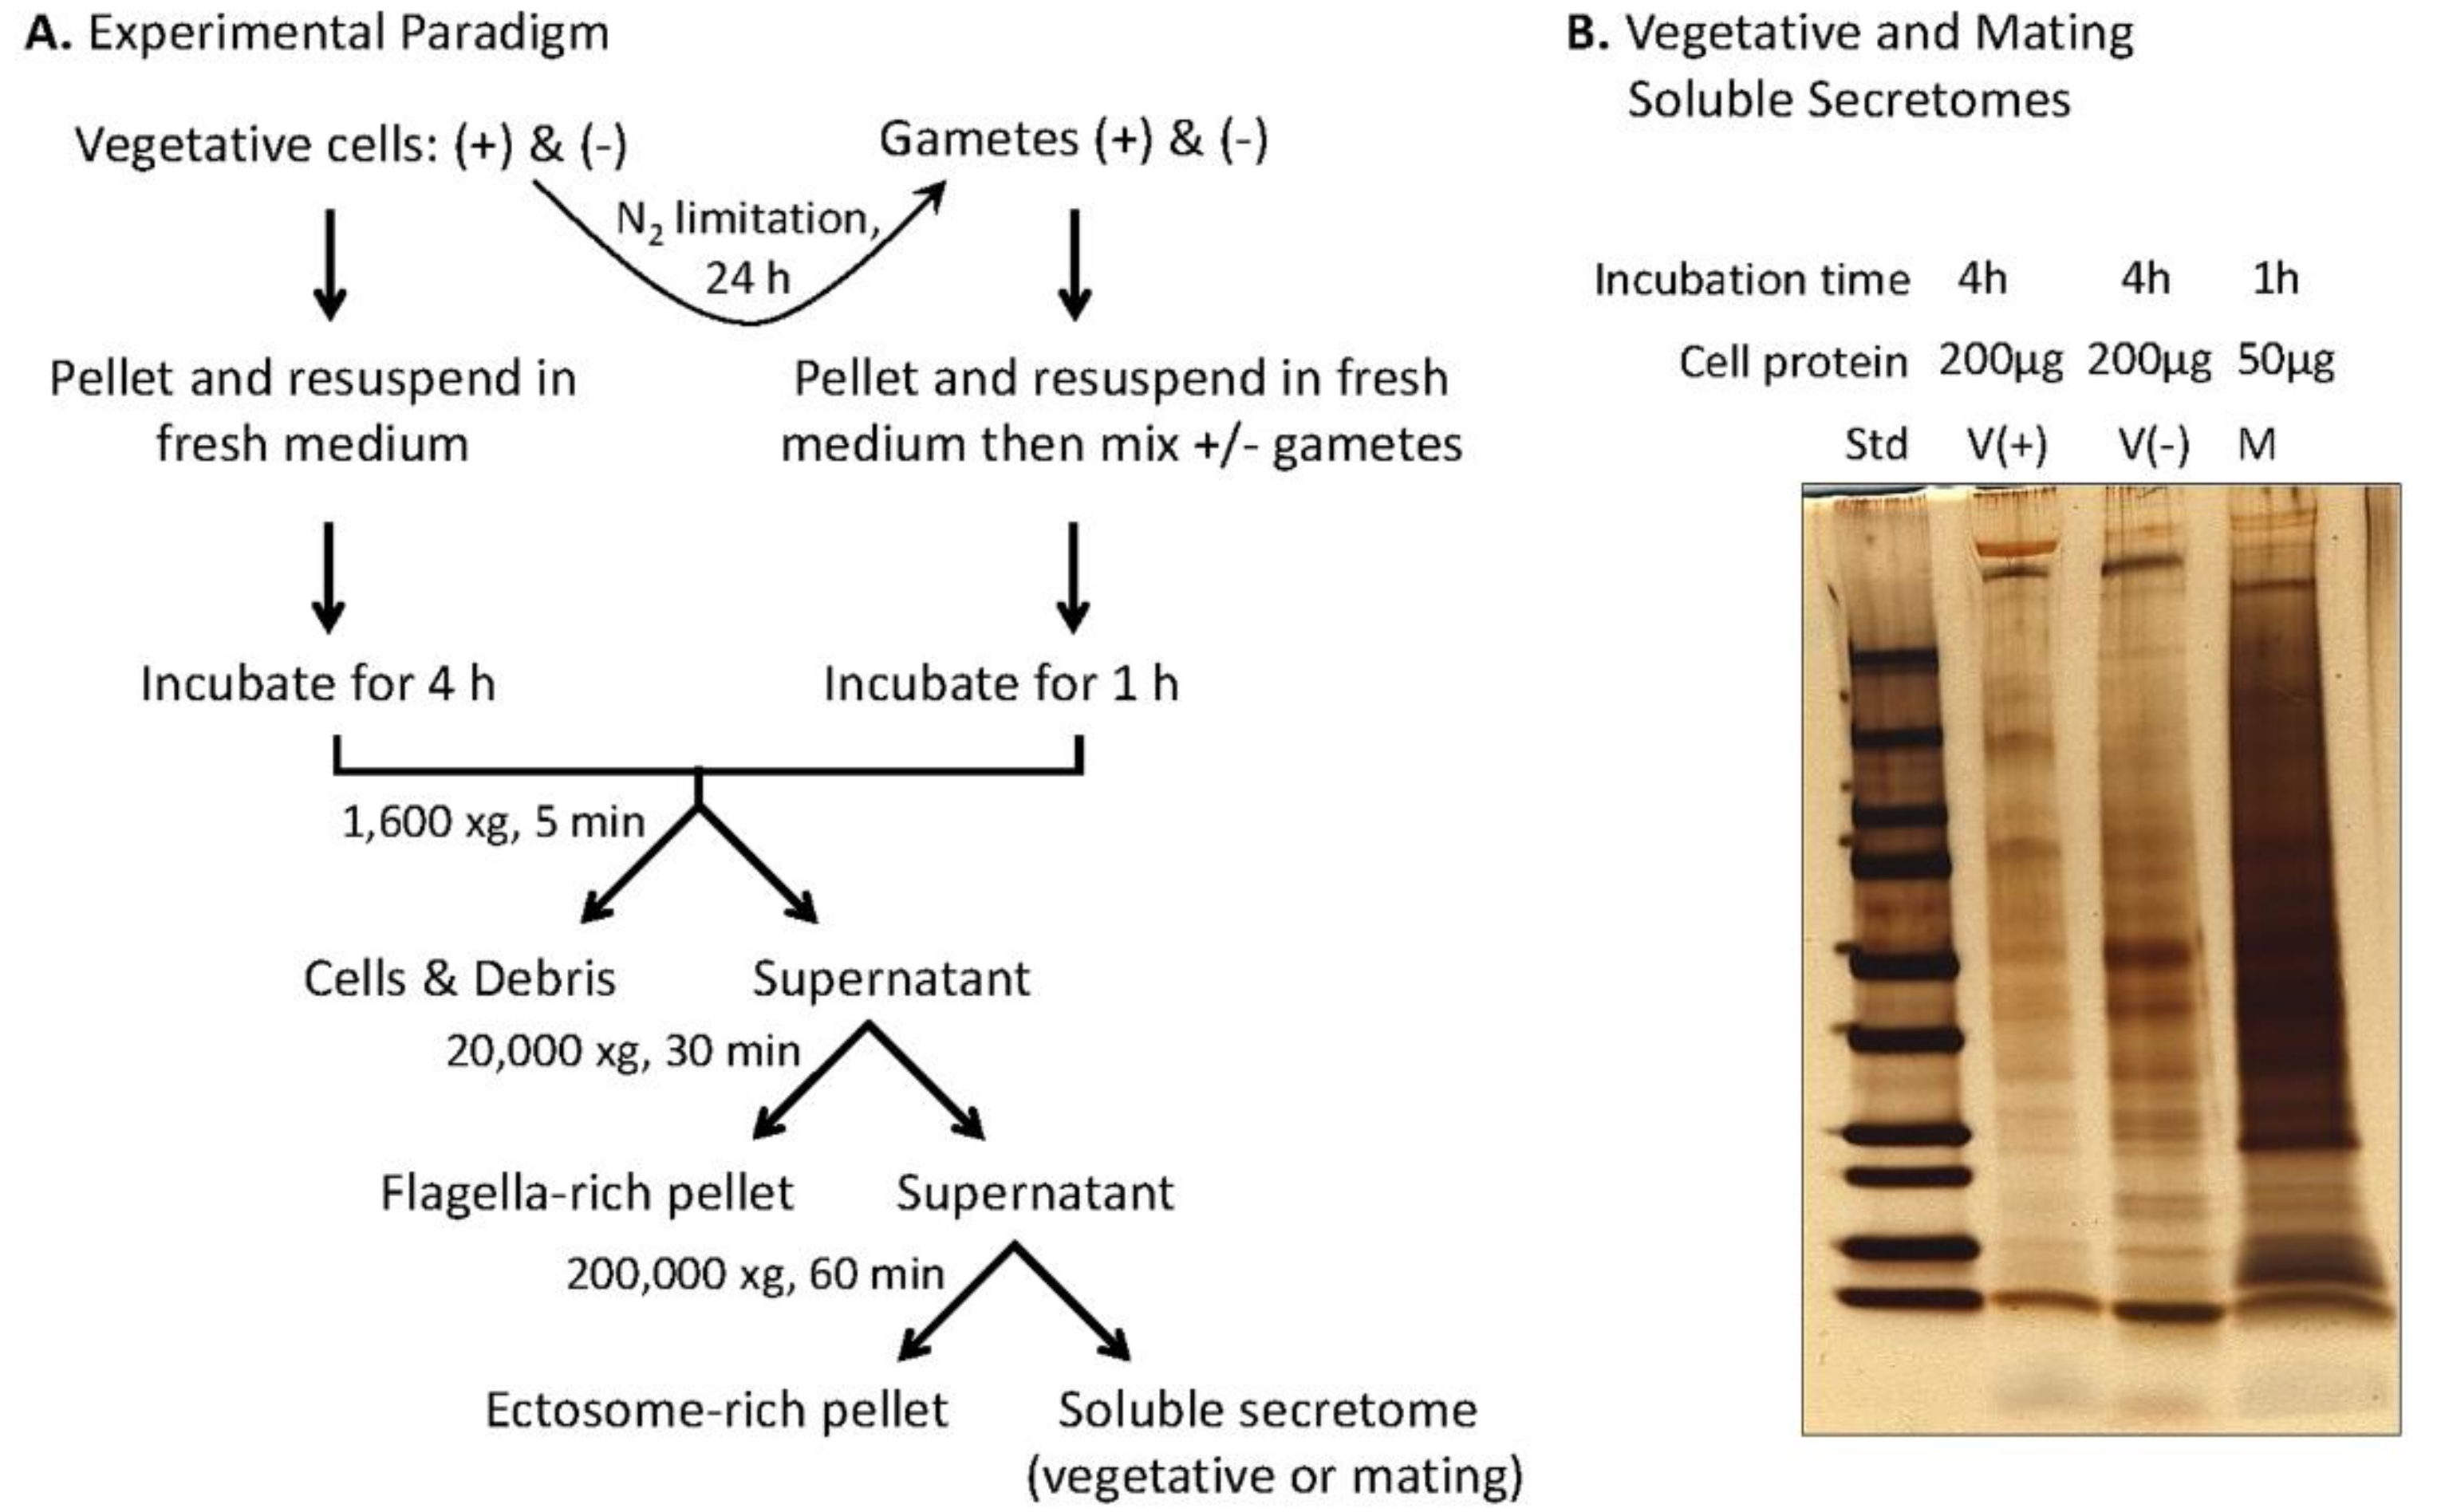
2.2. Preparation of Soluble Mating Secretome
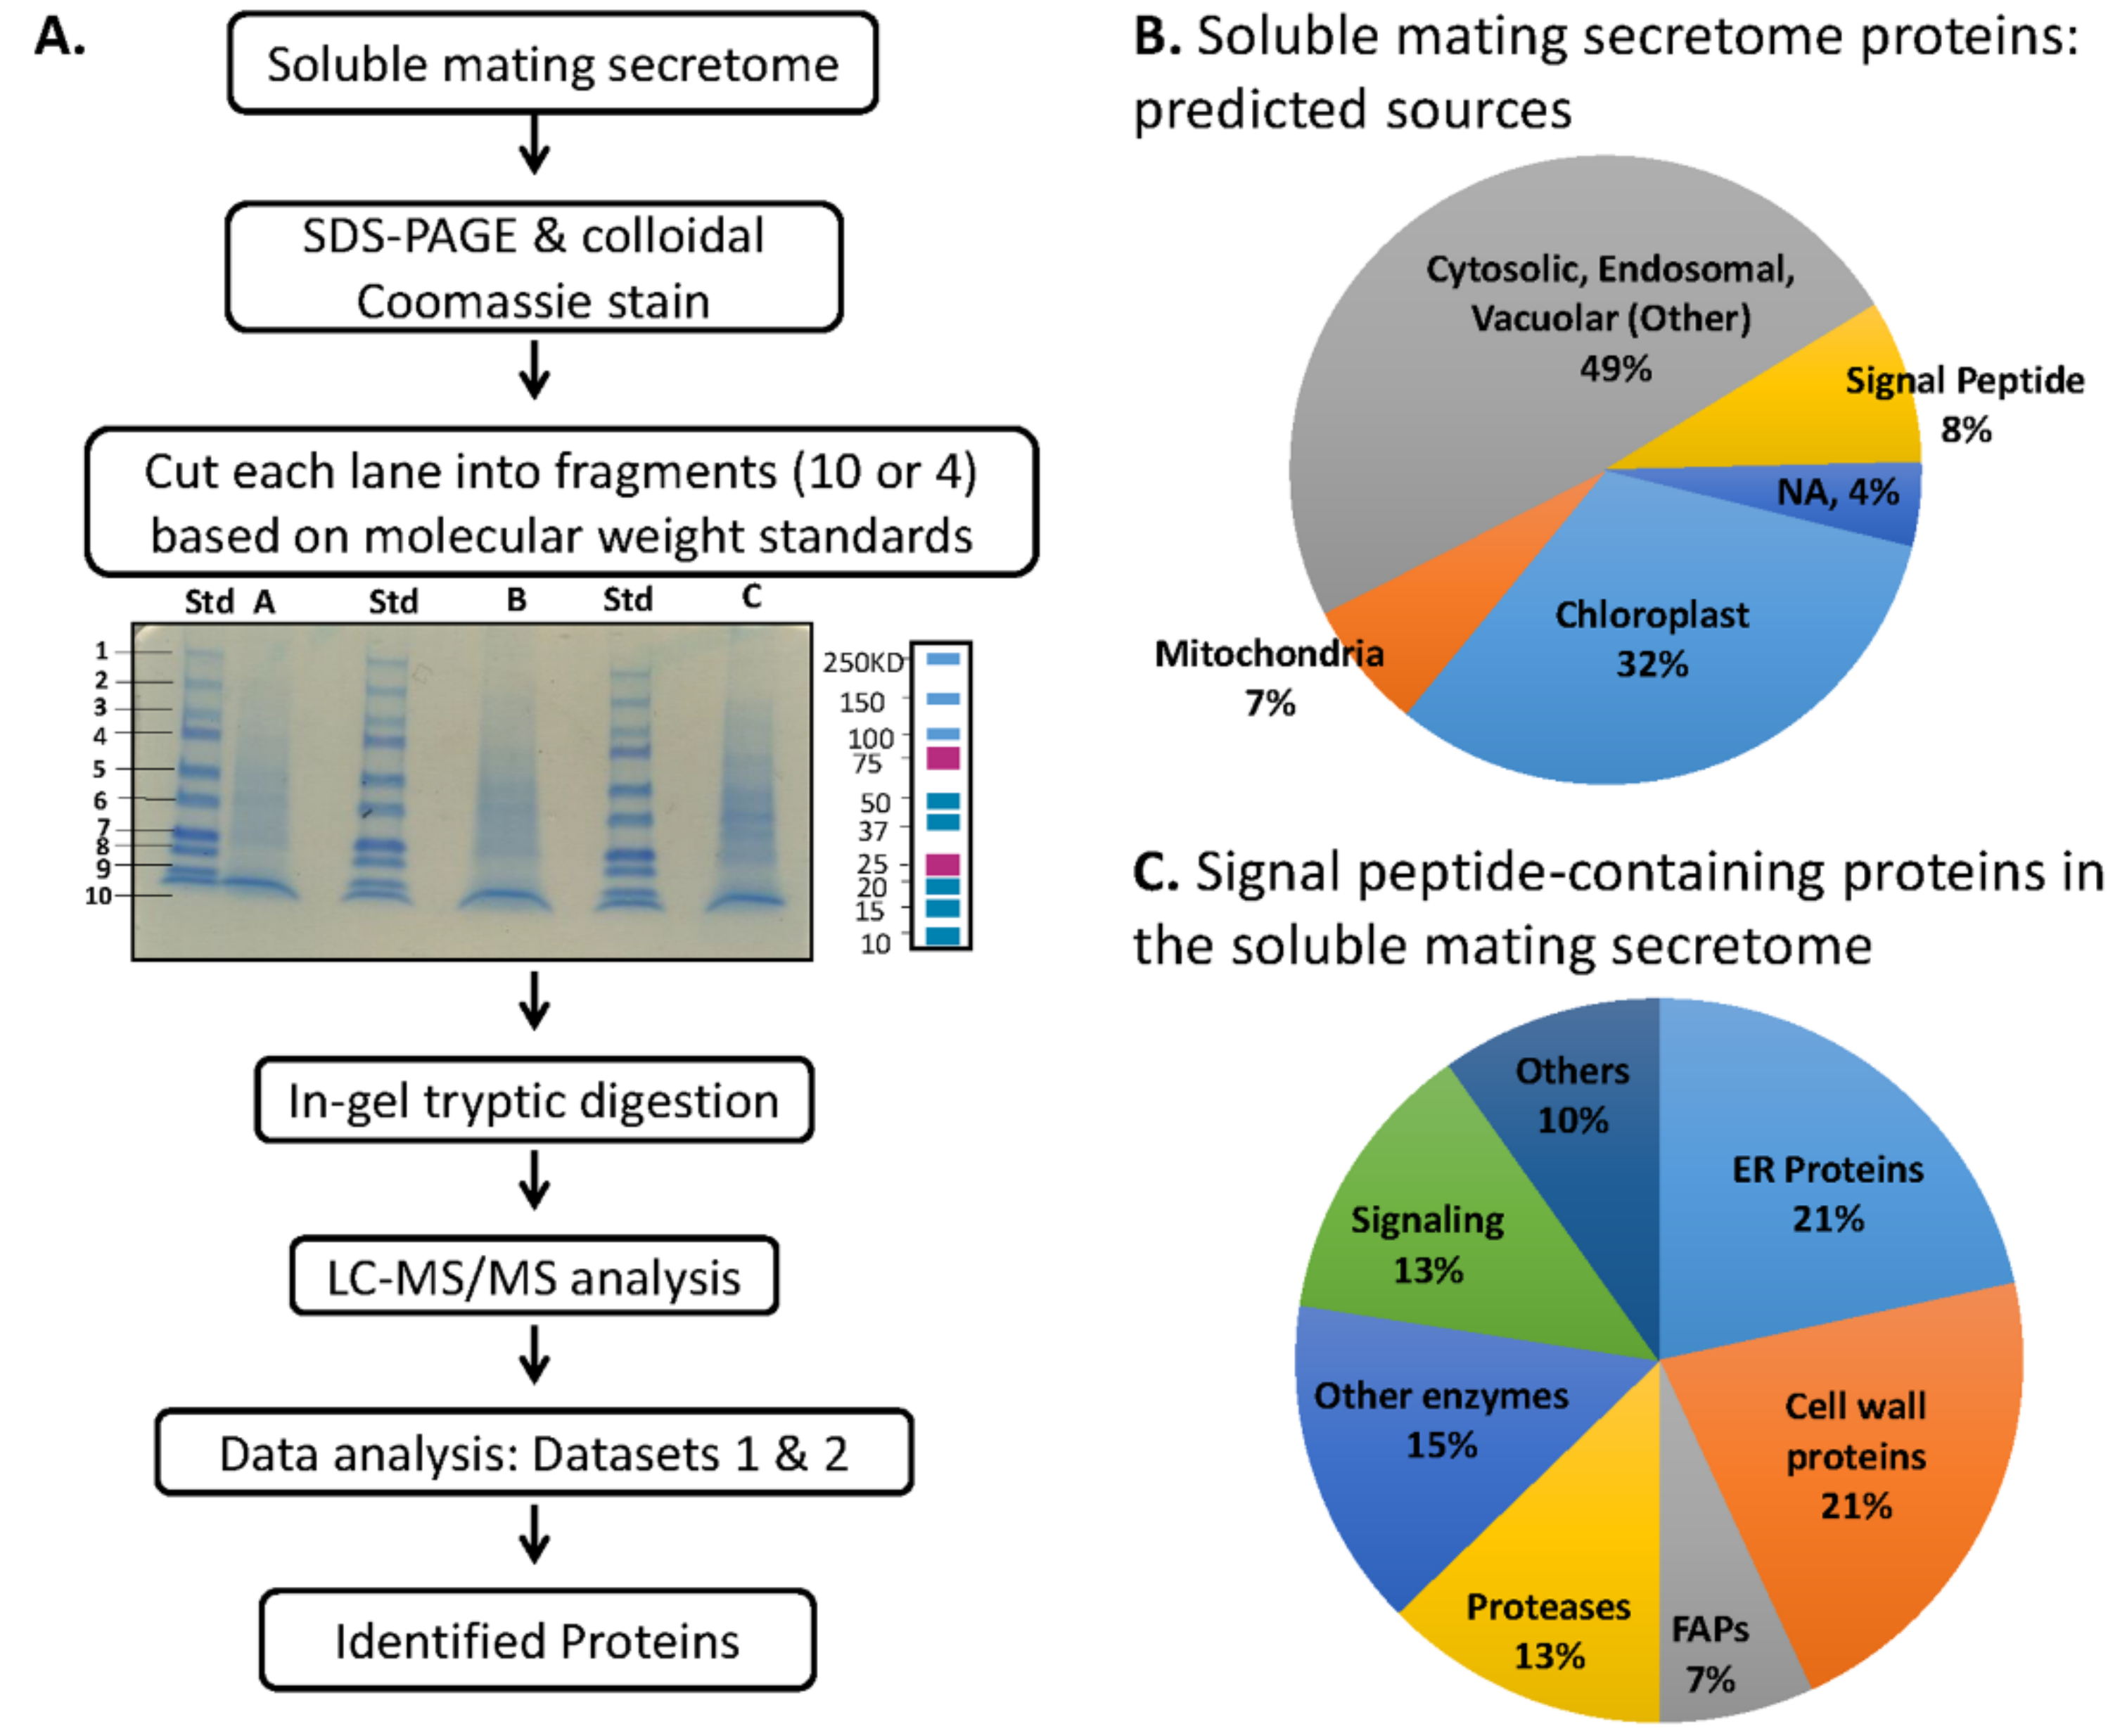
2.3. Fractionation for Mass Spectroscopy
2.4. Preparation of Vegetative Secretome
2.5. Mass Spectrometry
2.6. Bioinformatic Analyses
3. Results
3.1. The C. reinhardtii Genome Encodes Multiple Proteins with the Characteristics of Neuropeptide Precursors
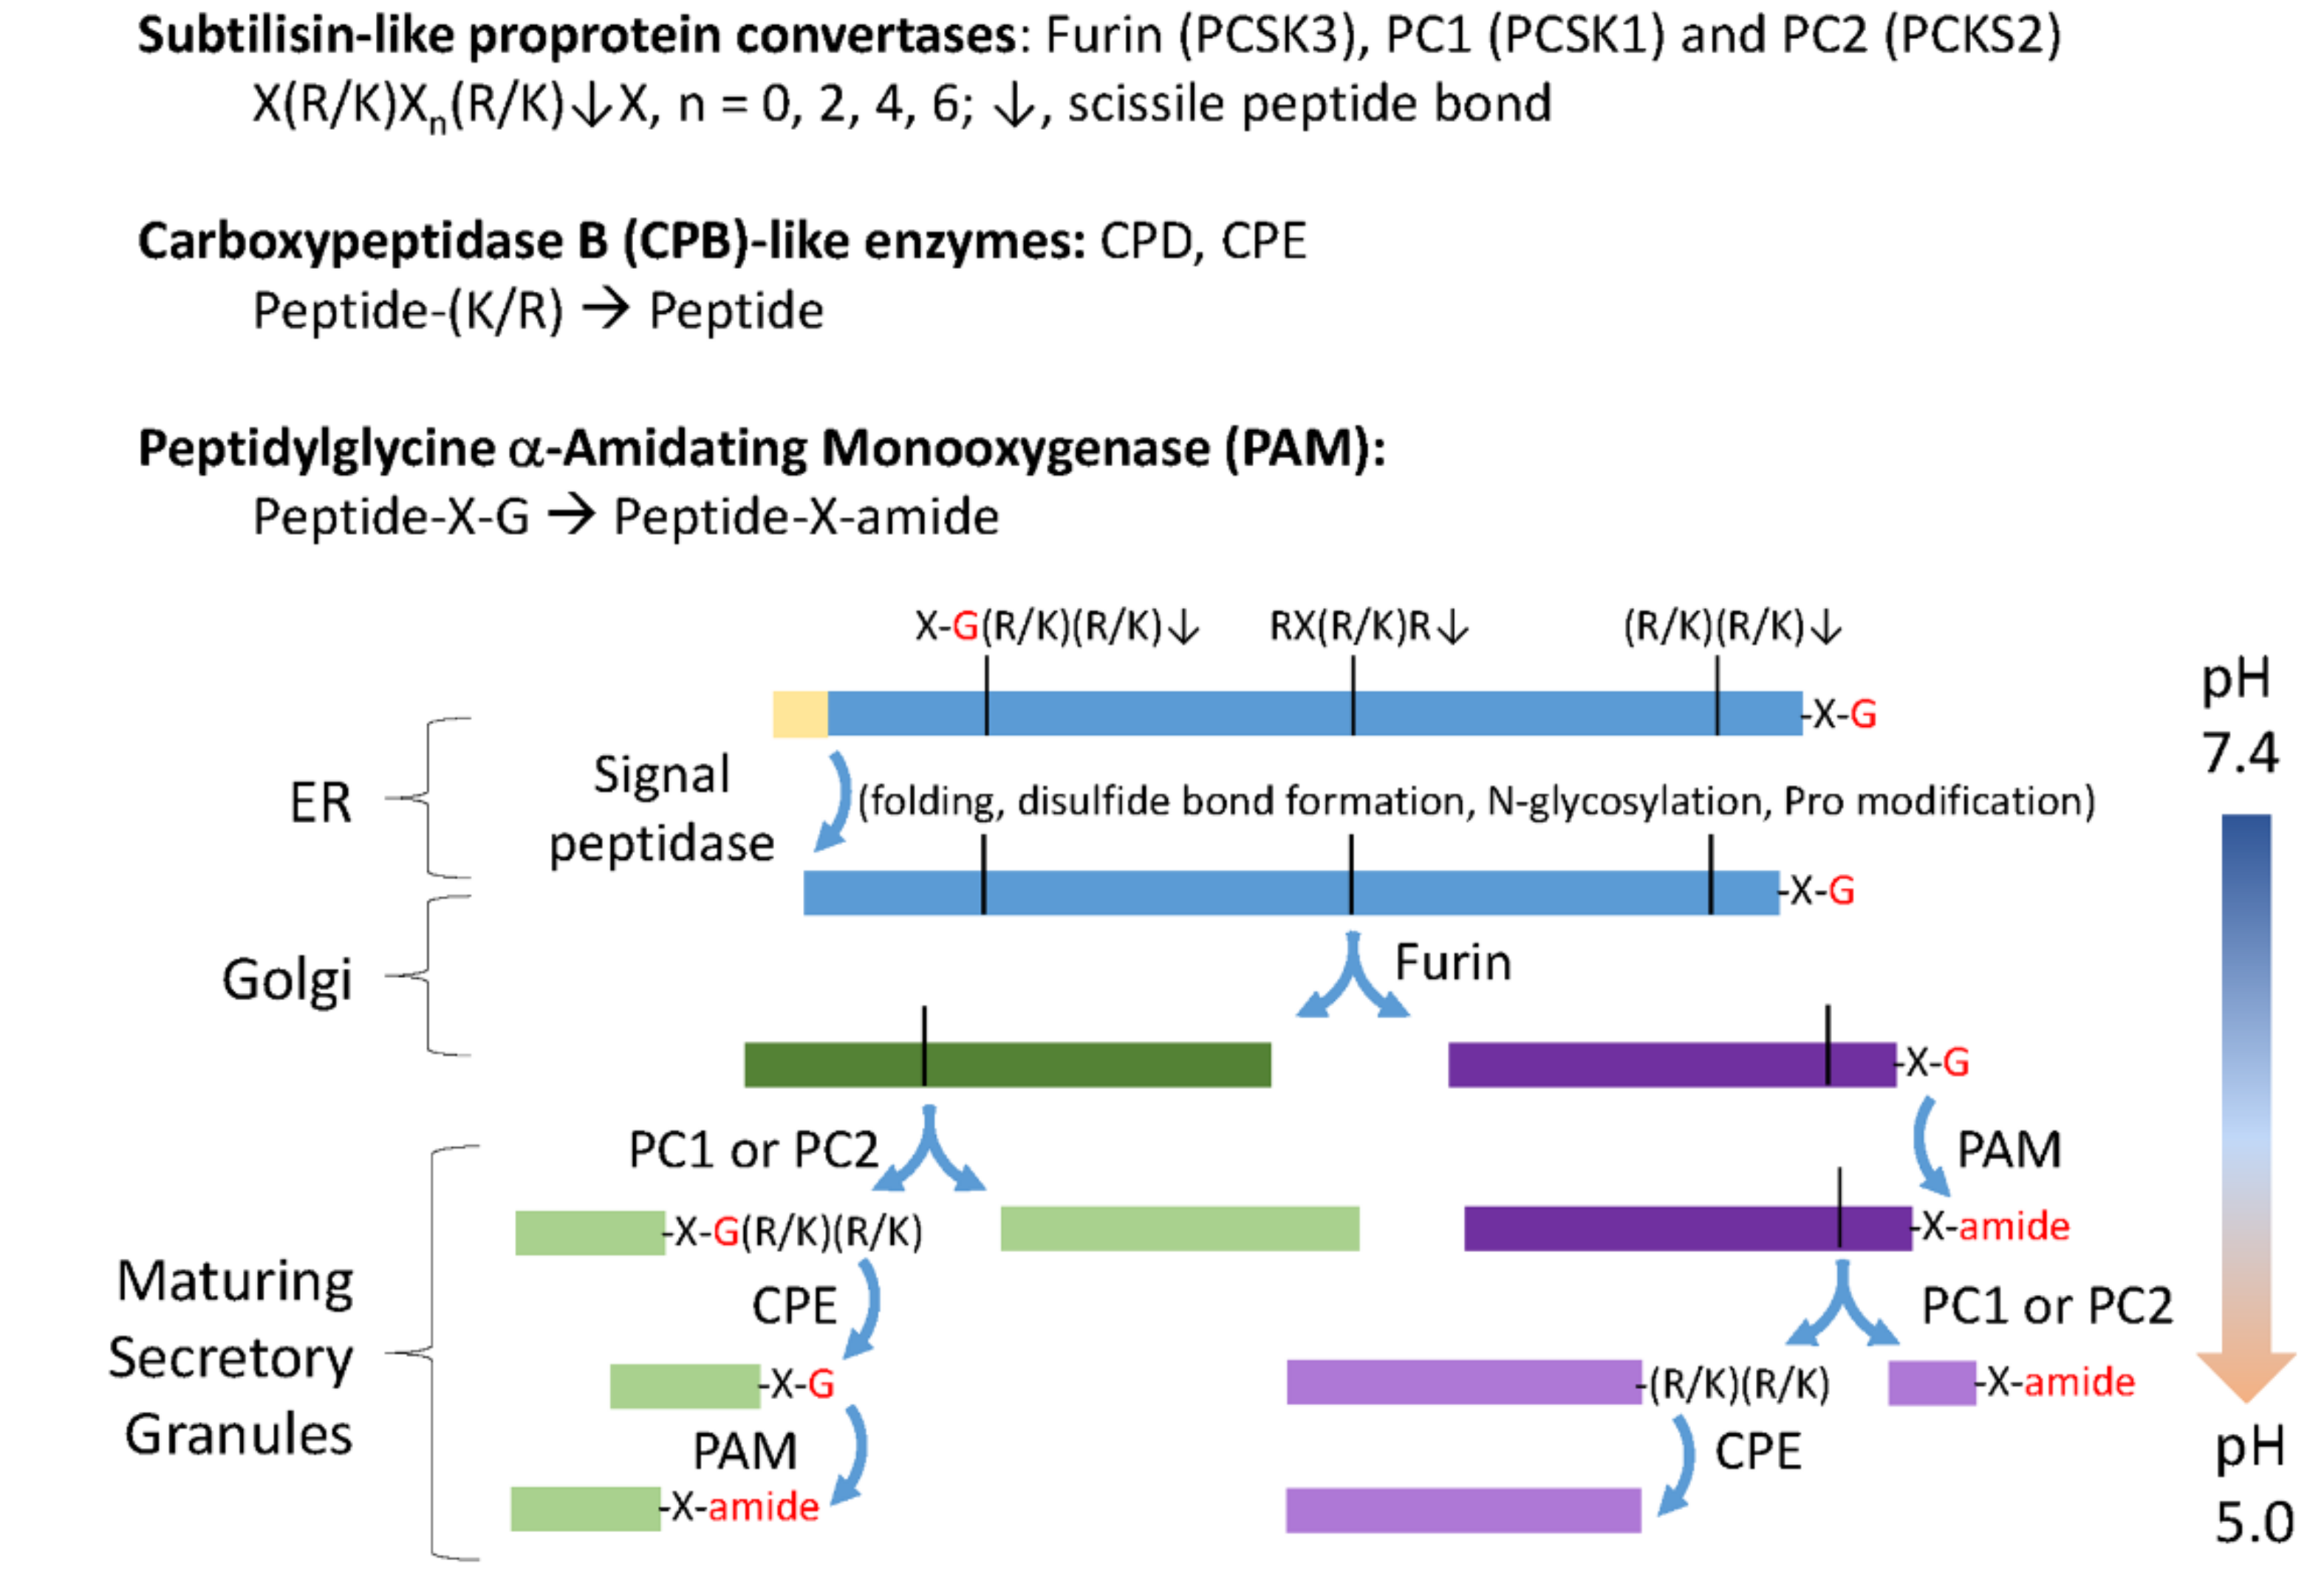
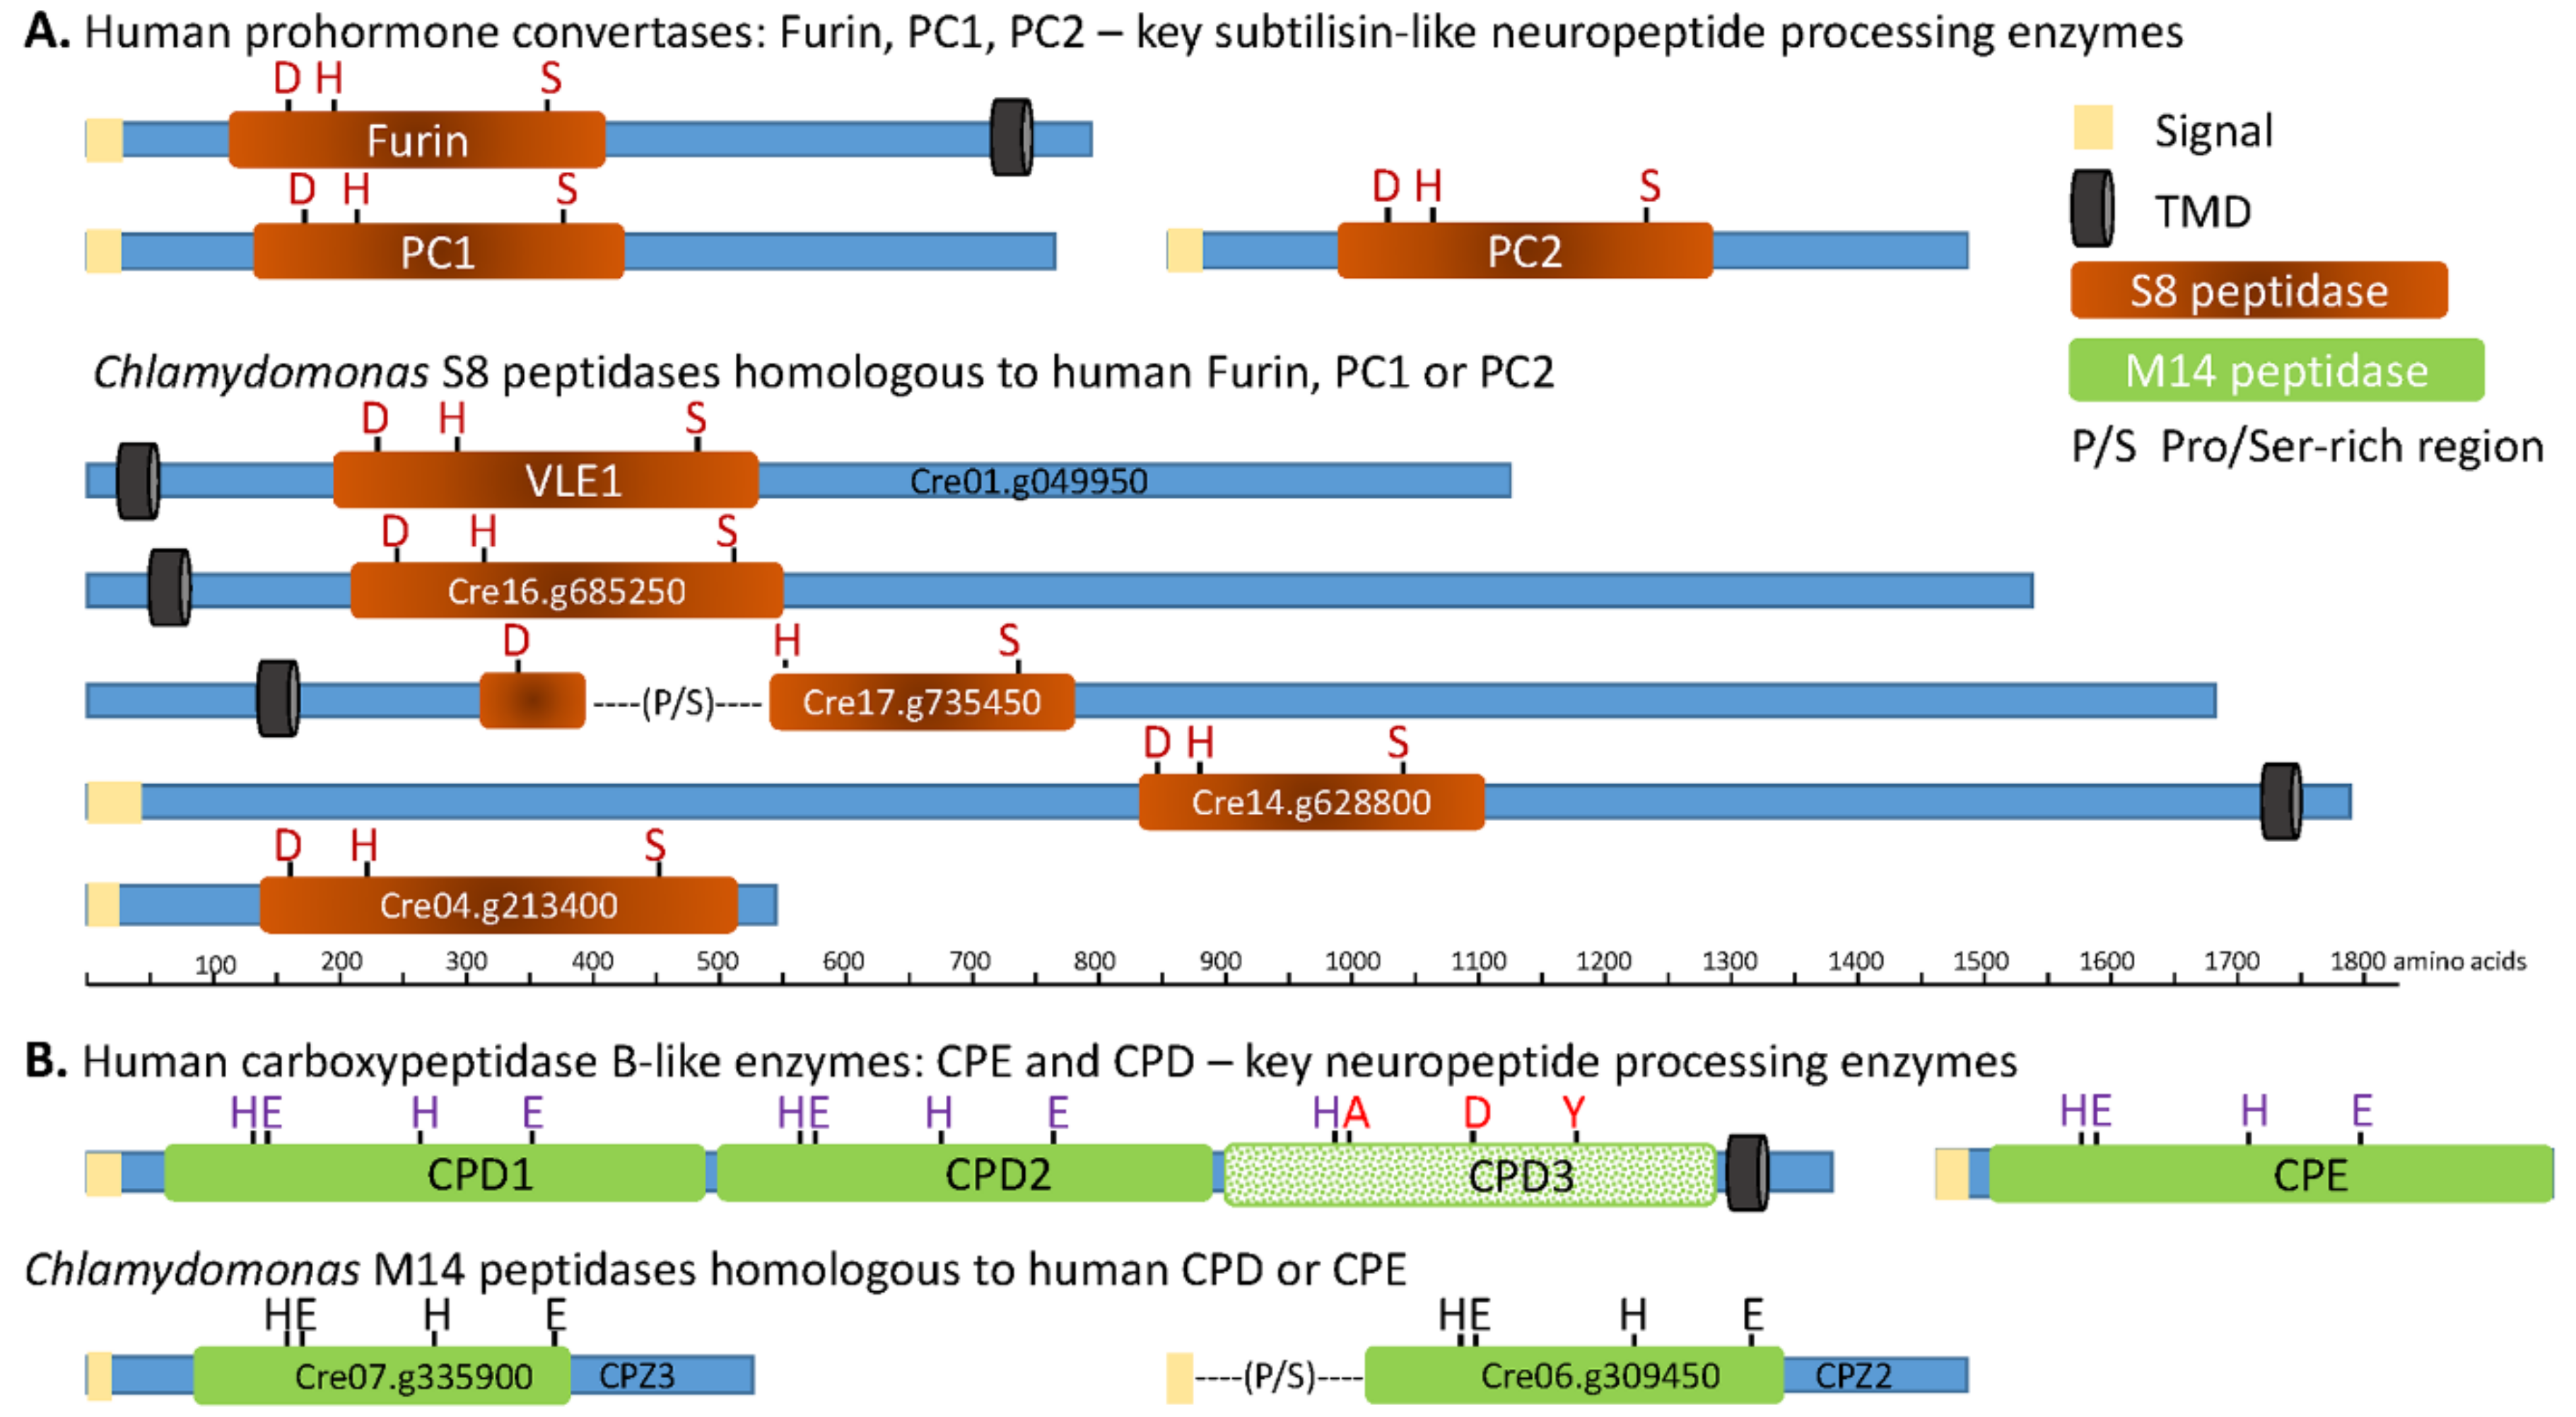
3.2. The C. reinhardtii Genome Encodes Enzymes that Resemble the PCs and CBP-Like Enzymes Essential for Neuropeptide Production
3.3. Expression of Transcripts Encoding C. reinhardtii Neuropeptide Processing Enzymes Is Regulated During Sexual Reproduction
3.4. Preparation and Analysis of the Soluble Mating Secretome
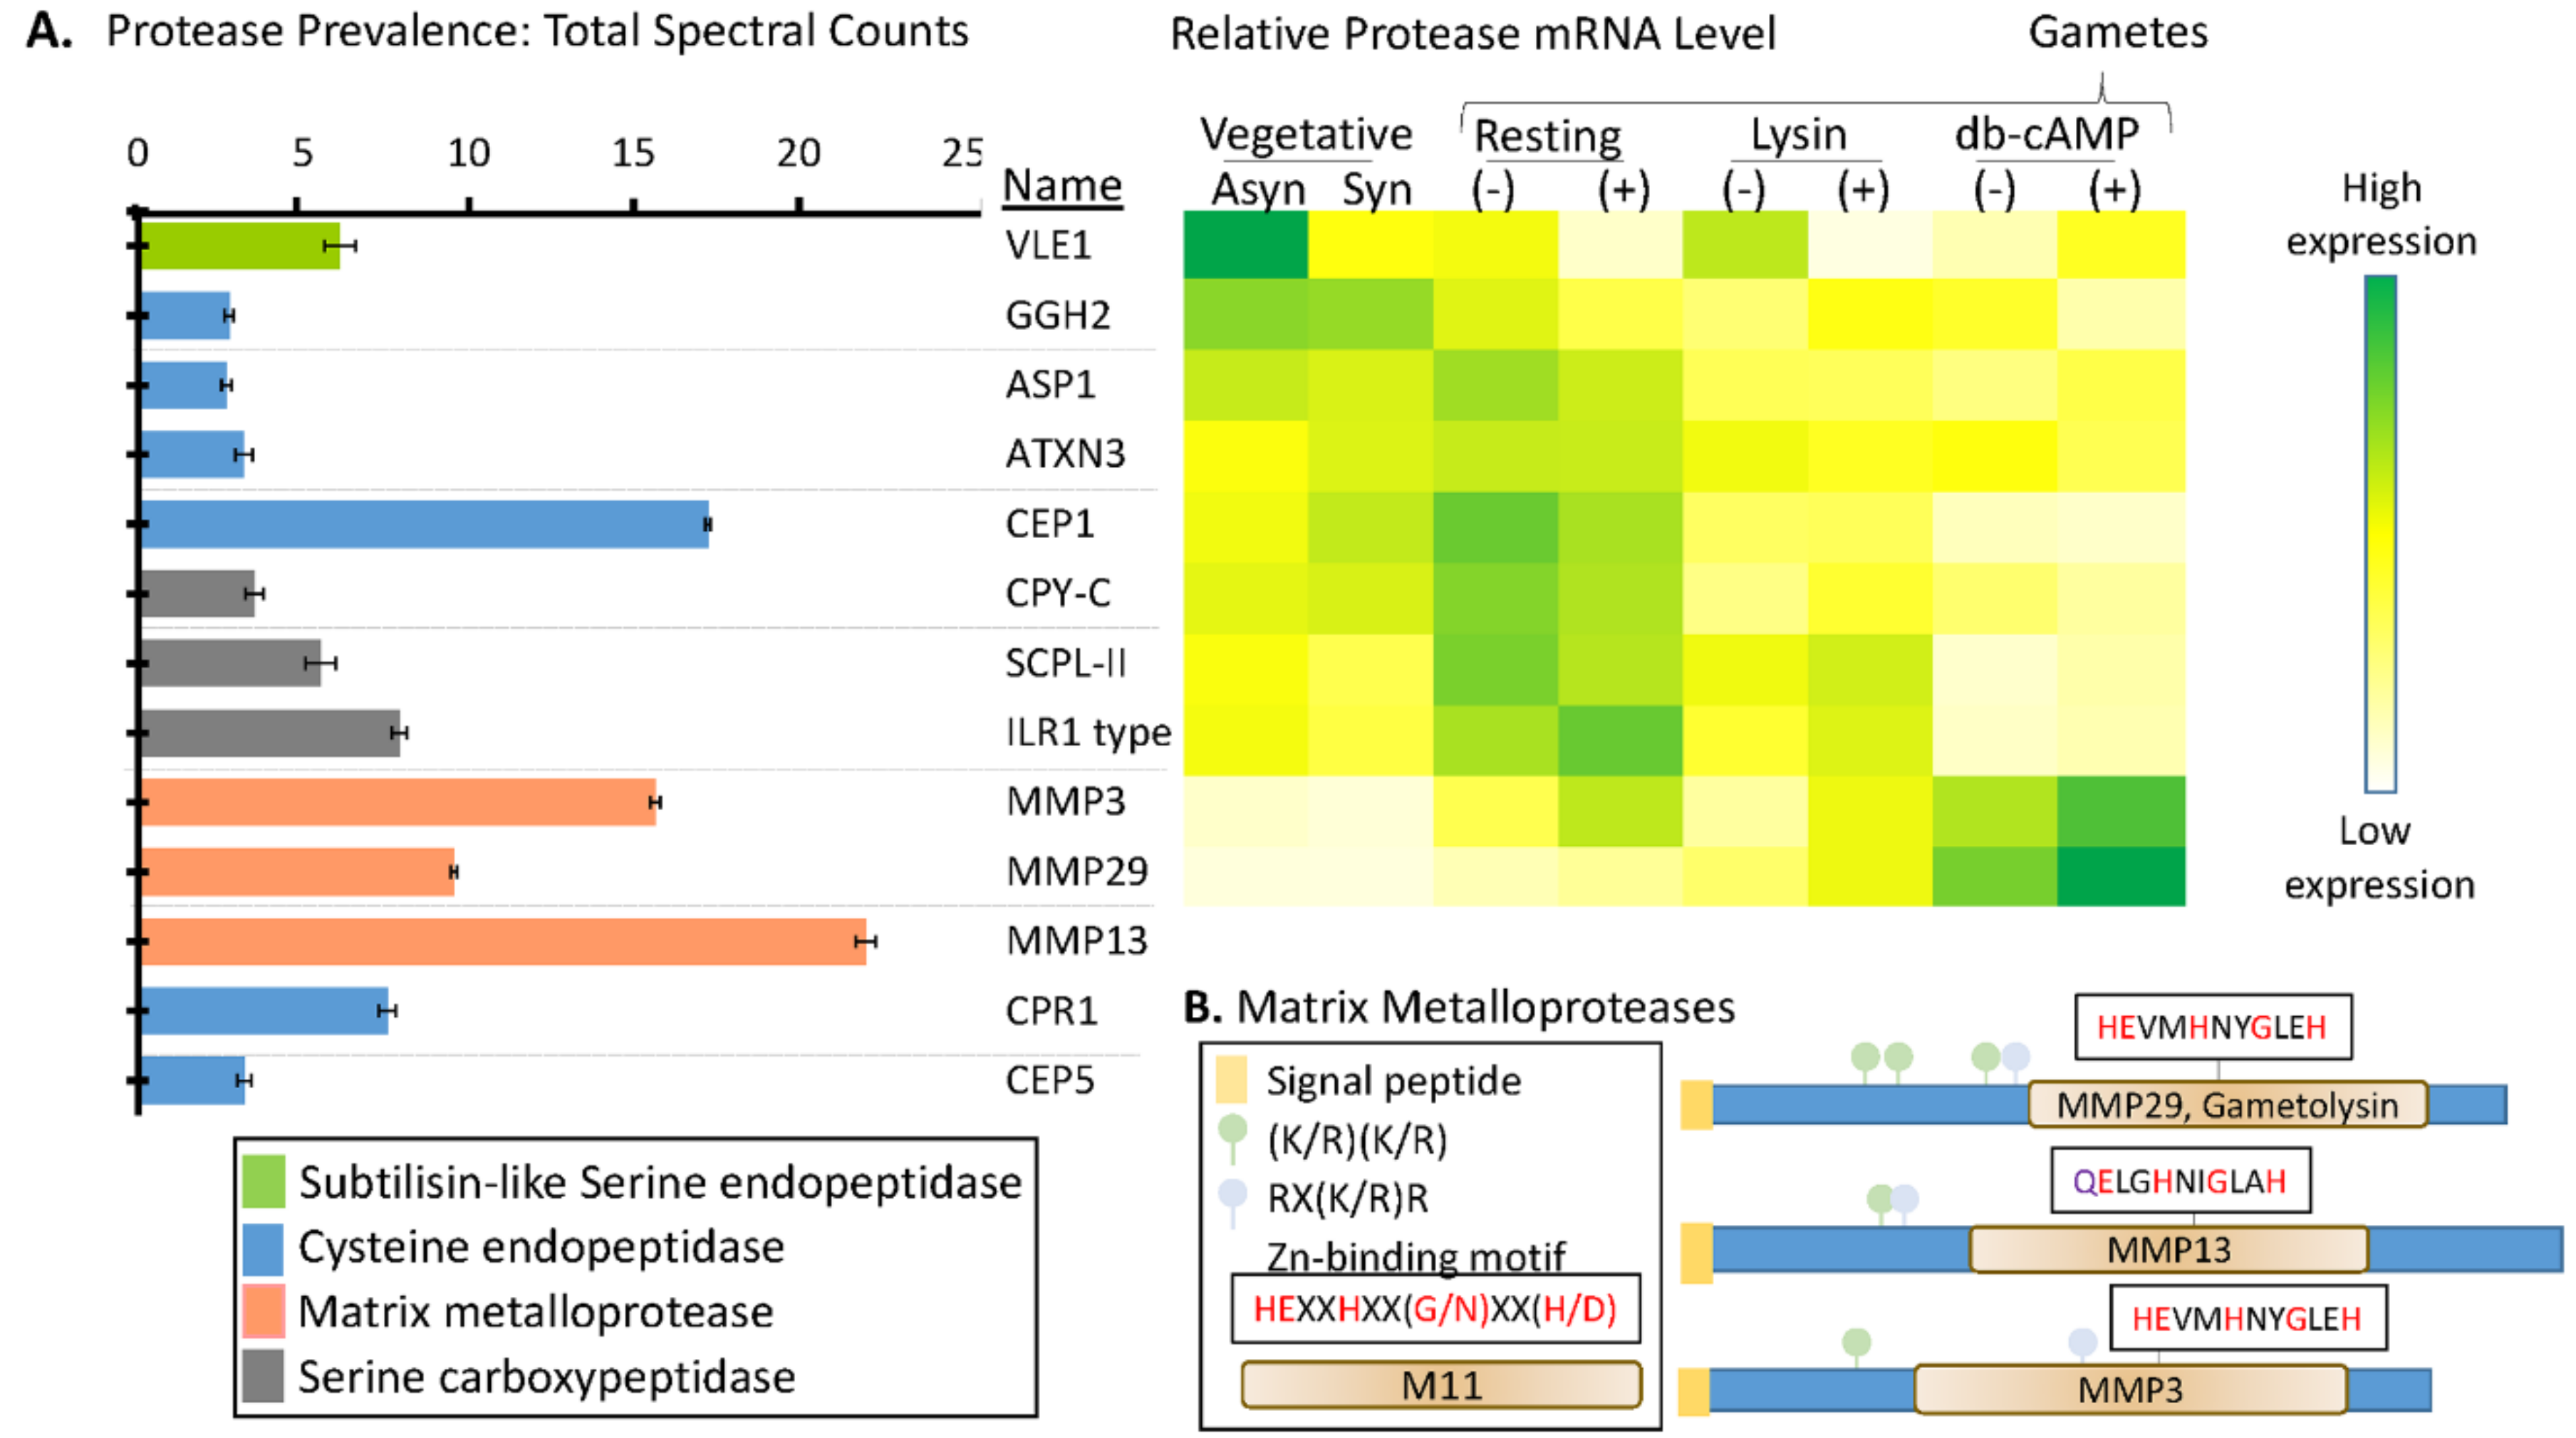
3.5. Multiple Signal Peptide-Containing Proteases Are Present in the Soluble Mating Secretome
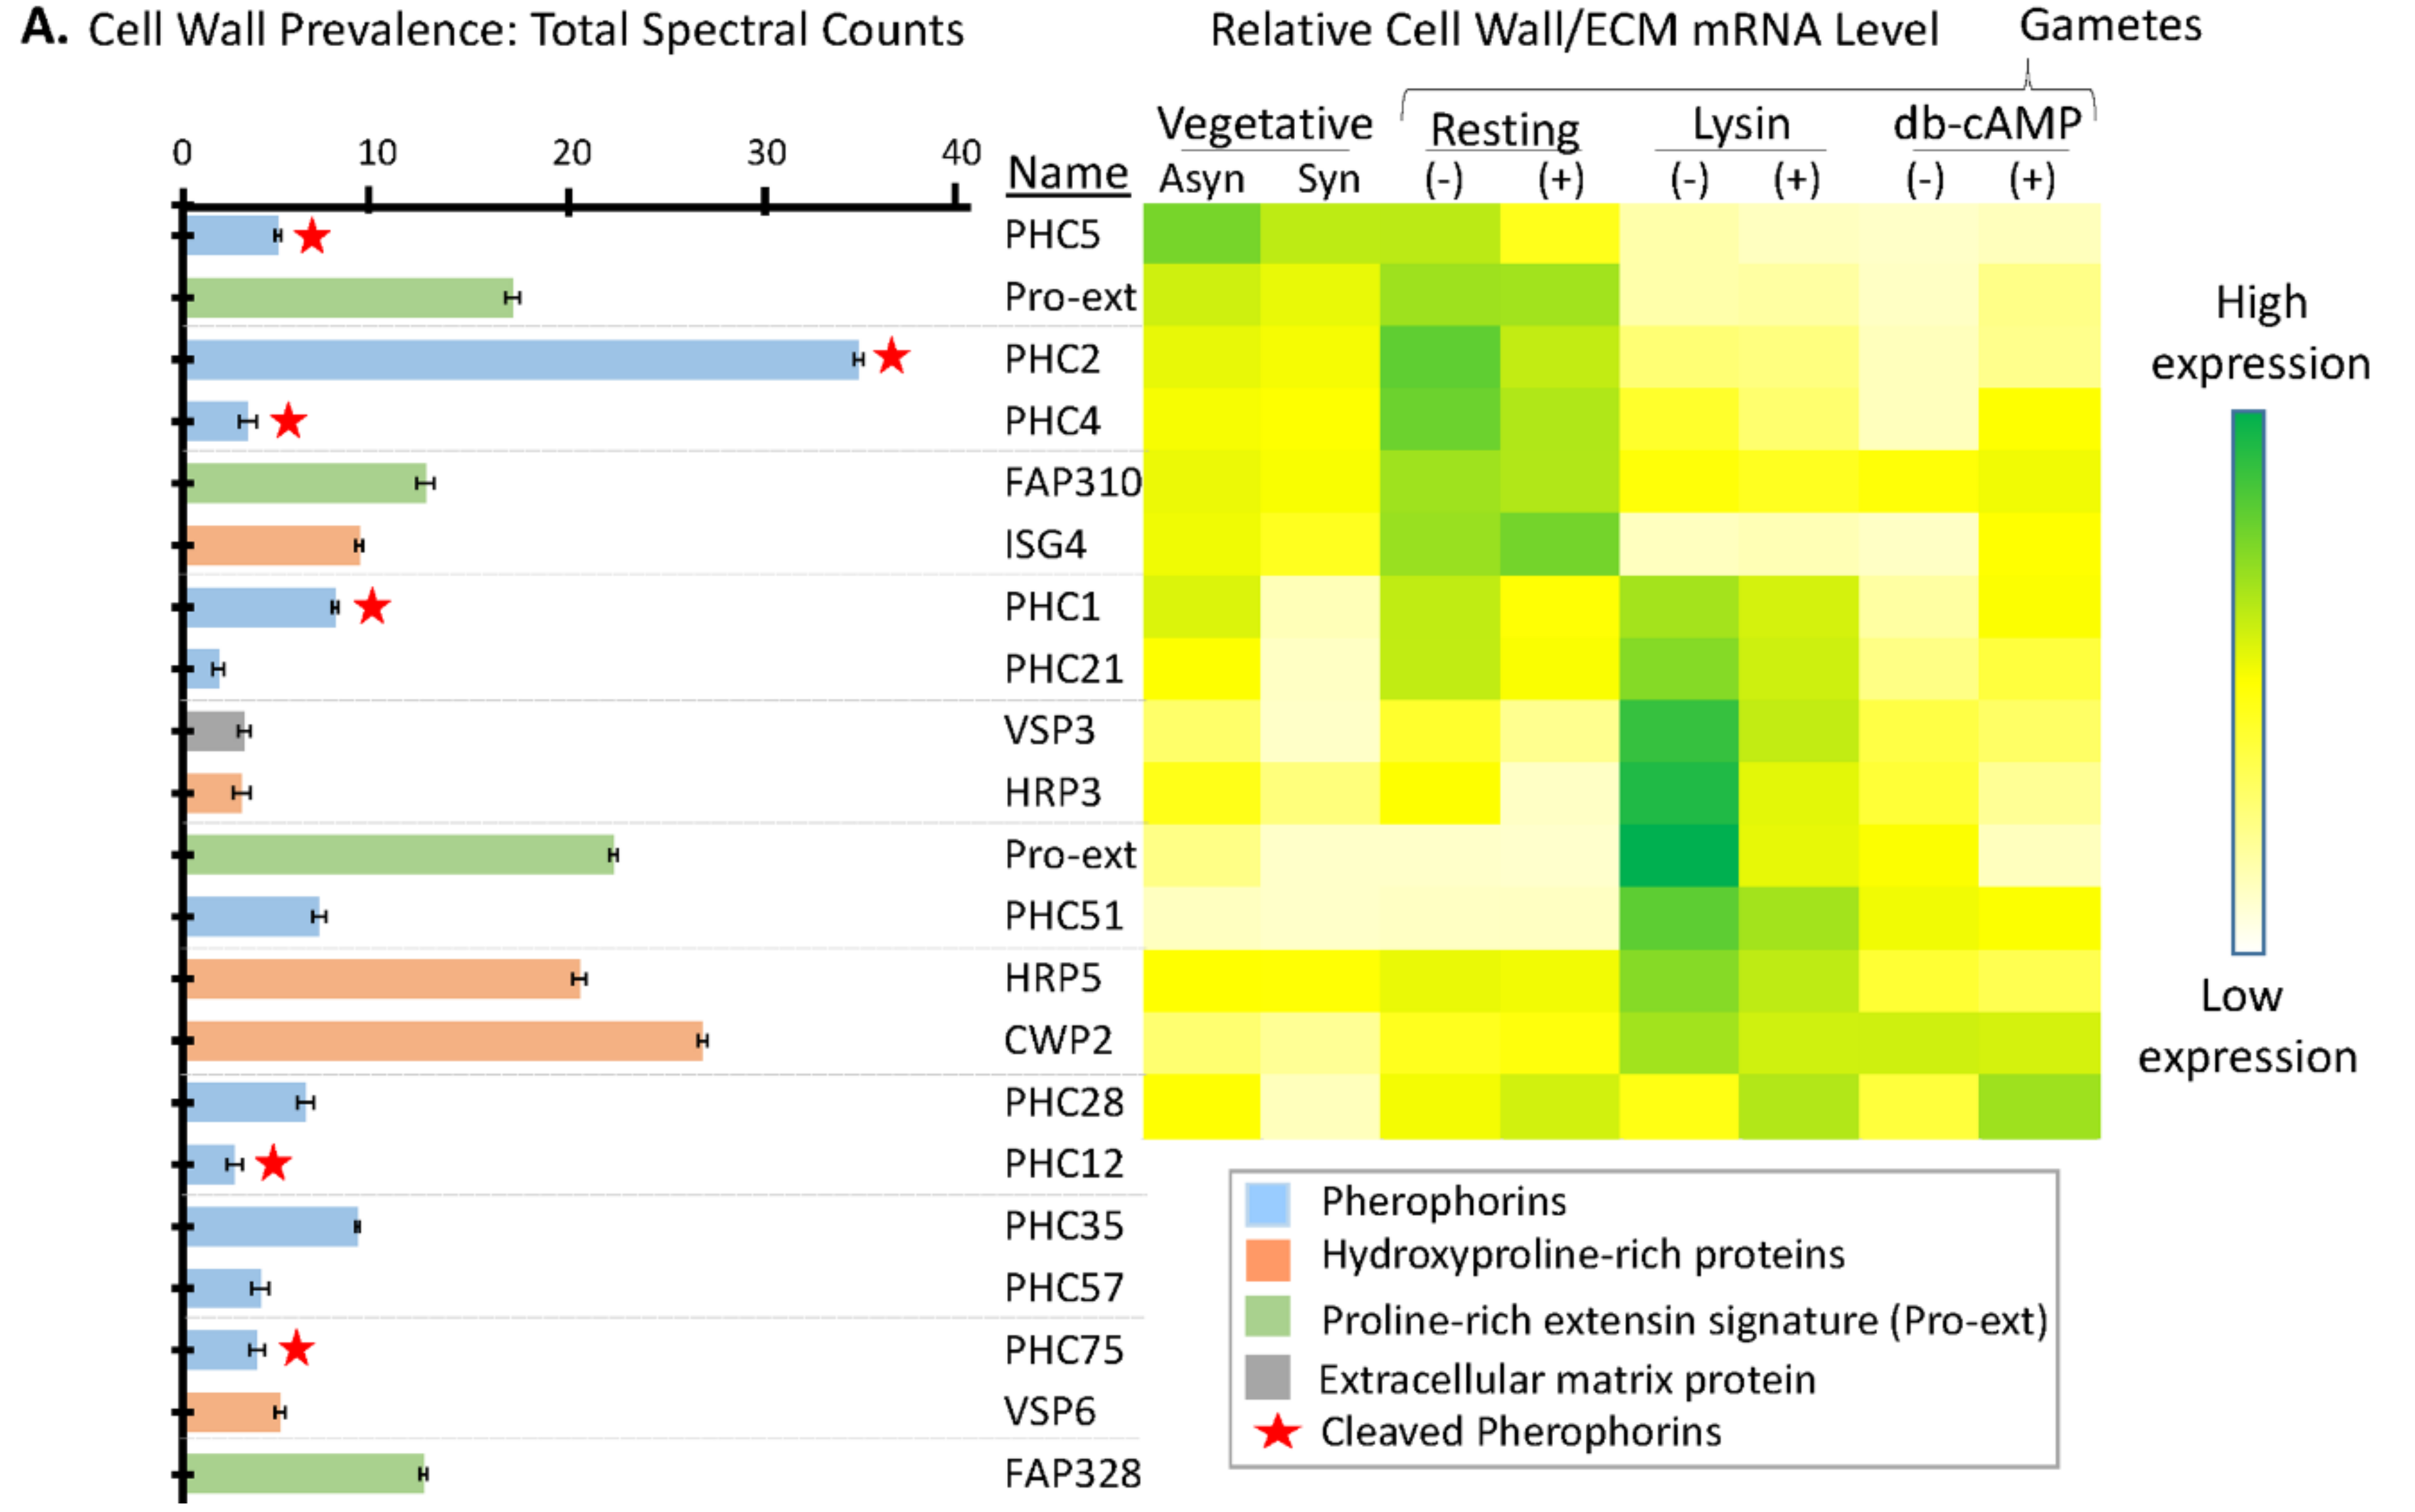
3.6. Many Cell Wall Pherophorins Recovered from the Soluble Mating Secretome Are Cleaved, While Hydroxyproline-Rich Proteins Remain Intact
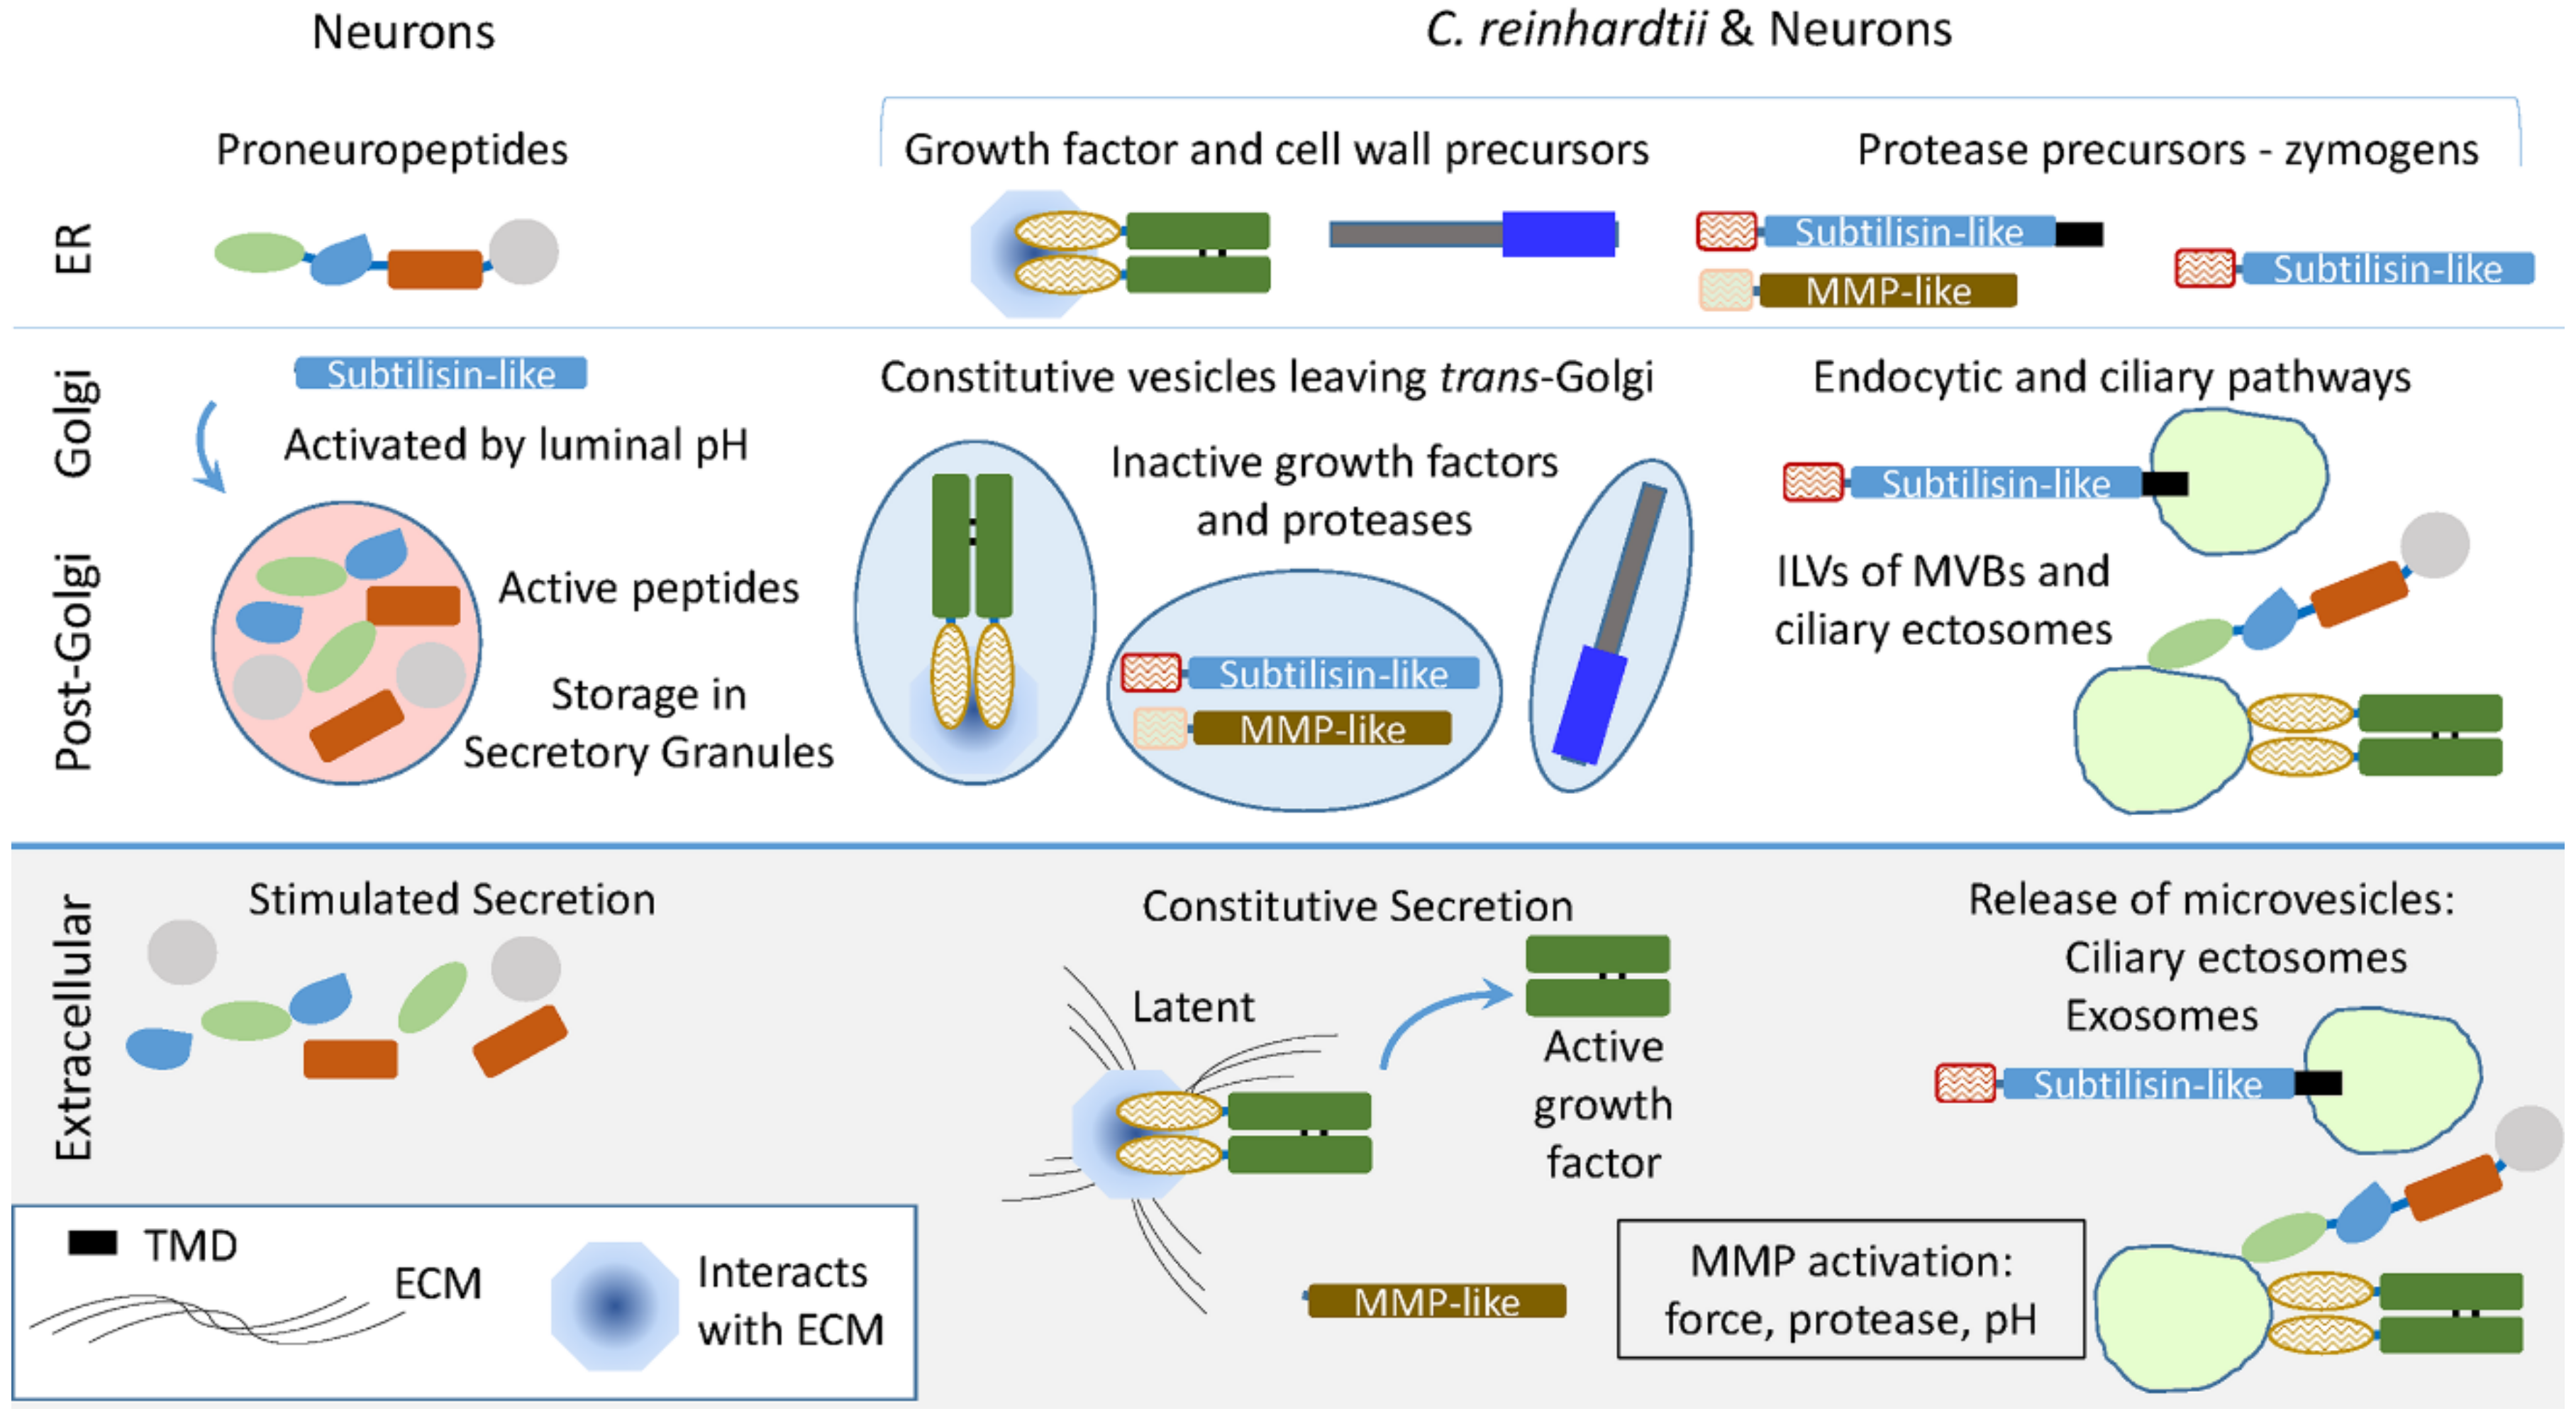
4. Conclusions
Supplementary Materials
Author Contributions
Funding
Acknowledgments
Conflicts of Interest
References
- Taghert, P.H.; Nitabach, M.H. Peptide neuromodulation in invertebrate model systems. Neuron 2012, 76, 82–97. [Google Scholar] [CrossRef] [PubMed]
- Hauser, F.; Grimmelikhuijzen, C.J.P. Evolution of the AKH/corazonin/ACP/GnRH receptor superfamily and their ligands in the Protostomia. Gen. Comp. Endocrinol. 2014, 209, 35–49. [Google Scholar] [CrossRef] [PubMed]
- Hansen, G.N.; Williamson, M.; Grimmelikhuijzen, C.J. A new case of neuropeptide coexpression (rgamide and lw amides) in hydra, found by whole-mount, two-color double-labeling in situ hybridization. Cell Tissue Res. 2002, 308, 157–165. [Google Scholar] [CrossRef] [PubMed]
- Takeda, N.; Kon, Y.; Artigas, G.Q.; Lapebie, P.; Barreau, C.; Kizumi, O.; Kishimoto, T.; Tachibana, K.; Houliston, E.; Deguchi, R. Identification of jellyfish neuropeptides that act directly as oocyte maturation-inducing hormones. Development 2018, 145, dev156786. [Google Scholar] [CrossRef] [PubMed]
- Southey, B.R.; Amare, A.; Zimmerman, T.A.; Rodriguez-Zas, S.L.; Sweedler, J.V. Neuropred: A tool to predict cleavage sites in neuropeptide precursors and provide the masses of resulting peptides. Nucleic Acids Res. 2006, 34, W267–W272. [Google Scholar] [CrossRef] [PubMed]
- Carlson, K.; Pomerantz, S.C.; Vafa, O.; Naso, M.; Strohl, W.; Mains, R.E.; Eipper, B.A. Optimizing production of fc-amidated peptides by chinese hamster ovary cells. BMC Biotechnol. 2015, 15, 95. [Google Scholar] [CrossRef] [PubMed]
- Jorgensen, E.M. Animal evolution: Looking for the first nervous system. Curr. Biol. 2016, 24, R655–R658. [Google Scholar] [CrossRef] [PubMed]
- Smith, C.L.; Varoqueaux, F.; Kittelmann, M.; Azzam, R.N.; Cooper, B.; Winters, C.A.; Eitel, M.; Fasshauer, D.; Reese, T.S. Novel cell types, neurosecretory cells, and body plan of the early-diverging metazoan Trichoplax adhaerens. Curr. Biol. 2014, 24, 1565–1572. [Google Scholar] [CrossRef] [PubMed]
- Senatore, A.; Reese, T.S.; Smith, C.L. Neuropeptidergic integration of behavior in Trichoplax adhaerens, an animal without synapses. J. Exp. Biol. 2017, 220, 3381–3390. [Google Scholar] [CrossRef] [PubMed]
- Jekely, G. Global view of the evolution and diversity of metazoan neuropeptide signaling. Proc. Natl. Acad. Sci. USA 2013, 110, 8702–8707. [Google Scholar] [CrossRef] [PubMed]
- Conzelmann, M.; Offenburger, S.L.; Asadulina, A.; Keller, T.; Munch, T.A.; Jekely, G. Neuropeptides regulate swimming depth of Platynereis larvae. Proc. Natl. Acad. Sci. USA 2011, 108, E1174–E1183. [Google Scholar] [CrossRef] [PubMed]
- Kumar, D.; Mains, R.E.; Eipper, B.A. 60 years of POMC: From POMC and α-msh to PAM, molecular oxygen, copper, and vitamin C. J. Mol. Endocrinol. 2016, 56, T63–T76. [Google Scholar] [CrossRef] [PubMed]
- Seidah, N.G.; Abifadel, M.; Prost, S.; Boileau, C.; Prat, A. The proprotein convertases in hypercholesterolemia and cardiovascular diseases: Emphasis on proprotein convertase subtilisin/kexin 9. Pharmacol. Rev. 2017, 69, 33–52. [Google Scholar] [CrossRef] [PubMed]
- Rouille, Y.; Duguay, S.J.; Lund, K.; Furuta, M.; Gong, Q.; Lipkind, G.; Oliva, A.A.; Chan, S.J.; Steiner, D.F. Proteolytic processing mechanisms in the biosynthesis of neuroendocrine peptides. Front. Neuro Endocrinol. 1995, 16, 322–361. [Google Scholar]
- Thacker, C.; Rose, A.M. A look at the Caenorhabditis elegans kex2/subtilisin-like proprotein convertase family. Bioessays 2000, 22, 545–553. [Google Scholar] [CrossRef]
- Kumar, D.; Blaby-Haas, C.; Merchant, S.; King, S.; Mains, R.E.; Eipper, B.A. Early eukaryotic origins for cilia-associated bioactive peptide-amidating activity. J. Cell Sci. 2016, 129, 943–956. [Google Scholar] [CrossRef] [PubMed]
- Kumar, D.; Strenkert, D.; Patel-King, R.S.; Leonard, M.T.; Merchant, S.S.; Mains, R.E.; King, S.M.; Eipper, B.A. A bioactive peptide amidating enzyme is required for ciliogenesis. eLife 2017, 6, e25728. [Google Scholar] [CrossRef] [PubMed]
- Goodenough, U.; Heitman, J. Origins of eukaryotic sexual reproduction. Cold Spring Harbor Perspect. Biol. 2014, 6, a016154. [Google Scholar] [CrossRef] [PubMed]
- Snell, W.J.; Eskue, W.A.; Buchanan, M.J. Regulated secretion of a serine protease that activates an extracellular matrix-degrading metalloprotease during fertilization in Chlamydomonas. J. Cell Biol. 1989, 109, 1689–1694. [Google Scholar] [CrossRef] [PubMed]
- Ning, J.; Otto, T.D.; Pfander, C.; Schwach, F.; Brochet, M.; Bushell, E.; Goulding, D.; Sanders, M.; Lefebvre, P.A.; Pei, J.; et al. Comparative genomics in Chlamydomonas and Plasmodium identifies an ancient nuclear envelope protein family essential for sexual reproduction in protists, fungi, plants and vertebrates. Genes Dev. 2013, 27, 1198–1215. [Google Scholar] [CrossRef] [PubMed]
- Joo, S.; Nishimura, Y.; Cronmiller, E.; Hong, R.H.; Kariyawasam, T.; Wang, M.H.; Shao, N.C.; El Akkad, S.E.D.; Suzuki, T.; Higashiyama, T.; et al. Gene regulatory networks for the haploid-to-diploid transition of Chlamydomonas reinhardtii. Plant Physiol. 2017, 175, 314–332. [Google Scholar] [CrossRef] [PubMed]
- Iomini, C.; Till, J.E.; Dutcher, S.K. Genetic and phenotypic analysis of flagellar assembly mutants in Chlamydomonas reinhardtii. Mtds. Cell Biol. 2009, 93, 121–143. [Google Scholar]
- Elias, J.E.; Gygi, S.P. Target-decoy search strategy for increased confidence in large-scale protein identifications by mass spectrometry. Nat. Methods 2007, 4, 207–214. [Google Scholar] [CrossRef] [PubMed]
- Kall, L.; Canterbury, J.D.; Weston, J.; Noble, W.S.; MacCoss, M.J. Semi-supervised learning for peptide identification from shotgun proteomics datasets. Nat. Methods 2007, 7, 923–925. [Google Scholar] [CrossRef] [PubMed]
- Chang, J.M.; Di Tommaso, P.; Notredame, C. TCS: A new multiple sequence alignment reliability measure to estimate alignment accuracy and improve phylogenetic tree reconstruction. Mol. Biol. Evol. 2014, 31, 1625–1637. [Google Scholar] [CrossRef] [PubMed]
- Dahms, S.O.; Hardes, K.; Steinmetzer, T.; Than, M.E. X-ray structures of the proprotein convertase furin bound with substrate analogue inhibitors reveal substrate specificity determinants beyond the s4 pocket. Biochemistry 2018, 57, 925–934. [Google Scholar] [CrossRef] [PubMed]
- Simpson, P.D.; Eipper, B.A.; Katz, M.J.; Gandara, L.; Wappner, P.; Fischer, R.; Hodson, E.J.; Ratcliffe, P.J.; Masson, N. Striking oxygen sensitivity of the peptidylglycine alpha-amidating monooxygenase (pam) in neuroendocrine cells. J. Biol. Chem. 2015, 290, 24891–24901. [Google Scholar] [CrossRef] [PubMed]
- Skulj, M.; Pezdirec, D.; Gaser, D.; Kreft, M.; Zorec, R. Reduction in c-terminal amidated species of recombinant monoclonal antibodies by genetic modification of cho cells. BMC Biotechnol. 2014, 14, 76. [Google Scholar] [CrossRef] [PubMed]
- Kubo, T.; Kaida, S.; Abe, J.; Saito, T.; Fukuzawa, H.; Matsuda, Y. The clamydomonas hatching enzyme, sporangin, is expressed in specific phases of the cell cycle and is localized to the flagella of daughter cells within the sporangial cell wall. Plant Cell Physiol. 2009, 50, 572–583. [Google Scholar] [CrossRef] [PubMed]
- Laskar, A.; Rodger, E.J.; Chatterjee, A.; Mandal, C. Modeling and structural analysis of evolutionarily diverse s8 family serine proteases. Bioinformation 2011, 7, 239–245. [Google Scholar] [CrossRef] [PubMed]
- Oyarce, A.M.; Hand, T.A.; Mains, R.E.; Eipper, B.A. Dopaminergic regulation of secretory granule-associated proteins in rat intermediate pituitary. J. Neurochem. 1996, 67, 229–241. [Google Scholar] [CrossRef] [PubMed]
- Ayoubi, T.A.Y.; Jenks, B.G.; Roubos, E.W.; Martens, G.J.M. Transcriptional and posttranscriptional regulation of the proopiomelanocortin gene in the pars intermedia of the pituitary gland of Xenopus laevis. Endocrinology 1992, 130, 3560–3566. [Google Scholar] [CrossRef] [PubMed]
- Dotman, C.H.; van Herp, F.; Martens, G.J.M.; Jenks, B.G.; Roubos, E.W. Dynamics of pomc and pc2 gene expression in xenopus melanotrope cells during long-term background adaptation. J. Endocrinol. 1998, 159, 281–286. [Google Scholar] [CrossRef] [PubMed]
- Attenborough, R.M.; Hayward, D.C.; Kitahara, M.V.; Miller, D.J.; Ball, E.E. A “neural” enzyme in nonbilaterian animals and algae: Preneural origins for peptidylglycine a-amidating monooxygenase. Mol. Biol. Evol. 2012, 29, 3095–3109. [Google Scholar] [CrossRef] [PubMed]
- Wood, C.R.; Huang, K.; Diener, D.R.; Rosenbaum, J.L. The cilium secretes bioactive ectosomes. Curr. Biol. 2013, 23, 906–911. [Google Scholar] [CrossRef] [PubMed]
- Avasthi, P.; Marshall, W. Ciliary secretion: Switching the cellular antenna to transmit. Curr. Biol. 2013, 23, R471–R473. [Google Scholar] [CrossRef] [PubMed]
- Cao, M.; Ning, J.; Hernandez-Lara, C.I.; Belzile, O.; Wang, Q.; Dutcher, S.K.; Liu, Y.; Snell, W.J. Uni-directional ciliary membrane trafficking by a cytoplasmic retrograde ift motor and ciliary ectosome shedding. eLife 2015, e05242. [Google Scholar] [CrossRef] [PubMed]
- Chambers, J.E.; Petrova, K.; Tomba, G.; Vendruscolo, M.; Ron, D. Adp ribosylation adapts an er chaperone response to short-term fluctuations in unfolded protein load. J. Cell Biol. 2012, 198, 371–385. [Google Scholar] [CrossRef] [PubMed]
- Feijs, K.L.; Verheugd, P.; Lüscher, B. Expanding functions of intracellular resident mono-adp-ribosylation in cell physiology. FEBS J. 2013, 280, 3519–3529. [Google Scholar] [CrossRef] [PubMed]
- Lu, L.; Madugula, V. Mechanisms of ciliary targeting: Entering importins and rabs. Cell. Mol. Life Sci. 2018, 75, 597–606. [Google Scholar] [CrossRef] [PubMed]
- Cavazza, T.; Vernos, I. The rangtp pathway: From nucleo-cytoplasmic transport to spindle assembly and beyond. Front. Cell Dev. Biol. 2016, 3, 82. [Google Scholar] [CrossRef] [PubMed]
- Park, S.G.; Schimmel, P.; Kim, S. Aminoacyl trna synthetases and their connections to disease. Proc. Natl. Acad. Sci. USA 2008, 105, 11043–11049. [Google Scholar] [CrossRef] [PubMed]
- Lee, M.S.; Kwon, H.; Nguyen, L.T.; Lee, E.Y.; Lee, C.Y.; Choi, S.H.; Kim, M.H. Shiga toxins trigger the secretion of lysyl-trna synthetase to enhance proinflammatory responses. J. Microbiol. Biotechnol. 2016, 26, 432–439. [Google Scholar] [CrossRef] [PubMed]
- Williams, T.F.; Mirando, A.C.; Wilkinson, B.; Francklyn, C.S.; Lounsbury, K.M. Secreted threonyl-trna synthetase stimulates endothelial cell migration and angiogenesis. Sci. Rep. 2013, 3, 1317. [Google Scholar] [CrossRef] [PubMed]
- Abe, J.; Kubo, T.; Takagi, Y.; Saito, T.; Miura, K.; Fukuzawa, H.; Matsuda, Y. The transcriptional program of synchronous gametogenesis in Chlamydomonas reinhardtii. Curr. Genet. 2004, 46, 304–315. [Google Scholar] [CrossRef] [PubMed]
- Kinoshita, T.; Fukuzawa, H.; Shimada, T.; Saito, T.; Matsuda, Y. Primary structure and expression of a gamete lytic enzyme in Chlamydomonas reinhardtii: Similarity of functional domains to matrix metalloproteases. Proc. Natl. Acad. Sci. USA 1992, 89, 4693–4697. [Google Scholar] [CrossRef] [PubMed]
- Marino-Puertas, L.; Goulas, T.; Gomis-Ruth, F.X. Matrix metalloproteinases outside vertebrates. Biophys. Biochim. Acta Mol. Cell Res. 2017, 1864, 2026–2036. [Google Scholar] [CrossRef] [PubMed]
- Marino, G.; Funk, C. Matrix metalloproteinases in plants: A brief overview. Physiol. Plant 2012, 145, 196–202. [Google Scholar] [CrossRef] [PubMed]
- Fanjul-Fernandez, M.; Folgueras, A.R.; Cabrera, S.; Lopez-Otin, C. Matrix metalloproteinases: Evolution, gene regulation and functional analysis in mouse models. Biochim. Biophys. Acta 2010, 1803, 3–19. [Google Scholar] [CrossRef] [PubMed]
- Hallmann, A. The pherophorins: Common, versatile building blocks in the evolution of extracellular matrix architecture in Volvocales. Plant J. 2006, 45, 292–307. [Google Scholar] [CrossRef] [PubMed]
- Harris, E.H. Cell architecture. The Chlamydomonas Sourcebook, 2nd ed.; Harris, E.H., Ed.; Elsevier: New York, NY, USA, 2009; Volume 1, pp. 25–63. [Google Scholar]
- Bäck, N.; Kanerva, K.; Vishwanatha, K.S.; Yanik, A.; Ikonen, E.; Mains, R.E.; Eipper, B.A. The endocytic pathways of a secretory granule membrane protein in HEK293 cells: PAM and EGF traverse a dynamic multivesicular body network together. Eur. J. Cell Biol. 2017, 86, 407–417. [Google Scholar] [CrossRef] [PubMed]
- Sinha, S.; Hoshino, D.; Hong, N.H.; Kirkbride, K.C.; Grega-Larson, N.E.; Seiki, M.; Tyska, M.J.; Weaver, A.M. Cortactin promotes exosome secretion by controlling branched actin dynamics. J. Cell Biol. 2016, 214, 197–213. [Google Scholar] [CrossRef] [PubMed]


| Protein ID | Length | Signal | TM Helix | S8 Location | Most Closely Related Human Protein (GENE) |
|---|---|---|---|---|---|
| Secreted | |||||
| Cre02.g076950 | 1355 | 1–22 | no | 189–992 | |
| Cre04.g213400 | 539 | 1–23 | no | 171–521 | PC1 (PCSK1) |
| Cre07.g329500 | 945 | 1–29 | no | 601–847 | |
| Cre10.g459450 | 866 | 1–30 | no | 536–836 | |
| Cre05.g242100 | 1264 | 1–26 | no | 428–991 | |
| Cre05.g242750 | 1301 | 1–23 | no | 511–1053 | |
| Cre19.g750447 | 1141 | 1–26 | no | 700–1140 | |
| Type I membrane | |||||
| Cre14.g628800 | 1787 | 1–47 | 1719–1741 | 837–1103 | SKI-1 (MBTPS1) |
| Type II membrane | |||||
| Cre01.g049950 VLE1, sporangin | 1117 | no | 37–59 | 210–539 | PC7 (PCSK7) |
| Cre03.g145827 | 1512 | no | 45–67 | 219–552 | |
| Cre16.g685250 | 1532 | no | 55–77 | 233–562 | PC4 (PCSK4) |
| Cre17.g708400 | 1794 | no | 451–473 | 767–1163 | |
| Cre17.g735450 | 1674 | no | 138–160 | 333–774 | PC2 (PCSK2) & PACE4 (PCSK6) |
| Cre03.g190250 | 1229 | no | 1149–1171 | 298–792 | |
| Other | |||||
| Cre13.g585800 | 809 | no | no | 154–425 | |
| Cre16.g675350 | 1492 | no | no | 119–599 | |
| Cre17.g713600 | 1982 | no | no | 764–1116 | |
| Cre03.g170300 | 1374 | no | no | Split | |
| Cre05.g242700 | 777 | no | no | 26–383 | |
| Cre05.g242856 | 1419 | no | no | 585–1129 | |
| Cre09.g406700 | 1890 | no | no | 482–1018 |
| Rank | Accession Number | Mol Mass | Avg Tot Spectral Counts | SEM/ Avg | Description |
|---|---|---|---|---|---|
| 1 | Cre11.g477950.t1.1 | 94 kDa | 189.1 | 0.13 | ADP-ribosylglycohydrolase |
| 2 | Cre02.g088200.t1.2 | 58 kDa | 148.4 | 0.09 | Protein disulfide isomerase 1, RB60 |
| 3 | Cre02.g143200.t1.1 | 122 kDa | 71.7 | 0.05 | Alanine tRNA ligase |
| 4 | Cre02.g080700.t1.2 | 72 kDa | 66.9 | 0.10 | ER associated Hsp70 protein |
| 5 | Cre01.g038400.t1.2 | 47 kDa | 56.4 | 0.15 | Calreticulin 2, calcium-binding protein |
| 6 | Cre14.g633750.t1.1 | 122 kDa | 51.7 | 0.07 | Importin β-3 homolog |
| 7 | Cre06.g298650.t1.2 | 53 kDa | 51.0 | 0.43 | Translation initiation factor 4A |
| 8 | Cre02.g080650.t1.2 | 93 kDa | 41.4 | 0.09 | ER associated heat shock protein 90B |
| 9 | Cre09.g394200.t1.1 | 156 kDa | 37.7 | 0.34 | Flagellar associated protein |
| 10 | Cre01.g034000.t1.2 | 97 kDa | 37.3 | 0.26 | Importin β |
| 11 | Cre14.g620600.t1.2 | 52 kDa | 34.7 | 0.24 | Pherophorin, PHC2 |
| 12 | Cre09.g406600.t1.1 | 38 kDa | 33.7 | 0.35 | ChlamyFPv5, 2 KCl peptides |
| 13 | Cre06.g258800.t1.1 | 132 kDa | 26.7 | 0.24 | OH-Pro-rich glycoprotein, GP2 (FAP3) |
| 14 | Cre10.g431800.t1.2 | 70 kDa | 25.2 | 0.37 | Arylsulfatase |
| 15 | Cre07.g330200.t1.2 | 30 kDa | 23.2 | 0.12 | Radial spoke protein 9 |
| 16 | Cre02.g089500.t1.2 | 43 kDa | 22.1 | 0.21 | Proline rich extensin signature |
| 17 | Cre03.g144564.t1.1 | 81 kDa | 22.0 | 0.30 | Matrix metalloproteinase, MMP13 |
| 18 | Cre07.g321400.t1.1 | 199 kDa | 20.5 | 0.13 | Flagellar associated protein |
| 19 | Cre02.g089450.t1.2 | 38 kDa | 20.4 | 0.33 | Proline rich extensin signature, HRP5 |
| 20 | Cre02.g077850.t1.2 | 83 kDa | 18.6 | 0.34 | Flagellar associated protein, FAP212 |
| 21 | Cre09.g407700.t1.2 | 54 kDa | 17.3 | 0.08 | Cysteine endopeptidase, CEP1 |
| 22 | Cre09.g401900.t1.2 | 132 kDa | 16.9 | 0.37 | Proline rich extensin signature |
| 23 | Cre12.g487700.t1.2 | 77 kDa | 15.9 | 0.13 | Serine/threonine protein kinase |
| 24 | Cre09.g393700.t1.1 | 71 kDa | 15.7 | 0.16 | Matrix metalloproteinase, MMP3 |
| 25 | Cre11.g467547.t1.1 | 83 kDa | 13.0 | 0.26 | Glutamyl/glutaminyl-tRNA synthetase |
| 26 | Cre02.g077800.t1.2 | 86 kDa | 12.5 | 0.45 | Proline rich extensin signature (FAP310) |
| 27 | Cre02.g102050.t1.1 | 92 kDa | 12.4 | 0.20 | Proline rich extensin signature (FAP328) |
| 28 | Cre11.g479250.t1.2 | 54 kDa | 12.1 | 0.11 | Ran GTPase-activating protein, |
| 29 | Cre06.g304500.t1.2 | 40 kDa | 10.9 | 0.18 | Zygote-specific protein |
| 30 | Cre12.g533100.t1.1 | 21 kDa | 10.6 | 0.41 | CHRD domain, PF07452 |
© 2018 by the authors. Licensee MDPI, Basel, Switzerland. This article is an open access article distributed under the terms and conditions of the Creative Commons Attribution (CC BY) license (http://creativecommons.org/licenses/by/4.0/).
Share and Cite
Luxmi, R.; Blaby-Haas, C.; Kumar, D.; Rauniyar, N.; King, S.M.; Mains, R.E.; Eipper, B.A. Proteases Shape the Chlamydomonas Secretome: Comparison to Classical Neuropeptide Processing Machinery. Proteomes 2018, 6, 36. https://doi.org/10.3390/proteomes6040036
Luxmi R, Blaby-Haas C, Kumar D, Rauniyar N, King SM, Mains RE, Eipper BA. Proteases Shape the Chlamydomonas Secretome: Comparison to Classical Neuropeptide Processing Machinery. Proteomes. 2018; 6(4):36. https://doi.org/10.3390/proteomes6040036
Chicago/Turabian StyleLuxmi, Raj, Crysten Blaby-Haas, Dhivya Kumar, Navin Rauniyar, Stephen M. King, Richard E. Mains, and Betty A. Eipper. 2018. "Proteases Shape the Chlamydomonas Secretome: Comparison to Classical Neuropeptide Processing Machinery" Proteomes 6, no. 4: 36. https://doi.org/10.3390/proteomes6040036
APA StyleLuxmi, R., Blaby-Haas, C., Kumar, D., Rauniyar, N., King, S. M., Mains, R. E., & Eipper, B. A. (2018). Proteases Shape the Chlamydomonas Secretome: Comparison to Classical Neuropeptide Processing Machinery. Proteomes, 6(4), 36. https://doi.org/10.3390/proteomes6040036