Article

A Proteomic Approach to Investigate the Drought Response in the Orphan Crop Eragrostis tef

1
Department of Molecular and Cell Biology, University of Cape Town, Private Bag X3, Rondebosch 7701, South Africa
2
Institute of Plant Sciences, University of Bern, Altenbergrain 21, 3013 Bern, Switzerland
*
Author to whom correspondence should be addressed.
Proteomes 2017, 5(4), 32; https://doi.org/10.3390/proteomes5040032
Submission received: 22 June 2017 / Revised: 20 October 2017 / Accepted: 10 November 2017 / Published: 15 November 2017
(This article belongs to the Special Issue Plant Proteomics 2017)

Abstract

:
The orphan crop, Eragrostis tef, was subjected to controlled drought conditions to observe the physiological parameters and proteins changing in response to dehydration stress. Physiological measurements involving electrolyte leakage, chlorophyll fluorescence and ultra-structural analysis showed tef plants tolerated water loss to 50% relative water content (RWC) before adverse effects in leaf tissues were observed. Proteomic analysis using isobaric tag for relative and absolute quantification (iTRAQ) mass spectrometry and appropriate database searching enabled the detection of 5727 proteins, of which 211 proteins, including a number of spliced variants, were found to be differentially regulated with the imposed stress conditions. Validation of the iTRAQ dataset was done with selected stress-related proteins, fructose-bisphosphate aldolase (FBA) and the protective antioxidant proteins, monodehydroascorbate reductase (MDHAR) and peroxidase (POX). Western blot analyses confirmed protein presence and showed increased protein abundance levels during water deficit while enzymatic activity for FBA, MDHAR and POX increased at selected RWC points. Gene ontology (GO)-term enrichment and analysis revealed terms involved in biotic and abiotic stress response, signaling, transport, cellular homeostasis and pentose metabolic processes, to be enriched in tef upregulated proteins, while terms linked to reactive oxygen species (ROS)-producing processes under water-deficit, such as photosynthesis and associated light harvesting reactions, manganese transport and homeostasis, the synthesis of sugars and cell wall catabolism and modification, to be enriched in tef downregulated proteins.

1. Introduction

Water-deficit stress, as a consequence of drought, has been proposed to be the most important abiotic factor in limiting crop plant growth, development and productivity [1,2]. Furthermore, climate change models predict increasing periods of extended drought over much of Africa, where the bulk of agriculture is rainfed, rendering conventional cropping practises ineffective [3,4]. Eragrostis tef (Zucc.) Trotter, commonly known as tef, is an indigenous African grass that has been cultivated in the Horn of Africa for some 2000 years [5]. The grain is a source of income to many resource-poor subsistence farmers and a staple food source for many low-income consumers [6]. Tef is a versatile crop able to grow under a wide range of soil types, climatic conditions and at differing altitudes ranging from 1000 to 2500 m above sea level [7,8,9]. The major abiotic stress factors affecting its growth and production include drought, soil salinity and acidity [10]. While some research has shown that different varieties of tef exhibit relative tolerance to increased salinity [11] and soil acidity [12], the majority of studies have reported on tef tolerance to drought stress [13,14,15,16,17]. Although tef is well suited to growth and development in semi-arid areas often prone to drought conditions [18,19,20], prolonged drought is still a major factor limiting tef productivity [13,14].
While generally considered to be an under-researched or ‘orphan crop’ in terms of genetic manipulation and improvement [6], a diverse array of genetic studies on tef have provided information on phylogeny [21], phenotypic and genetic diversity [22,23,24,25,26,27,28,29] as well as other molecular characteristics [30,31]. Most of these studies, however, have been tailored to the generation of molecular tools for marker assisted breeding projects for tef growth and improvement under a variety of growth limiting conditions. The recent sequencing of the genome and transcriptome of tef variety Tsedey (DZ-Cr-37) has provided a valuable resource for further “omic” studies aimed towards ultimate enhancement of tef productivity for food security purposes [18,32]. Insights gained from understanding which genes, proteins and metabolites, and their respective roles in stress response, could facilitate enhancement of tef tolerance to abiotic stress factors. In particular, high throughput proteomic techniques in combination with this genome resource are a powerful tool for the identification and characterisation of proteins associated with drought stress. The use of quantitative proteomic methods have become a powerful and widely-used technique in the field of crop stress tolerance research, as it has the ability to identify and quantify changing stress-related proteins and compare proteomic profiles of stress-sensitive to stress-tolerant crops [33]. This approach is strengthened by having the most comprehensive database, as it facilitates further downstream bioinformatics analyses [33,34,35,36]. This information could, in turn, be utilized to select for tef varieties with improved tolerance to water-deficit stress. To date, there has been no published data on the use of high throughput proteomics or comparative proteomics studies on vegetative tissues of such varieties in response to abiotic or biotic stress. Previous protein studies conducted on tef were mostly targeted to the amino acid composition of tef seeds [37] and the characterisation of albumin, globulin and prolamin contents in relation to nutritional quality during tef grain consumption [38,39].
In this study, pre-flowering E. tef plants propagated from a “brown seeded” variety were subjected to controlled dehydration stress conditions. Selected physiological parameters (electrolyte leakage and photosynthetic activity) in combination with ultra-structural observations of leaf tissues during dehydration were chosen to determine critical water contents at which stress associated damages are initiated for further proteomic investigation using an iTRAQ approach. Changes in abundance of proteins during dehydration were noted and these were validated for selected proteins by use of Western blotting. Enzyme assays associated with such proteins were conducted to characterise their activity profiles during water deficit stress. Bioinformatics analysis was employed for further characterisation of stress responsive proteins.
This study, to our knowledge, is the first proteomic analysis of leaf tissues of a tef variety in response to water-deficit stress brought about as a consequence of drought conditions.

2. Materials and Methods

2.1. Plant Material and Growth Conditions

Tef plantlets were germinated from seed (brown seed, local market variety purchased in Ethiopia) into 6 trays (length = 30 cm, width = 27 cm and depth = 11 cm) each containing 4 kg soil mix (2.5 parts potting soil, 2 parts peat vermiculite mix (Sunshine mix 1, SunGro Horticulture, Agawam, MA, USA) and 1 part quartz sand). The soil was hydrated to field capacity before sowing seeds onto the top layer of soil. Seeds were sprayed with water using a spray canister until well moistened, followed by an additional spray with 0.114% (w/v) phostrogen (Bayer, Leverkusen, Germany) to further aid seed germination. Trays were covered with plastic wrap to prevent moisture loss and left to germinate under plant growth room conditions (16 h light and 8 h dark, temperature of 25 °C, relative humidity of 45–50% and light intensities ranging from 135–150 μmol·m−2·s−1) for one week before the plastic wrap was removed. Following one week of germination, tef plantlets were watered twice weekly to allow adequate plant growth and development for at least 6 weeks before imposing dehydration stress. Plants were fertilised twice with 0.114% (w/v) phostrogen during the plant growth period before initiating stress treatment.

2.2. Sampling and Dehydration Stress Treatment

Prior to initiating dehydration stress, six week-old tef plants were moved to a plant growth chamber (Percival Intellus control system) and incubated under controlled conditions of 25 °C, 14 h day with light intensities of approximately 153–163 μmol·m−2·s−1; 17 °C, 10 h night. During a 10-day acclimation period, tef plants were watered every 2 days with 500 mL water. Subsequent to acclimation, dehydration stress was imposed by withholding water for a period of 20 days from 3 trays of tef plants designated D1 to D3 (Dehydrated experimental biological repeats), while the remaining 3 trays designated H1 to H3 (Hydrated control biological repeats) were maintained hydrated by addition of 500 mL water every second day. Previous experiments had established that each tray contained sufficient material to act as a biological repeat of pooled plants for all further testing. Leaf tissues were sampled at regular intervals for determination of water content and for physiological and proteome investigations outlined below. Following the 20-day dehydration treatment, trays D1-D3 were rehydrated with 500 mL water to observe tef plant recovery. At each sampling time point during dehydration, tef leaf material (randomly selected) was flash frozen in liquid nitrogen and stored at −80 °C until further use in total protein extractions and biological validation procedures.

Absolute Water Content (AWC) and Relative Water Content (RWC) Determination

Leaf AWC and RWC measurements were determined for six randomly sampled leaves from D1–D3 and H1–H3 according to the standard protocol: AWC (gH2O·gdw−1) = (fresh weight − dry weight)/dry weight; RWC (%) = (AWCsample/AWCfull turgor) × 100, where AWCfull turgor was determined by floating leaves in water in the dark for 24 h for maximal water uptake.

2.3. Electrolyte Leakage

The rate of electrolyte leakage from leaves of tef plants during dehydration stress was measured using a CM 100-2 Multiple Cell Conductivity Meter (Reid & Associates, Durban, South Africa). Leaves (n = 3) were sampled from D1–D3 replicate trays, cut into 1.5 cm long segments and placed in separate wells. In addition, 1.5 mL ultrapure water was added to each well and conductivity was measured immediately and subsequently every min over a 20 min period. Leaf samples were then oven dried (70 °C for 48 h) to obtain leaf dry mass. The rate of electrolyte leakage was calculated by plotting the change in electrolyte leakage values over time and used in the following equation: rate of leakage/ dry weight of leaf segments, where the rate of leakage was expressed as μS∙min−1∙gdw−1.

2.4. Chlorophyll Fluorescence

Chlorophyll fluorescence measurements were performed according to Maxwell and Johnson [40] using a portable PAM-2100 Chlorophyll fluorometer (Walz, Effeltrich, Germany). Approximately three tef leaves were aligned in order to cover the area of the dark adaption clips (4 mm in diameter). Leaves were dark-adapted for 15 min before maximum quantum yield of photosystem PS II (Fv/Fm) values were calculated using the standard formula: Fv/Fm = (FmF0)/Fm, where Fm is the maximum fluorescence yield of PS II after a saturating light pulse and F0 is the baseline fluorescence of dark adapted leaves. Chlorophyll fluorescence measurements were performed in triplicate on plants from each of the replicate trays D1-D3.

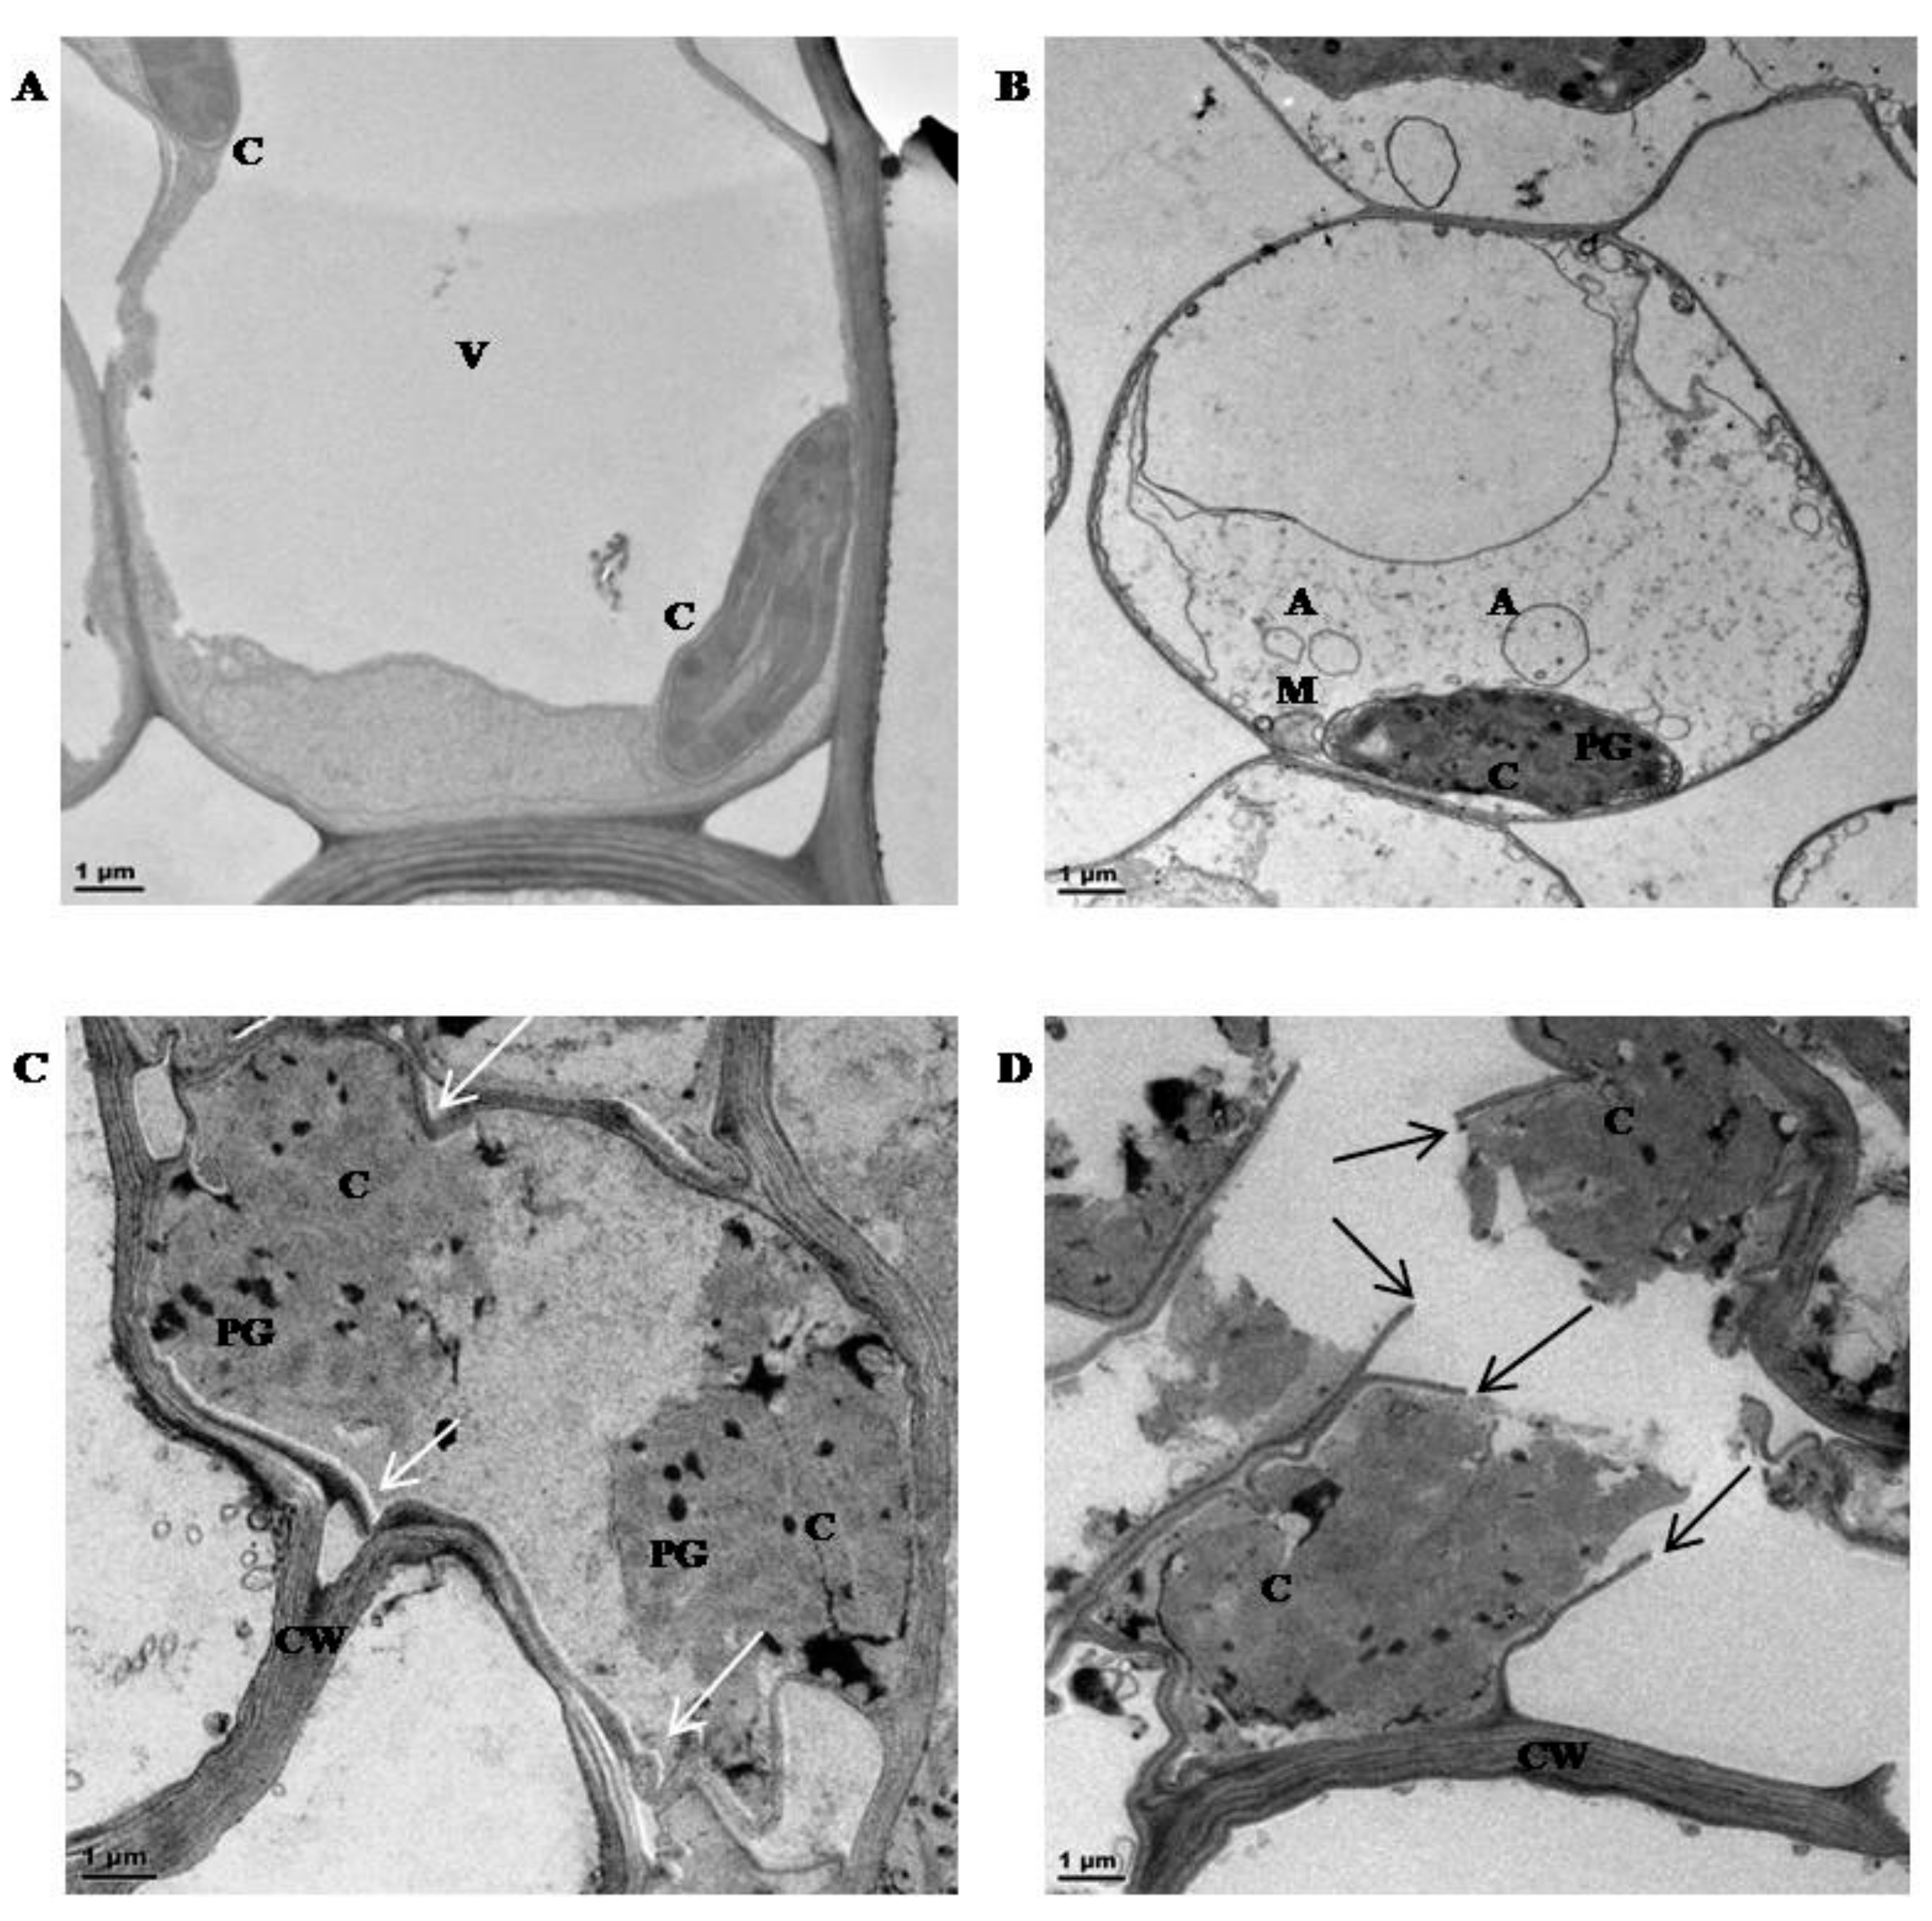
2.5. Transmission Electron Microscopy (TEM)

The ultrastructure of leaf mesophyll cells situated immediately above the basal meristem was examined at various stages of dehydration. This zone was selected as this tissue is most likely to retain viability relative to older and thus more naturally senescent leaf tips. A band of tissue one cm from the leaf base was removed from randomly selected leaves from three plants and these were further dissected into smaller segments (1–2 mm). These were fixed and embedded according to the method of Sherwin and Farrant [41]. Embedded samples were sectioned at 95 nm using a Diatome diamond knife (Diatome, Nidau, Switzerland) on a Reichert Ultracut S Ultra-microtome (Leica, Wien, Austria) and mounted onto copper grids. Sections were stained with uranyl acetate and lead citrate as described by Reynolds [42] for 10 min each before being viewed with a FEI Tecnai T20 microscope (Thermo Fisher Scientific, Waltham, MA, USA).

2.6. Plant Protein Material and iTRAQ Experimental Design

Leaf tissues harvested at full turgor (80% RWC) and dehydrated to 50% RWC were utilized for protein extraction and used in an 8-plex iTRAQ analysis as described in Figure S1. Three biological replicates of each treatment (hydrated control and dehydrated to 50% RWC) as well as two labels used for internal controls were subjected to the protein preparation procedures according to Figure S1.

2.7. Protein Extraction and Quantification

Total leaf proteins were extracted according to the method of Isaacson, et al. [43] with a few modifications. Leaf tissue, to which 1% (w/w) insoluble polyvinylpolypyrrolidone (PVPP) was added, was ground in liquid nitrogen and aliquoted into 2 mL centrifuge tubes. Ice-cold extraction buffer (0.7 M sucrose, 0.1 M KCl, 0.5 M Tris-HCl, pH 7.5, and 50 mM EDTA) to the volume of 1 mL together with 1 mL Tris (0.5 M, pH 8.0)-saturated phenol was added to samples and mixed by vortexing for 15 min at 4 °C, followed by centrifugation at 12,000× g for 10 min at 4 °C to allow phase separation. A protease inhibitor tablet (1 Roche Complete Mini tablet per 50 mL volume of extraction buffer) and the reducing reagent dithiothreitol (DTT) as well as serine protease inhibitor phenylmethylsulfonyl fluoride (PMSF) was added to the extraction buffer (just before use) at a final concentration of 2% (w/v) and 1 mM, respectively. Subsequent to phase separation, the upper phenolic phase containing all phenol soluble protein was collected and re-extracted with an equal volume of extraction buffer using the same mixing and centrifugation conditions described above. Proteins were precipitated by addition of 5 volumes (relative to that of the collected phenolic phase) of cold 0.1 M ammonium acetate in methanol followed by incubation at −20 °C for 16 h. Protein pellets were recovered by centrifugation at 12,000× g for 15 min at 4 °C and washed once with 1 mL 100% methanol at 12,000× g for 5 min at 4 °C and once with 80% (v/v) acetone, before being air-dried under a fume hood for 5 min. Protein sample re-suspension occurred in 2% (w/v) sodium dodecyl sulfate and was mixed by vortexing for 15 min at room temperature. Additionally, samples were placed on a heating block at 90 °C for 3–5 min to facilitate dissolving of the pellet. Proteins were quantified using the Pierce BCA protein assay kit (Thermo Fisher Scientific, Waltham, MA, USA) according to the manufacturer’s instructions and concentrations determined via a standard curve with bovine serum albumin as a standard.

2.8. Protein Preparation and Tryptic Digests

The filter assisted sample preparation procedure (FASP) was used as described in Wisniewski, et al. [44]. A starting protein concentration of 300 μg per sample was utilised, to which 0.1 volumes of 50 mM Tris (2-carboxylethyl)-phosphine hydrochloride (TCEP) was added, followed by incubation on a heating block at 60 °C for 1 h to reduce cysteine disulphide bonds. The reduced protein samples were transferred to a 30 kDa molecular weight cut off centrifugal Amicon filter (Merck, Darmstadt, Germany) and volumes were reduced to 30 μL by centrifugation at 10,000× g. To block cysteine residues, samples were incubated in 100 μL of 8 M urea in 0.5 M triethylammonium bicarbonate (TEAB), pH 8.5 containing 15 mM methyl methanethiosulfonate (MMTS) at room temperature for 15 min. Subsequently, four washes with 8 M urea in 0.5 M TEAB were performed to reduce the concentration of SDS, followed by two washes with 0.5 M TEAB to reduce the concentration of urea to an acceptable level (approximately 1 M). For digestion of protein to peptides, proteomics-grade modified trypsin (Trypsin Gold, mass spectrometry grade, Promega, Madison, WI, USA) in 40 μL of 0.5 M TEAB was added to samples at a trypsin: protein ratio of 1:100 (v/v). Tryptic digests were allowed to proceed for 16 h at 37 °C in a temperature incubator under sealed air-tight conditions to prevent evaporation. Subsequent to incubation, protein digests were collected through centrifugation at 10,000× g and concentrated down to 20 μL using a Savant SC110 Speed-Vac (Thermo Fisher Scientific, Thermo Fisher Scientific, Waltham, MA, USA).

2.9. iTRAQ Labelling

For labelling of digested peptide, an 8-plex iTRAQ system was used (AbSciEx, Foster City, CA, USA), where the iTRAQ tags (113, 114, 115, 116, 117, 118, 119 and 121) were used according to Figure S1. The labels were reconstituted with proteomics grade isopropanol and added to each sample, mixed by vortexing and left to incubate at room temperature for 2 h. Subsequent to labelling, the contents for each labelled peptide sample were pooled together and reduced to approximately 30 μL by vacuum concentration before for de-salting and purification on Pierce C-18 Spin Columns (Thermo Fisher Scientific, Waltham, MA, USA) according to the manufacturer’s guide. The purified peptide samples were then dried by vacuum concentration and subjected to OFFGEL fractionation.

2.10. Peptide Purification and OFFGEL Fractionation

For separation of labelled peptide samples according to their isoelectric points (pI), the 3100 OFFGEL fractionator (Agilent Technologies Santa Clara, CA, USA) with a 12-well setup was used. Dry peptide samples were dissolved in 1.25X peptide OFFGEL rehydration solution 6% (v/v) glycerol, 1.25% (v/v) carrier ampholytes, at pH 3-10 (Sigma, St. Louis, MO, USA) and loaded onto 13 cm immobilized pH gradient (IPG) strips (GE Healthcare, Little Chalfont, UK), with a linear pH 3–10 range, previously rehydrated with 1.25X peptide OFFGEL rehydration solution according to the Agilent 3100 Quick Start Guide. Peptide electro-focusing was then performed using the pre-loaded OGPE12 program for peptide fractionation until a voltage of 20 kV∙h−1 was reached. After electro-focusing, fractions were collected and purified using C-18 columns as described above to remove all traces of glycerol and contaminating substances and re-quantified in preparation for analysis by ESI-Q-tof-MS/MS mass spectrometry.

2.11. Mass Spectrometry Settings

MS/MS analysis was carried out on the purified peptide fractions using an Agilent 6530 quadrupole-time of flight (Q-TOF) mass spectrometer fitted with a Polaris HR 3 μm C18 high pressure liquid chromatography (HPLC)-Chip Cube source (Agilent Technologies Santa Clara, CA, USA). The chip was equipped with a 75 μm × 150 mm analytical column and a 360 nL Zorbax enrichment column connected online to the HPLC (1200 Series nanoflow) via an orthogonal spray (HPLC-Chip/MS interface, Agilent Technologies Santa Clara, CA, USA). Peptide samples (2 μg) in 1% (v/v) acetonitrile (ACN) and 0.1% (v/v) formic acid (FA) were loaded onto the column and separation was achieved through the mobile phases A (1% (v/v) ACN, 0.1% (v/v) FA) and B (90% (v/v) ACN, 0.1% FA) during a 1 h increasing gradient. The flow rate was constant at 1.6 μL∙min−1. The mass spectrometer was run in positive ion mode, with MS scans running over a range of m/z 200 to 1700 at a rate of seven spectra∙sec−1. MS/MS scans were run over a range of m/z 90 to 1700 at a scan rate of 2.50 spectra∙sec−1 and a narrow (~1.3 amu) isolation width. Precursor ions were selected for auto MS/MS at an absolute threshold of 1000 and a relative threshold of 0.001, with a maximum of ten precursors per cycle, and active exclusion set at 1 spectrum and released after 1.5 min. Precursor charge-state selection and preference was set to 2+, 3+, and >3+, and precursors were sorted by abundance only.

2.12. Mass Spectra Data Preparation

The raw mass spectra data files (d format) were firstly converted to mzML format followed by conversion to mgf file formats, using the open source software, MSConvert available from the ProteoWizard version 1.6.0 package [45]. Files were imported into PEAKS Studio version 6.0 (Bioinformatics Solutions Inc., Waterloo, ON, Canada) and the ‘data refine’ tool with default parameters (parent ion m/z tolerance at 0.1, retention time tolerance window of 30 s, precursor charge correction, no merged scans and no filtering) was used to produce improved fragmentation, better signal-to-noise ratio and enhance reporter ion intensities.

2.13. Database Selection and Searching

The Tef Extended (TE) transcriptome database converted to protein sequences in FASTA format, available from the Tef Improvement Project (accessed in August 2013; [18]), was used to match protein sequences to the iTRAQ generated mass spectra. In addition, tef proteins were searched against the Liliopsida (all monocotyledonous plants) database available from UniProtKB SwissProt/TREMBL. Database searching was employed with the following parameters (parent mass error tolerance of 20.0 ppm, fragment mass error tolerance of 0.1 Da, pre-cursor mass search type set as monoisotopic, selection of trypsin as enzyme used, maximum missed cleavages per peptide set at 2, fixed modifications set at iTRAQ 8-plex (K, N-term) and beta-methylthiolation, variable modifications set at iTRAQ 8-plex (Y) and Oxidation (M) with max variable post translational modification (PTM) per peptide set at 3. A concatenated decoy database was automatically generated by PEAKS Studio 6.0 when searches were implemented and further used to determine false discovery rates Quantification results were filtered to false discovery rate (FDR < 0.01; peptide and protein -10logP score > 20) and only considering proteins with 2 unique peptides.
The mass spectrometry proteomics data have been deposited to the ProteomeXchange Consortium [46] via the PRIDE [47] partner repository with the dataset identifier PXD007907.

2.14. iTRAQ Data Processing—Protein Quantitation and Statistical Analysis

iTRAQ data was manually edited and refined before being statistically analysed as shown in Figure S2.

2.14.1. Data Refinement

Data refinement was conducted as follows: firstly, the peptide output list generated from PEAKS database searching was used, where the list of peptides corresponds to the proteins identified from database searching with appropriate FDRs and threshold scores (−10logP scores). Secondly, using a BioPerl script [48], peptides with only 1 or 2 expression values present (of the 3 for each treatment) in the labelled channels (115 to 121) were removed. Peptides with a zero value were kept if the zero values were found consecutively in the hydrated (115–117) or dehydrated (118–121) labelled channels, respectively. Values of zero in the labelled channels 113 and 114, used as internal controls to observe technical variance between samples, were also retained. In order to avoid problems with numerical computations in the downstream analysis, the remaining zeros were changed to 1 (excluding labelled channels 113 and 114). These changes resulted in a refined peptide list with non-normalised quantitative expression values (Figure S2A). Thirdly, quantile normalisation was employed using the R-Bioconductor program [49], for normalisation of peptide quantitative expression data (Figure S2B).

2.14.2. protViz: For Visualising and Analysis of Proteomic Mass Spectrometry Data

To observe whether peptide intensities were in an acceptable format for statistical analysis, the normalised peptide list was then transformed using an inverse hyperbolic sine function (arcsinh) (Figure S2B,C) and statistically analysed using the R-Bioconductor program with the protViz package [50]. Subsequent to normalisation and transformation, peptide quantitative expression data was laid out in a two-group comparison manner using the ‘iTRAQ two-group analysis’ function in protViz. In this comparison, the expression values from the labelled channels were placed in two groups, whereby group 1 consisted of all the hydrated labelled channels (115–117) and group 2 consisted of all the dehydrated labelled channels (118–121). The averaged quantitative expression values were then calculated from each group and used in the ‘two-group’ comparison. Statistical testing was performed through an independent samples t-test (unpaired) that assigns a p-value to each individual peptide identity and tests for a significant difference (p-value ≤ 0.05) through the two-group comparison test between hydrated (control) and dehydrated (experimental) quantitative expression values (Figure S2D). While the analysis was performed on each individual peptide identity, the output was given in such a manner that statistical significance for change in quantitative expression is observed in protein form. Thus, the peptides corresponding to the designated proteins were then stacked together through a ‘weighted sum’ approach to provide the overall change in quantitative expression between individual proteins (Figure S2E).

2.15. Western Blot Analyses

For confirmation of protein presence, tissues at RWCs similar to those used in iTRAQ analysis (Figure S1) were chosen, viz. 92% RWC (as a hydrated-control) and 55%, 52% and 50% RWC (as dehydrated-experimental repeats, designated D1, D2 and D3, respectively). These were subjected to PAGE separation and subsequent Western blot analyses using commercial polyclonal antibody against fructose-bisphosphate aldolase (As08294, Agrisera, Vännäs, Sweden) for immunodetection and quantification. Total protein extracts (15 μg) and Fermentas molecular weight marker (Thermo Fisher Scientific, Waltham, MA, USA) were loaded onto 12% SDS polyacrylamide gels and subjected to 1D-PAGE separation at a constant voltage of 100 V for 2 h before transfer of proteins to pure nitrocellulose membranes (Pall Life Sciences, Port Washington, NY, USA) at 100 V for 1 h at 4 °C. Probing with primary antibodies occurred at a dilution ratio of 1:5000 for FBA for 16 h at 4 °C before incubation with goat anti-rabbit peroxidase conjugated secondary antibody (Agrisera, AS09 602) at a dilution of 1:5000 for 1 h at 4 °C. Detection and visualisation of protein expression was initiated using the WesternBright ECL HRP chemiluminescent detection kit (Advansta, Menlo Park, CA, USA) according to the manufacturer’s instructions. Images were visualised by chemiluminescence using the ChemiDoc™ XRS imager installed with ImageLab software version 4.1 (Biorad, Hercules, CA, USA) where the relative quantification of detected protein band intensities were made relative to the hydrated-control. A one-way ANOVA statistical test was performed with the relative quantification values in Graph Pad Prism 6.0, (La Jolla, CA, USA) where significance was based on p-value (p-value < 0.05).

2.16. Enzyme Assays

For testing of enzyme activities, leaf tissues in the RWC ranges: 90–95%, 75–80%, 60–65%, 50–55%, 35–40% and 25–30% RWC, were selected and assayed using spectrophotometric methods (described below). Prior to enzyme assay procedures, the total protein content of all extracted samples were determined using the Bradford assay at 595 nm following the manufacturer’s instructions (Quick Start Bradford Protein Assay, Biorad, Hercules, CA, USA). GraphPad Prism 6.0 software was used for graph generation and statistical analysis by one-way ANOVA, where significance was based on the p-value (p-value < 0.05) of changing enzyme activities at differing RWC ranges.

2.16.1. Monodehydroascorbate Reductase (MDHAR, EC: 1.6.5.4)

Enzyme extraction was performed according to Valyova et al. [51] before de-salting on a PD-10 de-salting column (GE Healthcare, Little Chalfont, UK) following the manufacturer’s instructions. MDHAR enzyme activity was determined as originally described by Miyake and Asada [52] and further employed by Kingston-Smith and Foyer [53], by following the decrease in absorbance at 340 nm due to the oxidation of NADH. Total enzyme activity was calculated using the extinction coefficient of NADH (6.22 mM−1·cm−1) and measuring the rate of change over time, while specific activity was given as enzyme units∙min−1∙mg protein−1.

2.16.2. Fructose-Bisphosphate Aldolase (FBA, EC: 4.1.2.13)

Extraction and analysis of FBA enzyme activity was performed according to [54] with modifications. Approximately 0.25 g leaf tissue was ground in liquid nitrogen to a fine powder and 0.2% (w/w) insoluble PVPP was added. In addition, 2.5 mL extraction buffer (0.05M KH2PO4 buffer, pH 7.0, 4 mM MgCl2, 1 mM EDTA, 10% (v/v) glycerol, 5 mM dithiothreitol (DTT)) was added to ground material and mixed by vortexing before centrifugation at 12,000× g at 4 °C. The resulting supernatant was passed through a PD-10 de-salting column and quantified for total protein concentration. FBA enzyme activity was measured in a combined reaction with glycerol-3-phosphate dehydrogenase (G-3-P) (EC: 1.1.1.8, Sigma, St. Louis, MO, USA) and triose-phosphate-isomerase (T-P-I) (EC: 5.3.1.1, St. Louis, MO, USA) in the forward reaction at 22 °C by observing the decrease in absorbance at 340 nm due to the oxidation of NADH. A reaction mixture of 1 mL containing (50 mM Hepes-KOH buffer, pH 7.3, 0.1 mM NADH, 1 mM EDTA, 0.75 units G-3-P and 10 units T-P-I) was reconstituted and sample extract (100 μL) was added. To start the reaction, 4 mM fructose-bisphosphate (Sigma-Aldrich, Inc.) substrate was added and total enzyme activity was calculated by measuring the rate of change over time using the extinction coefficient of NADH (6.22 mM−1·cm−1). One unit of activity was defined as the amount of enzyme required for the oxidation of 2 μMol NADH at 22 °C and specific activity was given by enzyme units∙min−1∙mg protein−1.

2.16.3. Peroxidase (POX, EC: 1.11.1.7)

Extraction and assay of total POX activity was performed according to [55], by the determining the rate of guaiacol oxidation [56]. Total enzyme activity was calculated by measuring the rate of change over time using the extinction coefficient of tetraguaiacol (26.6 mM−1·cm−1), where a unit of peroxidase activity was expressed as the amount of enzyme required to catalyse the conversion of 1 mMol H2O2, with guaiacol as hydrogen donor, per min under specified conditions, while specific activity was given as enzyme units∙min−1∙mg protein−1.

2.17. Blast2GO for Protein Identification, Annotation and Functional Enrichment Analysis

All proteins matched to the TE database (from here on referred to as the TE dataset) and the Liliopsida database (from here on referred to as the MU dataset) with PEAKS Studio 6.0 were annotated using Blast2GO version 2.8 [57]. Analysis included both the tef foreground (differentially regulated) and the tef background proteins (all proteins identified).

2.17.1. Protein Identification, Annotation and GO-Term Retrieval

To provide protein descriptions, the dataset (in FASTA format) was searched against the UNIPROTKB/SwissProt database using the BLASTP algorithm with the following parameters: report a maximum of twenty blast hits, with a blast expect value of 1e−3 and minimum high scoring segment pairs (HSPs) length equal to 33. FASTA sequences for the datasets were retrieved from either database using an in-house shell script written for extracting FASTA files. Subsequent to BLAST steps, the steps to mapping and annotation were initiated for GO-term retrieval using the Blast2GO default parameters (E-value filter if 1e−6, an hsp-hit coverage cut-off of 0, annotation cut-off of 55, and GO weight of 5) with the September 2014 database.

2.17.2. Functional Enrichment Analysis

Subsequent to tef protein annotation and classification, functional enrichment of GO-terms was initiated using the Fisher’s exact test for statistical significance [58] in Blast2GO. For input, both tef foreground and background annotation files were merged as one file (.annot), which was then used as a reference set. A list of protein identifiers containing individually named contigs from the foreground was used as a test set. For enrichment of up and downregulated proteins, the test set (foreground) was separated into two lists, one containing upregulated protein identifiers and the other containing downregulated protein identifiers. Fisher’s exact test was employed for up and downregulated proteins to show both over and under-represented GO-terms. A two-sided Fisher’s exact test, using a term filter of 0.05 and term filter mode set as false discovery rate (FDR) with the removal duplicate IDs, was utilized. The graph generated to better display functional enrichment of GO-terms for tef foreground-upregulated proteins and tef foreground-downregulated proteins vs. tef background proteins was performed using GraphPad Prism 6.0 software.

3. Results

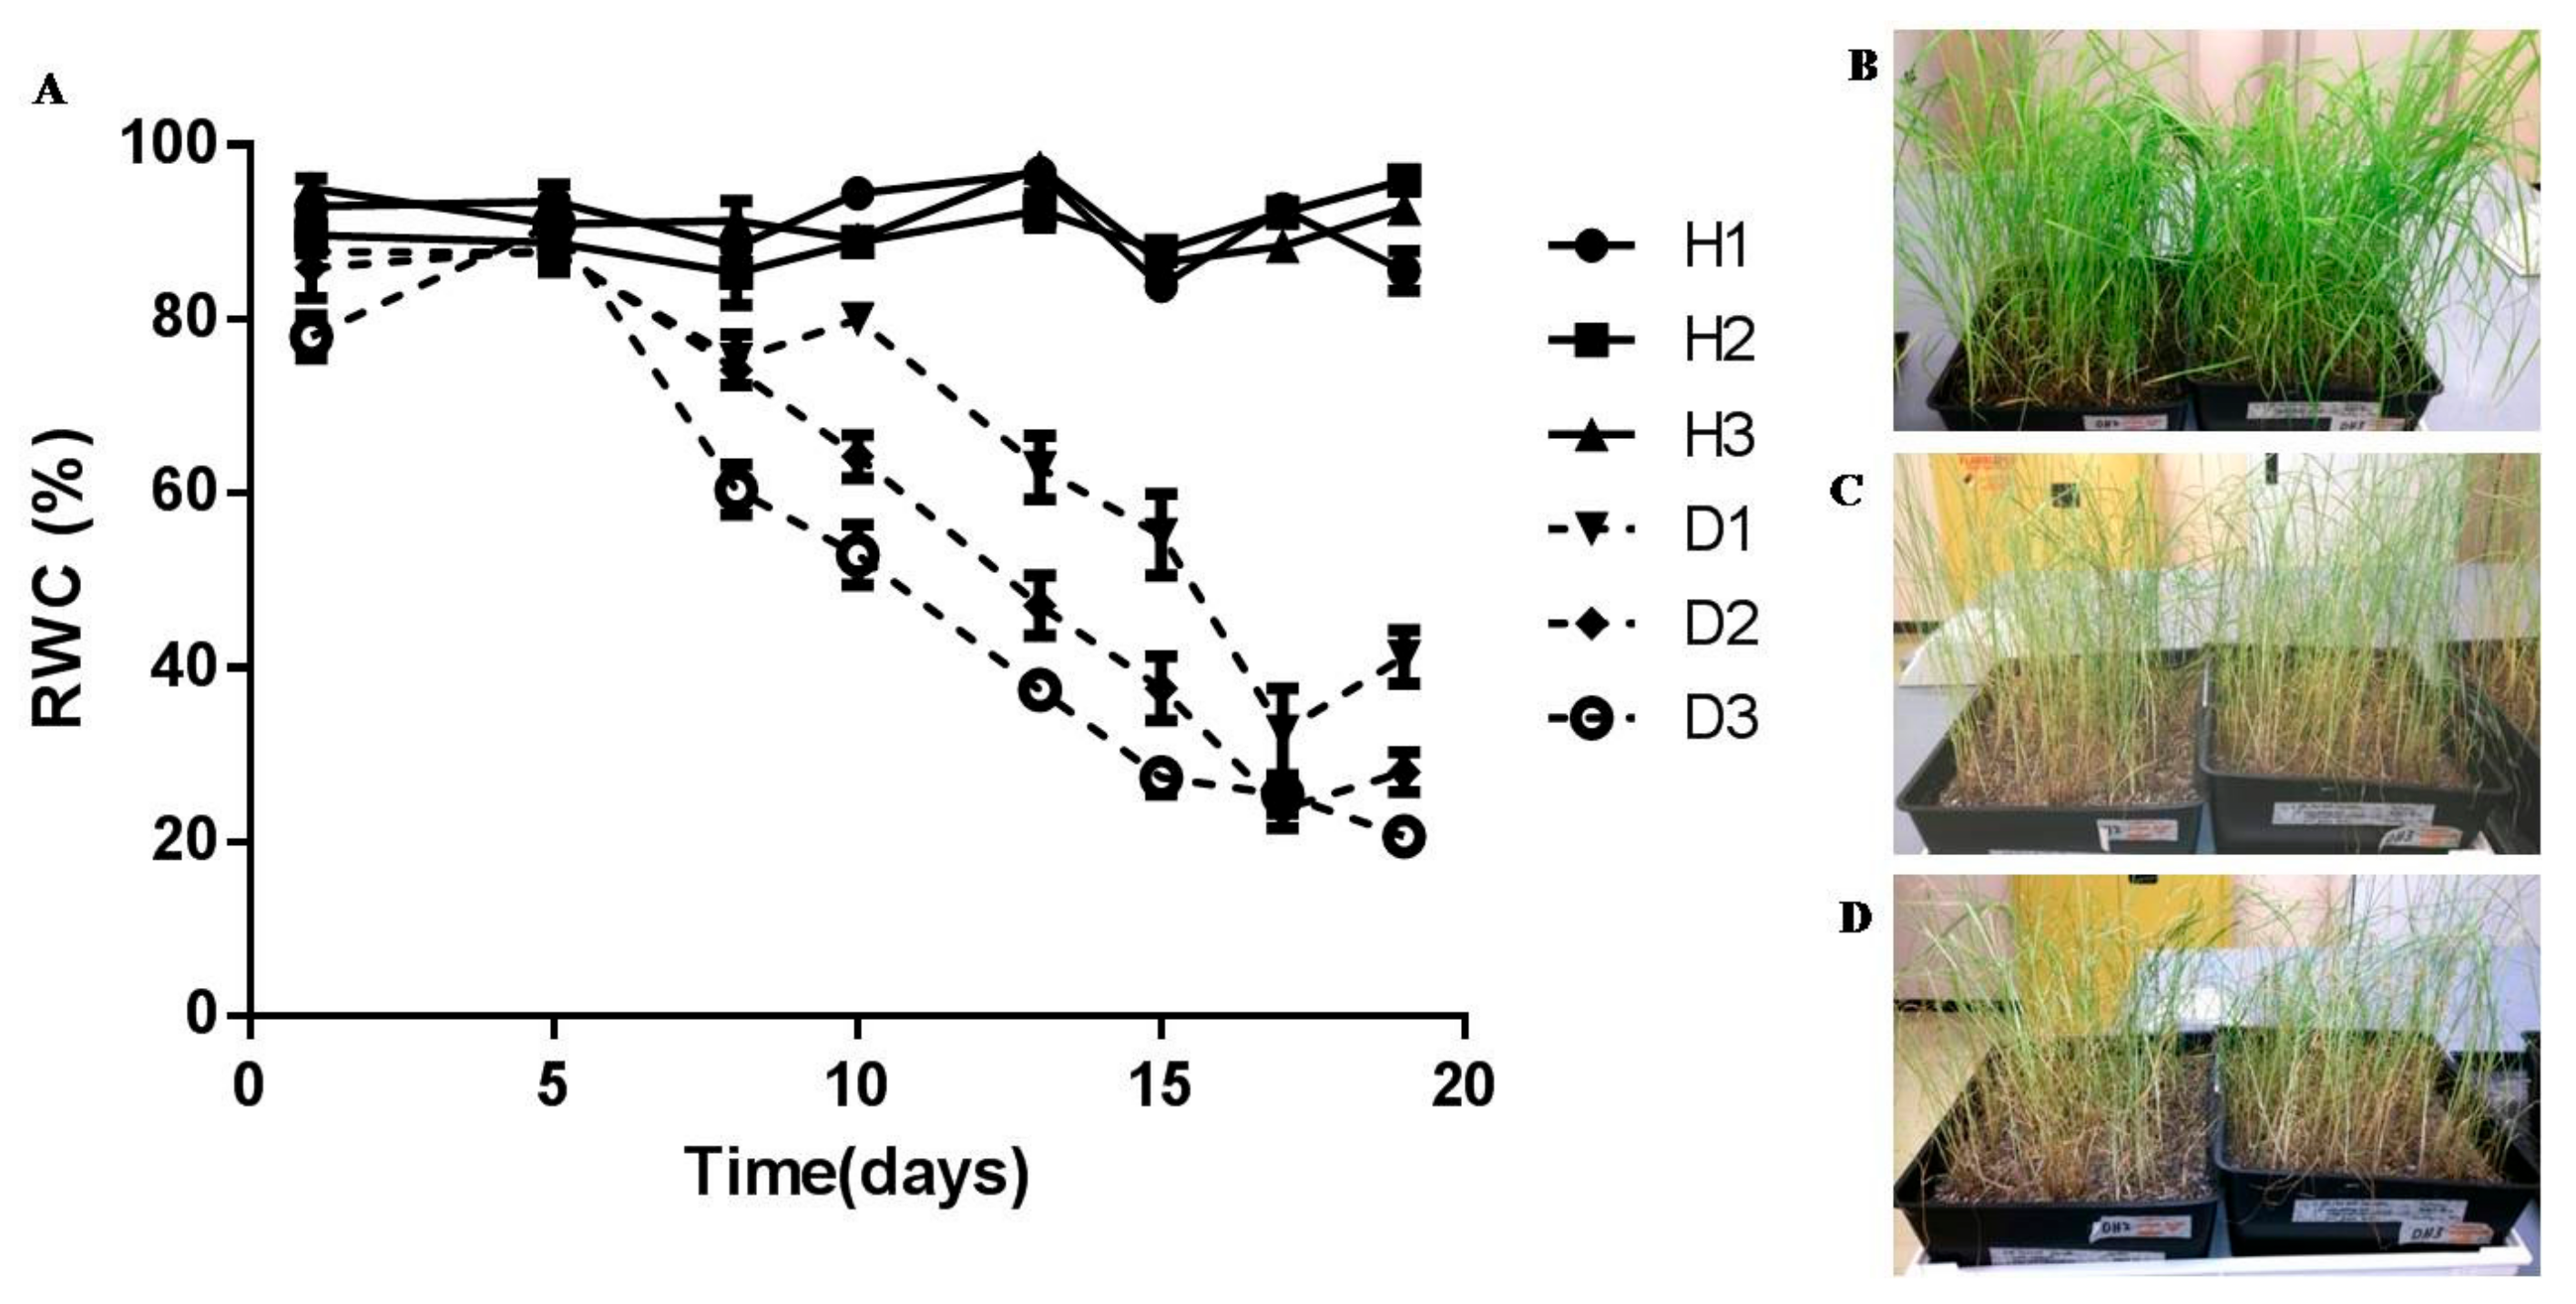
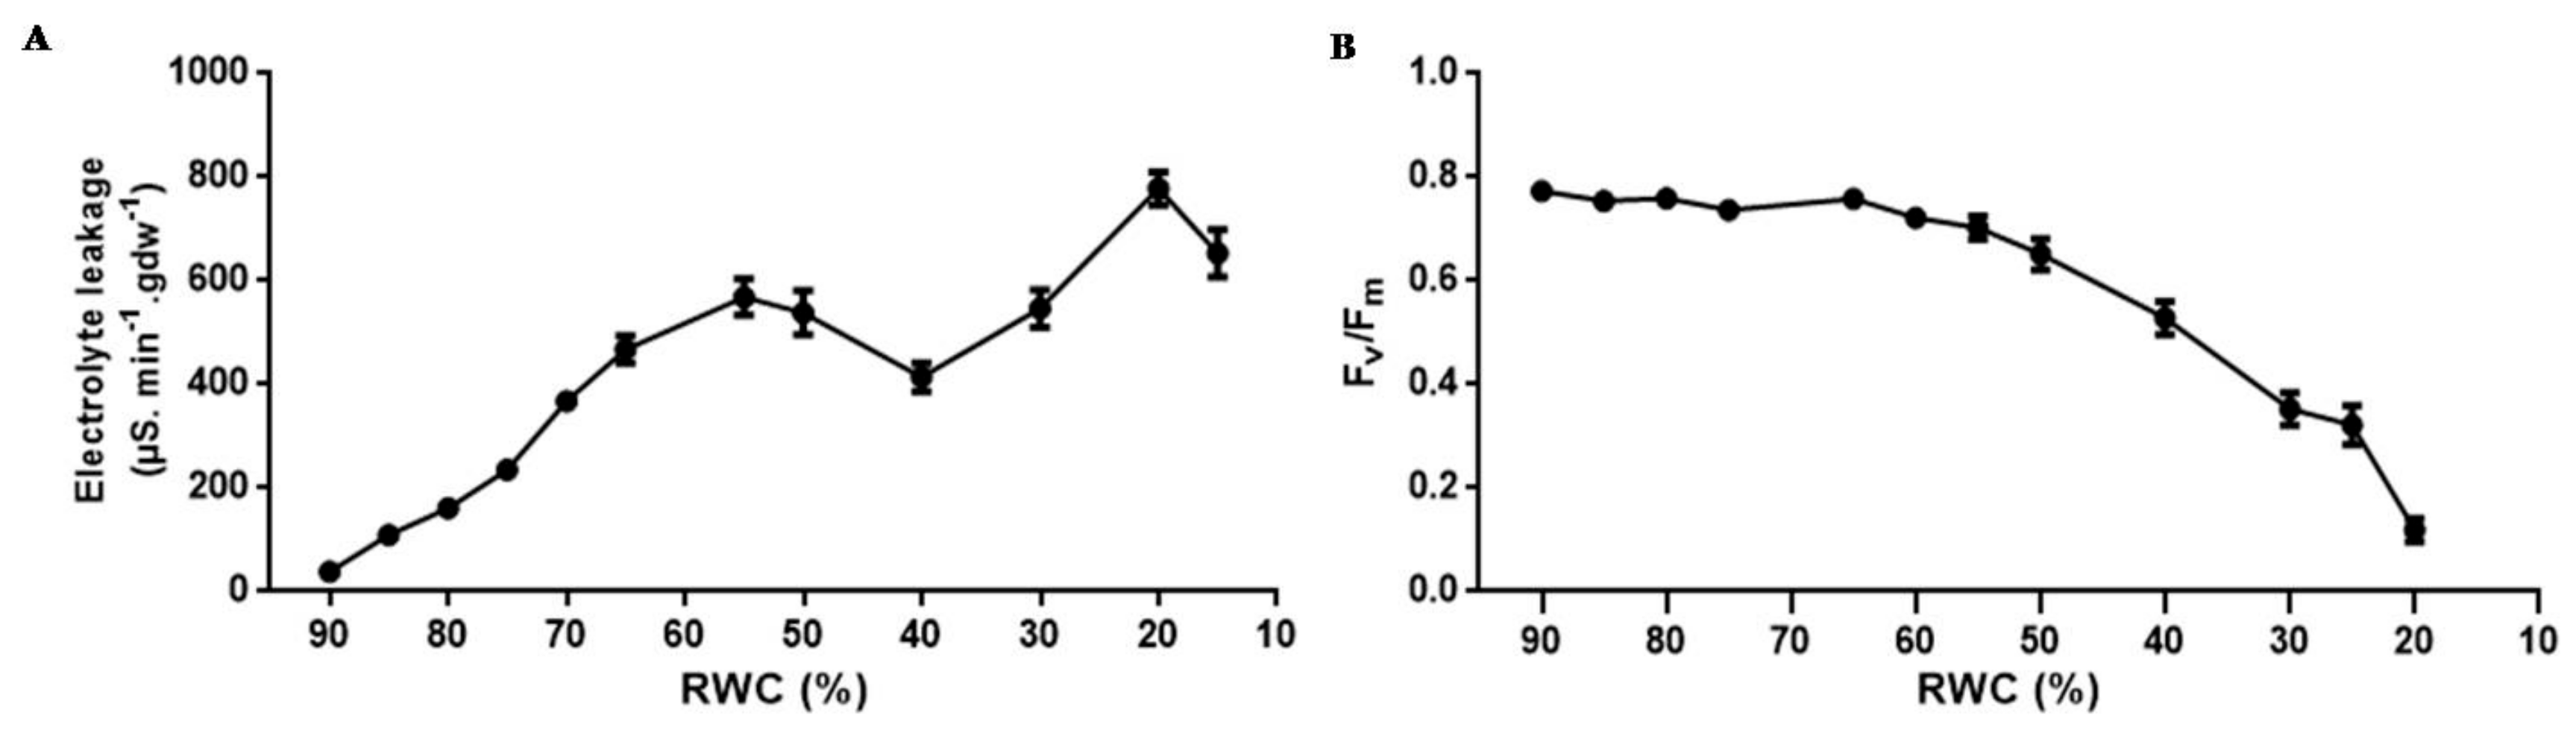
3.1. Physiological Characterisation

In order to determine critical water contents at which dehydration stress is invoked, tef plants were dehydrated over a period of 20 days and effects on leaf tissue membrane integrity and photosynthetic activity were determined. Leaves maintained a water content of between 80% and 90% RWC for six days before a gradual loss of water was observed, reaching 50% RWC by 13 days and circa 25% by 17 days after withholding water (Figure 1A). Plants were able to lose up to 65% of their water before loss of viability was observed based on previous dehydration treatments with tef plants (data not shown) and physiological characterisation procedures described below.
As water deficit in desiccation sensitive plants is known to affect membrane integrity, the effects of progressive dehydration on electrical conductivity (an indirect measure of plasmalemma integrity) and photosynthetic efficiency of photosystem II (Fv/Fm) was investigated (Figure 2). Upon dehydration, there was a progressive increase in electrolyte leakage with values reaching 570 μS∙min−1∙gdw−1 at 50% RWC with further increases occurring below this RWC reaching a maximum of 780 μS∙min−1∙gdw−1 at low tissue RWCs (Figure 2A). Fv/Fm was maintained at values of approximately 0.75% until 55% RWC, below which quantum efficiency of electron transport through PS II declined significantly (Figure 2B), suggesting shut down or progressive damage to the photosynthetic apparatus.
TEM investigations were conducted in order to assess ultra-structural changes in mesophyll cells during dehydration (Figure 3). Cells from hydrated tissues were typical of a metabolically active state with a large central vacuole and peripherally located organelles (Figure 3A). Dehydration to 50% RWC (Figure 3B) resulted in reduction in primary vacuolar area, some plasma membrane withdrawal, evidence of potential autophagosome formation and chloroplasts containing evidence of plastoglobuli formation. The formation of plastoglobuli are often indicative of desiccation stress [59]. Further dehydration to 30% RWC and below (Figure 3C,D) resulted in increased evidence of stress-induced injury, with compaction of organelles and evidence of cell wall folding (white arrows) and ultimately breakage (black arrows). These data suggest that under the experimental conditions utilized, six-week-old pre-flowering tef plants were able to survive dehydration to 50% RWC, below which there is increasing evidence of subcellular damage.

3.2. Tef Proteomic Analysis

iTRAQ was used to observe differential regulation of the tef proteome in response to dehydration to 50% RWC. Tef protein mass spectra were searched against the TE and Liliopsida databases using PEAKS studio 6.0 with more than two peptide matches. The generated peptide output was subjected to rigorous manual editing and filtering of data to reduce the occurrence of false positives (Figure S2) before proceeding to statistical analysis with protViz (see input File S1). A sanity check of theoretical quantiles plotted against the sample quantiles (Q-Q plots) showed intensities to be normally distributed after quantile normalisation (Figure S3) and a correlation test (cluster analysis) showed the respective reporter ion channels (113–121) to cluster according to experimental design (Figure S4).

Identification of Differentially Regulated Proteins

Through the use of protViz [50], a total of 211 out of 5727 identified proteins from the TE database (the TE dataset) were found to be differentially regulated, where 97 proteins were upregulated and 114 proteins were downregulated in response to dehydration stress (Table 1 and Table 2, respectively). These differentially regulated proteins in the TE dataset were categorised as significantly different in protein expression according to statistical testing using a p-value (p-value ≤ 0.05), while differentially regulated proteins showing largely significant changes in protein expression based on both fold change (values >2 and <0.5) and statistical testing using a p-value (p-value ≤ 0.05) are depicted in Table S1.
As the generated peptide output was used for quantification, the problem of protein inference (shared peptides) was addressed by using appropriate FDR thresholds. However, to further ensure that all proteins identified from the Tef database were valid entities, two additional differentially regulated datasets, the tef extended unique (TEU) and monocot unique (MU) datasets were generated based on peptides that were unique to those identified proteins.
For proteins matched against the TE database using unique peptides alone (TEU dataset), a total of 111 out of 2656 identified proteins were statistically significant with 44 upregulated proteins and 67 downregulated proteins (Tables S2 and S3, respectively). A significant proportion of proteins identified from the TE database were unidentifiable and did not have protein descriptions. Approximately 67% and 63% of proteins were annotated and identified with Blast2GO tools [57,60] for TE up and downregulated proteins, respectively (Table 1 and Table 2) and 72 and 63% of proteins had descriptions for TEU up and downregulated proteins, respectively (Tables S2 and S3). In addition, a number of proteins with the same protein description and quantification values are repeated within the TE dataset (Table 1 and Table 2, e.g., CL1Contig3395, CL1Contig3396, and CL1Contig3397 code for endoglucanase 7). These proteins may have arisen through alternative splicing and could be spliced variants of the same protein. In addition, a suitably large number of proteins were found to be commonly identified in both the TE (Table 1 and Table 2) and TEU datasets (Tables S2 and S3). To name a few: 40S ribosomal protein S28, fructose-bisphosphate aldolase, monodehydroascorbate reductase, gras family protein 2 and leucoanthocyanidin dioxygenase found in upregulated proteins (Table 1 and Table S2) and 2-methyl-6-phytyl-hydroquinone methyltransferase, chlorophyll a-b binding protein, alliin lyase 1, protein dek and polyamine oxidase found in downregulated proteins (Table 2 and Table S3). Furthermore, a number of interesting proteins were shown to have large increases in fold change, mainly gras family protein 2, monodehydroascorbate isoform 2, peroxidase 3-rare cold-inducible protein, poly polymerase, leucoanthocyanidin dioxygenase and cyclin-p4 (Table S1). These proteins and their roles in biological processes of interest are discussed later with the bioinformatic analyses.
For tef proteins matched against the Liliopsida database, using unique peptides alone, a total of 174 out of 4328 identified proteins were statistically significant with 85 upregulated and 89 downregulated proteins (Supplementary Tables S4 and S5, respectively). The text files of all identified proteins, box-plots and quality control figures for these protein datasets can be found under Supplementary Materials (Files S2–S4 referring to the TE, TEU and MU datasets, respectively).

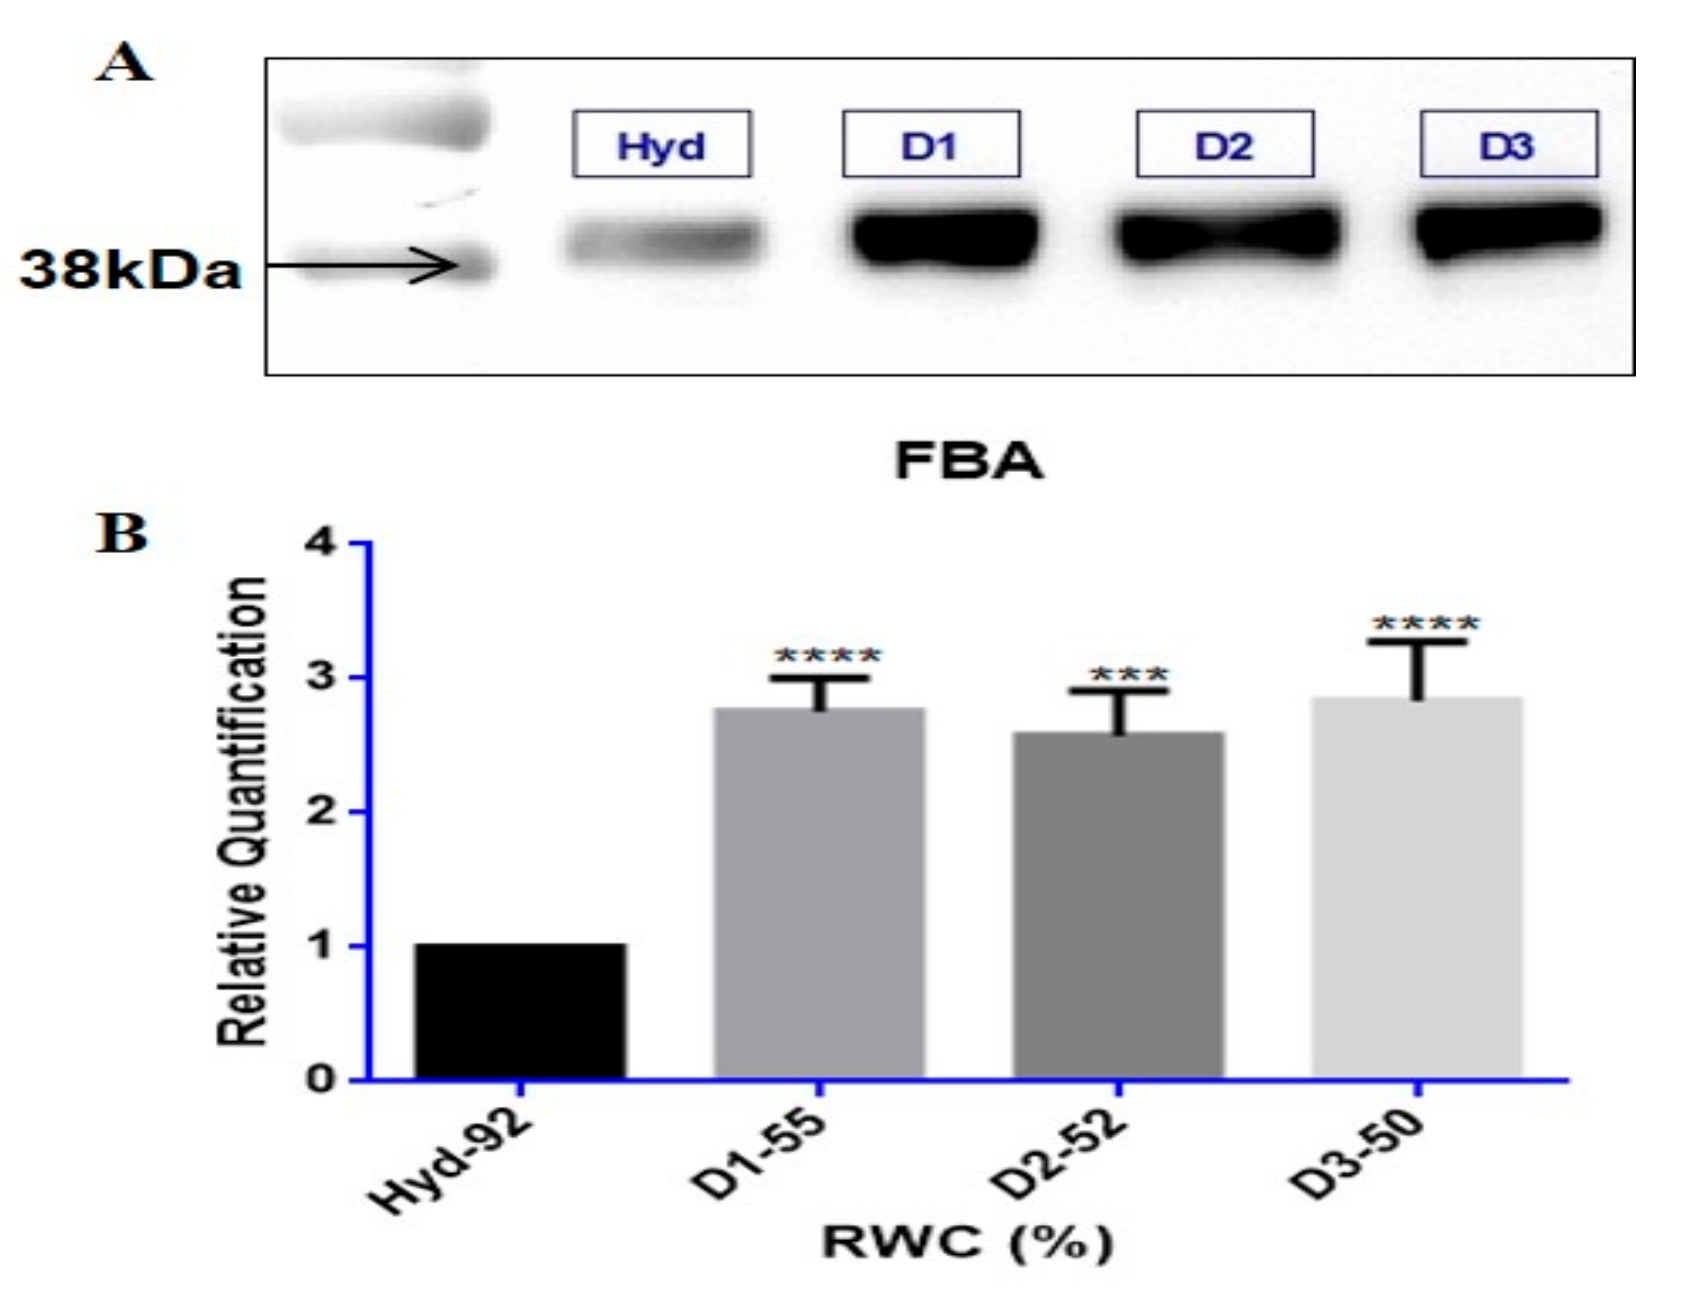
3.3. Tef Biological Validation

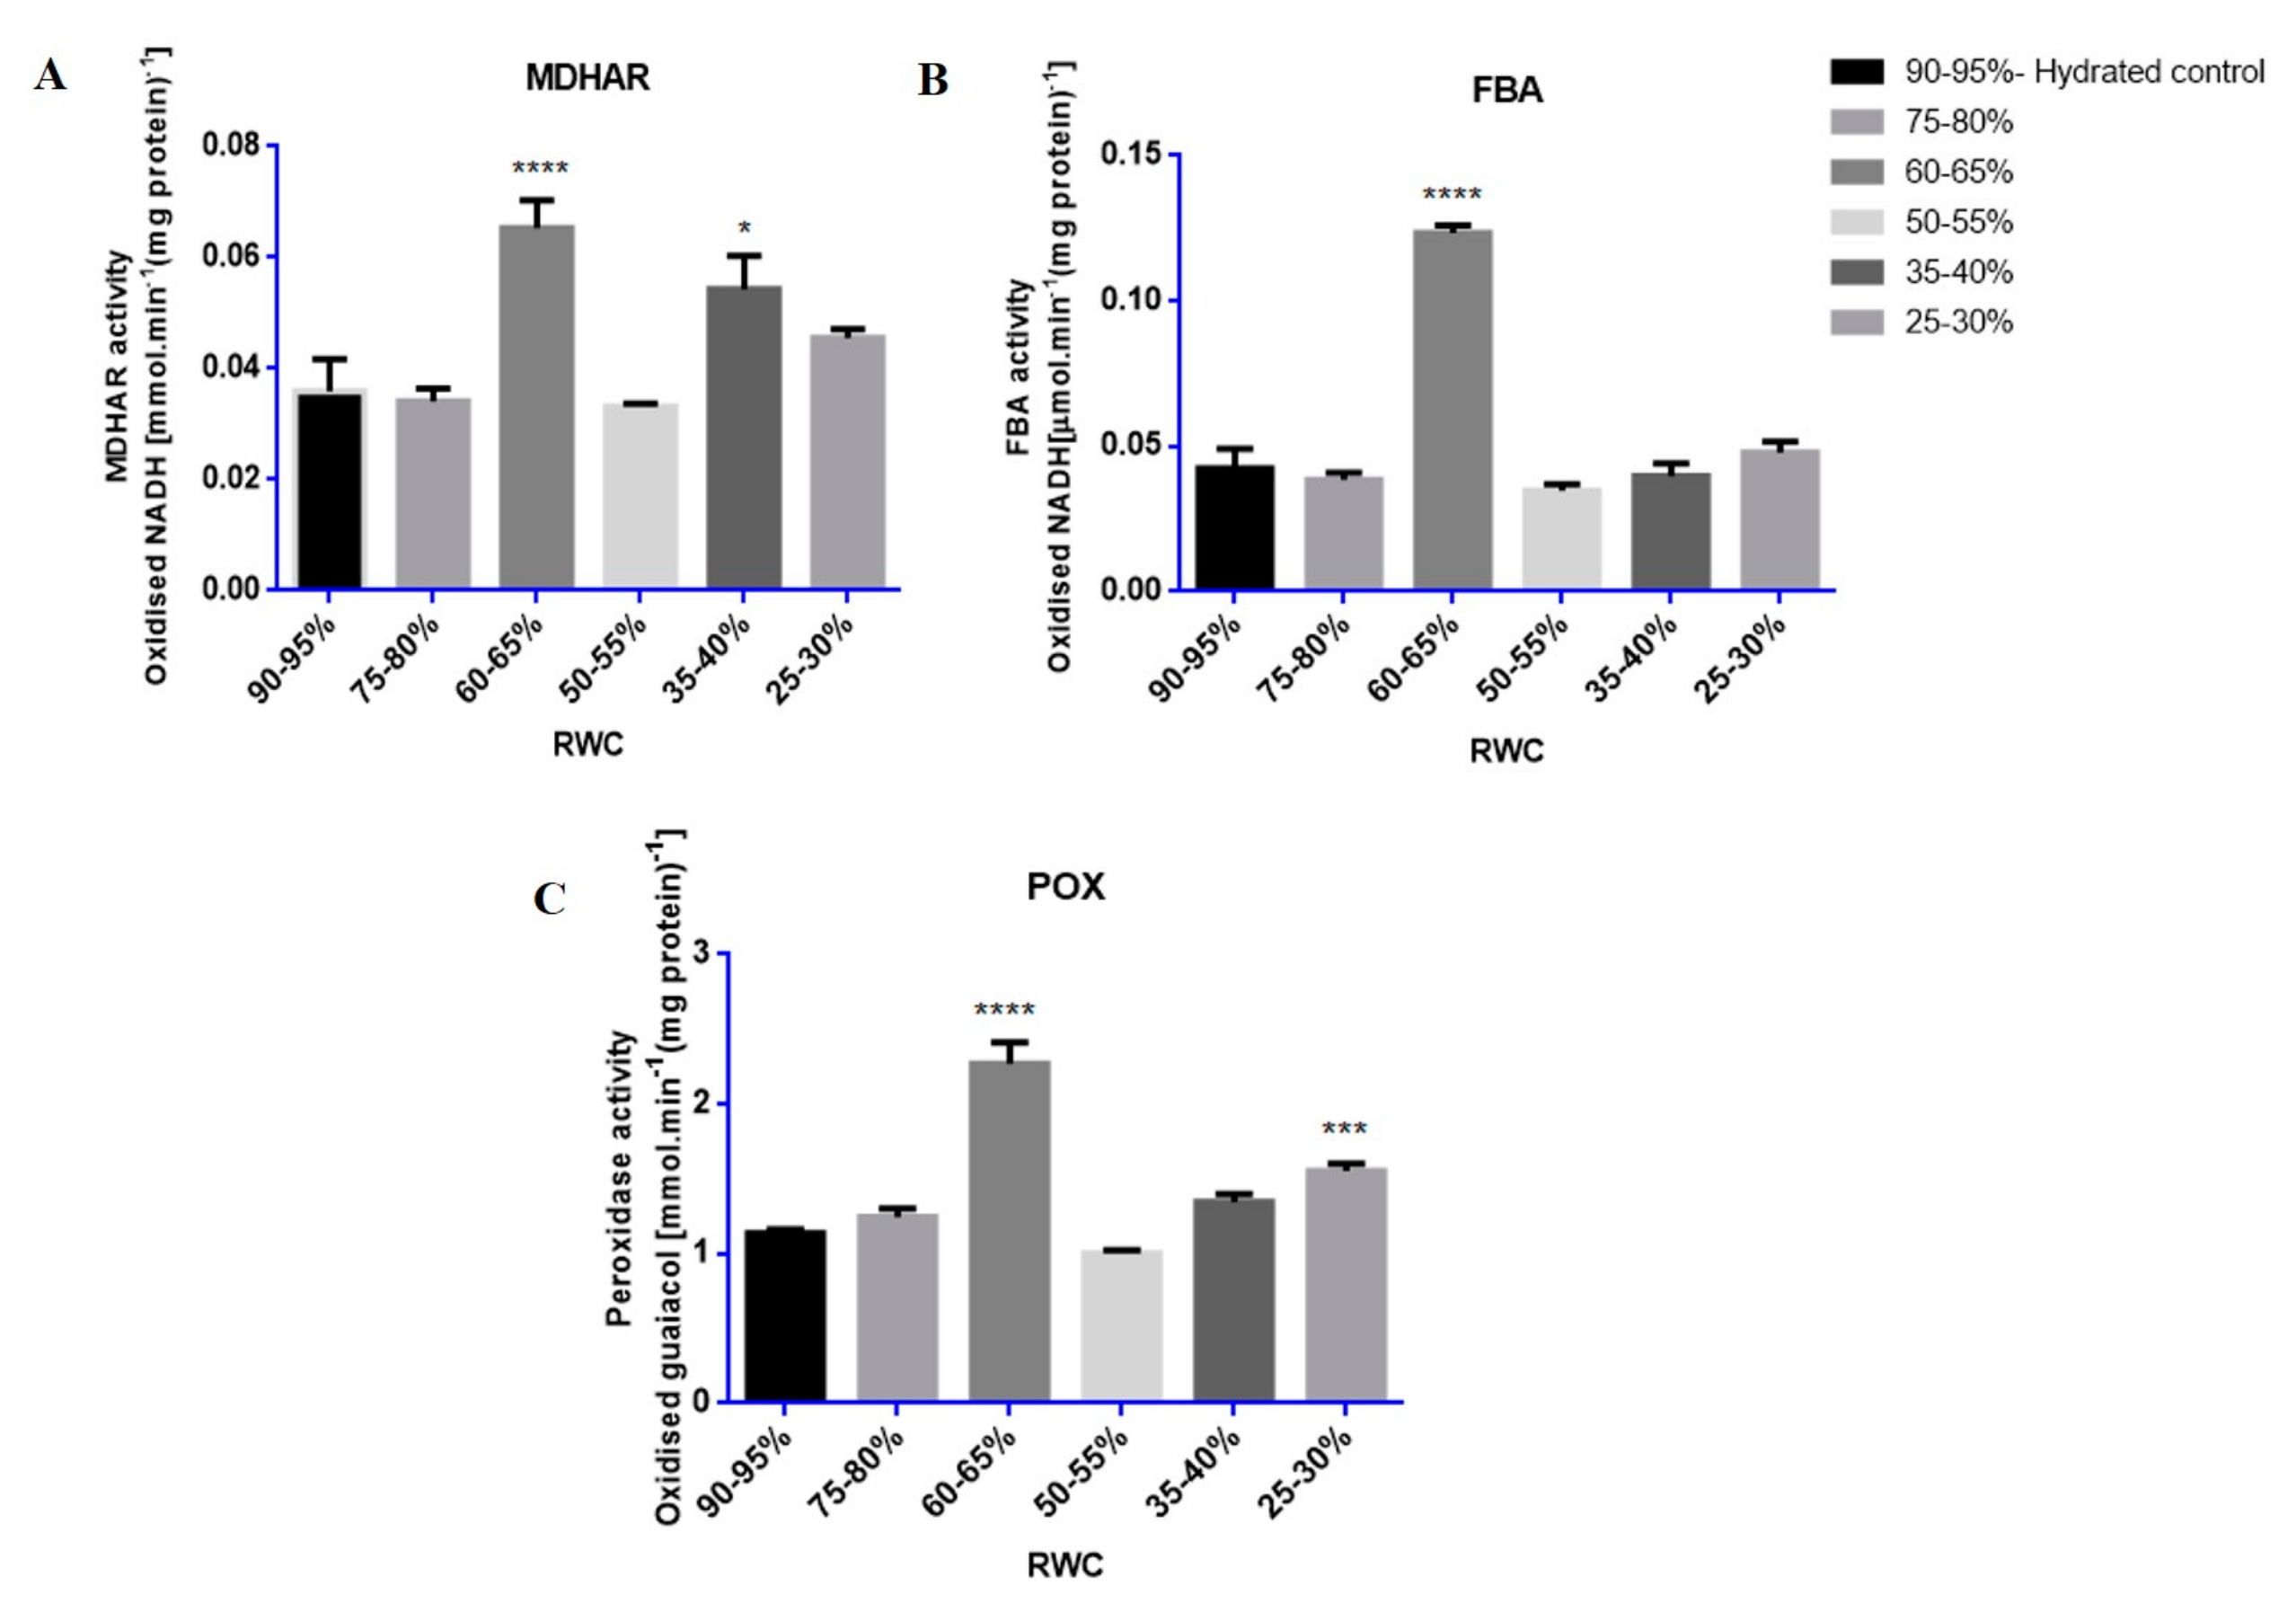
Western Blots and Enzyme Assays

In order to validate whether the differentially regulated proteins identified from iTRAQ analyses were upregulated during dehydration, Western blotting was conducted on fructose bisphosphate aldolase (FBA) retrieved from the TE upregulated protein dataset, shown in Figure 4. Immunodetection showed an increase in protein abundance levels in response to dehydration stress for FBA in all samples tested (Figure 4A). Protein band intensities were enhanced by at least a 2-fold significant increase in relative quantification values (p-value < 0.05) for FBA at 38 kDa (Figure 4B).
Enzyme assays showed that the activities of MDHAR, POX and FBA were strongly induced at specific RWCs during dehydration stress with nearly all increasing at 60–65% RWC (Figure 5A–C).

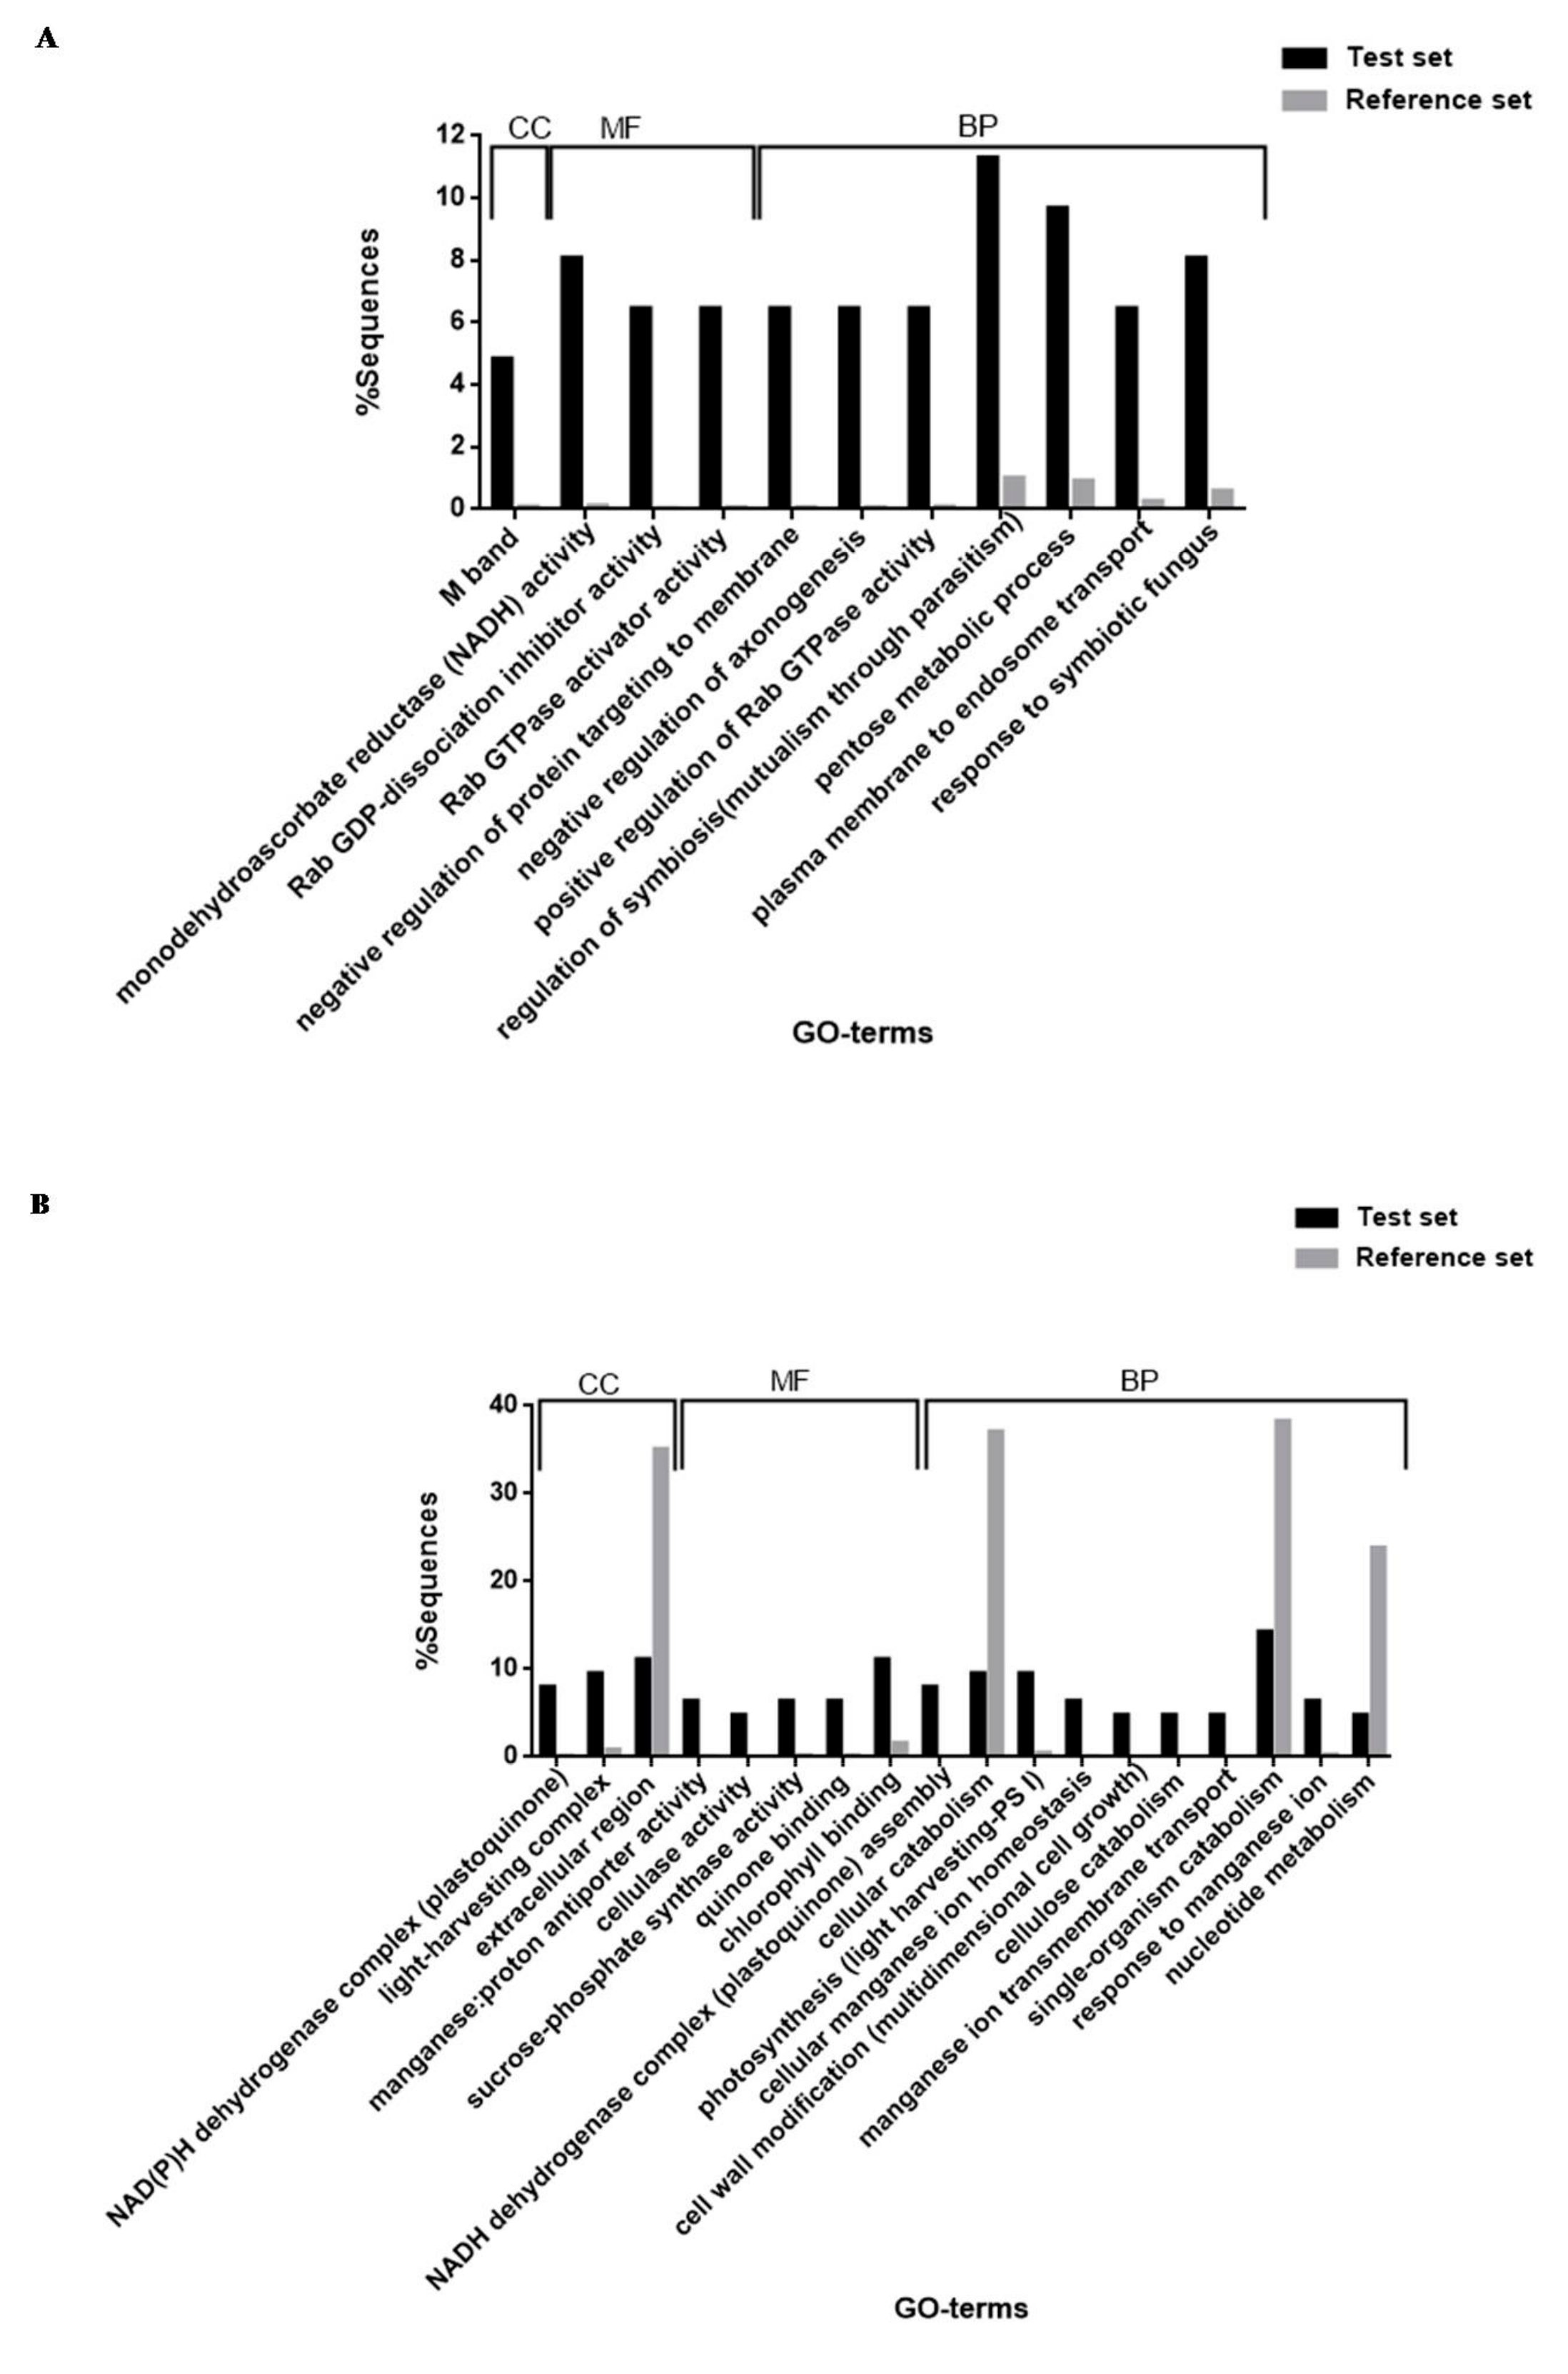
3.4. Functional Enrichment Analysis (Fisher’s Exact Test)

In order to observe functional GO-term enrichment of differentially regulated tef proteins in response to dehydration stress, a Fisher’s exact test for statistical significance in Blast2GO was used. A total of 50 GO-term processes were functionally enriched, of which 22 GO-terms were found for upregulated proteins (Table S6A) and 28 GO-terms were found for downregulated proteins (Table S6B). All of these belonged to the classification categories (ontologies) of cellular component (CC), molecular function (MF) and biological process (BP). To summarise the findings, GO-terms were filtered and reduced to the most specific annotations (most specific GO, FDR < 0.05) and represented as histograms for both up and downregulated proteins, shown in Figure 6. The enriched GO-terms shown were reduced to 29 most specific terms in total of which 11 GO-terms were found for upregulated proteins (Figure 6A) and 18 GO-terms for downregulated proteins (Figure 6B) in the classification categories CC, MF and BP.

4. Discussion

4.1. Physiological Characterisation

Tef has previously been classified as moderately drought tolerant in comparison to species within the Eragrostis genus [61]. Ginbot and Farrant [15] have confirmed that this species has some measure of tolerance to water-deficit under drought stress, with brown seeded varieties (as used in this study) being tolerant of slightly higher amounts of water loss than white seeded varieties. In the current study, similar trends were observed in pre-flowering, brown seeded tef plants, where dehydration to below 40% RWC (Figure 1A) resulted in increased electrolyte leakage rates (Figure 2A) and considerable evidence of subcellular damage (Figure 3). Increased membrane permeability with continuous dehydration stress has been linked to the enhanced synthesis of reactive oxygen species (ROS), a consequence of metabolic processes in chloroplasts, mitochondria and peroxisomes in particular, which can cause the breakdown of proteins, membrane lipids and photosynthetic pigments that function in maintaining cell membrane stability [62,63]. Photosynthesis is particularly susceptible to excess ROS formation under water deficit conditions and this has frequently been cited as a primary cause of damage and resultant plant death in most species [64,65]. The sensitivity of PS II activity to abiotic and biotic factors has resulted in the use of chlorophyll fluorescence, and particularly the measure of quantum efficiency of PS II (Fv/Fm) as an indicator of how plants respond to environmental change. Data from Figure 2B show maintenance of Fv/Fm at values indicative of healthy, non-stressed leaves until 50–55% RWC, with a sharp drop (values declining below 0.4, indicative of possible damage related to photosynthetic shutdown) below 30% RWC. Ultrastructural analysis showed considerable decline in vacuolar area as water was lost from tissues, with some evidence of plasmalemma withdrawal and autophagosome formation upon dehydration to 50% RWC (Figure 3B). Autophagy has been associated with cellular survival by removal of damaged organelles and cellular toxins and recycling of the breakdown products for the maintenance of cellular homeostasis. Furthermore, it has been proposed as being essential for drought stress tolerance [66,67]. We propose that tef is able to survive loss of up to 50% RWC, in part, due to such a strategy. However, drying to lower RWC, suggested increased evidence of subcellular damage, including breakage of cell walls, plasmalemma and loss of integrity of organelles (Figure 3C,D) all further signs of stress-induced injury.
In summary, physiological studies performed here indicate that six week-old plants from a brown seeded tef variety are able to tolerate drying to ca 50% RWC (loss of 1.5 g H2O) before irreversible damage is initiated. We were thus interested in understanding the nature of protection afforded during initial drying to 50%, by investigating the tef proteome changing in response to dehydration stress.

4.2. Tef Proteomics

The starting point of the iTRAQ analysis was the examination and refinement of the list of peptides generated from database searching as opposed to the list of generated proteins. This is not an uncommon approach and has been used by many researchers in the field of mass spectrometry-based proteomics [50,68,69,70]. A potential concern with working with a list of peptides instead of proteins is the challenge of protein inference [71], where the generated list contains both unique and non-unique (shared) peptides matched against the chosen database for protein identification. This concern is adequately addressed by using appropriate FDR thresholds and employing stringent estimation of error rates, so that only valid peptide identities meeting the FDR threshold requirements are detected and used for subsequent protein analysis [69,72]. Furthermore, the analysis of both unique and non-unique peptide mass spectra scans that meet FDR thresholds would be more representative of the proteins changing in a particular study. Interestingly, a total of 57 out of the 211 proteins (27%) found to be differentially regulated within the TE dataset (Table 1 and Table 2) were spliced variants arising from the alternative splicing of 25 potential splice events (genes). During this regulatory mechanism, primary transcripts or precursor-mRNAs with introns undergo alternative splicing to produce multiple transcripts from a single gene within the genome by using differential splice sites [73]. In this regard, the functional complexity of the transcriptome and diversity of the proteome are increased between plant cells and tissues [73,74], particularly during plant development and in response to environmental stimuli, such as biotic and abiotic stress conditions [75,76]. In the TEU differentially regulated datasets (Tables S2 and S3) and MU differentially regulated datasets (Tables S4 and S5), however, no occurrences of spliced variants were present, presumably because only uniquely-matched peptides were used for protein identification, resulting in only one definitive protein entity per entry. Because iTRAQ experiments on the whole do not usually produce large amounts of peptide reads per protein [69], the use and manipulation of only uniquely scanned peptides for protein identification has been shown to drastically limit the number of confidently proteins identified [71,72]. This is especially evident by the marginal difference observed in the amount of proteins identified between the TE and TEU differentially regulated datasets, 211 and 111 proteins, respectively. Because tef is considered to be a non-model crop species whose genome has only been recently sequenced [18], the amount of annotated information therein cannot compare to that of model plant organisms. It is important to note that the tef genome and transcriptome have only been moderately-annotated, and this consequently, would lead to not all tef proteins being identified during database searching (as shown in Table 1 and Table 2; Tables S2 and S3). Nevertheless, a significant amount of proteins within the TE and TEU datasets do contain protein annotations and therefore can be used to make protein inferences through bioinformatics analyses, while those unidentified proteins may lead to discovery of some unique new targets within the tef genome.
It could be suggested that a ‘cross-species identification’ approach would be better for non-model plant systems such as tef, where a generic (non-specific plant species) but well-annotated database is used for protein identification [77,78,79]. This would potentially increase the amount of annotated and identified proteins, as in the case with the proteins identified by use of the Liliopsida database (the MU dataset) available from UniprotKB, where 4328 tef proteins were identified during database searching, and 174 proteins were found to be differentially regulated (File S3, Tables S4 and S5). Although this approach is widely used for non-model plant systems [77,78] such as tef and many others [80,81], using the same approach is not ideal as the number and confidence of identified proteins is reduced [79]. The MU dataset was generated using only uniquely scanned peptides during database searching and contained more proteins with usable descriptions and annotations for bioinformatics inference (Tables S4 and S5). The use of the TE database, however, provided identification of 5727 tef proteins in total (File S1), of which 211 were differentially regulated. The difference in the total amount of proteins detected can be explained by the fact that either some species-specific proteins will not be present during cross-species identification or those homologous proteins that are present will show small evolutionary differences in their sequences [79]. Thus, the use of a very specific but moderately-annotated database (the TE database), would detect more proteins present, potentially highlight more proteo-bioinformatics changes that are unique to the organism under study, and also improve annotation and curation within the existing tef database.

4.3. Tef Protein Validation

Biological validation of the upregulated protein FBA by Western blotting, showed increased protein accumulation and band intensity with dehydration stress to 50% RWC (Figure 4). Although FBA displayed negligible increases in fold change in the iTRAQ data (Table 1 and Table S2, fold change = 1.02), statistical testing based on p-value showed it to be highly significant (FBA, p-value = 0.005 in Table 1 and Table S2). Since an overall increase in protein accumulation is observed with dehydration stress, this result supports the iTRAQ findings and show that protein change is due to a biological consequence and not experimental variation.
Proteins tested for biological validation by enzymatic methods, MDHAR, POX and FBA, all showed increased enzyme activities at 60–65% RWC in response to dehydration stress (Figure 5). FBA catalyses the reversible conversion of glyceraldehyde-3-phosphate and dihydroxyacetone phosphate to fructose-1, 6-bisphosphate during glycolysis/gluconeogenesis or in the reaction where erythrose-4-phosphate and dihydroxyacetone phosphate is converted to sedoheptulose-1,7-bisphosphate in the Calvin cycle [82,83]. Furthermore, FBA has been classified as one of the six non-regulated enzymes in the Calvin cycle that have been suggested to have a potential role in controlling photosynthetic carbon flux through the Calvin cycle [83]. A significant increase in FBA activity was observed in tef at 60–65% RWC (Figure 5B). It has been proposed that increased activity of FBA may function in the regeneration of ribulose 1,5 bisphosphate and increased CO2 fixation, contributing to enhanced photosynthesis, increased growth rates and biomass yields [83]. Furthermore, an increase in FBA activity has been observed in stress response for various other crop plants such as rice, in response to drought stress and increased salinity [84,85]; wheat seedlings, in response to anaerobic conditions [86,87]; wheat roots, in response to increased aluminium concentrations[87,88] and in Indian mustard, in response to increased cadmium concentrations [89].
The stress responsive antioxidant enzymes known to offer protection against free radical accumulation, MDHAR and POX [90,91,92,93], displayed a large increase in enzymatic activity at 60–65% RWC (Figure 5A,C). A second increase in enzyme activity was observed by both MDHAR and POX at 35–40% and 25–30% RWC, respectively, towards the latter stages of dehydration (Figure 5A,C). These results support protein presence and accumulation according to iTRAQ findings for MDHAR (Table 1 and Table S2, fold change value = 1.03, p-value = 0.027 and 0.04) and POX (Table 1, fold change value = 1.08, p-value = 0.002; Table S4, fold change = 1.02, p-value = 0.011) and also confirms that the large increases in quantitative expression observed in these protein isoforms in Table 1 (fold change = 6.54, p-value = 0.006) for MDHAR and POX (fold change = 6.82, p-value = 0.008) are due to a biological change in response to dehydration stress and not experimental error. An increase in POX activity has been related to many oxidative and abiotic stresses [94,95], particularly in response to dehydration stress conditions in the crop plants wheat [93,96], oilseed rape [97], sunflower [98], horse gram beans [99] as well as in response to salt stress in fox-tail millet and rice [55,95]. The increased production of free radicals as a consequence of stress conditions has been proposed to be the main reason for membrane lipid peroxidation, whereby the extent of peroxidation-induced damage is regulated by the antioxidative peroxidase enzyme system [92,95]. This could be due, in part, to the ability of POX acting on increased levels of H2O2 in cells as dehydration stress proceeds, even towards the final stages of dehydration stress (25–30% RWC) (Figure 5C). The free radical, H2O2, has been postulated to have a dual role in plant cells, by either acting as a signalling molecule at low concentrations during non-stress conditions or as an activator of programmed cell death (PCD) at high concentrations during stressed conditions [90,100]. Dehydration to 50% RWC resulted in evidence of autophagy (Figure 3B) and increased electrolyte leakage measurements (Figure 2A) at RWCs below this, suggesting increased membrane damage. This is perhaps due to the extenuating effects of H2O2 build-up.

4.4. Tef Bioinformatic Analysis

Functional enrichment analysis of the GO-terms of tef proteins regulated in response to dehydration stress yielded a wealth of protein ontological information (Table S6; Figure 6A). Monodehydroascorbate reductase (NADH) activity was the most significantly changed GO-term in the category MF (Figure 6A; 8.1% protein sequences). MDHAR was also significantly increased in quantitative expression during iTRAQ analysis in response to dehydration stress in the TE (Table 1, p-value = 0.006) and TEU datasets (Table S2, p-value = 0.027) and showed a considerable increase in enzymatic activity at low RWCs (35–40%) (Figure 5A). MDHAR is one of the key enzymes involved in ascorbate reduction [101] and functions in reducing the oxidised form of ascorbate (monodehydroascorbate) before being returned to the ascorbate pool [91,101]. MDHAR has been proposed to be an indicator of oxidative stress within plant tissues, playing an important role against accumulation of ROS due to increasing stress conditions [90,91]. This suggests that the generation of ascorbate as well as the regulation and maintenance of the ascorbate–glutathione cycle are important in the response to initial dehydration stress.
The Rab family of cellular processes active in the regulation of vesicular membrane traffic [102] and regulatory membrane protein transport processes were equally over-represented in response to dehydration stress (Figure 6A). The flow of membrane constituents between endomembrane structures and the plasmalemma is critical for the maintenance of cellular homeostasis in response to signal transduction [103]. This is also important in autophagy, which has been linked to the restoration and maintenance of cellular homeostasis through the recycling and removal of damaged cellular constituents through protein degradation [66,67], where drought has been reported to induce PCD [67]. Furthermore, GO-terms allocated to biological processes responsible for regulating membrane trafficking and the flow of proteins and other macromolecules to numerous endpoints inside and outside the cell through a signalling cascade[104,105] were over-represented in response to dehydration stress (Figure 6A). These Rab family of small GTP-binding proteins function as molecular alterations that cycle between ‘active’ and ‘inactive’ states within the cell through the binding and hydrolysis of GTP [105], thereby controlling the endocytic network in plants [106]. Interestingly, the stress-inducible small GTP-binding protein Rab7 gene (PgRab7) isolated from Pennisetum glaucum, a relatively drought-stress tolerant food grain crop grown in India, has been reported to increase tolerance to abiotic stresses such as drought and increased salinity in transgenic tobacco[106]. Similarly, the Rab7 gene (TaRab7) isolated from wheat leaves infected with the wheat stripe rust pathogen (Puccinia striiformis f. sp. tritici), was proposed to play an important role in early stages of wheat-stripe rust fungus interaction and stress tolerance [107]. In tef, the regulation of autophagy with dehydration stress may enhance drought stress tolerance until plant viability is compromised and PCD pathways are triggered.
During dehydration stress, tef responses to biotic challenges such as fungal or bacterial infections are also important, as the GO-terms response to symbiont and symbiotic fungus and regulation of symbiosis encompassing mutualism through parasitism were highly over-represented (Figure 6A; 8.1% and 11.3% protein sequences, respectively). Although tef has been proposed to be relatively resistant to damage by insects or competition from weeds [108], at least 22 species of fungi and three pathogenic nematodes have been previously associated with tef [38,108]. The GO-term pentose metabolic process was also significantly over-represented in response to dehydration stress (Figure 6A; 9.7% protein sequences). The pentose phosphate pathway has been reported to have a dual role in oxidative stress response in plants [109]. Firstly, by providing an available source of soluble-sugars that can either be involved in ROS-producing metabolic pathways [109,110] or, alternatively, by being involved in the active production of NADPH, a major co-factor required in the antioxidant ascorbate-glutahione cycle [90,109]. In addition, these soluble sugars have been proposed to act as nutrient and metabolite signalling molecules that activate specific signalling pathways leading to imperative gene modification and proteomic changes in response to a number of stresses [109].
A substantial amount of GO-terms were enriched in tef downregulated proteins (Table S6B; Figure 6B). The functional enrichment of GO-terms found to be over-represented in downregulated proteins, were commonly linked to quinone cycling in the plastoquinone pool during oxidative phosphorylation (Figure 6B). The complexes NADH dehydrogenase and NAD(P)H dehydrogenase, both function in reducing plastoquinones during the flow of electrons when ATP is generated [111,112]. While NADH dehydrogenase functions in cellular respiration in the mitochondria [112], NAD(P)H dehydrogenase is localised in the thylakoid membranes of chloroplasts, participating in cyclic electron transport reactions around photosystem I and chlororespiration (interactions linking respiratory electron transport chain and photosynthetic electron transport chain in thylakoid membranes of chloroplasts) [113,114]. NAD(P)H, in particular, has been proposed to lessen oxidative stress in plants [114]. Increased supplying of ATP for photosynthesis has been reported during environmental stress conditions, particularly during drought stress [115]. However, since photosynthetic metabolism under water-deficit stress is reported to be responsible for the production of large amounts of free radicals [90], these processes, in effect, are decreased in tef in an attempt to perhaps minimise ROS production. In further support that reduced ROS production is important in the tef dehydration stress response, GO-terms involved in photosynthetic processes such as light harvesting and chlorophyll binding as well as GO-terms linked to ROS-producing processes through the generation of additional ATP, such as the transfusion of solutes in the form of cations and protons across membranes, were over-represented in downregulated proteins (Figure 6B).
The categories, transport and response of metal ions in the form of manganese, were well over-represented in downregulated proteins (Figure 6B). The positively charged micronutrient, manganese, is required during the splitting of water in photosystem II, when photosynthesis occurs [116,117] and has been reported to play important roles as a co-factor and activator of enzymes in various sub-cellular compartments [103,116]. To avoid toxicity within cell tissues, cytosolic manganese concentrations need to be kept low [116] and are usually transported out of the cytosol by metal transporters where they are either localised to the plant cell membrane or to the vacuolar membrane where metals are sequestered into large moderately inert compartments [117]. If manganese concentrations are not carefully monitored in plant cells, toxicity is usually indicated by chlorosis, brown specks, necrosis and crinkled leaves, which arise due to the inhibition of chlorophyll synthesis [117]. The disruption of manganese ion transport and homeostasis and consequent decreased protein abundance in tef, comes as no surprise in response to dehydration stress as photosynthetic potential has been shown to decrease at water contents below 55% RWC (Figure 2B). The decrease in photosynthesis and inhibition of chlorophyll synthesis, would ultimately lead to increased manganese concentrations and toxicity within tef plant cells due to metal transport and cellular manganese homeostasis disruption.
Potential modification of the cell wall, particularly in the form of the terms cellulase activity, cellulose catabolism, beta-glucan catabolism and cell wall modification involved in multidimensional cell growth, were over-represented in tef downregulated proteins (Figure 6B). The effect of cell wall re-structuring and modification during stress conditions is a common phenomenon in plant cells [118] as a consequence of turgor loss during dehydration stress [119,120]. Many plants curtail the growth of their stems and leaves when subjected to low water potential [121] and continue to elongate the root tissues for deeper soil penetration and water mining as a result of adapting to drought conditions [120,121]. Previous observations in tef with regards to increased primary root lengths and decreased shoot growth in response to drought conditions have been reported [13] and have been proposed to be an adaptive morphological response of tef in water-limiting environments [13]. Lastly, the GO-term, sucrose-phosphate synthase activity, was over-represented in downregulated proteins (Figure 6B). Sucrose phosphate synthase (EC 2.4.1.14) plays an important role in the synthesis of sucrose using substrates derived from glycolysis such as fructose-6-phosphate and UDP-glucose. In correlation to being functionally enriched in downregulated tef proteins (Figure 6B), the enzyme has been previously shown to decrease in activity in the leaves of other C4 species as well, such as maize [122] and sugarcane [123], in response to dehydration stress. The decline in sucrose accumulation has been proposed to be due to the decline in readily available photosynthetic triose phosphate, which ultimately leads to a decline in the enzyme activity of sucrose phosphate synthase [124].

5. Conclusions

In summary, an in-depth proteomic analyses in tef leaf tissues was conducted, during hydrated, non-stressed conditions at approximately 80% RWC and at the previously established critical water content stages in a range of 50% RWC, where tef was shown to be physiologically affected by the imposed stress conditions. iTRAQ mass spectrometry and appropriate database searching enabled the detection of 5727 proteins, of which 211 proteins were found to be differentially regulated in response to dehydration stress. A considerable number of identified proteins (57 in total) were generated through alternative splicing of the tef genome. Proteins arising from alternative splicing are potential isoforms and altered proteins, known to potentially assist in tolerance to various abiotic stresses [125], particularly in response to drought [126]. In tef, alternative splicing of the genome can be proposed as a regulatory mechanism that enhances adaptation to stress, by providing multiple transcripts and proteins that aid in tolerance to drought. These would include the stress-responsive proteins generated through alternative splicing, MDHAR, POX, and FBA. Validation of these protein targets by means of Western blotting and enzymatic assay confirmed protein presence according to iTRAQ findings and showed increased protein concentrations and relative enzymatic activities in response to dehydration stress. GO-term evaluation and enrichment analysis revealed terms involved in biotic and abiotic stress response, signalling, transport, cellular homeostasis and pentose metabolic processes, enriched in tef upregulated proteins, while terms linked to ROS-producing processes under water-deficit conditions, such as photosynthesis and associated light harvesting reactions as well as cell wall catabolism, manganese transport and homeostasis, the synthesis of sugars and cell wall modification, were enriched in tef downregulated proteins. Furthermore, an overall subtle shift in the proteome of tef occurs with dehydration stress, where proteins functioning in stress response, antioxidant protection mechanisms, autophagy and those active in maintaining crucial plant cell maintenance processes are accumulated. Interestingly, abiotic stresses such as drought conditions occur in tandem with an increase in biotic stress factors, where tef showed increased susceptibility to symbiotic relationships involving parasitism and fungal responses. These results show that abiotic stress factors do not occur in isolation [127] and that biotic stress factors should be taken into account when observing plant response to adverse changes in the environment. Lastly, enrichment of terms associated with the decrease of predominantly ROS-producing processes through those generated from photosynthetic reactions and metal transport were observed in an attempt to minimise ROS proliferation associated with internal water loss.
This study, to our knowledge, is the first reported comparative proteomic analyses of the tef proteome in response to dehydration stress as a consequence of drought conditions and could serve as a basis for future studies and for further characterisation of tef ‘omic’ resources.

Supplementary Materials

The following figures, tables and supplementary data files are available online at www.mdpi.com/2227-7382/5/4/32/s1. Figure S1: iTRAQ analysis workflow of tef protein samples in preparation for MS analysis. Figure S2: Steps to tef iTRAQ data pre-processing, refinement and statistical analysis. Figure S3: Sanity check (Q-Q plots) of all labels (113–121) used in iTRAQ analysis. Figure S4: Heat map (cluster analysis) of the labelled channels in iTRAQ analysis after data refinement steps. Table S1 Tef differentially regulated proteins of highly significant fold change and p-values *. Table S2 TEU upregulated proteins in response to dehydration stress. Table S3 TEU downregulated proteins in response to dehydration stress. Table S4 MU upregulated proteins in response to dehydration stress. Table S5 MU downregulated proteins in response to dehydration stress. Table S6 Functional enrichment analysis of GO-terms. File S1 Refined and processed list of tef proteins-peptides for protViz File S2.1 TE dataset (all 5727 proteins with expression values, fold changes and p-values). File S2.2 TE—two-group analysis (box-plots). File S2.3 TE—Sanity Check (quality check 1). File S2.4 TE—Heat map (quality check 2). File S3.1 TEU dataset (all 2656 proteins with expression values, fold changes and p-values). File S3.2 TEU—two-group analysis (box-plots). File S3.3 TEU—Sanity Check (quality check 1). File S3.4 TEU—Heat map (quality check 2). File S4.1 MU dataset (all 4328 proteins with expression values, fold changes and p-values). File S4.2 MU—two-group analysis (box-plots). File S4.3 MU—Sanity Check (quality check 1). File S4.4 MU—Heat map (quality check 2).

Acknowledgments

The financial assistance of the National Research Foundation (NRF) and University of Cape Town (UCT) Postgraduate Funding towards this research is hereby acknowledged. In addition, we acknowledge Jonas Grossmann and colleagues at the Functional Genomics Center, Zurich, Switzerland, for the use of their protViz package and his aid in analysing the iTRAQ data generated in this study.

Author Contributions

The project was conceived and administered by M.S.R and experiments were designed by M.S.R, R.K and J.M.F. The experiments were performed by R.K and all data was analyzed by R.K with support by M.S.R while J.M.F provided support for physiological and ultra-structural analyses. R.K and G.C performed bioinformatic analyses. Z.T contributed materials and analyses tools. R.K wrote the original draft while all authors contributed to subsequent manuscript revision.

Conflicts of Interest

The authors declare no conflict of interest.

Abbreviations

AWCAbsolute water content
FASPFilter assisted sample preparation procedure
FBAFructose bisphosphate aldolase
FDRFalse discovery rate
GOGene ontology
GTP
iTRAQ
Guanosine triphosphate
Isobaric tag for relative and absolute quantitation
MDHARMonodehydroascorbate reductase
MSMass spectrometry
MS/MSTandem mass spectrometry
MUMonocot unique
NAD
POX
Nicotinamide adenine dinucleotide
Peroxidase
ROSReactive oxygen species
RWCRelative water content
TETef Extended
TEMTransmission electron microscopy
TEUTef Extended unique

References

  1. Benešová, M.; Holá, D.; Fischer, L.; Jedelský, P.L.; Hnilička, F.; Wilhelmová, N.; Rothová, O.; Kočová, M.; Procházková, D.; Honnerová, J.; et al. The physiology and proteomics of drought tolerance in maize: Early stomatal closure as a cause of lower tolerance to short-term dehydration? PLoS ONE 2012, 7, e38017. [Google Scholar] [CrossRef] [PubMed]
  2. Reddy, A.R.; Chaitanya, K.V.; Vivekanandan, M. Drought-induced responses of photosynthesis and antioxidant metabolism in higher plants. J. Plant Physiol. 2004, 161, 1189–1202. [Google Scholar] [CrossRef]
  3. Dai, A. Increasing drought under global warming in observations and models. Nat. Clim. Chang. 2013, 3, 52–58. [Google Scholar] [CrossRef]
  4. Thornton, P.K.; Ericksen, P.J.; Herrero, M.; Challinor, A.J. Climate variability and vulnerability to climate change: A review. Glob. Chang. Biol. 2014, 20, 3313–3328. [Google Scholar] [CrossRef] [PubMed]
  5. D’Andrea, A.C. T’ef (Eragrostis tef) in ancient agricultural systems of highland ethiopia. Econ. Bot. 2008, 62, 547–566. [Google Scholar] [CrossRef]
  6. Tadele, Z.; Assefa, K. Increasing food production in Africa by boosting the productivity of understudied crops. Agronomy 2012, 2, 240–283. [Google Scholar] [CrossRef] [Green Version]
  7. Ayele, M. Genetic Diversity in tef [Eragrostis tef (Zucc.) Trotter] for Osmotic Adjustment, Root Traits, and Amplified Fragment Length Polymorphism; Texas Tech University: Lubbock, TX, USA, 1999. [Google Scholar]
  8. Costanza, S.H.; Dewet, J.M.J.; Harlan, J.R. Literature review and numerical taxonomy of Eragrostis tef (tef). Econ. Bot. 1979, 33, 413–424. [Google Scholar] [CrossRef]
  9. Tefara, H.; Belay, G. Eragrostis tef (Zuccagni) Trotter. In Plant Resources of Tropical Africa 1: Cereals and Pulses; Brink, M., Belay, G., Eds.; PROTA Foundation: Wageningen, The Netherlands, 2006; pp. 68–72. [Google Scholar]
  10. Tadele, Z.; Esfeld, K.; Plaza, S. Applications of high-throughput techniques to the understudied crops of Africa. Asp. Appl. Biol. 2010, 96, 233–240. [Google Scholar]
  11. Asfaw, K.G.; Dano, F.I. Effects of salinity on yield and yield components of tef [Eragrostis tef (Zucc.) Trotter] accessions and varieties. Curr. Res. J. Biol. Sci. 2011, 3, 289–299. [Google Scholar]
  12. Abate, E.; Hussein, S.; Laing, M.; Mengistu, F. Quantitative responses of tef [Eragrostis tef (Zucc.) Trotter] and weeping love grass [Eragrostis curvula (Schrad.) Nees] varieties to acid soil. Aust. J. Crop Sci. 2013, 7, 1854–1860. [Google Scholar]
  13. Degu, H.D.; Fujimura, T. Mapping QTLs related to plant height and root development of Eragrostis tef under drought. J. Agric. Sci. 2010, 2, 62–72. [Google Scholar] [CrossRef]
  14. Degu, H.D.; Ohta, M.; Fujimura, T. Drought tolerance of Eragrostis tef and development of roots. Int. J. Plant Sci. 2008, 169, 768–775. [Google Scholar] [CrossRef]
  15. Ginbot, Z.; Farrant, J.M. Physiological response of selected Eragrostis species to water-deficit stress. Afr. J. Biotechnol. 2011, 10, 10405–10417. [Google Scholar]
  16. Mengistu, D.K. The influence of soil water deficit imposed during various developmental phases on physiological processes of tef (Eragrostis tef). Agric. Ecosyst. Environ. 2009, 132, 283–289. [Google Scholar] [CrossRef]
  17. Shiferaw, W.; Balcha, A.; Mohammed, H. Evaluation of drought tolerance indices in tef [Eragrostis tef (Zucc.) Trotter]. Afr. J. Agric. Res. 2012, 7, 3433–3438. [Google Scholar]
  18. Cannarozzi, G.; Plaza-Wuthrich, S.; Esfeld, K.; Larti, S.; Wilson, Y.S.; Girma, D.; de Castro, E.; Chanyalew, S.; Blosch, R.; Farinelli, L.; et al. Genome and transcriptome sequencing identifies breeding targets in the orphan crop tef (Eragrostis tef). BMC Genom. 2014, 15, 581. [Google Scholar] [CrossRef] [PubMed]
  19. Ketema, S. Tef, Eragrostis tef (Zucc.) Trotter; Institute of Plant Genetics and Crop Plant Research, Gatersleben/International Plant Genetic Resources Institute: Rome, Italy, 1997; p. 52. [Google Scholar]
  20. Kreitschitz, A.; Tadele, Z.; Gola, E.M. Slime cells on the surface of Eragrostis seeds maintain a level of moisture around the grain to enhance germination. Seed Sci. Res. 2009, 19, 27–35. [Google Scholar] [CrossRef]
  21. Ingram, A.L.; Doyle, J.J. The origin and evolution of Eragrostis tef (Poaceae) and related polyploids: Evidence from nuclear waxy and plastid RPS16. Am. J. Bot. 2003, 90, 116–122. [Google Scholar] [CrossRef] [PubMed]
  22. Assefa, K.; Merker, A.; Tefera, H. Inter simple sequence repeat (ISSR) analysis of genetic diversity in tef [Eragrostis tef (Zucc.) Trotter]. Hereditas 2003, 139, 174–183. [Google Scholar] [CrossRef] [PubMed]
  23. Assefa, K.; Tefera, H.; Merker, A.; Kefyalew, T.; Hundera, F. Quantitative trait diversity in tef [Eragrostis tef (Zucc.) Trotter] germplasm from central and northern Ethiopia. Genet. Resour. Crop Evol. 2001, 48, 53–61. [Google Scholar] [CrossRef]
  24. Bai, G.; Ayele, M.; Tefera, H.; Nguyen, H.T. Genetic diversity in tef [Eragrostis tef (Zucc) Trotter] and its relatives as revealed by Random Amplified Polymorphic DNAs. Euphytica 2000, 112, 15–22. [Google Scholar] [CrossRef]
  25. Yu, J.K.; Graznak, E.; Breseghello, F.; Tefera, H.; Sorrells, M.E. QTL mapping of agronomic traits in tef [Eragrostis tef (Zucc) Trotter]. BMC Plant Biol. 2007, 7, 30. [Google Scholar] [CrossRef] [PubMed]
  26. Yu, J.K.; Kantety, R.V.; Graznak, E.; Benscher, D.; Tefera, H.; Sorrells, M.E. A genetic linkage map for tef [Eragrostis tef (Zucc.) Trotter]. Theor. Appl. Genet. 2006, 113, 1093–1102. [Google Scholar] [CrossRef] [PubMed]
  27. Zeid, M.; Assefa, K.; Haddis, A.; Chanyalew, S.; Sorrells, M.E. Genetic diversity in tef (Eragrostis tef) germplasm using SSR markers. Field Crops Res. 2012, 127, 64–70. [Google Scholar] [CrossRef]
  28. Zeid, M.; Belay, G.; Mulkey, S.; Poland, J.; Sorrells, M.E. QTL mapping for yield and lodging resistance in an enhanced SSR-based map for tef. Theor. Appl. Genet. 2011, 122, 77–93. [Google Scholar] [CrossRef] [PubMed]
  29. Zhang, D.; Ayele, M.; Tefera, H.; Nguyen, H.T. RFLP linkage map of the Ethiopian cereal tef [Eragrostis tef (Zucc) Trotter]. Theor. Appl. Genet. 2001, 102, 957–964. [Google Scholar] [CrossRef]
  30. Assefa, K.; Yu, J.K.; Zeid, M.; Belay, G.; Tefera, H.; Sorrells, M.E. Breeding tef [Eragrostis tef (Zucc.) trotter]: Conventional and molecular approaches. Plant Breed. 2011, 130, 1–9. [Google Scholar] [CrossRef]
  31. Girma, D.; Assefa, K.; Chanyalew, S.; Cannarozzi, G.; Kuhlemeier, C.; Tadele, Z. The origins and progress of genomics research on tef (Eragrostis tef). Plant Biotechnol. J. 2014, 12, 534–540. [Google Scholar] [CrossRef] [PubMed]
  32. Assefa, K.; Cannarozzi, G.; Girma, D.; Kamies, R.; Chanyalew, S.; Plaza-Wüthrich, S.; Blösch, R.; Rindisbacher, A.; Rafudeen, S.; Tadele, Z. Genetic diversity in tef [Eragrostis tef (Zucc.) Trotter]. Front. Plant Sci. 2015, 6, 1–13. [Google Scholar] [CrossRef] [PubMed]
  33. Nanjo, Y.; Nouri, M.Z.; Komatsu, S. Quantitative proteomic analyses of crop seedlings subjected to stress conditions: A commentary. Phytochemistry 2011, 72, 1263–1272. [Google Scholar] [CrossRef] [PubMed]
  34. Balbuena, T.S.; Dias, L.L.C.; Martins, M.L.B.; Chiquieri, T.B.; Santa-Catarina, C.; Floh, E.I.S.; Silveira, V. Challenges in proteome analyses of tropical plants. Braz. J. Plant Physiol. 2011, 23, 91–104. [Google Scholar] [CrossRef]
  35. Cañas, B.; López-Ferrer, D.; Ramos-Fernández, A.; Camafeita, E.; Calvo, E. Mass spectrometry technologies for proteomics. Brief. Funct. Genom. Proteom. 2006, 4, 295–320. [Google Scholar] [CrossRef] [PubMed]
  36. Neilson, K.A.; Gammulla, C.G.; Mirzaei, M.; Imin, N.; Haynes, P.A. Proteomic analysis of temperature stress in plants. Proteomics 2010, 10, 828–845. [Google Scholar] [CrossRef] [PubMed]
  37. Lester, R.N.; Bekele, E. Amino acid composition of the cereal tef and related species of Eragrostis (Gramineae). Cereal Chem. 1981, 58, 113–115. [Google Scholar]
  38. Bekele, E.; Fido, R.J.; Tatham, A.S.; Shewry, P.R. Heterogeneity and polymorphism of seed proteins in tef (Eragrotis tef). Hereditas 1995, 122, 67–72. [Google Scholar] [CrossRef]
  39. Tatham, A.S.; Fido, R.J.; Moore, C.M.; Kasarda, D.D.; Kuzmicky, D.D.; Keen, J.N.; Shewry, P.R. Characterisation of the major prolamins of tef (Eragrostis tef) and finger millet (Eleusine coracana). J. Cereal Sci. 1996, 24, 65–71. [Google Scholar] [CrossRef]
  40. Maxwell, K.; Johnson, G.N. Chlorophyll fluorescence—A practical guide. J. Exp. Bot. 2000, 51, 659–668. [Google Scholar] [CrossRef] [PubMed]
  41. Sherwin, H.W.; Farrant, J.M. Differences in rehydration of three desiccation-tolerant angiosperm species. Ann. Bot. 1996, 78, 703–710. [Google Scholar] [CrossRef]
  42. Reynolds, E.S. The use of lead citrate at high pH as an electron-opaque stain in electron microscopy. J. Cell Biol. 1963, 17, 208–212. [Google Scholar] [CrossRef] [PubMed]
  43. Isaacson, T.; Damasceno, C.M.; Saravanan, R.S.; He, Y.; Catala, C.; Saladie, M.; Rose, J.K. Sample extraction techniques for enhanced proteomic analysis of plant tissues. Nat. Protoc. 2006, 1, 769–774. [Google Scholar] [CrossRef] [PubMed]
  44. Wisniewski, J.R.; Zougman, A.; Nagaraj, N.; Mann, M. Universal sample preparation method for proteome analysis. Nat. Methods 2009, 6, 359–362. [Google Scholar] [CrossRef] [PubMed]
  45. Kessner, D.; Chambers, M.; Burke, R.; Agus, D.; Mallick, P. ProteoWizard: Open source software for rapid proteomics tools development. Bioinformatics 2008, 24, 2534–2536. [Google Scholar] [CrossRef] [PubMed]
  46. Deutsch, E.W.; Csordas, A.; Sun, Z.; Jarnuczak, A.; Perez-Riverol, Y.; Ternent, T.; Campbell, D.S.; Bernal-Llinares, M.; Okuda, S.; Kawano, S.; et al. The ProteomeXchange consortium in 2017: Supporting the cultural change in proteomics public data deposition. Nucleic Acids Res. 2017, 45, D1100–D1106. [Google Scholar] [CrossRef] [PubMed]
  47. Vizcaino, J.A.; Csordas, A.; del-Toro, N.; Dianes, J.A.; Griss, J.; Lavidas, I.; Mayer, G.; Perez-Riverol, Y.; Reisinger, F.; Ternent, T.; et al. 2016 update of the PRIDE database and its related tools. Nucleic Acids Res. 2016, 44, D447–D456. [Google Scholar] [CrossRef] [PubMed]
  48. Stajich, J.E.; Block, D.; Boulez, K.; Brenner, S.E.; Chervitz, S.A.; Dagdigian, C.; Fuellen, G.; Gilbert, J.G.; Korf, I.; Lapp, H.; et al. The Bioperl toolkit: Perl modules for the life sciences. Genome Res. 2002, 12, 1611–1618. [Google Scholar] [CrossRef] [PubMed]
  49. Gentleman, R.C.; Carey, V.J.; Bates, D.M.; Bolstad, B.; Dettling, M.; Dudoit, S.; Ellis, B.; Gautier, L.; Ge, Y.; Gentry, J.; et al. Bioconductor: Open software development for computational biology and bioinformatics. Genome Biol. 2004, 5, R80. [Google Scholar] [CrossRef] [PubMed] [Green Version]
  50. Panse, C.; Grossmann, J. protViz: Visualizing and Analyzing Mass Spectrometry Related Data in Proteomics, version 0.1.26; University of Zurich: Zürich, Switzerland, 2012. [Google Scholar]
  51. Valyova, M.; Stoyanov, S.; Markovska, Y.; Ganeva, Y. Evaluation of in vitro antioxidant activity and free radical scavenging potential of variety of Tagetes erecta L. flowers growing in Bulgaria. Int. J. Appl. Res. Nat. Prod. 2012, 5, 19–25. [Google Scholar]
  52. Miyake, C.; Asada, K. Thylakoid-bound ascorbate peroxidase in spinach chloroplasts and photoreduction of its primary oxidation product monodehydroascorbate radicals in thylakoids. Plant Cell Physiol. 1992, 33, 541–553. [Google Scholar]
  53. Kingston-Smith, A.H.; Foyer, C.H. Overexpression of Mn-superoxide dismutase in maize leaves leads to increased monodehydroascorbate reductase, dehydroascorbate reductase and glutathione reductase activities. J. Exp. Bot. 2000, 51, 1867–1877. [Google Scholar] [CrossRef] [PubMed]
  54. Mundree, S.G.; Whittaker, A.; Thomson, J.A.; Farrant, J.M. An aldose reductase homolog from the resurrection plant Xerophyta viscosa Baker. Planta 2000, 211, 693–700. [Google Scholar] [CrossRef] [PubMed]
  55. Dionisio-Sese, M.L.; Tobita, S. Antioxidant responses of rice seedlings to salinity stress. Plant Sci. 1998, 135, 1–9. [Google Scholar] [CrossRef]
  56. Chance, B.; Maehly, A.C. Assay of catalase and peroxidase. Methods Enzymol. 1955, 2, 764–775. [Google Scholar]
  57. Conesa, A.; Götz, S.; García-Gómez, J.M.; Terol, J.; Talón, M.; Robles, M. Blast2GO: A universal tool for annotation, visualization and analysis in functional genomics research. Bioinformatics 2005, 21, 3674–3676. [Google Scholar] [CrossRef] [PubMed]
  58. Bluthgen, N.; Brand, K.; Cajavec, B.; Swat, M.; Herzel, H.; Beule, D. Biological profiling of gene groups utilizing Gene Ontology. Genome Inform. 2005, 16, 106–115. [Google Scholar] [PubMed]
  59. Farrant, J.M.; Vander Willigen, C.; Loffell, D.A.; Bartsch, S.; Whittaker, A. An investigation into the role of light during desiccation of three angiosperm resurrection plants. Plant Cell Environ. 2003, 26, 1275–1286. [Google Scholar] [CrossRef]
  60. Gotz, S.; Garcia-Gomez, J.M.; Terol, J.; Williams, T.D.; Nagaraj, S.H.; Nueda, M.J.; Robles, M.; Talon, M.; Dopazo, J.; Conesa, A. High-throughput functional annotation and data mining with the Blast2GO suite. Nucleic Acids Res. 2008, 36, 3420–3435. [Google Scholar] [CrossRef] [PubMed]
  61. Balsamo, R.A.; Willigen, C.V.; Bauer, A.M.; Farrant, J. Drought tolerance of selected Eragrostis species correlates with leaf tensile properties. Ann. Bot. 2006, 97, 985–991. [Google Scholar] [CrossRef] [PubMed]
  62. Ahmadizadeh, M.; Valizadeh, M.; Zaefizadeh, M.; Shahbazi, H. Antioxidative protection and electrolyte leakage in Durum wheat under drought stress condition. J. Appl. Sci. Res. 2011, 73, 236–246. [Google Scholar]
  63. Navari-Izzo, F.; Meneguzzo, S.; Loggini, B.; Vazzana, C.; Sgherri, C.L.M. The role of the glutathione system during dehydration of Boea hygroscopica. Physiol. Plant. 1997, 99, 23–30. [Google Scholar] [CrossRef]
  64. Kranner, I.; Birtic, S.; Anderson, K.M.; Pritchard, H.W. Glutathione half-cell reduction potential: A universal stress marker and modulator of programmed cell death? Free Radic. Biol. Med. 2006, 40, 2155–2165. [Google Scholar] [CrossRef] [PubMed]
  65. Smirnoff, N. The role of active oxygen in the response of plants to water deficit and desiccation. New Phytol. 1993, 125, 27–58. [Google Scholar] [CrossRef]
  66. Liu, Y.; Xiong, Y.; Bassham, D.C. Autophagy is required for tolerance of drought and salt stress in plants. Autophagy 2009, 5, 954–963. [Google Scholar] [CrossRef] [PubMed]
  67. Williams, B.; Njaci, I.; Moghaddam, L.; Long, H.; Dickman, M.B.; Zhang, X.; Mundree, S. Trehalose Accumulation Triggers Autophagy during Plant Desiccation. PLoS Genet. 2015, 11, e1005705. [Google Scholar] [CrossRef] [PubMed]
  68. Choe, L.; D’Ascenzo, M.; Relkin, N.R.; Pappin, D.; Ross, P.; Williamson, B.; Guertin, S.; Pribil, P.; Lee, K.H. 8-Plex Quantitation of changes in cerebrospinal fluid protein expression in subjects undergoing intravenous immunoglobulin treatment for Alzheimer’s disease. Proteomics 2007, 7, 3651–3660. [Google Scholar] [CrossRef] [PubMed]
  69. Karp, N.A.; Huber, W.; Sadowski, P.G.; Charles, P.D.; Hester, S.V.; Lilley, K.S. Addressing accuracy and precision issues in iTRAQ quantitation. Mol. Cell. Proteom. 2010, 9, 1885–1897. [Google Scholar] [CrossRef] [PubMed]
  70. Thompson, A.J.; Abu, M.; Hanger, D.P. Key issues in the acquisition and analysis of qualitative and quantitative mass spectrometry data for peptide-centric proteomic experiments. Amino Acids 2012, 43, 1075–1085. [Google Scholar] [CrossRef] [PubMed]
  71. Cappadona, S.; Baker, P.R.; Cutillas, P.R.; Heck, A.J.R.; van Breukelen, B. Current challenges in software solutions for mass spectrometry-based quantitative proteomics. Amino Acids 2012, 43, 1087–1108. [Google Scholar] [CrossRef] [PubMed] [Green Version]
  72. Gupta, N.; Pevzner, P.A. False discovery rates of protein identifications: A strike against the two-peptide rule. J. Proteome Res. 2009, 8, 4173–4181. [Google Scholar] [CrossRef] [PubMed]
  73. Kazan, K. Alternative splicing and proteome diversity in plants: The tip of the iceberg has just emerged. Trends Plant Sci. 2003, 8, 468–471. [Google Scholar] [CrossRef] [PubMed]
  74. Reddy, A.S. Alternative splicing of pre-messenger RNAs in plants in the genomic era. Annu. Rev. Plant Biol. 2007, 58, 267–294. [Google Scholar] [CrossRef] [PubMed]
  75. Duque, P. A role for SR proteins in plant stress responses. Plant Signal. Behav. 2011, 6, 49–54. [Google Scholar] [CrossRef] [PubMed]
  76. Staiger, D. Shaping the Arabidopsis transcriptome through alternative splicing. Adv. Bot. 2015, 2015, 13. [Google Scholar] [CrossRef]
  77. Carpentier, S.C.; Coemans, B.; Podevin, N.; Laukens, K.; Witters, E.; Matsumura, H.; Terauchi, R.; Swennen, R.; Panis, B. Functional genomics in a non-model crop: Transcriptomics or proteomics? Physiol. Plant. 2008, 133, 117–130. [Google Scholar] [CrossRef] [PubMed]
  78. Carpentier, S.C.; Panis, B.; Vertommen, A.; Swennen, R.; Sergeant, K.; Renaut, J.; Laukens, K.; Witters, E.; Samyn, B.; Devreese, B. Proteome analysis of non-model plants: A challenging but powerful approach. Mass Spectrom. Rev. 2008, 27, 354–377. [Google Scholar] [CrossRef] [PubMed]
  79. Romero-Rodriguez, M.C.; Pascual, J.; Valledor, L.; Jorrin-Novo, J. Improving the quality of protein identification in non-model species. Characterization of Quercus ilex seed and Pinus radiata needle proteomes by using SEQUEST and custom databases. J. Proteom. 2014, 105, 85–91. [Google Scholar] [CrossRef] [PubMed]
  80. Carpentier, S.C.; Witters, E.; Laukens, K.; Van Onckelen, H.; Swennen, R.; Panis, B. Banana (Musa spp.) as a model to study the meristem proteome: Acclimation to osmotic stress. Proteomics 2007, 7, 92–105. [Google Scholar] [CrossRef] [PubMed]
  81. Hajheidari, M.; Abdollahian-Noghabi, M.; Askari, H.; Heidari, M.; Sadeghian, S.Y.; Ober, E.S.; Salekdeh, G.H. Proteome analysis of sugar beet leaves under drought stress. Proteomics 2005, 5, 950–960. [Google Scholar] [CrossRef] [PubMed]
  82. Graciet, E.; Lebreton, S.; Gontero, B. Emergence of new regulatory mechanisms in the Benson–Calvin pathway via protein–protein interactions: A glyceraldehyde-3-phosphate dehydrogenase/CP12/phosphoribulokinase complex. J. Exp. Bot. 2004, 55, 1245–1254. [Google Scholar] [CrossRef] [PubMed]
  83. Uematsu, K.; Suzuki, N.; Iwamae, T.; Inui, M.; Yukawa, H. Increased fructose 1,6-bisphosphate aldolase in plastids enhances growth and photosynthesis of tobacco plants. J. Exp. Bot. 2012, 63, 3001–3009. [Google Scholar] [CrossRef] [PubMed]
  84. Salekdeh, G.H.; Komatsu, S. Crop proteomics: Aim at sustainable agriculture of tomorrow. Proteomics 2007, 7, 2976–2996. [Google Scholar] [CrossRef] [PubMed]
  85. Salekdeh, G.H.; Siopongco, J.; Wade, L.J.; Ghareyazie, B.; Bennett, J. Proteomic analysis of rice leaves during drought stress and recovery. Proteomics 2002, 2, 1131–1145. [Google Scholar] [CrossRef]
  86. Kamal, A.H.M.; Cho, K.; Kim, D.E.; Uozumi, N.; Chung, K.Y.; Lee, S.Y.; Choi, J.S.; Cho, S.W.; Shin, C.S.; Woo, S.H. Changes in physiology and protein abundance in salt-stressed wheat chloroplasts. Mol. Biol. Rep. 2012, 39, 9059–9074. [Google Scholar] [CrossRef] [PubMed]
  87. Komatsu, S.; Kamal, A.H.M.; Hossain, Z. Wheat proteomics: Proteome modulation and abiotic stress acclimation. Front. Plant Sci. 2014, 5. [Google Scholar] [CrossRef] [PubMed]
  88. Oh, M.W.; Roy, S.K.; Kamal, A.H.; Cho, K.; Cho, S.W.; Park, C.S.; Choi, J.S.; Komatsu, S.; Woo, S.H. Proteome analysis of roots of wheat seedlings under aluminum stress. Mol. Biol. Rep. 2014, 41, 671–681. [Google Scholar] [CrossRef] [PubMed]
  89. Alvarez, S.; Berla, B.M.; Sheffield, J.; Cahoon, R.E.; Jez, J.M.; Hicks, L.M. Comprehensive analysis of the Brassica juncea root proteome in response to cadmium exposure by complementary proteomic approaches. Proteomics 2009, 9, 2419–2431. [Google Scholar] [CrossRef] [PubMed]
  90. Gill, S.S.; Tuteja, N. Reactive oxygen species and antioxidant machinery in abiotic stress tolerance in crop plants. Plant Physiol. Biochem. 2010, 48, 909–930. [Google Scholar] [CrossRef] [PubMed]
  91. Huang, G.J.; Deng, J.S.; Chen, H.J.; Huang, S.S.; Shih, C.C.; Lin, Y.H. Dehydroascorbate reductase and monodehydroascorbate reductase activities of two metallothionein-like proteins from sweet potato (Ipomoea batatas [L.] Lam. ‘Tainong 57’) storage roots. Bot. Stud. 2013, 54, 7. [Google Scholar] [CrossRef] [PubMed]
  92. Shah, K.; Kumar, R.G.; Verma, S.; Dubey, R.S. Effect of cadmium on lipid peroxidation, superoxide anion generation and activities of antioxidant enzymes in growing rice seedlings. Plant Sci. 2001, 161, 1135–1144. [Google Scholar] [CrossRef]
  93. Zhang, J.; Kirkham, M.B. Drought-stress-induced changes in activities of superoxide dismutase, catalase, and peroxidase in wheat species. Plant Cell Physiol. 1994, 35, 785–791. [Google Scholar] [CrossRef]
  94. Mittler, R.; Vanderauwera, S.; Gollery, M.; Van Breusegem, F. Reactive oxygen gene network of plants. Trends Plant Sci. 2004, 9, 490–498. [Google Scholar] [CrossRef] [PubMed]
  95. Sreenivasulu, N.; Ramanjulu, S.; Ramachandra-Kini, K.; Prakash, H.S.; Shekar-Shetty, H.; Savithri, H.S.; Sudhakar, C. Total peroxidase activity and peroxidase isoforms as modified by salt stress in two cultivars of fox-tail millet with differential salt tolerance. Plant Sci. 1999, 141, 1–9. [Google Scholar] [CrossRef]
  96. Chakraborty, U.; Pradhan, B. Oxidative stress in five wheat varieties (Triticum aestivum L.) exposed to water stress and study of their antioxidant enzyme defense system, water stress responsive metabolites and H2O2 accumulation. Braz. J. Plant Physiol. 2012, 24, 117–130. [Google Scholar] [CrossRef]
  97. Abedi, T.; Pakniyat, H. Antioxidant enzyme changes in response to drought stress in ten cultivars of oilseed Rape (Brassica napus L.). Czech J. Genet. Plant Breed. 2010, 46, 27–34. [Google Scholar]
  98. Nazarli, H.; Zardashti, M.R.; Darvishzadeh, R.; Mohammadi, M. Change in activity of antioxidative enzymes in young leaves of sunflower (Helianthus annuus L.) by application of super absorbent synthetic polymers under drought stress condition. Aust. J. Crop Sci. 2011, 5, 1334–1338. [Google Scholar]
  99. Murthy, S.M.; Devaraj, V.R.; Anitha, P.; Tejavathi, D.H. Studies on the activities of antioxidant enzymes under induced drought stress in in vivo and in vitro plants of Macrotyloma uniflorum (Lam.) Verdc. Recent Res. Sci. Technol. 2012, 4, 34–37. [Google Scholar]
  100. Quan, L.J.; Zhang, B.; Shi, W.W.; Li, H.Y. Hydrogen peroxide in plants: A versatile molecule of the reactive oxygen species network. J. Integr. Plant Biol. 2008, 50, 2–18. [Google Scholar] [CrossRef] [PubMed]
  101. Morell, S.; Follmann, H.; De Tullio, M.; Häberlein, I. Dehydroascorbate and dehydroascorbate reductase are phantom indicators of oxidative stress in plants. FEBS Lett. 1997, 414, 567–570. [Google Scholar] [CrossRef]
  102. Zarsky, V.; Cvrckova, F.; Bischoff, F.; Palme, K. At-GDI1 from Arabidopsis thaliana encodes a rab-specific GDP dissociation inhibitor that complements the sec19 mutation of Saccharomyces cerevisiae. FEBS Lett. 1997, 403, 303–308. [Google Scholar] [CrossRef]
  103. Chrispeels, M.J.; Crawford, N.M.; Schroeder, J.I. Proteins for Transport of Water and Mineral Nutrients across the Membranes of Plant Cells. Plant Cell 1999, 11, 661–675. [Google Scholar] [CrossRef] [PubMed]
  104. Cheung, A.Y.; De Vries, S.C. Membrane trafficking: Intracellular highways and country roads. Plant Physiol. 2008, 147, 1451–1453. [Google Scholar] [CrossRef] [PubMed]
  105. Vernoud, V.; Horton, A.C.; Yang, Z.; Nielsen, E. Analysis of the small GTPase gene superfamily of Arabidopsis. Plant Physiol. 2003, 131, 1191–1208. [Google Scholar] [CrossRef] [PubMed]
  106. Agarwal, P.K.; Agarwal, P.; Jain, P.; Jha, B.; Reddy, M.K.; Sopory, S.K. Constitutive overexpression of a stress-inducible small GTP-binding protein PgRab7 from Pennisetum glaucum enhances abiotic stress tolerance in transgenic tobacco. Plant Cell Rep. 2008, 27, 105–115. [Google Scholar] [CrossRef] [PubMed]
  107. Liu, F.; Guo, J.; Bai, P.; Duan, Y.; Wang, X.; Cheng, Y.; Feng, H.; Huang, L.; Kang, Z. Wheat TaRab7 GTPase is part of the signaling pathway in responses to stripe rust and abiotic stimuli. PLoS ONE 2012, 7, e37146. [Google Scholar] [CrossRef] [PubMed]
  108. Stallkneecht, G.F.; Gilberson, K.M.; Eckhoff, J.L. Tef: Food crop for humans and animals. In New Crops; Janick, J., Simon, J.E., Eds.; Wiley: New York, NY, USA, 1993; pp. 231–234. [Google Scholar]
  109. Couee, I.; Sulmon, C.; Gouesbet, G.; El Amrani, A. Involvement of soluble sugars in reactive oxygen species balance and responses to oxidative stress in plants. J. Exp. Bot. 2006, 57, 449–459. [Google Scholar] [CrossRef] [PubMed]
  110. Jain, M. Emerging role of metabolic pathways in abiotic stress tolerance. J. Plant Biochem. Physiol. 2013, 1, 108. [Google Scholar] [CrossRef]
  111. Jacoby, R.P.; Li, L.; Huang, S.; Pong Lee, C.; Millar, A.H.; Taylor, N.L. Mitochondrial composition, function and stress response in plants. J. Integr. Plant Biol. 2012, 54, 887–906. [Google Scholar] [CrossRef] [PubMed]
  112. Keunen, E.; Remans, T.; Bohler, S.; Vangronsveld, J.; Cuypers, A. Metal-induced oxidative stress and plant mitochondria. Int. J. Mol. Sci. 2011, 12, 6894–6918. [Google Scholar] [CrossRef] [PubMed]
  113. Peltier, G.; Cournac, L. Chlororespiration. Annu. Rev. Plant Biol. 2002, 53, 523–550. [Google Scholar] [CrossRef] [PubMed]
  114. Peng, L.; Yamamoto, H.; Shikanai, T. Structure and biogenesis of the chloroplast NAD(P)H dehydrogenase complex. (BBA) Bioenergetics 2011, 1807, 945–953. [Google Scholar] [CrossRef] [PubMed]
  115. Rumeau, D.; Becuwe-Linka, N.; Beyly, A.; Louwagie, M.; Garin, J.; Peltier, G. New subunits NDH-M, -N, and -O, encoded by nuclear genes, are essential for plastid Ndh complex functioning in higher plants. Plant Cell 2005, 17, 219–232. [Google Scholar] [CrossRef] [PubMed]
  116. Huda, K.M.K.; Banu, M.S.A.; Tuteja, R.; Tuteja, N. Global calcium transducer P-type Ca2+-ATPases open new avenues for agriculture by regulating stress signalling. J. Exp. Bot. 2013, 64, 3099–3109. [Google Scholar] [CrossRef] [PubMed]
  117. Peiter, E.; Montanini, B.; Gobert, A.; Pedas, P.; Husted, S.; Maathuis, F.J.M.; Blaudez, D.; Chalot, M.; Sanders, D. A secretory pathway-localized cation diffusion facilitator confers plant manganese tolerance. Proc. Natl. Acad. Sci. USA 2007, 104, 8532–8537. [Google Scholar] [CrossRef] [PubMed]
  118. Le Gall, H.; Philippe, F.; Domon, J.-M.; Gillet, F.; Pelloux, J.; Rayon, C. Cell wall metabolism in response to abiotic stress. Plants 2015, 4, 112. [Google Scholar] [CrossRef] [PubMed]
  119. Marshall, J.G.; Dumbroff, E.B. Turgor regulation via cell wall adjustment in white spruce. Plant Physiol. 1999, 119, 313–320. [Google Scholar] [CrossRef] [PubMed]
  120. Moore, J.P.; Nguema-Ona, E.; Chevalier, L.; Lindsey, G.G.; Brandt, W.F.; Lerouge, P.; Farrant, J.M.; Driouich, A. Response of the leaf cell wall to desiccation in the resurrection plant Myrothamnus flabellifolius. Plant Physiol. 2006, 141, 651–662. [Google Scholar] [CrossRef] [PubMed]
  121. Wu, Y.; Cosgrove, D.J. Adaptation of roots to low water potentials by changes in cell wall extensibility and cell wall proteins. J. Exp. Bot. 2000, 51, 1543–1553. [Google Scholar] [CrossRef] [PubMed]
  122. Pelleschi, S.; Rocher, J.P.; Prioul, J.L. Effect of water restriction on carbohydrate metabolism and photosynthesis in mature maize leaves. Plant Cell Environ. 1997, 20, 493–503. [Google Scholar] [CrossRef]
  123. Du, Y.C.; Nose, A.; Wasano, K. Effects of chilling temperature on photosynthetic rates, photosynthetic enzyme activities and metabolite levels in leaves of three sugarcane species. Plant Cell Environ. 1999, 22, 317–324. [Google Scholar] [CrossRef]
  124. Whittaker, A.; Martinelli, T.; Farrant, J.M.; Bochicchio, A.; Vazzana, C. Sucrose phosphate synthase activity and the co-ordination of carbon partitioning during sucrose and amino acid accumulation in desiccation-tolerant leaf material of the C4 resurrection plant Sporobolus stapfianus during dehydration. J. Exp. Bot. 2007, 58, 3775–3787. [Google Scholar] [CrossRef] [PubMed]
  125. Abreu, I.A.; Farinha, A.P.; Negrão, S.; Gonçalves, N.; Fonseca, C.; Rodrigues, M.; Batista, R.; Saibo, N.J.M.; Oliveira, M.M. Coping with abiotic stress: Proteome changes for crop improvement. J. Proteom. 2013, 93, 145–168. [Google Scholar] [CrossRef] [PubMed]
  126. Eckardt, N.A. Alternative splicing confers a dual role in polar auxin transport and drought stress tolerance to the major facilitator superfamily transporter ZIFL1. Plant Cell 2013, 25, 779. [Google Scholar] [CrossRef] [PubMed]
  127. Atkinson, N.J.; Urwin, P.E. The interaction of plant biotic and abiotic stresses: From genes to the field. J. Exp. Bot. 2012, 63, 3523–3543. [Google Scholar] [CrossRef] [PubMed]
Figure 1. Tef plants subjected to 20 day dehydration treatment: (A) leaf relative water content (RWC) of tef plants maintained at full hydration (solid lines, H1–H3) and subjected to dehydration (dashed lines, D1–D3), values are means of five replicates and error bars represent standard error between replicates; (B) fully hydrated tef plants (~85% RWC, ~3 g H2O∙gdw−1); (C) plants after 13 days of withholding water (~50% RWC,~1.5 g H2O∙gdw−1); (D) after 17 days of no water (~25% RWC,~1 g H2O∙gdw−1).
Proteomes 05 00032 g001
Figure 2. Tef leaf membrane permeability and photosynthetic potential during dehydration. (A) changes in electrolyte leakage and (B) quantum efficiency of PS II (Fv/Fm) during photosynthesis. Electrolyte leakage values (n ≥ 6) were pooled from dehydrated plants at designated RWCs and Fv/Fm measurements were conducted in triplicate at each RWC point (n ≥ 3). Error bars denote standard error between replicates.
Proteomes 05 00032 g002
Figure 3. Transmission Electron Micrographs (TEM) of mesophyll cells from tef leaf tissues: (A) in the hydrated state at 87% RWC; (B) 50% RWC; (C) 30% RWC and (D) 20% RWC. C = chloroplast, V = vacuole, A = autophagosomes; M = mitochondria, CW = cell wall, and PG = plastoglobuli. White arrows = cell wall folding, black arrows = cell wall breakage. Scale bar = 1 μm.
Proteomes 05 00032 g003
Figure 4. Western blot validation of the upregulated protein FBA; (A) protein band intensities are at the correct molecular weights (kDa) for fructose bisphosphate (FBA) tested at hydrated (Hyd-92% RWC, control) and dehydrated conditions (D1–55, D2–52 and D3—50% RWC); (B) relative quantification of band intensities (n ≥ 5) were performed and analysed for statistical significance (p-values ≤ 0.05) using one-way ANOVA, shown by asterisks (*** p-value ≤ 0.001; **** p-value ≤ 0.0001) placed on RWC points significant to control. Error bars denote standard error between tested replicates.
Proteomes 05 00032 g004
Figure 5. Relative enzyme activities of selected upregulated proteins: (A) monodehydroascorbate reductase (MDHAR); (B) fructose bisphosphate aldolase (FBA) and (C) peroxidase (POX). Enzymes were assayed from each RWC range (90–95% to 25–30% RWC) where enzyme activities (n ≥ 10), displayed as specific activity (enzyme units. mg·protein−1) were measured in tef leaves throughout dehydration stress. Statistical significance (p-values < 0.05) was done by one-way ANOVA with hydrated as control, shown by asterisks (* p-value ≤ 0.05; *** p-value ≤ 0.001; **** p-value ≤ 0.0001). Error bars denote standard error between tested replicates.
Proteomes 05 00032 g005
Figure 6. Histograms showing GO-term processes allocated to tef foreground (test set) vs. tef background (reference set) in response to dehydration stress: (A) tef upregulated proteins; (B) tef downregulated proteins. GO-term results are summarised according to the categories cellular component (CC), molecular function (MF) and biological process (BP), where terms have been reduced to the most specific GO (FDR, 0.05).
Proteomes 05 00032 g006
Table 1. TE upregulated proteins in response to dehydration stress *.
Protein IDProtein DescriptionHydrated (Group 1)Dehydrated (Group 2)Fold Changep-Value
CL1Contig10009---NA---7.228.091.120.001
CL5492Contig2fructose-bisphosphate aldolase cytoplasmic isozyme10.7010.861.020.001
CL856Contig340s ribosomal protein s289.179.331.020.001
CL856Contig440s ribosomal protein s289.179.331.020.001
CL68Contig25peroxidase 3-rare cold-inducible protein7.147.731.080.002
CL4104Contig2gras family protein 20.694.686.750.003
CL3156Contig1---NA---0.696.058.730.004
CL6974Contig4---NA---0.696.058.730.004
CL715Contig2protease includes: reverse transcriptase inlcudes: endonuclease9.039.431.040.004
Locus_2136_1_5ENO2_ERATE, Enolase 2 11.0111.181.020.004
CL8690Contig2---NA---0.695.347.700.005
CL1942Contig1---NA---0.694.536.540.006
CL2699Contig6monodehydroascorbate cytoplasmic isoform 20.694.536.540.006
isotig02308probable monodehydroascorbate cytoplasmic isoform 20.694.536.540.006
CL2976Contig3---NA---0.694.947.120.007
CL68Contig6peroxidase 3-rare cold-inducible protein0.664.496.820.008
CL799Contig2hua2-like protein 29.359.581.020.008
CL8983Contig3---NA---0.664.496.820.008
CL2991Contig2hydroxyphenylpyruvate reductase10.2210.291.010.009
CL3629Contig1poly polymerase i0.695.137.410.013
CL3629Contig2poly polymerase i0.695.137.410.013
CL7746Contig3---NA---0.695.047.280.013
CL873Contig3cyclin-p4-10.695.047.280.013
CL2289Contig1---NA---6.607.551.140.014
CL2761Contig4red chlorophyll catabolite reductase8.789.121.040.014
CL5492Contig1fructose-bisphosphate aldolase cytoplasmic isozyme10.6610.841.020.014
CL1Contig421calcium-dependent protein kinase 57.838.401.070.015
CL1Contig7756serine carboxypeptidase-like 519.519.771.030.015
CL3374Contig5---NA---0.695.417.800.016
CL57Contig23---NA---0.695.417.800.016
CL4404Contig1---NA---4.756.491.370.017
CL8759Contig1proteasome subunit beta type-34.756.491.370.017
CL8759Contig2proteasome subunit beta type-34.756.491.370.017
CL1Contig7029protease includes: reverse transcriptase includes:endonuclease6.947.761.120.018
CL1Contig4553chlorophyll a-b binding protein chloroplastic7.167.821.090.019
CL2228Contig1s phase cyclin a-associated protein in the endoplasmic reticulum9.049.191.020.019
CL124Contig7---NA---8.829.241.050.02
CL415Contig1glutathione hydrolase 36.587.511.140.02
CL124Contig2---NA---8.308.721.050.021
CL3894Contig4leucoanthocyanidin dioxygenase0.695.497.920.021
CL1498Contig7guanosine nucleotide diphosphate dissociation inhibitor 25.566.771.220.022
CL413Contig11u-box domain-containing protein 47.187.961.110.022
CL8890Contig3ENO3_ERATE, Enolase 310.9611.081.010.022
CL1888Contig1glycerophosphodiester phosphodiesterase gdpdl311.4011.611.020.023
CL1888Contig2glycerophosphodiester phosphodiesterase gdpdl311.4011.611.020.023
CL1498Contig4guanosine nucleotide diphosphate dissociation inhibitor 16.537.061.080.024
CL1498Contig5guanosine nucleotide diphosphate dissociation inhibitor 26.537.061.080.024
CL5028Contig3plant intracellular ras-group-related lrr protein 68.989.211.030.024
isotig02787guanosine nucleotide diphosphate dissociation inhibitor 26.537.061.080.024
CL3527Contig4nucleolar complex protein 2 homolog6.247.621.220.027
CL1Contig6763---NA---5.576.631.190.028
CL1224Contig6gtp-binding protein sar1a7.638.201.070.029
CL90Contig16---NA---7.598.021.060.029
CL18849Contig1---NA---5.796.541.130.031
CL4737Contig2acetohydroxy-acid reductoisomerase9.659.891.030.032
CL577Contig14ubiquinol oxidase chloroplastic chromoplastic9.399.561.020.032
CL24657Contig1fructokinase-17.487.921.060.036
CL546Contig2f-box protein skip245.266.161.170.036
CL7996Contig1fructokinase-17.487.921.060.036
CL1073Contig1peptidyl-prolyl cis-trans isomerase d7.157.791.090.037
CL3347Contig4delta-aminolevulinic acid chloroplastic8.689.001.040.037
CL5Contig21probable wrky transcription factor 197.728.191.060.037
CL7405Contig3chlorophyll a-b binding protein cp24 chloroplastic s10.7110.851.010.038
CL136Contig17---NA---7.588.241.090.04
CL1Contig5054f-box only protein 87.307.681.050.04
CL326Contig6---NA---4.926.561.330.04
CL3687Contig5---NA---4.926.561.330.04
CL4000Contig1monodehydroascorbate reductase9.9910.261.030.04
CL4000Contig2monodehydroascorbate reductase9.9910.261.030.04
CL4000Contig3monodehydroascorbate reductase9.9910.261.030.04
CL4207Contig1---NA---4.926.561.330.04
CL445Contig4elongator complex protein 64.926.561.330.04
CL445Contig6elongator complex protein 74.926.561.330.04
CL4771Contig3---NA---4.926.561.330.04
CL4956Contig4premnaspirodiene oxygenase4.926.561.330.04
CL522Contig8---NA---4.926.561.330.04
CL6050Contig1---NA---4.926.561.330.04
CL7668Contig1nadh dehydrogenase complex assembly factor 66.777.661.130.04
CL7668Contig2nadh dehydrogenase complex assembly factor 66.777.661.130.04
CL837Contig7cell division cycle protein 48 homolog10.7810.961.020.04
CL102Contig20---NA---6.347.081.120.041
CL5577Contig3---NA---7.347.841.070.041
CL1Contig7889---NA---8.429.031.070.042
CL2761Contig3red chlorophyll catabolite reductase8.598.971.040.042
CL836Contig11probable polyamine transporter7.788.381.080.042
CL4591Contig2phosphatidylinositol n-acetylglucosaminyltransferase subunit a8.959.181.030.043
CL61Contig20probable ufm1-specific protease8.158.641.060.043
CL61Contig7probable ufm1-specific protease8.158.641.060.043
CL4852Contig2---NA---9.189.681.050.046
CL2637Contig1peroxisome biogenesis protein 6 (PEX6)9.8510.061.020.047
CL680Contig10elongation factor tu gtp-binding domain-containing protein 27.438.051.080.048
CL680Contig5elongation factor tu gtp-binding domain-containing protein 27.438.051.080.048
CL7065Contig1---NA---5.586.491.160.048
CL7065Contig2---NA---5.586.491.160.048
CL140Contig10npk1-activating kinesin-18.989.271.030.049
CL4289Contig6---NA---8.298.581.030.049
isotig08284protein disulfide isomerase-like 1-110.7610.981.020.049
* Protein ID: protein identifier; protein description: identified protein; hydrated: averaged quantitative expression value of group 1 (hydrated labels 115–117); dehydrated: averaged quantitative expression value of group 2 (dehydrated labels 118–121); fold change: change in quantitative expression of proteins with dehydration stress (group 2/group 1), where values >1 display an increase in protein expression; p-value: associated p-value during two-group analysis for statistical significance (p-value ≤ 0.05).
Table 2. TE downregulated proteins in response to dehydration stress *.
Protein IDProtein DescriptionHydrated (Group 1)Dehydrated (Group 2)Fold Changep-Value
CL5604Contig12-methyl-6-phytyl-hydroquinone methyltransferase chloroplastic9.368.940.960.001
CL977Contig4---NA---7.707.080.920.001
CL2349Contig3protein dek9.779.350.960.002
CL36Contig35nad-dependent malic enzyme 59 kda mitochondrial10.5210.360.990.002
CL5457Contig2---NA---9.098.910.980.002
CL11972Contig1metal tolerance protein 56.231.190.190.004
CL700Contig3nad-dependent malic enzyme 62 kda mitochondrial9.379.120.970.005
CL236Contig5probable sucrose-phosphate synthase 29.469.210.970.006
CL236Contig6probable sucrose-phosphate synthase 29.449.180.970.006
CL1456Contig11s-adenosylmethionine decarboxylase proenzyme5.330.690.130.007
CL1456Contig8s-adenosylmethionine decarboxylase proenzyme5.330.690.130.007
CL2948Contig2haloalkane dehalogenase9.859.630.980.007
isotig10649s-adenosylmethionine decarboxylase proenzyme5.330.690.130.007
CL13Contig40rhodanese-like domain-containing protein 108.667.800.900.009
CL1595Contig2---NA---4.990.690.140.009
CL1042Contig2alpha-glucan water chloroplastic9.419.130.970.01
CL19Contig25---NA---8.928.290.930.01
CL7534Contig1cellulose synthase-like protein a97.366.550.890.01
CL7716Contig2---NA---7.787.250.930.013
CL7716Contig3Putative uncharacterized protein CysX7.787.250.930.013
CL7582Contig1ribosomal rna processing protein 36 homolog8.477.750.920.014
CL14686Contig1alliin lyase 15.510.690.130.015
CL2382Contig6chlorophyll a-b binding chloroplastic9.398.990.960.015
Locus_49_75_82---NA---11.1210.920.980.015
CL1759Contig3---NA---7.617.190.940.016
CL1Contig8969---NA---10.5410.400.990.016
CL14672Contig1---NA---8.337.870.940.017
CL16131Contig1---NA---8.337.870.940.017
CL456Contig16---NA---10.129.950.980.017
CL7059Contig2cytochrome b561 and domon domain-containing protein8.007.360.920.017
CL9348Contig2ras-related protein raba5c; ras-related protein ara-4; ras-related protein rab11f9.078.730.960.017
CL1630Contig1nad h azoreductase9.339.120.980.018
CL3227Contig1---NA---5.690.690.120.018
CL3227Contig2---NA---5.690.690.120.018
CL58Contig14---NA---5.690.690.120.018
CL58Contig2---NA---5.690.690.120.018
CL467Contig12---NA---9.789.570.980.02
isotig23406photosystem ii protein d110.5910.330.980.02
CL1Contig3562---NA---8.207.530.920.022
CL3294Contig3nad h-quinone oxidoreductase subunit chloroplastic9.379.170.980.022
CL3294Contig4nad h-quinone oxidoreductase subunit chloroplastic9.379.170.980.022
CL3294Contig5nad h-quinone oxidoreductase subunit chloroplastic9.379.170.980.022
CL3294Contig6nad h-quinone oxidoreductase subunit chloroplastic9.379.170.980.022
CL6495Contig2polyamine oxidase8.918.420.950.022
comp294_c0_seq1nad h-quinone oxidoreductase subunit chloroplastic9.379.170.980.022
CL5963Contig160s ribosomal protein l5-110.9510.860.990.023
CL8805Contig2---NA---9.609.140.950.023
CL5672Contig2---NA---8.498.030.950.024
CL6932Contig1---NA---9.879.600.970.024
Locus_954_4_4---NA---9.879.600.970.024
CL4237Contig3SYN3_ERATE, Asparagine tRNA ligase 39.969.630.970.024
CL4237Contig2SYN8_ERATE, Asparagine tRNA ligase 89.969.630.970.024
CL1805Contig10protein dj-1 homolog b8.067.570.940.025
CL1805Contig2protein dj-1 homolog b8.067.570.940.025
CL1Contig3266---NA---7.907.430.940.025
CL327Contig3cbs domain-containing protein cbsppr17.857.370.940.025
Locus_2288_7_9---NA---9.389.050.970.025
CL2320Contig2---NA---7.276.850.940.026
CL977Contig1---NA---7.276.850.940.026
CL10226Contig1---NA---8.217.200.880.027
CL2336Contig7---NA---9.339.150.980.027
CL1Contig5286metal tolerance protein 55.000.690.140.029
CL1Contig5699metal tolerance protein 65.000.690.140.029
CL1Contig8303metal tolerance protein 55.000.690.140.029
CL73Contig10clathrin heavy chain 111.0510.940.990.03
CL3204Contig2---NA---6.505.770.890.031
CL10162Contig3---NA---7.166.230.870.032
CL349Contig4homeobox-leucine zipper protein roc67.246.700.930.033
CL349Contig7homeobox-leucine zipper protein roc67.246.700.930.033
CL5826Contig1long chain acyl- synthetase 410.3510.180.980.033
CL5826Contig2long chain acyl- synthetase 410.3510.180.980.033
CL5942Contig6---NA---9.198.870.970.033
CL6511Contig2v-type proton atpase subunit g19.829.580.980.033
CL7Contig43---NA---7.487.280.970.033
comp13984_c0_se---NA---8.337.850.940.035
CL1Contig3395endoglucanase 78.197.500.920.036
CL1Contig3396endoglucanase 78.197.500.920.036
CL1Contig3397endoglucanase 78.197.500.920.036
CL3496Contig11chlorophyll a-b binding protein 1b- chloroplastic -light-harvesting complex i10.219.970.980.036
CL154Contig2ankyrin repeat domain-containing protein chloroplastic9.959.700.970.038
CL1Contig4279---NA---9.238.890.960.038
CL4622Contig2rubredoxin11.0110.880.990.038
CL1Contig4299histone-lysine n-methyltransferase setd38.287.840.950.039
CL1Contig4635protease do-like 146.905.870.850.039
CL8953Contig2---NA---9.058.800.970.039
CL5563Contig3---NA---9.088.840.970.04
CL1Contig242bax inhibitor 19.799.670.990.041
CL2736Contig1ubiquinol-cytochrome-c reductase subunit ii9.809.660.990.041
CL3528Contig3golgin candidate 49.248.950.970.041
CL5380Contig1glutathione s-transferase t38.688.500.980.041
CL94Contig6---NA---9.499.330.980.041
CL5774Contig2r60s acidic ribosomal protein p09.929.780.990.042
CL3496Contig14chlorophyll a-b binding protein 1b- chloroplastic -light-harvesting complex i10.119.950.980.043
CL3496Contig15chlorophyll a-b binding protein 1b- chloroplastic -light-harvesting complex i10.119.950.980.043
CL811Contig3myb-like transcription factor 17.476.960.930.043
CL3168Contig2---NA---8.478.060.950.044
Locus_393_4_9---NA---10.9610.810.990.044
CL1Contig492---NA---9.248.990.970.045
CL1Contig6871chlorophyll a-b binding protein chloroplastic11.1910.990.980.045
CL1Contig7112hexose carrier protein hex68.758.570.980.045
CL185Contig19probable disease resistance protein rf459.198.930.970.046
CL885Contig1formin-like protein 39.729.540.980.046
Locus_61_5_6---NA---10.119.920.980.046
CL3496Contig13chlorophyll a-b binding protein 1b- chloroplastic -light-harvesting complex i10.109.880.980.048
CL3496Contig17chlorophyll a-b binding protein 1b- chloroplastic -light-harvesting complex i10.109.880.980.048
CL321Contig12---NA---8.277.660.930.049
CL785Contig5---NA---7.166.680.930.049
CL94Contig5choline chloroplastic9.499.350.990.049
CL131Contig9---NA---7.777.250.930.05
CL19309Contig1---NA---8.538.270.970.05
CL236Contig2---NA---8.878.560.970.05
CL236Contig9---NA---8.878.560.970.05
CL305Contig27---NA---8.538.270.970.05
CL7612Contig2---NA---8.538.270.970.05
* Protein ID: protein identifier; protein description: identified protein; hydrated: averaged quantitative expression value of group 1 (hydrated labels 115–117); dehydrated: averaged quantitative expression value of group 2 (dehydrated labels 118–121); fold change: change in quantitative expression with dehydration stress (group 2/group 1), where values <1 display a decrease in protein expression; p-value: associated p-value during two-group analysis for statistical significance (p-value ≤ 0.05).

