Abstract
We have previously developed an approach, where two-dimensional gel electrophoresis (2DE) was used, followed by sectional analysis of the whole gel using high-resolution nano-liquid chromatography-mass spectrometry (ESI LC-MS/MS). In this study, we applied this approach on the panoramic analysis of proteins and their proteoforms from normal (liver) and cancer (HepG2) cells. This allowed us to detect, in a single proteome, about 20,000 proteoforms coded by more than 4000 genes. A set of 3D-graphs showing distribution of these proteoforms in 2DE maps (profiles) was generated. A comparative analysis of these profiles between normal and cancer cells showed high variability and dynamics of many proteins. Among these proteins, there are some well-known features like alpha-fetoprotein (FETA) or glypican-3 (GPC3) and potential hepatocellular carcinoma (HCC) markers. More detailed information about their proteoforms could be used for generation of panels of more specific biomarkers.
1. Introduction
Today, the main aim in human proteomics is a complete catalogue of all human proteins. As the human genome is deciphered this task becomes clear and purposeful; if there is a protein-coding gene a corresponding protein should be found. Until now, this survey of proteins was performed mainly using a bottom-up approach that includes protein digestion and subsequent mass spectrometric analysis of the peptides produced [1]. The situation in proteomics is much more complicated as proteins can exist as different forms (protein species or proteoforms) [2,3]. In an alternate approach, a detailed analysis of these proteoforms can be done using a top-down approach, where a whole protein is analysed [4,5]. Because of the variety of proteoforms and their range of concentrations (7–8 orders of magnitude) their identification and quantitation is a challenge that is difficult to attain. Recently, we described a combination of top-down and bottom-up approaches to optimize proteomic analysis [6,7,8]. To obtain information about different proteoforms, not just proteins, a sectional analysis of 2DE gels, or so called “pixel-based approach” in combination with ESI LC-MS/MS was used [6,7,8]. We applied this approach to study the human proteome using the cancer cell line HepG2 and normal human liver tissue. Such comparative analysis can be beneficial for obtaining a dynamic profile of the human proteome and revealing possible cancer biomarkers. As hepatocellular carcinoma (HCC) is one of the leading causes of cancer-related deaths worldwide, there is a need for novel biomarkers to increase the sensitivity and specificity of analysis for early HCC diagnosis [9,10,11]. More detailed analysis of proteomes can give us more information about the rearrangements of proteins that happens during cancerogenesis. This information can be used to identify new biomarkers [12,13]. Recently, an excellent in-depth comparative and quantitative proteomic analysis of human adult hepatocytes and HepG2 cells was performed by Wiśniewski et al. [14,15]. Our study, though not as detailed in the number of proteins analyzed, is complementary to this study by broadening the set of different proteoforms detected.
2. Materials and Methods
Human cells (hepatocellular carcinoma, HepG2) were cultured under standard conditions [16] [17,18]. To prepare samples for protein extraction, the cells were detached with 0.25% Trypsin-EDTA solution, washed 3 times with PBS, and treated with Rabillound lysis buffer (7 M urea, 2 M thiourea, 4% CHAPS, 1% DTT, 2% ampholytes, pH 3–10, protease inhibitor mixture) [17,18]. Liver tissue samples were provided within the framework of collaboration with the Chromosome-Centric Human Proteome Project (C-HPP). Extraction was performed by lysis after grinding the tissue in liquid nitrogen according to two-dimensional electrophoresis (2DE) protocol described in [19]. All procedures for 2DE were carried out as described previously [7,20,21]. Gels were stained with Coomassie Blue R350, scanned by ImageScanner III (GE Healthcare, Pittsburgh, PA, USA) and analysed using ImageMaster 2D Platinum 7.0 (GE Healthcare) [22]. The tryptic peptides from crude lysates for MS analysis were obtained using a protocol for filter-aided sample preparation (FASP) [23]. Mass spectrometry was performed according to the protocol for ESI LC-MS/MS described elsewhere [6,22]. Proteolysis was performed by incubation with trypsin (“Trypsin Gold”, 10 µg/mL) at least 4 h at 37 °C. Tryptic peptides were dissolved in 5% (v/v) formic acid. MS/MS analysis was carried out in duplicate on an Orbitrap Q-Exactive Plus (Thermo Scientific, Waltham, MA, USA). Exponentially modified PAI (emPAI) defined as the number of identified peptides divided by the number of theoretically observable tryptic peptides for each protein was used to estimate protein abundance [24,25].
3. Results
We have performed a panoramic study of human proteins and their proteoforms using a cancer cell line (HepG2) and normal liver tissue. Previously, some of these data were already published [7,19]. We generated the list of proteins identified in liver and HepG2 cell extracts using treatment with trypsin according to the FASP protocol [23], and by separation according to pI/Mw using 2DE, followed by sectional analysis of the gel by ESI LC-MS/MS. A total of 20,462 proteoforms encoded by 3773 genes were identified in the case of HepG2 cells [7], and 14,667 proteoforms, encoded by 3305 genes, in the case of liver cells [19]. Here, we present further analyses of these data. The basic information about the number of proteins detected by these methods is presented in Figure 1.
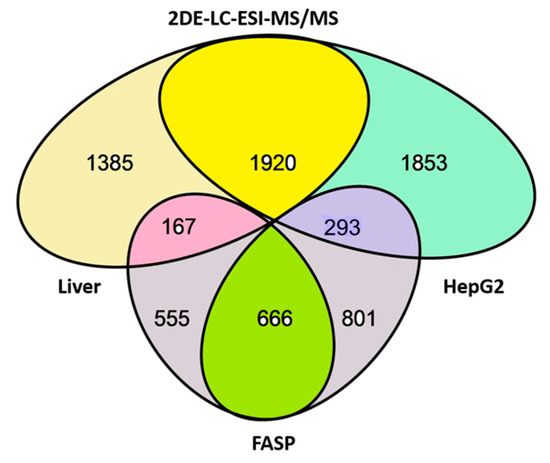
Figure 1.
Overlap of proteins (genes) detected in liver and HepG2 extracts by FASP protocol (bottom ellipses) and by 2DE gel sectional analysis using ESI LC-MS/MS (top ellipses).
In the bottom, the number of proteins (genes) detected by shotgun mass-spectrometry (1221) using FASP protocol (left ellipse (1221): the liver, right ellipse (1467): HepG2 cells) is presented. Only 666 proteins were detected in both liver and HepG2 cells, while 555 proteins were detected only in liver, and 801were detected only in HepG2 cells. This is because of the level of detection sensitivity in our experiment and the levels of proteins in liver and HepG2 cells. The quantity of some proteins is enough to be detected in both samples, but some are only detected in liver and not in HepG2 cells and vice versa. This statement is confirmed by experiments using sectional analysis (top ellipses), when many more proteins were detected. Using sectional analysis, a total of 1920 proteins were detected in both liver and HepG2 cells (including many that were only detected in liver or HepG2 cells before). Again, many proteins were detected in liver only (1385) or HepG2 cells (1853). Concerning sensitivity, it is relevant to stress that only 293 proteins were detected in HepG2 cells but not in liver (in reverse case, 167) using both types of experiments. That confirms our statement about the sensitivity issue. Additionally, it is interesting to compare our data with data published in the paper by Wiśniewski et al. [14]. It happens that most of the abovementioned 293 proteins (detected in HepG2 cells only) were also identified by Wiśniewski et al. [14]. Furthermore, they showed that their level is much higher in HepG2 cells than in hepatocytes. Interestingly, despite the greater sensitivity of detection and the larger number of proteins detected by Wiśniewski et al. [14], they did not detect 30 of these 293 proteins (Supplementary Table S1).
The main part of this study is a set of proteoform profiles that we generated based on a combination of 2DE with LC ESI-MS/MS. We have produced these profiles as 3D graphical images. Some profiles are very similar in both samples and contain only one or two proteoforms (peaks). Often, proteins have many proteoforms, and the profiles for some of them are very different in liver and HepG2 cells. The most abundant peak usually has pI/Mw coordinates that are congruent with theoretical ones. The profiles of some proteins have an exceptionally large amount of proteoforms. Mostly, these are samples from HepG2 cells. Keeping in mind the cancerous nature of these cells, we have paid special attention to proteins that already are used or are under consideration to be used as tumor biomarkers. It is of note that the list of such markers is actually very long [26]. Since our object here is HCC, we narrowed the analysis on biomarkers for this tumor (Table 1).

Table 1.
A list of known and potential biomarkers for hepatocellular carcinoma.
The most well-known protein and the only one approved for clinical usage as a marker for HCC is alpha-fetoprotein (FETA) [27,28]. FETA levels in serum may increase with hepatocyte regeneration and in case of development of HCC [29]. It remains the most commonly used screening biomarker for HCC [10,28]. However, increased serum levels of FETA might be a result of other liver deceases (hepatitis, liver cirrhosis etc.) decreasing the specificity of FETA testing for HCC. Furthermore, FETA is not expressed at high levels in all HCC patients, resulting in decreased sensitivity. Importantly, while FETA protein is not always a good marker for HCC, there is an example of a more specific proteoform which is used as a biomarker. A fucosylated form of serum AFP is most closely associated with HCC. This proteoform is designated as AFP-L3 and used as a more specific biomarker for HCC [30]. In our case, 18 proteoforms of FETA were detected in HepG2 extracts (Figure 2). Even more proteoforms (35) were observed when sectional analysis with higher resolution was applied (Figure 3). In liver extract, this protein was not detected with a great enough reliability (at least two significant sequences). That confirms its usage as a HCC biomarker. There are more proteins from the list of HCC biomarkers (Table 1) that were detected in HepG2 cells only (GPC3, FUCO2, KITH, SRC, SRPK1) (Figure 2). Other proteins were detected in both samples (Figure 4). For instance, profiles of heat shock protein beta (HSPB1) or fibrinogen gamma chain (FIBG) are very similar, but HSP74, ANXA2, ZA2G, CYB5, PGRC1, CATB, HPT are different. In all cases, we can find many proteoforms presented in HepG2 cells but not in liver and vice versa. For instance, in the case of haptoglobin (HPT), which exhibits decreased levels in HCC [11], we observed a strong simplification of the profile in HepG2 cells compared to liver (Figure 4). In the case of heat shock protein beta 1 (HSPB1) and annexin A2 (ANXA2), profiles are very similar in liver and HepG2 cells, but with a clear anodic shift of peaks in HepG2 cells which may be due to phosphorylation, as phosphorylation is a known PTM for these proteins [41,42]). Zinc-alpha-2-glycoprotein (ZA2G) is characterized by a set of different proteoforms (more than 30) distributed all around the gel. Many of these proteoforms have a greater Mw compared to the theoretical Mw (this protein can be heavily glycosylated [43]).
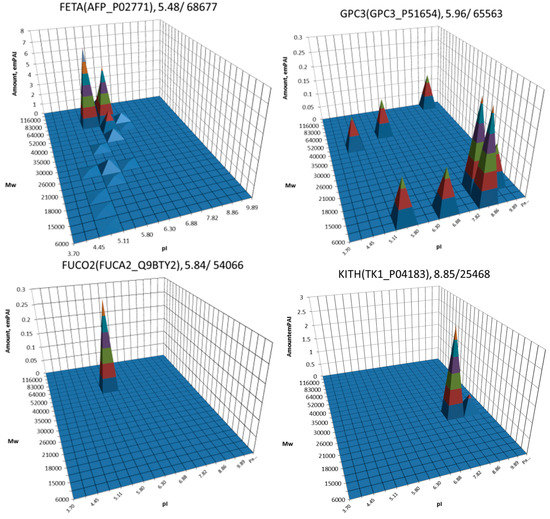
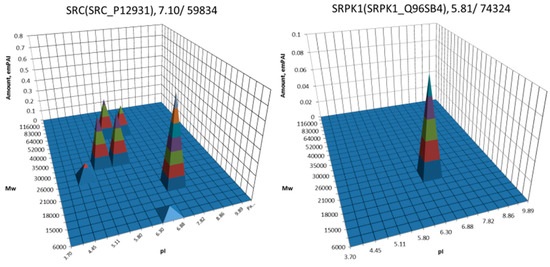
Figure 2.
Profiles of some biomarkers from Table 1 detected in HepG2 cells but not in liver. On the top of each graph we show the protein name, Uniprot number and theoretical pI/Mw. The coordinates are: isoelectric point (pI), molecular weight (Mw), protein abundance (emPAI).
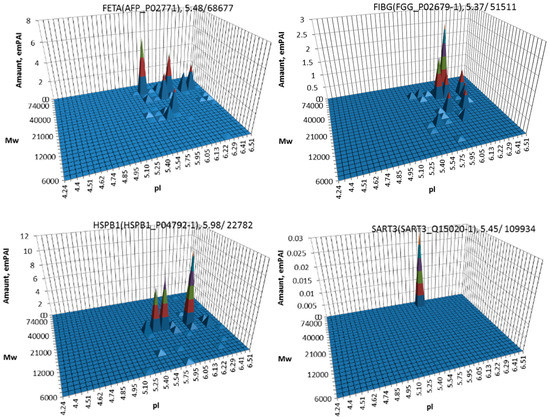
Figure 3.
Profiles of alpha-fetoprotein (FETA), fibrinogen (FIBG), heat shock protein beta 1 (HSPB1), and squamous cell carcinoma antigen (SART3) in HepG2 cells obtained using higher resolution sectional analysis (pI 4-7, gel 24 × 20 cm, 252 sections).
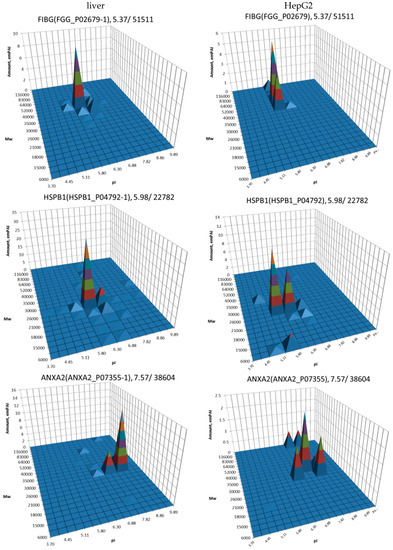
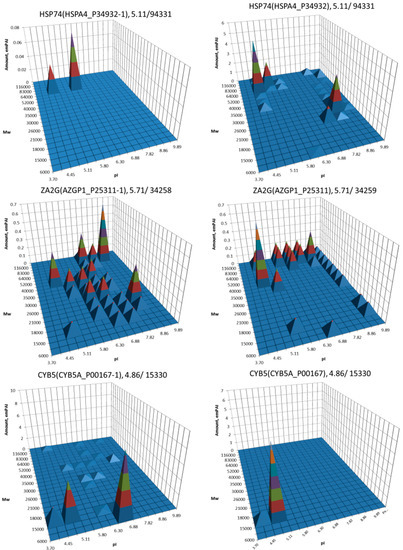
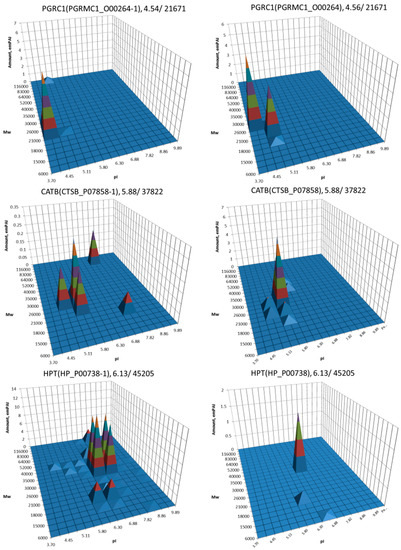
Figure 4.
Profiles of biomarkers from Table 1 detected in HepG2 cells and in liver. Left: liver, right: HepG2 cells. On the top of each graph we show the protein name, Uniprot number, and theoretical pI/Mw. The coordinates are: isoelectric point (pI), molecular weight (Mw), protein abundance (emPAI).
4. Discussion
In general, profiles of proteins in HepG2 cells tend to have more proteoforms (peaks) than in liver, but opposite cases are also observed. According to the positions of the peaks, preliminary assumptions about their origins can be made. For instance, the lower weight proteoforms can be products of proteolysis, which itself can be of different nature (post-translational proteolytic processing, degradation, regulation etc.). The proteoforms having similar Mw but more acidic pI, compared to the theoretical pI, can be the products of PTMs that add negative or remove positive charges (phosphorylation, acetylation, methylation etc.). The shift to the basic direction can be a result of carboxyl group modifications (amidation, esterification). Some PTMs leading to a big shift in pI, as well as in Mw, are ubiquitination, SUMOylation, or glycosylation. Splice variation is another reason to produce peaks located differently from the canonical sequence pI/Mw position. Such situations should not have a great impact as we have been showing only proteoforms of the same isoforms in the graphs. Taken together, we cannot specify the type of modifications but only give an estimation (by pI/Mw) of these proteoforms. For more specific evaluation of proteoforms a detailed analysis of each profile should be performed.
There is a resolution challenge in our experiments. On average, we found that every protein profile in liver and in HepG2 cells has five proteoforms. It is necessary to remind the reader that a single PTM, like acetylation, methylation or phosphorylation can produce a pI shift close to 0.05 [44,45]. However, in our experiments, the size of gel sections in the pI range is much bigger (0.7–0.8). This means that we are missing many cases of slight modifications and detect only heavy modifications. Actually, this is a limited technical restriction and the resolution can be improved by running bigger gels and analyzing smaller gel sections (Figure 3), but it will dramatically increase the time and effort required.
5. Conclusions
A combination of top-down proteomics (2DE separation of proteins) with bottom-up proteomics allows very convenient visual representations of information about diverse proteoforms coded by the same genes (proteoform profiles). Here, we have compared more than 1100 profiles of the most abundant proteins in liver and HepG2 cells. Among them, we analyzed profiles of known and potential HCC markers that could be helpful to further improve the specificity of testing for this disease. In case of alpha-fetoprotein (FETA), we found its presence in HCC as multiple proteoforms. There is a chance that among these there could be forms more specific than AFP-L3. Profiles of heat shock protein beta 1 (HSPB1) and annexin 2 (ANXA2) in HepG2 compare to liver cells are characterized by pronounced shifts of proteoforms towards more acidic pIs. It usually happens in case of phosphorylation or acetylation, and these proteins are known for these PTMs. Accordingly, these proteoforms could be better HCC markers than the levels of HSPB1 and ANXA2.
Supplementary Materials
The following are available online at www.mdpi.com/2227-7382/5/4/33/s1. Table S1: Proteins detected in HepG2 only.
Acknowledgments
The study was supported by Russian Scientific Foundation, grant #15-15-30041. We acknowledge the IBMC “Human Proteome” Core Facility for assistance with the generation of mass-spectrometry data. Carita Lanner is acknowledged for editing assistance.
Author Contributions
A.A. and S.N. conceived and designed the experiments; V.Z., O.P., and A.K. performed the experiments; E.P. and O.K. analyzed the data; S.N. wrote the paper.
Conflicts of Interest
The authors declared no potential conflicts of interest with respect to the research, authorship, and/or publication of this article.
Abbreviations
The following abbreviations are used in this manuscript:
| 2DE | two-dimensional electrophoresis |
| ESI LC-MS/MS | liquid chromatography-electrospray ionization-tandem mass spectrometry |
| HCD | higher energy collisional dissociation |
| ABC | ammonium bicarbonate |
| CAN | acetonitrile |
| PTM | post-translation modification |
| emPAI | exponential modified form of protein abundance index |
| HCC | hepatocellular carcinoma |
References
- Aebersold, R.; Mann, M. Mass spectrometry-based proteomics. Nature 2003, 422, 198–207. [Google Scholar] [CrossRef] [PubMed]
- Smith, L.M.; Kelleher, N.L. Proteoform: A single term describing protein complexity. Nat. Methods 2013, 10, 186–187. [Google Scholar] [CrossRef] [PubMed]
- Schlüter, H.; Apweiler, R.; Holzhütter, H.-G.; Jungblut, P.R. Finding one’s way in proteomics: A protein species nomenclature. Chem. Cent. J. 2009, 3, 11. [Google Scholar] [CrossRef] [PubMed]
- Toby, T.K.; Fornelli, L.; Kelleher, N.L. Progress in Top-Down Proteomics and the Analysis of Proteoforms. Annu. Rev. Anal. Chem. 2016, 9, 499–519. [Google Scholar] [CrossRef] [PubMed]
- Siuti, N.; Kelleher, N.L. Decoding protein modifications using top-down mass spectrometry. Nat. Methods 2007, 4, 817–821. [Google Scholar] [CrossRef] [PubMed]
- Naryzhny, S.N.; Maynskova, M.A.; Zgoda, V.G.; Ronzhina, N.L.; Novikova, S.E.; Belyakova, N.V.; Kleyst, O.A.; Legina, O.K.; Pantina, R.A.; Filatov, M.V. Proteomic profiling of high-grade glioblastoma using virtual-experimental 2DE. J. Proteom. Bioinform. 2016, 9, 158–165. [Google Scholar] [CrossRef]
- Naryzhny, S.N.; Maynskova, M.A.; Zgoda, V.G.; Ronzhina, N.L.; Kleyst, O.A.; Vakhrushev, I.V.; Archakov, A.I. Virtual-Experimental 2DE Approach in Chromosome-Centric Human Proteome Project. J. Proteome Res. 2016, 15, 525–530. [Google Scholar] [CrossRef] [PubMed]
- Naryzhny, S. Towards the Full Realization of 2DE Power. Proteomes 2016, 4, 33. [Google Scholar] [CrossRef] [PubMed]
- Abu El Makarem, M. An overview of biomarkers for the diagnosis of hepatocellular carcinoma. Hepat. Mon. 2012, 12, e6122. [Google Scholar] [CrossRef] [PubMed]
- Wright, L.M.; Kreikemeier, J.T.; Fimmel, C.J. A concise review of serum markers for hepatocellular cancer. Cancer Detect. Prev. 2007, 31, 35–44. [Google Scholar] [CrossRef] [PubMed]
- Lee, N.P.; Chen, L.; Lin, M.C.; Tsang, F.H.; Yeung, C.; Poon, R.T.; Peng, J.; Leng, X.; Beretta, L.; Sun, S.; et al. Proteomic expression signature distinguishes cancerous and nonmalignant tissues in hepatocellular carcinoma. J. Proteome Res. 2009, 8, 1293–1303. [Google Scholar] [CrossRef] [PubMed]
- Gygi, S.P.; Rist, B.; Gerber, S.A.; Turecek, F.; Gelb, M.H.; Aebersold, R. Quantitative analysis of complex protein mixtures using isotope-coded affinity tags. Nat. Biotechnol. 1999, 17, 994–999. [Google Scholar] [CrossRef] [PubMed]
- Ong, S.-E.; Mann, M. Mass spectrometry-based proteomics turns quantitative. Nat. Chem. Biol. 2005, 1, 252–262. [Google Scholar] [CrossRef] [PubMed]
- Wiśniewski, J.R.; Vildhede, A.; Norén, A.; Artursson, P. In-depth quantitative analysis and comparison of the human hepatocyte and hepatoma cell line HepG2 proteomes. J. Proteom. 2016, 136, 234–247. [Google Scholar] [CrossRef] [PubMed]
- Vildhede, A.; Wiśniewski, J.R.; Norén, A.; Karlgren, M.; Artursson, P. Comparative Proteomic Analysis of Human Liver Tissue and Isolated Hepatocytes with a Focus on Proteins Determining Drug Exposure. J. Proteome Res. 2015, 14, 3305–3314. [Google Scholar] [CrossRef] [PubMed]
- Shtam, T.A.; Naryzhny, S.N.; Landa, S.B.; Burdakov, V.S.; Artamonova, T.O.; Filatov, M.V. Purification and in vitro analysis of exosomes secreted by malignantly transformed human cells. Cell Tissue Biol. 2012, 6, 317–325. [Google Scholar] [CrossRef]
- Naryzhny, S.N.; Zgoda, V.G.; Maynskova, M.A.; Ronzhina, N.L.; Belyakova, N.V.; Legina, O.K.; Archakov, A.I. Experimental estimation of proteome size for cells and human plasma. Biomed. Khimiia 2015, 61, 279–285. [Google Scholar] [CrossRef] [PubMed]
- Naryzhny, S.N.; Lisitsa, A.V.; Zgoda, V.G.; Ponomarenko, E.A.; Archakov, A.I. 2DE-based approach for estimation of number of protein species in a cell. Electrophoresis 2014, 35, 895–900. [Google Scholar] [CrossRef] [PubMed]
- Naryzhny, S.; Maynskova, M.; Zgoda, V.; Archakov, A. Dataset of protein species from human liver. Data Br. 2017, 12, 584–588. [Google Scholar] [CrossRef] [PubMed]
- Naryzhny, S.N.; Lee, H. Proliferating cell nuclear antigen in the cytoplasm interacts with components of glycolysis and cancer. FEBS Lett. 2010, 584, 4292–4298. [Google Scholar] [CrossRef] [PubMed]
- Naryzhny, S.N. Blue Dry Western: Simple, economic, informative, and fast way of immunodetection. Anal. Biochem. 2009, 392, 90–95. [Google Scholar] [CrossRef] [PubMed]
- Naryzhny, S.N.; Zgoda, V.G.; Maynskova, M.A.; Novikova, S.E.; Ronzhina, N.L.; Vakhrushev, I.V.; Khryapova, E.V.; Lisitsa, A.V.; Tikhonova, O.V.; Ponomarenko, E.A.; et al. Combination of virtual and experimental 2DE together with ESI LC-MS/MS gives a clearer view about proteomes of human cells and plasma. Electrophoresis 2016, 37, 302–309. [Google Scholar] [CrossRef] [PubMed]
- Wiśniewski, J.R.; Zougman, A.; Nagaraj, N.; Mann, M. Universal sample preparation method for proteome analysis. Nat. Methods 2009, 6, 359–362. [Google Scholar] [CrossRef] [PubMed]
- Ishihama, Y.; Oda, Y.; Tabata, T.; Sato, T.; Nagasu, T.; Rappsilber, J.; Mann, M. Exponentially Modified Protein Abundance Index (emPAI) for Estimation of Absolute Protein Amount in Proteomics by the Number of Sequenced Peptides per Protein. Mol. Cell. Proteom. 2005, 4, 1265–1272. [Google Scholar] [CrossRef] [PubMed]
- Ishihama, Y.; Schmidt, T.; Rappsilber, J.; Mann, M.; Hartl, F.U.; Kerner, M.J.; Frishman, D. Protein abundance profiling of the Escherichia coli cytosol. BMC Genom. 2008, 9, 102. [Google Scholar] [CrossRef] [PubMed]
- Polanski, M.; Anderson, N.L. A list of candidate cancer biomarkers for targeted proteomics. Biomark. Insights 2007, 1, 1–48. [Google Scholar] [CrossRef] [PubMed]
- Lou, J.; Zhang, L.; Lv, S.; Zhang, C.; Jiang, S. Biomarkers for Hepatocellular Carcinoma. Biomark. Cancer 2017, 9, 1–9. [Google Scholar] [CrossRef] [PubMed]
- Chaiteerakij, R.; Addissie, B.D.; Roberts, L.R. Update on Biomarkers of Hepatocellular Carcinoma. Clin. Gastroenterol. Hepatol. 2015, 13, 237–245. [Google Scholar] [CrossRef] [PubMed]
- Bertino, G.; Ardiri, A.; Malaguarnera, M.; Malaguarnera, G.; Bertino, N.; Calvagno, G.S. Hepatocellualar carcinoma serum markers. Semin. Oncol. 2012, 39, 410–433. [Google Scholar] [CrossRef] [PubMed]
- Oka, H.; Saito, A.; Ito, K.; Kumada, T.; Satomura, S.; Kasugai, H.; Osaki, Y.; Seki, T.; Kudo, M.; Tanaka, M. Multicenter prospective analysis of newly diagnosed hepatocellular carcinoma with respect to the percentage of Lens culinaris agglutinin-reactive α-fetoprotein. J. Gastroenterol. Hepatol. (Australia) 2001, 16, 1378–1383. [Google Scholar] [CrossRef]
- Saffroy, R.; Pham, P.; Reffas, M.; Takka, M.; Lemoine, A.; Debuire, B. New perspectives and strategy research biomarkers for hepatocellular carcinoma. Clin. Chem. Lab. Med. 2007, 45, 1169–1179. [Google Scholar] [CrossRef] [PubMed]
- Shiota, G.; Miura, N. Biomarkers for hepatocellular carcinoma. Clin. J. Gastroenterol. 2012, 5, 177–182. [Google Scholar] [CrossRef] [PubMed]
- Zhao, Y.-J.; Ju, Q.; Li, G.-C. Tumor markers for hepatocellular carcinoma. Mol. Clin. Oncol. 2013, 1, 593–598. [Google Scholar] [CrossRef] [PubMed]
- Shang, S.; Plymoth, A.; Ge, S.; Feng, Z.; Rosen, H.R.; Sangrajrang, S.; Hainaut, P.; Marrero, J.A.; Beretta, L. Identification of osteopontin as a novel marker for early hepatocellular carcinoma. Hepatology 2012, 55, 483–490. [Google Scholar] [CrossRef] [PubMed]
- Zhang, S.Y.; Lin, B.D.; Li, B.R. Evaluation of the diagnostic value of alpha-l-fucosidase, alpha-fetoprotein and thymidine kinase 1 with ROC and logistic regression for hepatocellular carcinoma. FEBS Open Bio 2015, 5, 240–244. [Google Scholar] [CrossRef] [PubMed]
- Schmilovitz-Weiss, H.; Tobar, A.; Halpern, M.; Levy, I.; Shabtai, E.; Ben-Ari, Z. Tissue expression of squamous cellular carcinoma antigen and Ki67 in hepatocellular carcinoma-correlation with prognosis: A historical prospective study. Diagn. Pathol. 2011, 6, 121. [Google Scholar] [CrossRef] [PubMed]
- Fimmel, C.J.; Wright, L. Golgi protein 73 as a biomarker of hepatocellular cancer: Development of a quantitative serum assay and expression studies in hepatic and extrahepatic malignancies. Hepatology 2009, 49, 1421–1423. [Google Scholar] [CrossRef] [PubMed]
- Dehm, S.; Senger, M.-A.; Bonham, K. SRC transcriptional activation in a subset of human colon cancer cell lines. FEBS Lett. 2001, 487, 367–371. [Google Scholar] [CrossRef]
- Sigala, I.; Tsamis, K.I.; Gousia, A.; Alexiou, G.; Voulgaris, S.; Giannakouros, T.; Kyritsis, A.P.; Nikolakaki, E. Expression of SRPK1 in gliomas and its role in glioma cell lines viability. Tumor Biol. 2016, 37, 8699–8707. [Google Scholar] [CrossRef] [PubMed]
- Zhu, W.L.; Fan, B.L.; Liu, D.L.; Zhu, W.X. Abnormal expression of fibrinogen gamma (FGG) and plasma level of fibrinogen in patients with hepatocellular carcinoma. Anticancer Res. 2009, 29, 2531–2534. [Google Scholar] [PubMed]
- Faucher, C.; Capdevielle, J.; Canal, I.; Ferrara, P.; Mazarguil, H.; McGuire, W.L.; Darbon, J.M. The 28-kDa protein whose phosphorylation is induced by protein kinase C activators in MCF-7 cells belongs to the family of low molecular mass heat shock proteins and is the estrogen-regulated 24-kDa protein. J. Biol. Chem. 1993, 268, 15168–15173. [Google Scholar] [PubMed]
- Deora, A.B.; Kreitzer, G.; Jacovina, A.T.; Hajjar, K.A. An annexin 2 phosphorylation switch mediates p11-dependent translocation of annexin 2 to the cell surface. J. Biol. Chem. 2004, 279, 43411–43418. [Google Scholar] [CrossRef] [PubMed]
- Chen, R.; Jiang, X.; Sun, D.; Han, G.; Wang, F.; Ye, M.; Wang, L.; Zou, H. Glycoproteomics analysis of human liver tissue by combination of multiple enzyme digestion and hydrazide chemistry. J. Proteome Res. 2009, 8, 651–661. [Google Scholar] [CrossRef] [PubMed]
- Halligan, B.D.; Ruotti, V.; Jin, W.; Laffoon, S.; Twigger, S.N.; Dratz, E.A. ProMoST (Protein Modification Screening Tool): A web-based tool for mapping protein modifications on two-dimensional gels. Nucleic Acids Res. 2004, 32, W638–W644. [Google Scholar] [CrossRef] [PubMed]
- Naryzhny, S.; Zgoda, V.; Kopylov, A.; Petrenko, E.; Archakov, А. A semi-virtual two dimensional gel electrophoresis: IF–ESI LC-MS/MS. MethodsX 2017, 4, 260–264. [Google Scholar] [CrossRef] [PubMed]


© 2017 by the authors. Licensee MDPI, Basel, Switzerland. This article is an open access article distributed under the terms and conditions of the Creative Commons Attribution (CC BY) license (http://creativecommons.org/licenses/by/4.0/).