Comparison between Proteome and Transcriptome Response in Potato (Solanum tuberosum L.) Leaves Following Potato Virus Y (PVY) Infection


Abstract
:1. Introduction
2. Methodology
3. Results
3.1. Proteome Changes in Infected Potato Leaves
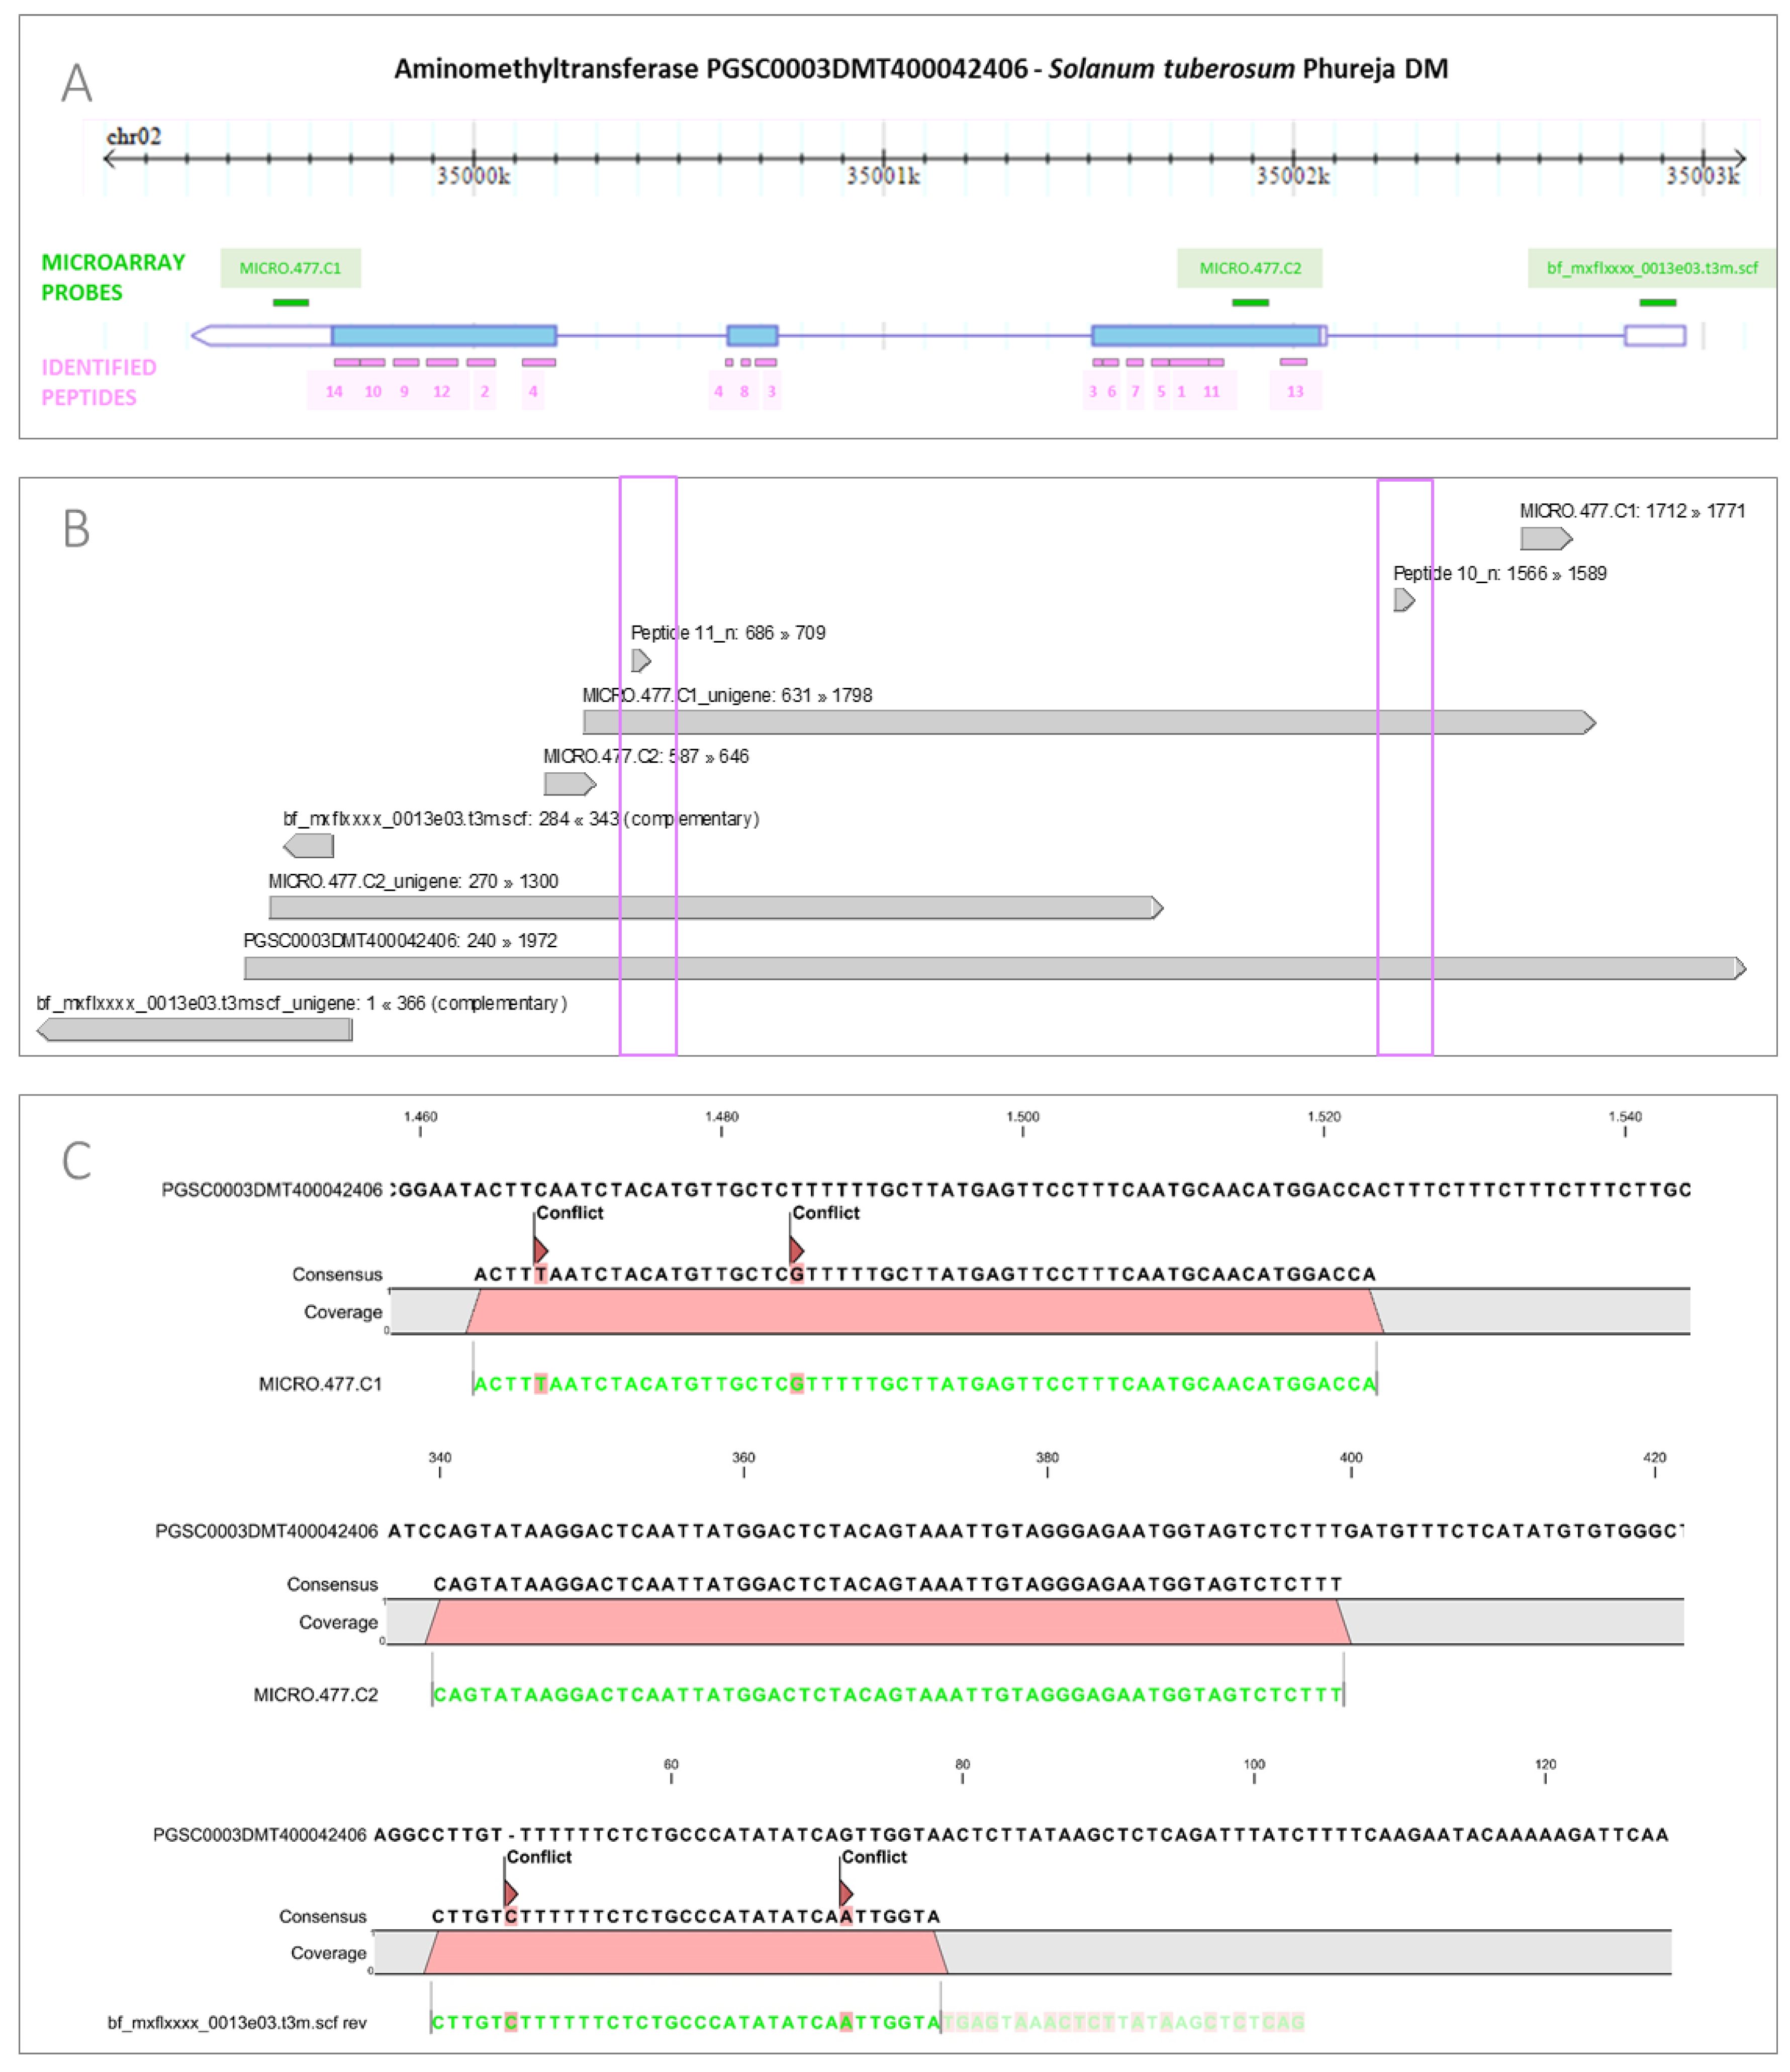
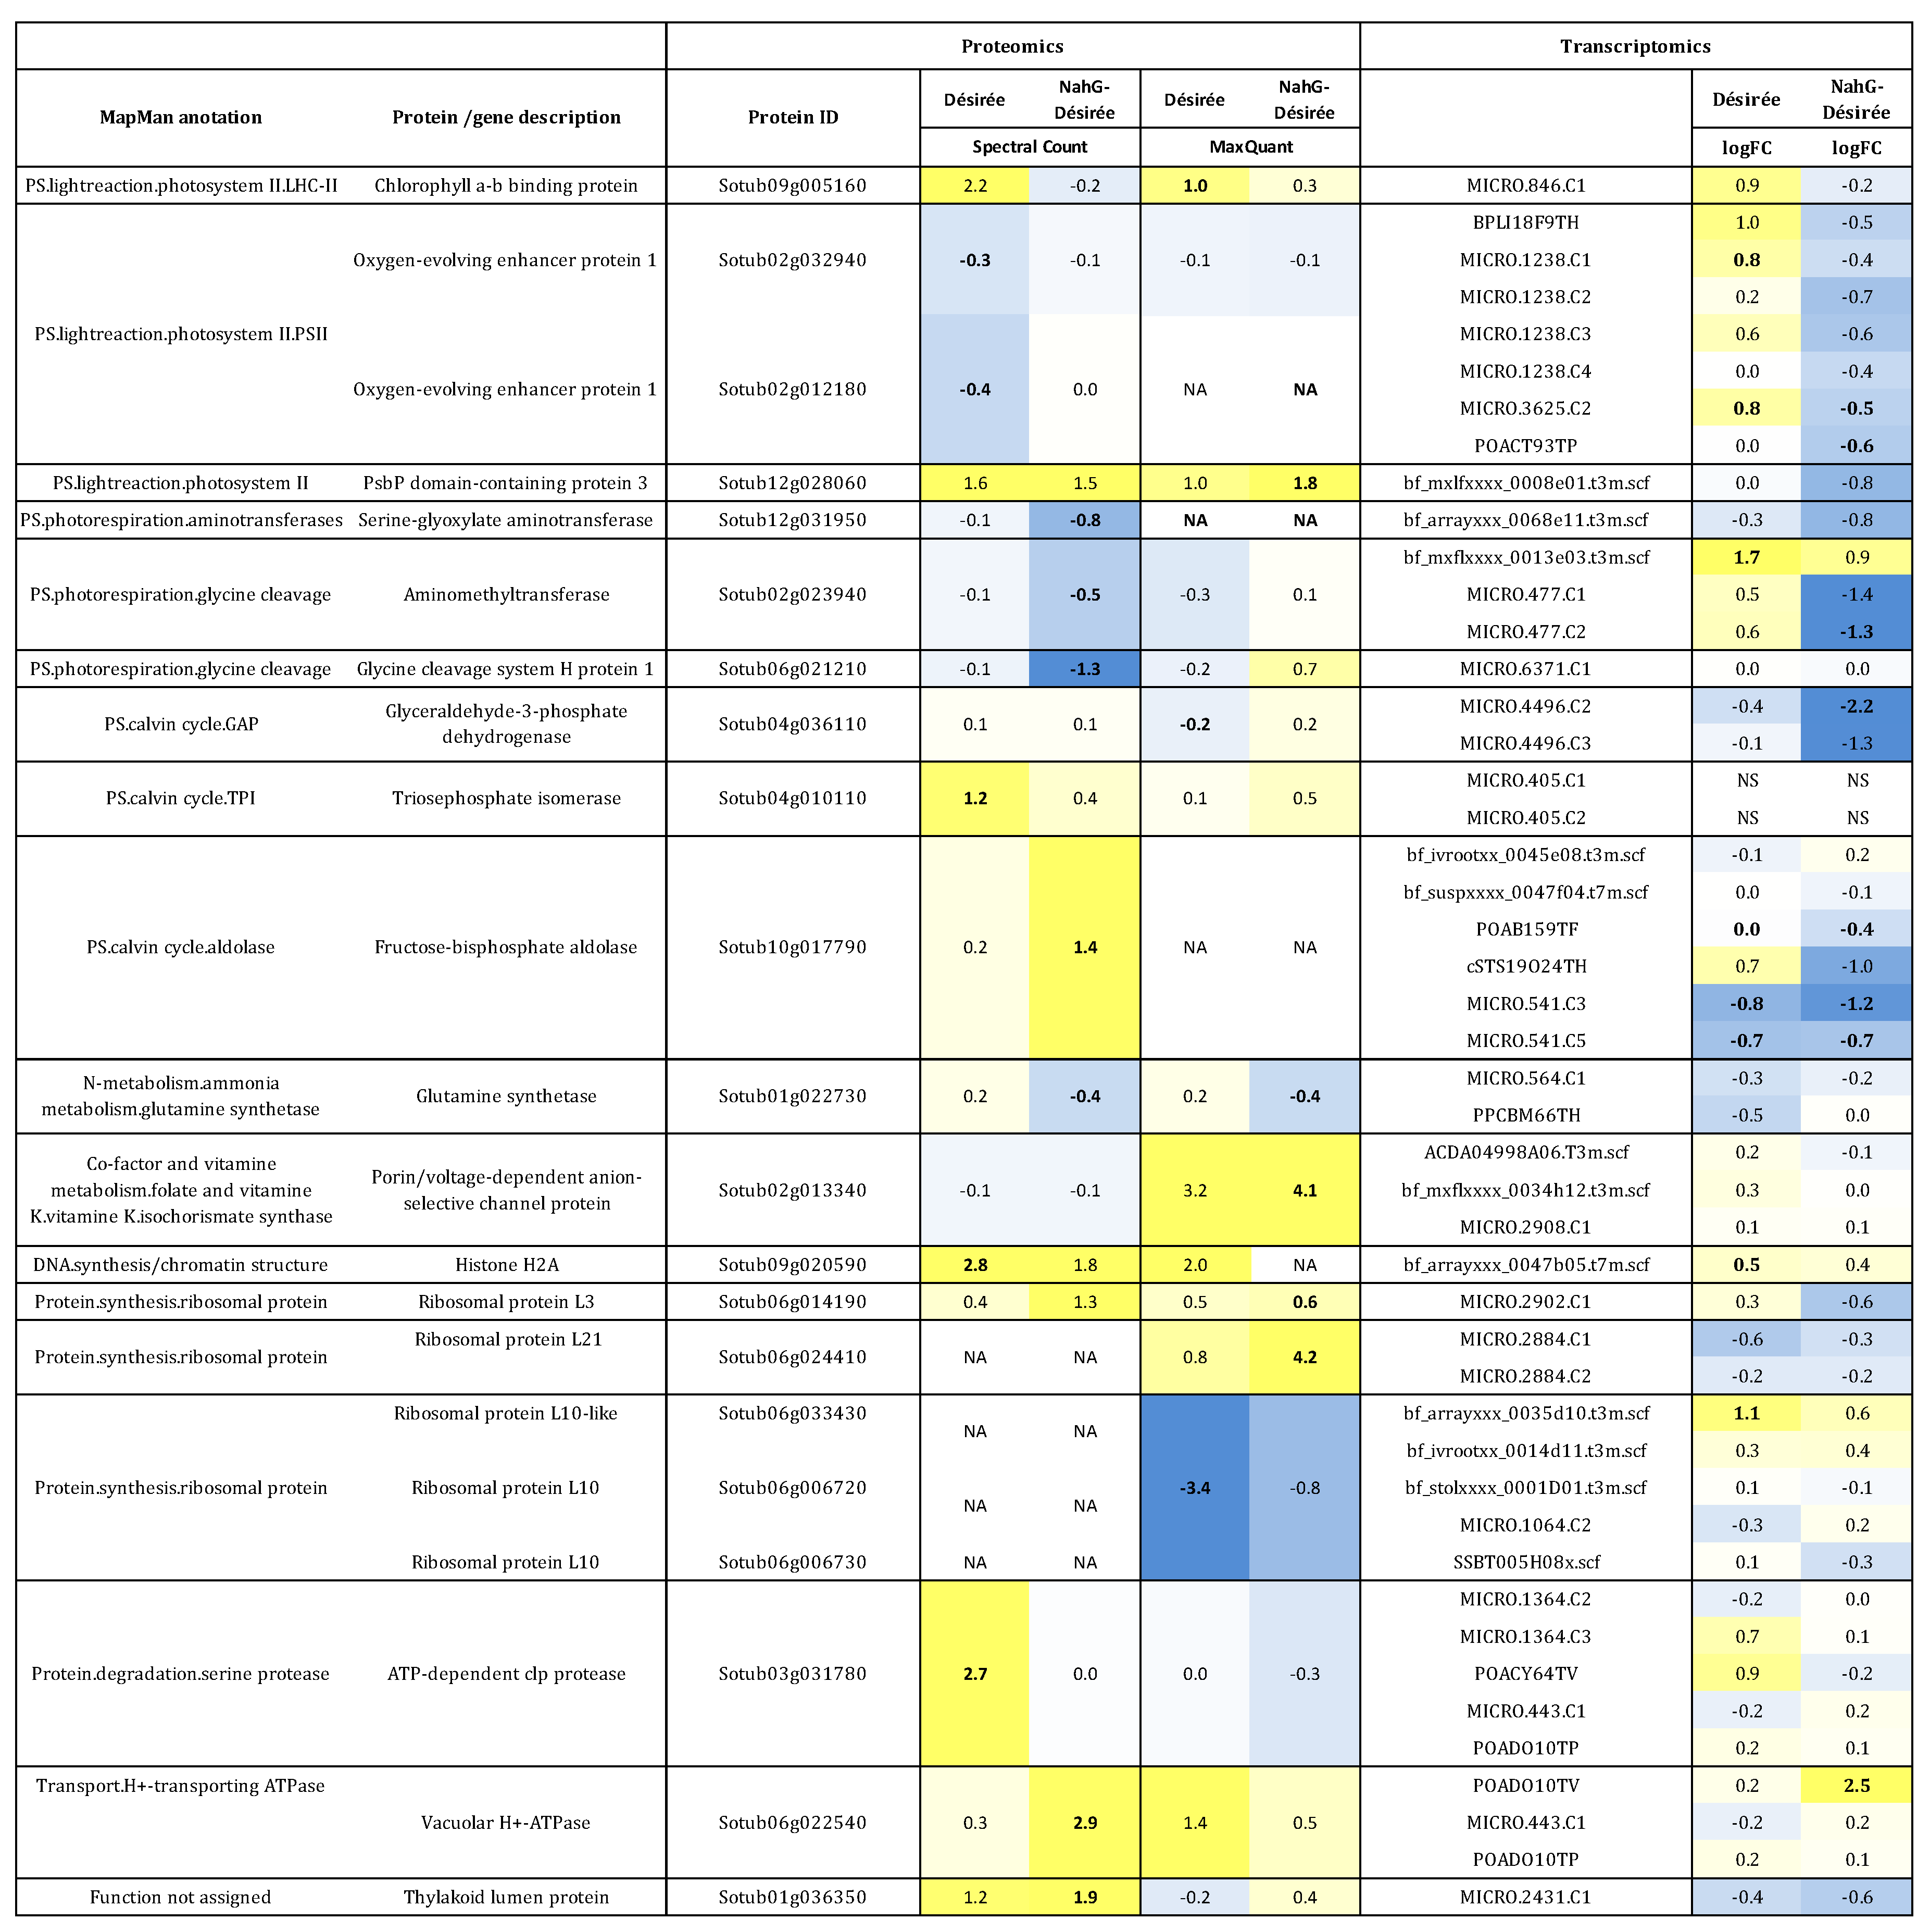
3.2. Integration of Proteome Changes and Reprogramming of Transcriptome
4. Discussion
5. Conclusions
Supplementary Materials
Acknowledgments
Author Contributions
Conflicts of Interest
References
- Piquerez, S.J.M.; Harvey, S.E.; Beynon, J.L.; Ntoukakis, V. Improving crop disease resistance: Lessons from research on Arabidopsis and tomato. Front. Plant Sci. 2014, 5, 671. [Google Scholar] [CrossRef] [PubMed]
- Atkinson, N.J.; Urwin, P.E. The interaction of plant biotic and abiotic stresses: From genes to the field. J. Exp. Bot. 2012, 63, 3523–3544. [Google Scholar] [CrossRef] [PubMed]
- Sastry, K.S.; Zitter, T.A. Plant Virus and Viroid Diseases in the Tropics: Volume 2: Epidemiology and Management; Springer: Berlin, Germany, 2014. [Google Scholar]
- Das, G.; Rao, G.J.N. Molecular marker assisted gene stacking for biotic and abiotic stress resistance genes in an elite rice cultivar. Front. Plant Sci. 2015, 6, 698. [Google Scholar] [CrossRef] [PubMed]
- Nicaise, V. Crop immunity against viruses: Outcomes and future challenges. Front. Plant Sci. 2014, 5, 660. [Google Scholar] [CrossRef] [PubMed]
- Pieterse, C.M.J.; Leon-Reyes, A.; Van der Ent, S.; Van Wees, S.C.M. Networking by small-molecule hormones in plant immunity. Nat. Chem. Biol. 2009, 5, 308–316. [Google Scholar] [CrossRef] [PubMed]
- Alazem, M.; Lin, N.-S. Roles of plant hormones in the regulation of host-virus interactions. Mol. Plant Pathol. 2015, 16, 529–540. [Google Scholar] [CrossRef] [PubMed]
- Bari, R.; Jones, J.D.G. Role of plant hormones in plant defence responses. Plant Mol. Biol. 2009, 69, 473–488. [Google Scholar] [CrossRef] [PubMed]
- Moore, J.W.; Loake, G.J.; Spoel, S.H. Transcription dynamics in plant immunity. Plant Cell 2011, 23, 2809–2820. [Google Scholar] [CrossRef] [PubMed]
- Miljkovic, D.; Stare, T.; Mozetič, I.; Podpečan, V.; Petek, M.; Witek, K.; Dermastia, M.; Lavrač, N.; Gruden, K. Signalling network construction for modelling plant defence response. PLoS ONE 2012, 7, e51822. [Google Scholar] [CrossRef] [PubMed]
- Stare, T.; Ramšak, Ž.; Blejec, A.; Stare, K.; Turnšek, N.; Weckwerth, W.; Wienkoop, S.; Vodnik, D.; Gruden, K. Bimodal dynamics of primary metabolism-related responses in tolerant potato-Potato virus Y interaction. BMC Genom. 2015, 16, 716. [Google Scholar] [CrossRef] [PubMed]
- Valledor, L.; Escandón, M.; Meijón, M.; Nukarinen, E.; Cañal, M.J.; Weckwerth, W. A universal protocol for the combined isolation of metabolites, DNA, long RNAs, small RNAs, and proteins from plants and microorganisms. Plant J. 2014, 79, 173–180. [Google Scholar] [CrossRef] [PubMed]
- Huang, Z.; Yeakley, J.M.; Garcia, E.W.; Holdridge, J.D.; Fan, J.; Whitham, S.A. Salicylic Acid-Dependent Expression of Host Genes in Compatible Arabidopsis-Virus Interactions. Plant Pathol. 2005, 137, 1147–1159. [Google Scholar] [CrossRef] [PubMed]
- Baebler, Š.; Stare, K.; Kovač, M.; Blejec, A.; Prezelj, N.; Stare, T.; Kogovšek, P.; Pompe-Novak, M.; Rosahl, S.; Ravnikar, M.; et al. Dynamics of Responses in Compatible Potato—Potato virus Y Interaction Are Modulated by Salicylic Acid. PLoS ONE 2011, 6, e29009. [Google Scholar] [CrossRef] [PubMed]
- Kogovšek, P.; Pompe-Novak, M.; Baebler, Š.; Rotter, A.; Gow, L.; Gruden, K.; Foster, G.D.; Boonham, N.; Ravnikar, M. Aggressive and mild Potato virus Y isolates trigger different specific responses in susceptible potato plants. Plant Pathol. 2010, 59, 1121–1132. [Google Scholar] [CrossRef]
- Whitham, S.A.; Quan, S.; Chang, H.-S.; Cooper, B.; Estes, B.; Zhu, T.; Wang, X.; Hou, Y.-M. Diverse RNA viruses elicit the expression of common sets of genes in susceptible Arabidopsis thaliana plants. Plant J. 2003, 33, 271–283. [Google Scholar] [CrossRef] [PubMed]
- Whitham, S.A.; Yang, C.; Goodin, M.M. Global impact: Elucidating plant responses to viral infection. Mol. Plant-Microbe Interact. 2006, 19, 1207–1215. [Google Scholar] [CrossRef] [PubMed]
- Di Carli, M.; Benvenuto, E.; Donini, M. Recent Insights into Plant-Virus Interactions through Proteomic Analysis. J. Proteome Res. 2012, 11, 4765–4780. [Google Scholar] [CrossRef] [PubMed]
- Carvalho, P.C.; Hewel, J.; Barbosa, V.C.; Yates, J.R. Identifying differences in protein expression levels by spectral counting and feature selection. Genet. Mol. Res. 2008, 7, 342–356. [Google Scholar] [CrossRef] [PubMed]
- Liu, N.Q.; Dekker, L.J.M.; Stingl, C.; Güzel, C.; De Marchi, T.; Martens, J.W.M.; Foekens, J.A.; Luider, T.M.; Umar, A. Quantitative Proteomic Analysis of Microdissected Breast Cancer Tissues: Comparison of Label-Free and SILAC-based Quantification with Shotgun, Directed, and Targeted MS Approaches. J. Proteome Res. 2013, 12, 4627–4641. [Google Scholar] [CrossRef] [PubMed]
- Scholthof, K.-B.G.; Adkins, S.; Czosnek, H.; Palukaitis, P.; Jacquot, E.; Hohn, T.; Hohn, B.; Saunders, K.; Candresse, T.; Ahlquist, P.; et al. Top 10 plant viruses in molecular plant pathology. Mol. Plant Pathol. 2011, 12, 938–954. [Google Scholar] [CrossRef] [PubMed]
- Kogovsek, P.; Ravnikar, M. Physiology of the Potato–Potato Virus Y Interaction; Lüttge, U., Beyschlag, W., Francis, D., Cushman, J., Eds.; Springer: Berlin/Heidelberg, Germany, 2013; Volume 74. [Google Scholar]
- Singh, R.P.; Valkonen, J.P.T.; Gray, S.M.; Boonham, N.; Jones, R.A.C.; Kerlan, C.; Schubert, J. Discussion paper: The naming of Potato virus Y strains infecting potato. Arch. Virol. 2008, 153, 1–13. [Google Scholar] [CrossRef] [PubMed]
- Sánchez, G.; Gerhardt, N.; Siciliano, F.; Vojnov, A.; Malcuit, I.; Marano, M.R. Salicylic acid is involved in the Nb-mediated defense responses to Potato virus X in Solanum tuberosum. Mol. Plant-Microbe Interact. 2010, 23, 394–405. [Google Scholar] [CrossRef] [PubMed]
- Halim, V.A.; Vess, A.; Scheel, D.; Rosahl, S. The role of salicylic acid and jasmonic acid in pathogen defence. Plant. Biol. 2006, 8, 307–313. [Google Scholar] [CrossRef] [PubMed]
- Kova, M.Č.; Müller, A.; Jarh, D.M.Č.; Milavec, M.; Düchting, P. Multiple hormone analysis indicates involvement of jasmonate signalling in the early defence of potato to potato virus Y NTN. Biol. Plant. 2009, 53, 195–199. [Google Scholar] [CrossRef]
- Kloosterman, B.; De Koeyer, D.; Griffiths, R.; Flinn, B.; Steuernagel, B.; Scholz, U.; Sonnewald, S.; Sonnewald, U.; Bryan, G.J.; Prat, S.; et al. Genes driving potato tuber initiation and growth: Identification based on transcriptional changes using the POCI array. Funct. Integr. Genom. 2008, 8, 329–340. [Google Scholar] [CrossRef] [PubMed]
- Larrainzar, E.; Wienkoop, S.; Weckwerth, W.; Ladrera, R.; Arrese-Igor, C.; Gonzalez, E.M. Medicago truncatula Root Nodule Proteome Analysis Reveals Differential Plant and Bacteroid Responses to Drought Stress. Plant Physiol. 2007, 144, 1495–1507. [Google Scholar] [CrossRef] [PubMed]
- Cox, J.; Mann, M. MaxQuant enables high peptide identification rates, individualized p.p.b.-range mass accuracies and proteome-wide protein quantification. Nat. Biotechnol. 2008, 26, 1367–1372. [Google Scholar] [CrossRef] [PubMed]
- Ramsak, Ž.; Baebler, Š.; Rotter, A.; Korbar, M.; Mozetic, I.; Usadel, B.; Gruden, K. GoMapMan: Integration, consolidation and visualization of plant gene annotations within the MapMan ontology. Nucleic Acids Res. 2014, 42, D1167–D1175. [Google Scholar] [CrossRef] [PubMed]
- The Potato Genome Sequencing Consortium. Genome Sequence and Analysis of the Tuber Crop Potato. Nature 2011, 475, 189–195. [Google Scholar]
- Thimm, O.; Bläsing, O.; Gibon, Y.; Nagel, A.; Meyer, S.; Krüger, P.; Selbig, J.; Müller, L.A.; Rhee, S.Y.; Stitt, M. MAPMAN: A user-driven tool to display genomics data sets onto diagrams of metabolic pathways and other biological processes. Plant J. 2004, 37, 914–939. [Google Scholar] [CrossRef] [PubMed]
- Rotter, A.; Usadel, B.; Baebler, S.; Stitt, M.; Gruden, K. Adaptation of the MapMan ontology to biotic stress responses: Application in solanaceous species. Plant Methods 2007, 3, 10. [Google Scholar] [CrossRef] [PubMed]
- Hirsch, C.D.; Hamilton, J.P.; Childs, K.L.; Cepela, J.; Crisovan, E.; Vaillancourt, B.; Hirsch, C.N.; Habermann, M.; Neal, B.; Buell, C.R.; et al. A Resource for Mining Sequences, Genotypes, and Phenotypes to Accelerate Potato Breeding. Plant Genome 2014, 7, 1. [Google Scholar] [CrossRef]
- Dressaire, C.; Gitton, C.; Loubière, P.; Monnet, V.; Queinnec, I.; Cocaign-Bousquet, M. Transcriptome and proteome exploration to model translation efficiency and protein stability in Lactococcus lactis. PLoS Comput. Biol. 2009, 5, e1000606. [Google Scholar] [CrossRef] [PubMed]
- Maier, T.; Schmidt, A.; Güell, M.; Kühner, S.; Gavin, A.-C.; Aebersold, R.; Serrano, L. Quantification of mRNA and protein and integration with protein turnover in a bacterium. Mol. Syst. Biol. 2011, 7, 511. [Google Scholar] [CrossRef] [PubMed]
- Zhang, Y.; Gao, P.; Xing, Z.; Jin, S.; Chen, Z.; Liu, L.; Constantino, N.; Wang, X.; Shi, W.; Yuan, J.S.; et al. Application of an improved proteomics method for abundant protein cleanup: Molecular and genomic mechanisms study in plant defense. Mol. Cell. Proteom. 2013, 12, 3431–3442. [Google Scholar] [CrossRef] [PubMed]
- Krishnan, H.B.; Natarajan, S.S. A rapid method for depletion of Rubisco from soybean (Glycine max) leaf for proteomic analysis of lower abundance proteins. Phytochemistry 2009, 70, 1958–1964. [Google Scholar] [CrossRef] [PubMed]
- Rose, J.K.C.; Bashir, S.; Giovannoni, J.J.; Jahn, M.M.; Saravanan, R.S. Tackling the plant proteome: Practical approaches, hurdles and experimental tools. Plant J. 2004, 39, 715–733. [Google Scholar] [CrossRef] [PubMed]
- Kim, Y.J.; Lee, H.M.; Wang, Y.; Wu, J.; Kim, S.G.; Kang, K.Y.; Park, K.H.; Kim, Y.C.; Choi, I.S.; Agrawal, G.K.; et al. Depletion of abundant plant RuBisCO protein using the protamine sulfate precipitation method. Proteomics 2013, 13, 2176–2179. [Google Scholar] [CrossRef] [PubMed]
- Cellar, N.A.; Kuppannan, K.; Langhorst, M.L.; Ni, W.; Xu, P.; Young, S.A. Cross species applicability of abundant protein depletion columns for ribulose-1,5-bisphosphate carboxylase/oxygenase. J. Chromatogr. B 2008, 861, 29–39. [Google Scholar] [CrossRef] [PubMed]
- Jorrín-Novo, J.V.; Pascual, J.; Sánchez-Lucas, R.; Romero-Rodríguez, M.C.; Rodríguez-Ortega, M.J.; Lenz, C.; Valledor, L. Fourteen years of plant proteomics reflected in Proteomics: Moving from model species and 2DE-based approaches to orphan species and gel-free platforms. Proteomics 2015, 15, 1089–1112. [Google Scholar] [CrossRef] [PubMed]
- Argentini, A.; Goeminne, L.J.E.; Verheggen, K.; Hulstaert, N.; Staes, A.; Clement, L.; Martens, L. moFF: A robust and automated approach to extract peptide ion intensities. Nat. Methods 2016, 13, 964–966. [Google Scholar] [CrossRef] [PubMed]
- Gawron, D.; Gevaert, K.; Van Damme, P. The proteome under translational control. Proteomics 2014, 14, 2647–2662. [Google Scholar] [CrossRef] [PubMed]
- Matasci, N.; Hung, L.-H.; Yan, Z.; Carpenter, E.J.; Wickett, N.J.; Mirarab, S.; Nguyen, N.; Warnow, T.; Ayyampalayam, S.; Barker, M.; et al. Data access for the 1000 Plants (1KP) project. Gigascience 2014, 3, 17. [Google Scholar] [CrossRef] [PubMed]
- Rennie, C.; Noyes, H.A.; Kemp, S.J.; Hulme, H.; Brass, A.; Hoyle, D.C.; Barrett, T.; Troup, D.; Wilhite, S.; Ledoux, P.; et al. Strong position-dependent effects of sequence mismatches on signal ratios measured using long oligonucleotide microarrays. BMC Genom. 2008, 9, 317. [Google Scholar] [CrossRef] [PubMed]
- Goralski, M.; Sobieszczanska, P.; Obrepalska-Steplowska, A.; Swiercz, A.; Zmienko, A.; Figlerowicz, M. A gene expression microarray for Nicotiana benthamiana based on de novo transcriptome sequence assembly. Plant Methods 2016, 12, 28. [Google Scholar] [CrossRef] [PubMed]
- Vogel, C.; Marcotte, E.M. Insights into the regulation of protein abundance from proteomic and transcriptomic analyses. Nat. Rev. Genet. 2012, 13, 227–232. [Google Scholar] [CrossRef] [PubMed]
- Bazzini, A.A.; Lee, M.T.; Giraldez, A.J. Ribosome profiling shows that miR-430 reduces translation before causing mRNA decay in zebrafish. Science 2012, 336, 233–237. [Google Scholar] [CrossRef] [PubMed]
- Jouffe, C.; Cretenet, G.; Symul, L.; Martin, E.; Atger, F.; Naef, F.; Gachon, F.; Bass, J.; Takahashi, J.; Zhang, E.; et al. The Circadian Clock Coordinates Ribosome Biogenesis. PLoS Biol. 2013, 11, e1001455. [Google Scholar] [CrossRef] [PubMed]
- Robles, M.S.; Cox, J.; Mann, M.; Eckel-Mahan, K.; Sassone-Corsi, P.; Takahashi, J.; Hong, H.; Ko, C.; McDearmon, E.; Hughes, M.; et al. In-Vivo Quantitative Proteomics Reveals a Key Contribution of Post-Transcriptional Mechanisms to the Circadian Regulation of Liver Metabolism. PLoS Genet. 2014, 10, e1004047. [Google Scholar] [CrossRef] [PubMed]
- Sonenberg, N.; Hinnebusch, A.G. Regulation of Translation Initiation in Eukaryotes: Mechanisms and Biological Targets. Cell 2009, 136, 731–745. [Google Scholar] [CrossRef] [PubMed]
- Wek, R.C.; Jiang, H.-Y.; Anthony, T.G. Coping with stress: eIF2 kinases and translational control. Biochem. Soc. Trans. 2006, 34, 7–11. [Google Scholar] [CrossRef] [PubMed]
- Luan, H.; Shine, M.B.; Cui, X.; Chen, X.; Ma, N.; Kachroo, P.; Zhi, H.; Kachroo, A. The Potyviral P3 Protein Targets Eukaryotic Elongation Factor 1A to Promote the Unfolded Protein Response and Viral Pathogenesis. Plant Physiol. 2016, 172, 221–234. [Google Scholar] [CrossRef] [PubMed]
- Fernie, A.R.; Stitt, M. On the discordance of metabolomics with proteomics and transcriptomics: Coping with increasing complexity in logic, chemistry, and network interactions scientific correspondence. Plant Physiol. 2012, 158, 1139–1145. [Google Scholar] [CrossRef] [PubMed]

© 2017 by the authors. Licensee MDPI, Basel, Switzerland. This article is an open access article distributed under the terms and conditions of the Creative Commons Attribution (CC BY) license (http://creativecommons.org/licenses/by/4.0/).
Share and Cite
Stare, T.; Stare, K.; Weckwerth, W.; Wienkoop, S.; Gruden, K. Comparison between Proteome and Transcriptome Response in Potato (Solanum tuberosum L.) Leaves Following Potato Virus Y (PVY) Infection. Proteomes 2017, 5, 14. https://doi.org/10.3390/proteomes5030014
Stare T, Stare K, Weckwerth W, Wienkoop S, Gruden K. Comparison between Proteome and Transcriptome Response in Potato (Solanum tuberosum L.) Leaves Following Potato Virus Y (PVY) Infection. Proteomes. 2017; 5(3):14. https://doi.org/10.3390/proteomes5030014
Chicago/Turabian StyleStare, Tjaša, Katja Stare, Wolfram Weckwerth, Stefanie Wienkoop, and Kristina Gruden. 2017. "Comparison between Proteome and Transcriptome Response in Potato (Solanum tuberosum L.) Leaves Following Potato Virus Y (PVY) Infection" Proteomes 5, no. 3: 14. https://doi.org/10.3390/proteomes5030014
APA StyleStare, T., Stare, K., Weckwerth, W., Wienkoop, S., & Gruden, K. (2017). Comparison between Proteome and Transcriptome Response in Potato (Solanum tuberosum L.) Leaves Following Potato Virus Y (PVY) Infection. Proteomes, 5(3), 14. https://doi.org/10.3390/proteomes5030014