
Will Quantitative Proteomics Redefine Some of the Key Concepts in Skeletal Muscle Physiology?

Abstract
:1. Introduction
2. Classical Studies of Skeletal Muscle Metabolism
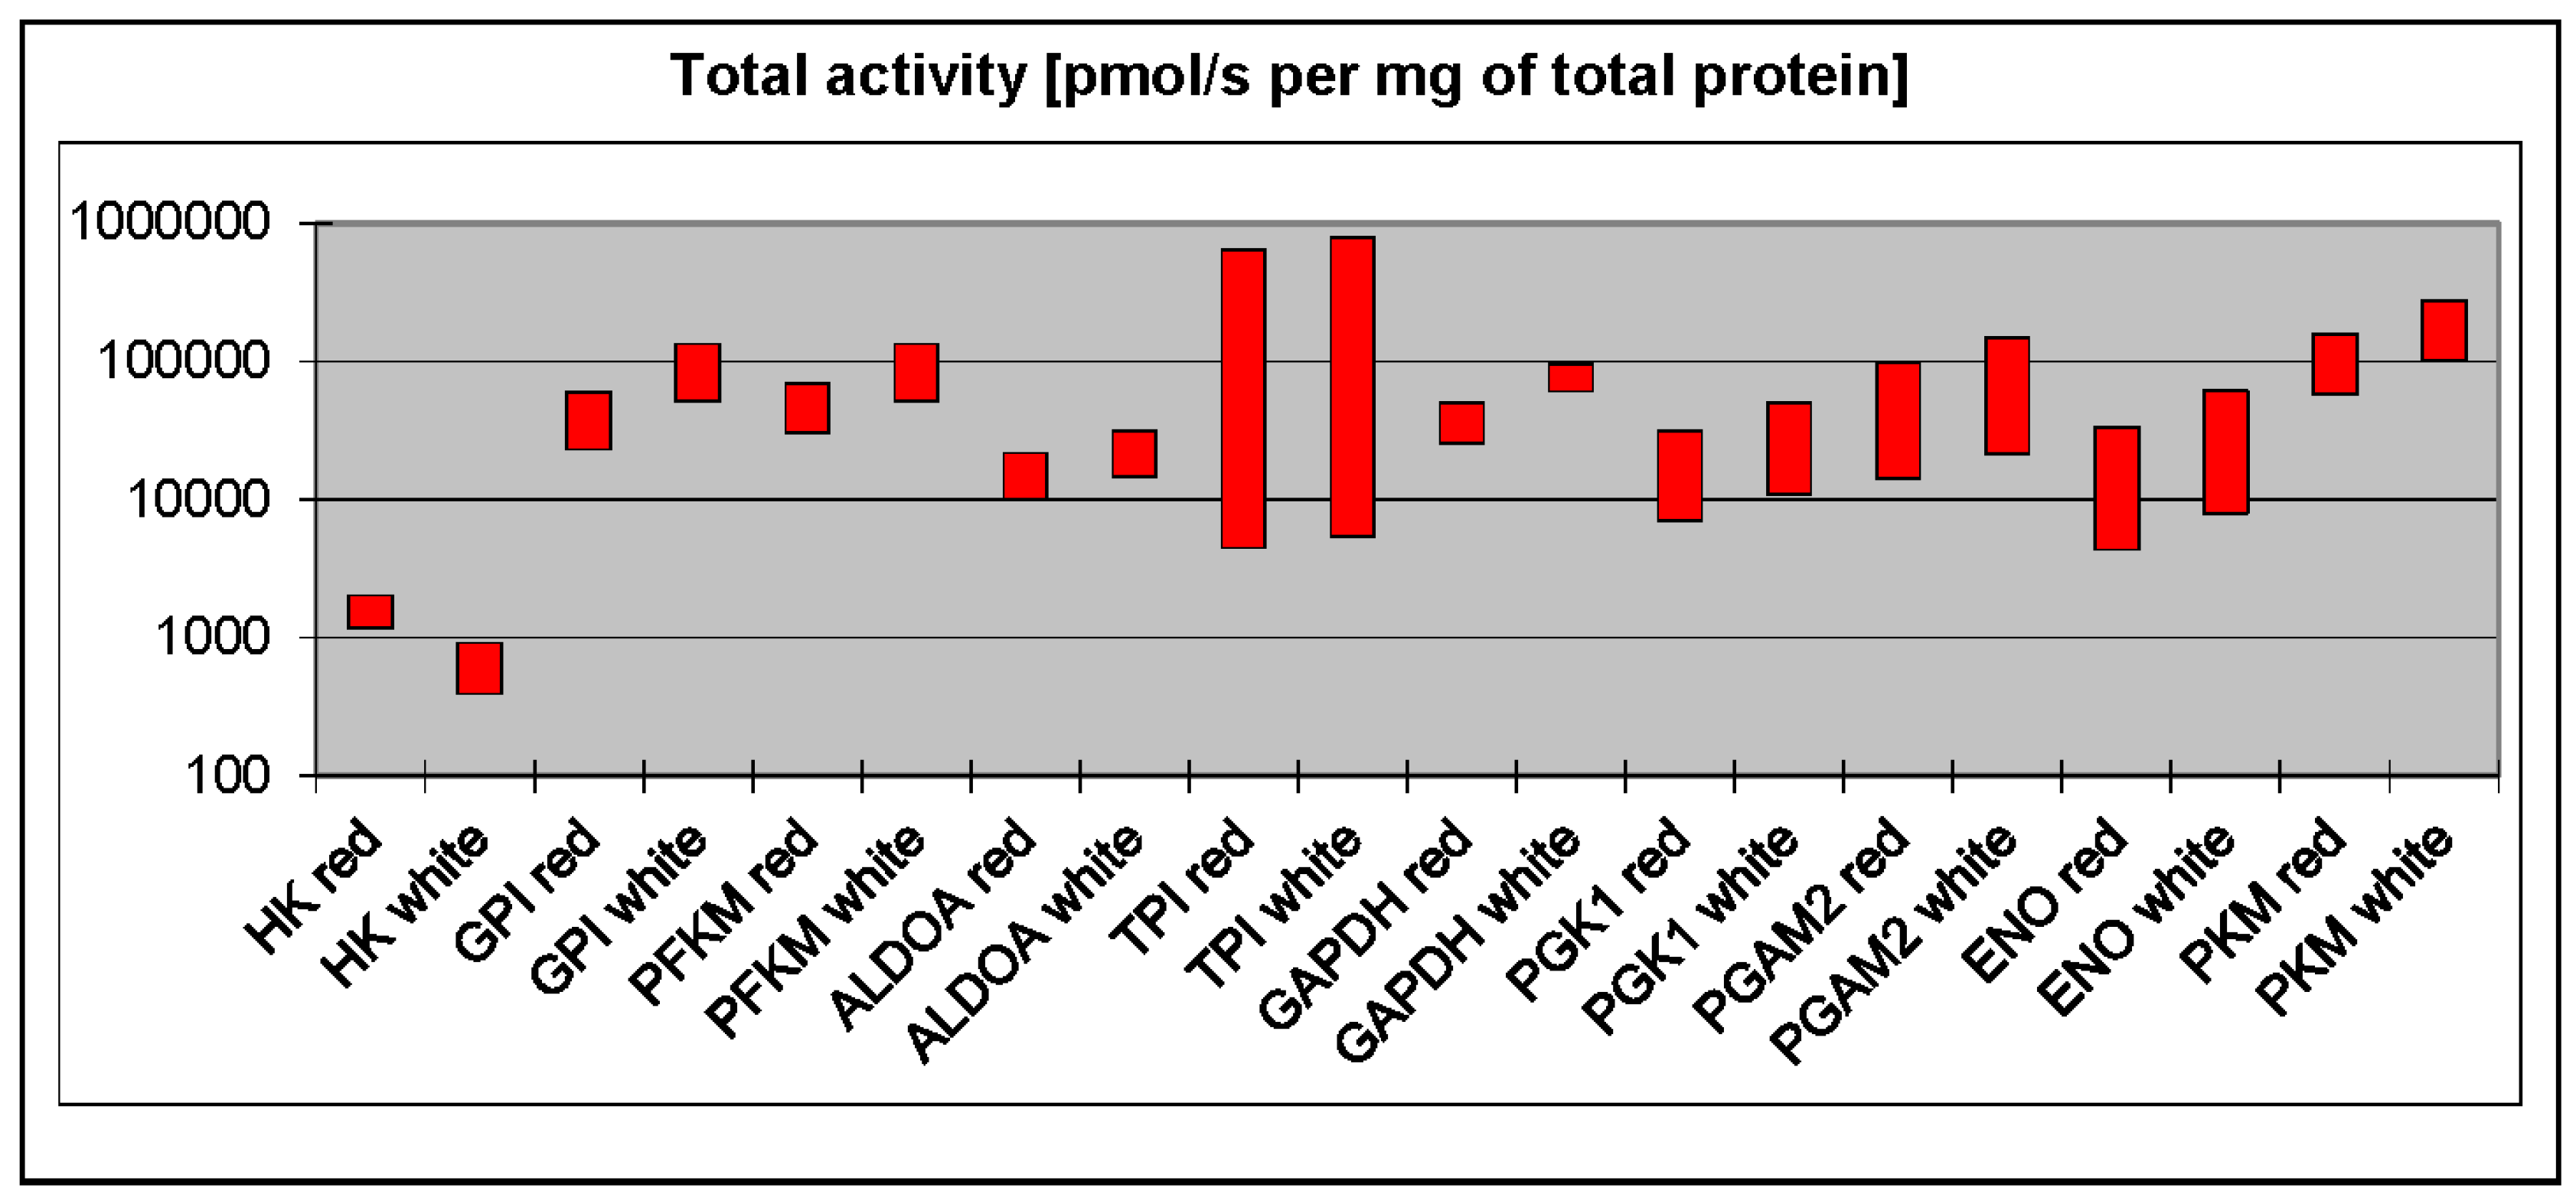
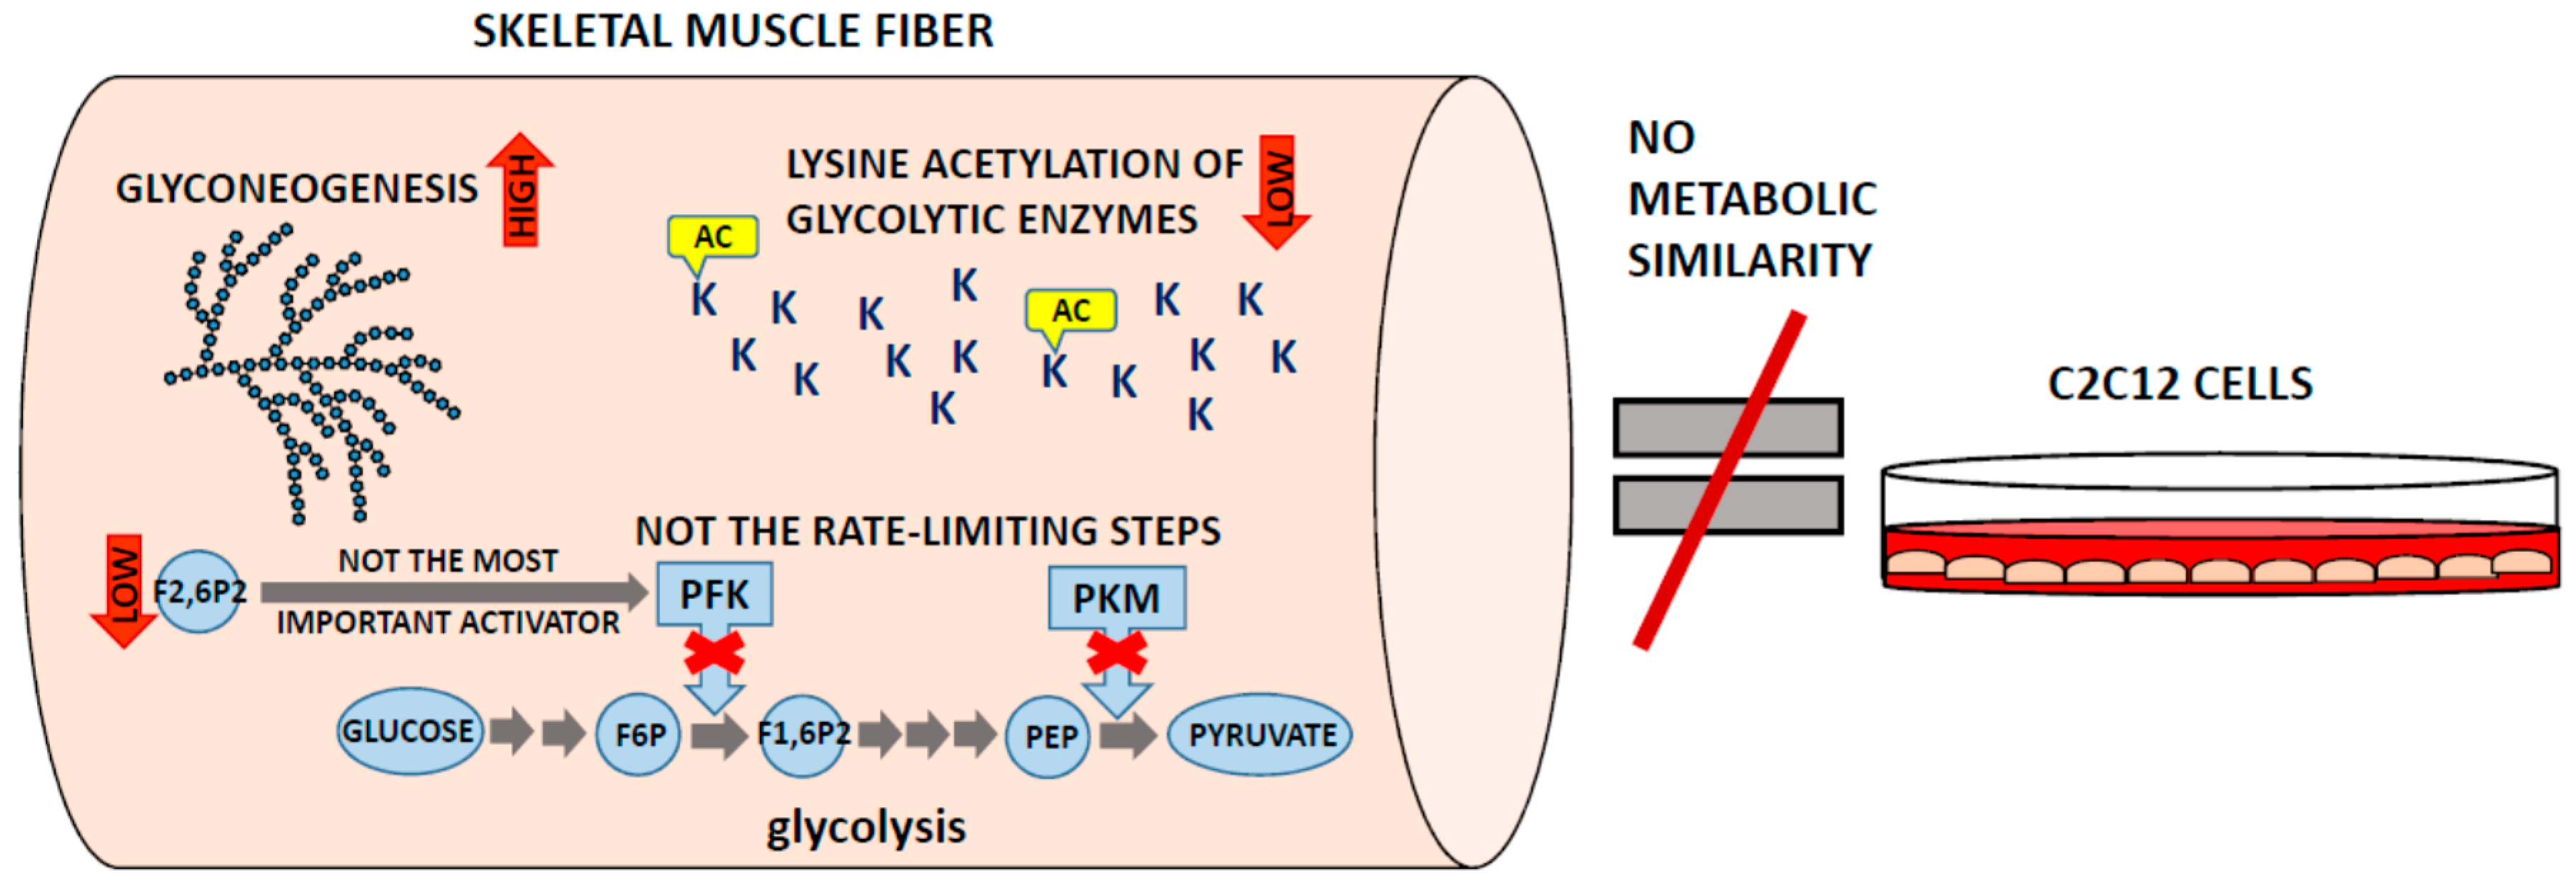
3. Phosphofructokinase and Pyruvate Kinase Are Not Universal Rate-Limiting Enzymes of Glycolysis

4. White Muscles Are Glyconeogenic
5. Where Is the Lysine Acetylation?
6. C2C12 Cells Are a Good Model Only of Model Cells
7. Conclusions and Perspectives

Acknowledgments
Author Contributions
Conflicts of Interest
References
- Wiśniewski, J.R.; Rakus, D. Multi-enzyme digestion FASP and the “Total Protein Approach”-based absolute quantification of the Escherichia coli proteome. J. Proteom. 2014, 109, 322–331. [Google Scholar] [CrossRef] [PubMed]
- Wiśniewski, J.R.; Koepsell, H.; Gizak, A.; Rakus, D. Absolute protein quantification allows differentiation of cell-specific metabolic routes and functions. Proteomics 2015, 15, 1316–1325. [Google Scholar] [CrossRef] [PubMed]
- Wiśniewski, J.R.; Gizak, A.; Rakus, D. Integrating Proteomics and Enzyme Kinetics Reveals Tissue-Specific Types of the Glycolytic and Gluconeogenic Pathways. J. Proteome Res. 2015, 14, 3263–3273. [Google Scholar] [CrossRef] [PubMed]
- Ohlendieck, K. Proteomics of skeletal muscle glycolysis. Biochim. Biophys. Acta 2010, 1804, 2089–2101. [Google Scholar] [CrossRef] [PubMed]
- Holland, A.; Ohlendieck, K. Proteomic profiling of the contractile apparatus from skeletal muscle. Expert Rev. Proteom. 2013, 10, 239–257. [Google Scholar] [CrossRef] [PubMed]
- Rakus, D.; Gizak, A.; Deshmukh, A.; Wiśniewski, J.R. Absolute quantitative profiling of the key metabolic pathways in slow and fast skeletal muscle. J. Proteome Res. 2015, 14, 1400–1411. [Google Scholar] [CrossRef] [PubMed]
- Murgia, M.; Nagaraj, N.; Deshmukh, A.S.; Zeiler, M.; Cancellara, P.; Moretti, I.; Reggiani, C.; Schiaffino, S.; Mann, M. Single muscle fiber proteomics reveals unexpected mitochondrial specialization. EMBO Rep. 2015, 16, 387–395. [Google Scholar] [CrossRef] [PubMed]
- Deshmukh, A.S.; Murgia, M.; Nagaraj, N.; Treebak, J.T.; Cox, J.; Mann, M. Deep proteomics of mouse skeletal muscle enables quantitation of protein isoforms, metabolic pathways, and transcription factors. Mol. Cell. Proteom. 2015, 14, 841–853. [Google Scholar] [CrossRef] [PubMed]
- Barnard, R.J.; Edgerton, V.R.; Furukawa, T.; Peter, J.B. Histochemical, biochemical, and contractile properties of red, white, and intermediate fibers. Am. J. Physiol. 1971, 220, 410–414. [Google Scholar] [PubMed]
- Peter, J.B.; Barnard, R.J.; Edgerton, V.R.; Gillespie, C.A.; Stempel, K.E. Metabolic profiles of three fiber types of skeletal muscle in guinea pigs and rabbits. Biochemistry 1972, 11, 2627–2633. [Google Scholar] [CrossRef] [PubMed]
- Gollnick, P.D.; Sjödin, B.; Karlsson, J.; Jansson, E.; Saltin, B. Human soleus muscle: A comparison of fiber composition and enzyme activities with other leg muscles. Pflug. Arch. 1974, 348, 247–255. [Google Scholar] [CrossRef]
- Lowry, C.V.; Kimmey, J.S.; Felder, S.; Chi, M.M.; Kaiser, K.K.; Passonneau, P.N.; Kirk, K.A.; Lowry, O.H. Enzyme patterns in single human muscle fibers. J. Biol. Chem. 1978, 253, 8269–8277. [Google Scholar] [PubMed]
- Pilkis, S.J.; El-Maghrabi, M.R.; Pilkis, J.; Claus, T.H.; Cumming, D.A. Fructose 2,6-bisphosphate. A new activator of phosphofructokinase. J. Biol. Chem. 1981, 256, 3171–3174. [Google Scholar] [PubMed]
- Van Schaftingen, E.; Hers, H.G. Inhibition of fructose-1,6-bisphosphatase by fructose 2,6-biphosphate. Proc. Natl. Acad. Sci. USA 1981, 78, 2861–2863. [Google Scholar] [CrossRef] [PubMed]
- Henriksen, E.J.; Bourey, R.E.; Rodnick, K.J.; Koranyi, L.; Permutt, M.A.; Holloszy, J.O. Glucose transporter protein content and glucose transport capacity in rat skeletal muscles. Am. J. Physiol. 1990, 259, E593–E598. [Google Scholar] [PubMed]
- Yan, J.X.; Harry, R.A.; Wait, R.; Welson, S.Y.; Emery, P.W.; Preedy, V.R.; Dunn, M.J. Separation and identification of rat skeletal muscle proteins using two-dimensional gel electrophoresis and mass spectrometry. Proteomics 2001, 1, 424–434. [Google Scholar] [CrossRef]
- Isfort, R.J.; Wang, F.; Greis, K.D.; Sun, Y.; Keough, T.W.; Bodine, S.C.; Anderson, N.L. Proteomic analysis of rat soleus and tibialis anterior muscle following immobilization. J. Chromatogr. B Analyt. Technol. Biomed. Life Sci. 2002, 769, 323–332. [Google Scholar] [CrossRef]
- Burniston, J.G.; Connolly, J.; Kainulainen, H.; Britton, S.L.; Koch, L.G. Label-free profiling of skeletal muscle using high-definition mass spectrometry. Proteomics 2014, 14, 2339–2344. [Google Scholar] [CrossRef] [PubMed]
- Gannon, J.; Staunton, L.; O’Connell, K.; Doran, P.; Ohlendieck, K. Phosphoproteomic analysis of aged skeletal muscle. Int. J. Mol. Med. 2008, 22, 33–42. [Google Scholar] [CrossRef] [PubMed]
- Doran, P.; Donoghue, P.; O’Connell, K.; Gannon, J.; Ohlendieck, K. Proteomics of skeletal muscle aging. Proteomics 2009, 9, 989–1003. [Google Scholar] [CrossRef] [PubMed]
- Ohlendieck, K. Proteomics of skeletal muscle differentiation, neuromuscular disorders and fiber aging. Expert Rev. Proteom. 2010, 7, 283–296. [Google Scholar] [CrossRef] [PubMed]
- Gelfi, C.; Vasso, M.; Cerretelli, P. Diversity of human skeletal muscle in health and disease: Contribution of proteomics. J. Proteom. 2011, 74, 774–795. [Google Scholar] [CrossRef] [PubMed]
- Forner, F.; Foster, L.J.; Campanaro, S.; Valle, G.; Mann, M. Quantitative proteomic comparison of rat mitochondria from muscle, heart, and liver. Mol. Cell. Proteom. 2006, 5, 608–619. [Google Scholar] [CrossRef] [PubMed]
- Wisniewski, J.R.; Ostasiewicz, P.; Dus, K.; Zielinska, D.F.; Gnad, F.; Mann, M. Extensive quantitative remodeling of the proteome between normal colon tissue and adenocarcinoma. Mol. Syst. Biol. 2012, 8, 611. [Google Scholar] [CrossRef] [PubMed]
- Ovadi, J.; Srere, P.A. Macromolecular compartmentation and channelling. Int. Rev. Cytol. 2000, 192, 255–280. [Google Scholar] [PubMed]
- Mamczur, P.; Rakus, D.; Gizak, A.; Dus, D.; Dzugaj, A. The effect of calcium ions on subcellular localization of aldolase-FBPase complex in skeletal muscle. FEBS Lett. 2005, 579, 1607–1612. [Google Scholar] [CrossRef] [PubMed]
- Kowalski, W.; Gizak, A.; Rakus, D. Phosphoglycerate mutase in mammalian striated muscles: Subcellular localization and binding partners. FEBS Lett. 2009, 583, 1841–1845. [Google Scholar] [CrossRef] [PubMed]
- Liou, R.S.; Anderson, S. Activation of rabbit muscle phosphofructokinase by F-actin and reconstituted thin filaments. 1980, 19, 2684–2688. [Google Scholar] [CrossRef] [PubMed]
- Rakus, D.; Pasek, M.; Krotkiewski, H.; Dzugaj, A. Interaction between muscle aldolase and muscle fructose 1,6-bisphosphatase results in the substrate channeling. Biochemistry 2004, 43, 14948–14957. [Google Scholar] [CrossRef] [PubMed]
- Fournier, P.A.; Bräu, L.; Ferreira, L.D.; Fairchild, T.; Raja, G.; James, A.; Palmer, T.N. Glycogen resynthesis in the absence of food ingestion during recovery from moderate or high intensity physical activity: Novel insights from rat and human studies. Comp. Biochem. Physiol. A: Mol. Integr. Physiol. 2002, 133, 755–763. [Google Scholar] [CrossRef]
- Gizak, A.; Mazurek, J.; Wozniak, M.; Maciaszczyk-Dziubinska, E.; Rakus, D. Destabilization of fructose 1,6-bisphosphatase-Z-line interactions is a mechanism of glyconeogenesis down-regulation in vivo. Biochim. Biophys. Acta 2013, 1833, 622–628. [Google Scholar] [CrossRef] [PubMed]
- Hallows, W.C.; Yu, W.; Denu, J.M. Regulation of glycolytic enzyme phosphoglycerate mutase-1 by Sirt1 protein-mediated deacetylation. J. Biol. Chem. 2012, 287, 3850–3858. [Google Scholar] [CrossRef] [PubMed]
- Lv, L.; Li, D.; Zhao, D.; Lin, R.; Chu, Y.; Zhang, H.; Zha, Z.; Liu, Y.; Li, Z.; Xu, Y.; et al. Acetylation targets the M2 isoform of pyruvate kinase for degradation through chaperone-mediated autophagy and promotes tumor growth. Mol. Cell 2011, 42, 719–730. [Google Scholar] [CrossRef] [PubMed]
- Wang, Q.; Zhang, Y.; Yang, C.; Xiong, H.; Lin, Y.; Yao, J.; Li, H.; Xie, L.; Zhao, W.; Yao, Y.; et al. Acetylation of metabolic enzymes coordinates carbon source utilization and metabolic flux. Science 2010, 327, 1004–1007. [Google Scholar] [CrossRef] [PubMed]
- Zhao, S.; Xu, W.; Jiang, W.; Yu, W.; Lin, Y.; Zhang, T.; Yao, J.; Zhou, L.; Zeng, Y.; Li, H.; et al. Regulation of cellular metabolism by protein lysine acetylation. Science 2010, 327, 1000–1004. [Google Scholar] [CrossRef] [PubMed]
- Tsuchiya, Y.; Hatakeyama, H.; Emoto, N.; Wagatsuma, F.; Matsushita, S.; Kanzaki, M. Palmitate-induced down-regulation of sortilin and impaired GLUT4 trafficking in C2C12 myotubes. J. Biol. Chem. 2010, 285, 34371–34381. [Google Scholar] [CrossRef] [PubMed]
- Pandurangan, M.; Hwang, I. Application of cell co-culture system to study fat and muscle cells. Appl. Microbiol. Biotechnol. 2014, 98, 7359–7364. [Google Scholar] [CrossRef] [PubMed]
- Højlund, K.; Yi, Z.; Hwang, H.; Bowen, B.; Lefort, N.; Flynn, C.R.; Langlais, P.; Weintraub, S.T.; Mandarino, L.J. Characterization of the human skeletal muscle proteome by one-dimensional gel electrophoresis and HPLC-ESI-MS/MS. Mol. Cell. Proteom. 2008, 7, 257–267. [Google Scholar] [CrossRef] [PubMed]
- Doran, P.; Martin, G.; Dowling, P.; Jockusch, H.; Ohlendieck, K. Proteome analysis of the dystrophin-deficient MDX diaphragm reveals a drastic increase in the heat shock protein cvHSP. Proteomics 2006, 6, 4610–4621. [Google Scholar] [CrossRef] [PubMed]
- Parker, K.C.; Walsh, R.J.; Salajegheh, M.; Amato, A.A.; Krastins, B.; Sarracino, D.A.; Greenberg, S.A. Characterization of human skeletal muscle biopsy samples using shotgun proteomics. J. Proteome Res. 2009, 8, 3265–3277. [Google Scholar] [CrossRef] [PubMed]
© 2016 by the authors; licensee MDPI, Basel, Switzerland. This article is an open access article distributed under the terms and conditions of the Creative Commons by Attribution (CC-BY) license (http://creativecommons.org/licenses/by/4.0/).
Share and Cite
Gizak, A.; Rakus, D. Will Quantitative Proteomics Redefine Some of the Key Concepts in Skeletal Muscle Physiology? Proteomes 2016, 4, 2. https://doi.org/10.3390/proteomes4010002
Gizak A, Rakus D. Will Quantitative Proteomics Redefine Some of the Key Concepts in Skeletal Muscle Physiology? Proteomes. 2016; 4(1):2. https://doi.org/10.3390/proteomes4010002
Chicago/Turabian StyleGizak, Agnieszka, and Dariusz Rakus. 2016. "Will Quantitative Proteomics Redefine Some of the Key Concepts in Skeletal Muscle Physiology?" Proteomes 4, no. 1: 2. https://doi.org/10.3390/proteomes4010002
APA StyleGizak, A., & Rakus, D. (2016). Will Quantitative Proteomics Redefine Some of the Key Concepts in Skeletal Muscle Physiology? Proteomes, 4(1), 2. https://doi.org/10.3390/proteomes4010002