Abstract
Predicting school dropout rates is an important issue for the smooth execution of an educational system. This problem is solved by classifying students into two classes using educational activities related statistical datasets. One of the classes must identify the students who have the tendency to persist. The other class must identify the students who have the tendency to dropout. This problem often encounters a phenomenon that masks out the obtained results. This study delves into this phenomenon and provides a reliable educational data mining technique that accurately predicts the dropout rates. In particular, the three data classifying techniques, namely, decision tree, neural networks and Balanced Bagging, are used. The performances of these classifies are tested with and without the use of a downsample, SMOTE and ADASYN data balancing. It is found that among other parameters geometric mean and UAR provides reliable results while predicting the dropout rates using Balanced Bagging classifying techniques.
Keywords:
dropout rates; accuracy paradox; imbalanced learning; downsample; g-mean predict; mlp; decision tree; Balanced Bagging; UAR; SMOTE; ADASYN 1. Introduction
Educational Data Mining (EDM) is defined as the intersection between large areas of statistics, data mining and education [1]. EDM is becoming a source for discovering new knowledge and patterns of student academic data to teachers and educational institutes managers, in order to support decision-making for the new challenges of education in the digital age [2].
Among EDM’s applications, prediction of school performance and dropout has been gaining prominence since it detects a possible dropout or failure in academic activity [3,4,5,6,7]. So, it is possible to intervene and avoid low performance, or even the student evasion. It is important to emphasize that dropout leads to wasted life-changing opportunities, less skilled labor on the market, and less chance of social mobility [8]. To illustrate and measure the relevance of the problem, only in Brazil it is estimated that 2 billion dollars per year are invested in 1.9 million young people aged 15 to 17 who dropout high school before the end of the year or are not approved at the end of year [9]. This investment is equivalent to the cost of all federal institutes and universities in the Brazil in 2017 [10].
Given this scenario, data mining and data visualization tools can help to discover the relationships between variables available for management (usually extracted from academic control systems) and school dropout. It can give subsidies for better decision making in order to solve the dropout problem [11,12,13]. In these works, the prediction of school dropout is characterized as a classification problem between two groups of students: (i) one with a tendency to persist, and (ii) another with tendency to dropout. However, it is important to consider that several databases used in studies are imbalanced, in which there is a significantly smaller number of students who dropout when compared to those who persist in the course [14,15,16,17]. When this problem of imbalance happens, it is important to use techniques which mitigate this phenomenon, in order to achieve more precise results and avoid the “Accuracy Paradox”, a phenomenon when a high value of accuracy does not correspond to a high-quality model, because the model is skewed to the majority class and can mask the obtained results [18].
Due to the relevance of this problem, it is present in this work a study on the performance analysis of algorithms for school dropout prediction, with and without the use of data balancing techniques. Decision Tree and MLP neural networks were chosen as target algorithms because they are the most common techniques in the literature for school dropout prediction [19], and Balanced Bagging as a new approach to comparison [20,21,22]. The data-balancing technique adopted is based on the downsample [20], SMOTE [23] and ADASYN [24]. It is also investigated the existence or not of the “Accuracy Paradox” phenomenon, and which performance metrics should be better suited to assess classifiers, such as G-mean [25] and UAR [26,27]. For study validation, this work analyzes educational data of students from the Integrated Courses (high school with training in professional education through technical courses) updated in January 2018 for the Federal Institute of Rio Grande do Norte (IFRN), Brazil.
As contribution of this work, the experimental results indicate:
- The use of data balancing techniques can significantly increase the performance of predictive models when data are imbalanced (in case of school dropout);
- Precision, Recall, F1 and AUC are not adequate performance metrics for imbalanced database in this work;
- UAR, G-mean and confusion matrices are adequate performance metrics for imbalanced database, avoiding the “Accuracy Paradox”.
- Balanced Bagging outperformed MLP and DT in performance on G-mean and UAR metrics
This paper is organized as follows: In Section 2 the concept of “Accuracy Paradox”, balancing techniques, and performance metrics are presented. In Section 3 are described the related works. Section 4 presents the database used to validate the model, the development environment, and the methodology adopted for the predictive model training and evaluation. In Section 5 the impact of the use of Balanced Bagging, balancing techniques and the analysis between the metrics Precision, Recall, AUC, F1, UAR and G-mean are described. Finally, Section 6 describes the importance of the use of balancing techniques for predictive models, and the choice of appropriate evaluation metrics when the data is imbalanced. It is also presented the future work.
2. Balancing Data Problem and Performance Evaluation Metrics
Imbalanced learning is the extraction of knowledge about severely skewed data, in which there is a disproportionate relation between the minority and majority classes. When this phenomenon occurs, the predictive model can fall into the “Accuracy Paradox”, a situation when a high value of accuracy does not correspond to a high-quality model, and might also change how a classification model (e.g., SVM) is trained on imbalanced data [18,28]. For example, if a given dataset includes 1% of minority class examples and 99% of majority class examples, a naive approach to classifying each example as a majority class will provide an accuracy of 99%. However, this result does not reflect the fact that none of the minority examples is identified. It is essential to highlight that in many situations, these minority examples are more important than the majority class. For instance, when problems are related to diseases such as cancer or AIDS, in educational problems such as school dropouts, and Automatic Speech Recognition (ASR).
2.1. Balancing Data Techniques
There are two conventional approaches to solve the problem of imbalanced data, they are: (i) cost-sensitive learning, which assigns a high cost to the misclassification of the minority class, and tries to minimize the total cost; and (ii) the sampling technique, which consists of creating a dataset that has an appropriate class distribution [20].
The two most popular sampling methods are the downsample (also known as undersample) and upsample [20]. In downsample, instances of the majority class are randomly discarded until a more balanced distribution is reached (Figure 1). Consider, for instance, a dataset with ten instances of the minority class and 90 instances of the majority class. In downsample, it can try to create a balanced class distribution by selecting 80 major class instances to remove. The resulting dataset will then consist of 20 instances, with ten instances of the majority class (randomly selected) and ten instances of the minority class equal to the original dataset.
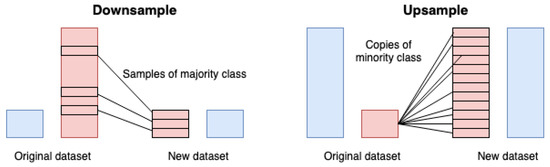
Figure 1.
Downsample flow (left) and Upsample flow (right).
In the case of the upsample technique, instances of minority classes are copied and repeated from the original dataset until a more distribution be achieved (Figure 1). Thus, if there are two instances of minority classes and 100 instances of the majority class, the two instances of minority class will be copied 49 times each. The resulting dataset would consist of 200 instances: the first dominant class of 100 instances and 100 instances of minority classes (i.e., 50 copies of each of the two minority class instances).
There are works show that the downsample technique has better results on upsample when the Decision Tree model was used [29], and with the Neural Networks model, and we highlight that the implementation of the downsample is computationally less costly [30].
Although both downsample and upsample techniques have good results, they have deficiencies. For instance, in the downsample, multiple instances are discarded, so instances that could produce a better decision surface may be lost in the sampling process. Regarding upsample, copying the minority instances may cause overfitting [28].
To avoid overfitting for upsampling, two techniques can be used: SMOTE and ADASYN. The Synthetic Minority Over-sampling Technique (SMOTE) is the most commonly used version of upsample. The algorithm consists when copying data uses the strategy based on the K-Nearest Neighbors (KNN) algorithm [23]. Another upsample strategy is ADASYN. The idea is to use a weighted distribution for different minority class examples according to their level of difficulty in learning, where more synthetic data is generated for minority class examples that are harder to learn compared to those minority examples that are easier to learn [24].
There are also hybrid approaches with excellent results, such as the Balanced Bagging. This algorithm creates new subsets from the original set sampling, in order to equalize the minority class with the same number of instances as the majority class using downsample. The next step, for each of these subsets it’s trains a Decision Tree. At the end aggregate the predictions of the ensemble and make the final prediction [20,22], as seen in the Figure 2.
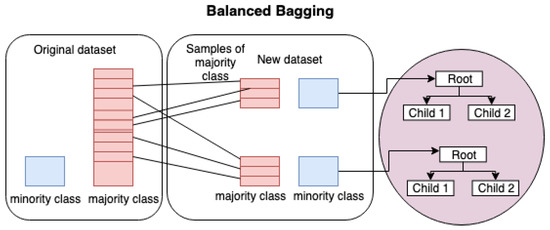
Figure 2.
The Balanced Bagging flow.
Another approach to mitigate the problem of imbalance data is to use models that contemplate training in this balancing BalanceCascade [31]; SVM assigning costs to instances [32]; to Naive-Bayes, since the predictions are calibrated by the probability of the sample; the Decision Trees generated from the Hellinger distance calculation (HDDTs) [28]; k-means balancing [33]; and Probabilistic Sampling [34,35].
2.2. Metrics for Performance Evaluation
To evaluate the performance of classifiers, one of the most used metrics in the literature is the confusion matrix [36], which relates the prediction result of the model and the real class. Matrix format may change depending on which axis represents the prediction and the real class. In this paper we will use the sklearn default [37], where Negative class represents Class 0 (dropout students), and Positive represents Class 1 (persistents students). The matrix is divided into four quadrants:
- True Negative (TN) is the number of correctly classified negative instances located in the 1st quadrant.
- False Negative (FN) is the number of positive instances incorrectly classified as negative located in the 2nd quadrant.
- False Positive (FP) is the number of negative instances classified incorrectly as positive located in the 3rd quadrant.
- True Positive (TP) is the number of positive instances correctly classified as positive located in the 4th quadrant.
For the sake of understanding, the Figure 3 presents a confusion matrix with TN equal to 49, FN equal to 129, FP equal to 38 and TP equal to 1714.
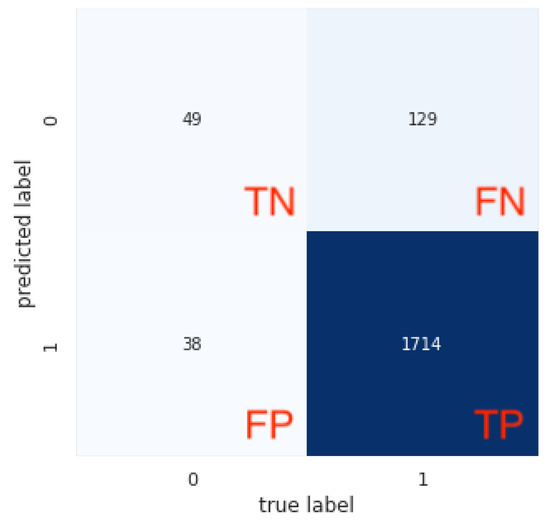
Figure 3.
Confusion matrix example.
From the confusion matrix can be generated performance evaluation metrics of the trained model. The most used metrics are the Recall and Precision. Its definitions are presented in Table 1. For both of them, the hit of the majority class (TP) has a great weight in the final value of the evaluation, making minority class errors little evident in the final result.

Table 1.
Evaluation metrics.
A way to merger Precision and Recall is F1 score [36], that can be interpreted as a weighted average of the Precision and Recall, where an F1 score reaches its best value at 1 and worst score at 0.
Unlike Precision and Recall, a interesting metric robust to imbalance data is Unweighted Average Recall (UAR). This is a popular metric in the area of ASR, that to consider unweighted rather than weighted average recall. The reason is that unaffected by a change in class frequency [26,27]. As seen in Table 1, it is calculated by average between the Recall of Class 0 and the Recall of Class 1.
Another interesting metrics more adequate to handle with imbalanced data can be also derived from the confusion matrix, namely, G-mean and Receiver Operating Characteristic (ROC) curve [25]. The former weighs equally the accuracy of the majority and minority class. On the other hand, the latter summarizes the performance of the classifiers over a range of true positive rates (TPRs) and false positive rates (FPRs) [38]. TPR and FPR are defined by Equations (1) and (2).
When evaluating models with various error rates, the ROC curves are able to determine which proportion of instances will be correctly classified for a given FPR. Figure 4 presents the ROC curve for the confusion matrix shown in Figure 3.
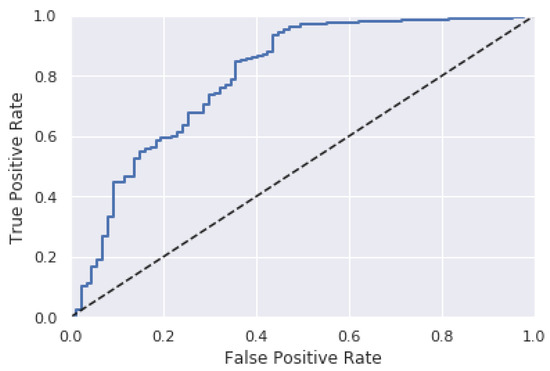
Figure 4.
ROC Curve Example.
While ROC curves provide a visual method to determine the effectiveness of a classifier, the area under the ROC curve (AUC) has become the standard metric for evaluating imbalanced classes [39]. This is due to the fact that the calculated value is independent of the selected threshold and the previous probabilities, generating a single number that can be used to compare the classifiers.
For the sake of understanding, the Table 2 summarizes the results described in Figure 3. It is interesting to note that the value of the G-mean, UAR and AUC metrics differs significantly from the good results presented by the other metrics. This is due to the imbalance of data, where the hit of the majority class hides the high number of errors of the minority class evidenced by the FP of the confusion matrix. By taking into account the accuracy of the minority class, only the G-mean, UAR and AUC manages to show the high error of this class when compared to the other metrics. Therefore, the G-mean, UAR and AUC metric are more robust to the Accuracy Paradox, where a high performance value does not represent the quality of the model.
Table 2.
Evaluation metrics.
3. Related Work
In this section, it is present the related works regarding predictive models applied to the school dropout problem. From the literature review are highlight the variables and data mining techniques adopted as well as the performance evaluation metrics of the models.
The authors argue in [19] that the most used input attributes for predictive model applied to school dropout problem are variables related to student performance, such as Cumulative Grade Points Average (CGPA ), quizzes, lab work, class test, and attendance. Another category of widely used variables is the demographic data of the students, such as gender, age, family background, and disability. Finally, some papers use variables related to extra-curricular activities, e.g., high school background and social interaction network. The algorithms used to generate the models were: Decision Tree, Artificial Neural Networks, Naive Bayes, K-Nearest Neighbor, and Support Vector Machine. Among them, those with the best accuracy were Neural Network (98%) and Decision Tree (91%).
A Neural Network is a massively parallel distributed processor made up of simple processing units, which have the natural propensity to store experimental knowledge and make it available for use [40]. Artificial neural networks were developed to resemble the biological structures found in living beings due to the capacity to store knowledge that they present. This learning takes place through the connections, or synaptic weights, that exist between the neurons. The most famous and used neural network is the multilayer perceptron, which uses several massively connected and layered neurons. The amount of neurons, such as the number of layers, depends directly on the problem. However, some studies show that a three-layer MLP (input, hide, and output) is capable of mapping any function, either linear or nonlinear [41].
Decision Tree (DT) is a non-parametric supervised learning method used for classification and regression. The goal is to create a model that predicts the value of a target variable by learning simple decision rules inferred from a set of pre-selected input data using the divide strategy to conquer [32].
Another paper, authors used a Logistic Regression technique to create a predictive model of evasion, considering only the academic data of students. Accuracy and confusion matrices were adopted as a performance measure. The model was used to aid in the decision making of a student retention policy and obtained a 14% reduction in the dropout rate [11].
A interesting model prediction applied for school dropout problem, the authors used data from e-learning courses, and a combination of machine learning techniques such as MLP, support vector machines and probabilistic ensemble simplified fuzzy ARTMAP through three decision schemes. Demographic data (gender, residency, working experience), prior academic performance (educational level, multiple choice test grade, project grade, project submission date, Section activity) were suggested as input variables. Accuracy, sensitivity, and precision metrics were used in evaluations [42].
In another paper, the decision tree techniques and hierarchical clustering are used to predict student performance. The method has two stages: predicting students’ academic achievement at the end of a four-year study program; studying typical progressions and combining them with prediction results. The input variables of the model are related only to the performance of the student, such as: admission marks from high school, and final marks of first and second-year courses at university. As an evaluation of the model, it were used the metrics accuracy, kappa and confusion matrices [43].
In work proposed in [15], the C4.5 technique is used to identify possible failing students during the first four weeks of the semester. The model adopted as input data the engagement ratio, bangor engagement metric, student’s program, the school, and the year of study. The model was evaluated from the metrics: true positive, false positive, precision, the area under the ROC Curve.
As evidenced in Table 3, in none of the studies surveyed was the concern presented with data balancing, even some of them showing imbalanced bases. Differently from the studies mentioned above, this paper analyses the influence of the use of balancing techniques on model performance, the verification of the “Accuracy Paradox”, and how to measure the performance of the predictive model more reliably.
Table 3.
Related Works Comparison.
4. Methodology
The data used in this study are based on 7718 students of Integrated Education (secondary education with training in professional education through technical courses with duration of four years, in the face-to-face modality) of the Federal Institute of Rio Grande do Norte (IFRN). This educational institution is located in northeastern Brazil and distributed by 20 campuses in different cities in the state of Rio Grande do Norte (RN). The available database was extracted from the Unified Public Administration System (SUAP (suap.ifrn.edu.br)), developed by IFRN, and has demographic information, socioeconomic characterization and the final average of students in the subjects. The last update was in January 2018.
It were selected 25 attributes, of which six are related to academic performance in Portuguese and Mathematics subjects since these are frequent subjects of all courses in the first year of student enrollment. The remaining 19 attributes are related to demographic and socio-economic characteristics of the students (Table 4). Before training, the data were divided into test set (25% of data) and training (75% of data). Instances with NULL values have been removed.
Table 4.
Description of selected variables.
The learning models applied were DT, MLP (Section 3) and Balanced Bagging (Section 2.1).
The development environment used was the programming language Python and the packages: Pandas and Numpy, for manipulation of the data; scikit-learn for classic supervised learning [37]; imbalanced-learn [22] for supervised learning with imbalanced classes; Seaborn and Matplotlib, for the graphics. All code is available in [44].
The Figure 5 describes the pipeline for the predictive model of school dropout considering the challenge of imbalanced data. The target is to create a prediction model with an emphasis on the predicted accuracy of the student evaded.
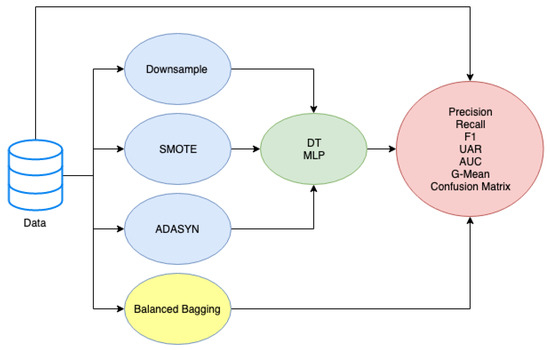
Figure 5.
Pipeline for the predictive model of school dropout.
Synthetically, the pipeline follows the steps:
- Balance Data: Downsample, SMOTE, ADASYN were used to generate balanced data and produce models that avoid the paradox of precision. The original training set was 5788, of which 262 minority class (dropout students) and 5526 majority class (persistent students) instances. After using the Downsampling, there was a reduction in the class of persistent students, and the new data set consisted of 524 equally distributed instances. Using the SMOTE balancing technique, the minority class set was incremented to a total of 5526 instances and the new dataset now has 11052 instances. For ADASYN the new set was 5537 for minority class and 5526 for majority class.
- Model / Tunning: on the balanced data are used machine learning techniques (DT, MLP, Balanced Bagging) to predict dropout. For tuning the parameters we used the exhaustive search over specified parameter values for each Model through the Gridsearch package [37]. For the DT we performed a search on the parameters: function that defines the node break (gini, entropy), the maximum tree depth (None, 3, 5), the minimum number of samples required for the leaf (None, 5, 10, 20). For the MLP the optimized parameters were: the optimization function (Limited-memory BFGS), maximum number of iterations (200), regularization term (0.1, 0.01, 0.001), number of neurons in the hidden layer (5, 8, 11, 14, 17), the seed used by the random number generator (0, 42), and rectified linear unit function like activation function. Finally, for Balanced Bagging the number of DT that makes up the ensemble (10, 30, 100, 200, 300)
- Metrics/Evaluation: with the trained models, evaluations should be performed using metrics: precision, recall, F1, UAR, AUC, G-mean and the confusion matrix.
As seen in [19], the most common and more accurate used models in the prediction problem under the school dropout context are MLP and Decision Tree. Thus, both of them are considered in the proposal for this work. Additionally, the downsample technique is also adopted because it presented better results when tunned with Neural Networks [30] and Decision Tree [29]. Furthermore, downsample technique has a small computational cost [30]. For comparison, in this paper we also use SMOTE, ADASYN as balancing techniques, and the Balanced Bagging as hybrid model.
To validate if there was a difference in performance between the models, we used the Kruskal-Wallis statistical test [45]. This test have performed to check if there are significant differences among the medians for each method with p-value 0.05.
5. Results and Discussion
This section presents the performance comparison of the classic MLP, DT and Balanced Bagging methods when applied for the prediction of school dropout. Scenarios with the use of downsampling, SMOTE, ADASYN and without the use of any balancing technique are verified. After the classification algorithm training process, the confusion matrix (Figure 6), precision, recall, F1, G-mean, UAR and AUC over the entire test set (Table 5) are also investigated to evaluated the model. It is important to highlight that the minority class represents the group of students droppout, and the majority class the group of students that persist in the course.
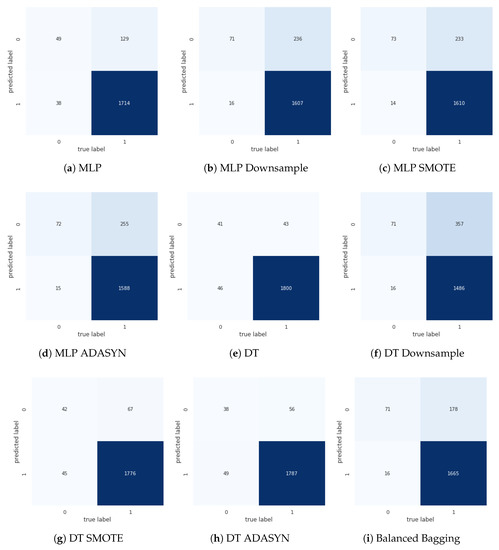
Figure 6.
Confusion Matrix for the predictive model under school dropout study.
Table 5.
Comparison of performance metrics between models.
In Figure 6a,e we have a high error of the minority class (38 errors of a total of 87 instances for the DT, and 46 errors for the MLP) when the sampling technique is not used, as is usually employed in the literature. However, this poor result was obfuscated due to excellent accuracy shown in Precision, Recall and F1 metrics (all values close to 1.0 in rows I and II, columns I, II and III of Table 5) for DT and MLP. Nevertheless, the AUC, UAR and G-mean metrics were able to detect the high minority class error, with ratings all below 0.74 (rows I and II, columns IV, V, VI).
When the downsample technique was used it is possible to note in results shown in Figure 6b,f a significant decrease of the minority class error (16 errors of a total of 87 instances for the DT and MLP). As expected, the G-mean and UAR metric resulted in a performance increase (both metrics 0.811 for DT, both metrics 0.844 for MLP), but AUC kept lower values (0.736 for DT and 0.798 for MLP). However, it is essential to highlight the increase of the FN error when using the downsample technique (from 43 to 357 in the DT, from 129 to 236 for MLP). This behavior impacted in the decrease of Recall (from 0.977 to 0.806 for DT and 0.930 to 0.872 for MLP) since this metric emphasizes the accuracy of the majority class. The precision and F1 metrics were maintained with high values.
When using the SMOTE technique we noticed a decrease of minority class errors for MLP (Figure 6c), but for DT the error was maintained (Figure 6g) when compared to the model without balancing technique. Similarly with the downsample, the high-error minority smote DT had high performance values for Precision, Recall, and F1 (row V, columns I, II, III), while G-mean, UAR, and AUC scored low (row V, columns IV, V, VI). For MLP with SMOTE that had few minority errors, the G-mean and UAR metrics showed an increase in values, however the AUC maintained low values (row VI).
When using ADASYN, a situation similar to SMOTE occurred: there was an improvement in the minority class correctness for MLP (identified by the G-mean and UAR metrics), however there was no score improvement in with DT.
In all the experiments described above, the AUC score had little variation, regardless of improvement in minority class accuracy. In other words, the AUC could not represent the increase in accuracy of the student dropout, the focus of this work. However, the metrics UAR and G-mean were able to identify the increase in accuracy of the minority class with values close to all models as seen in the Figure 7.
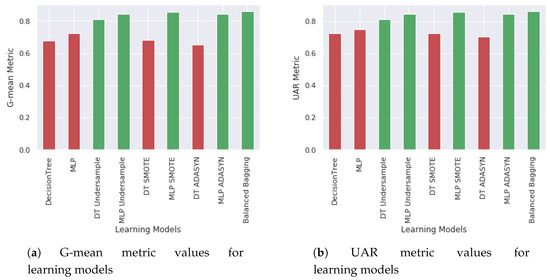
Figure 7.
Algorithms Comparison.
Finally, when analyzing the Balanced Bagging technique (last line Table 3), it was verified that in all robust unbalance metrics it had the best results (UAR:0.860, G-mean:0.859 and AUC:0.929). Looking at the confusion matrix (Figure 6i), it is verified that this excellent result is due to the reduction of minority class error with a smaller majority class error when compared to other balancing techniques.
In order to verify that the metrics have statistically different values, we have applied a 10-fold cross validation over the test set. In addition, the Kruskal statistical test was performed for UAR and G-mean metrics. Thus, Figure 8 presents the boxplot results with 10-fold cross validation for each learning model. In item (a) it was used the G-mean metric and in item (b) the UAR metric. In both graphs the Balanced Bagging median obtained the best results. For all Kruskal tests, the p-value was close to 0 and less than 0.05 between Balanced Bagging and all other models. It means that at least a model exists that is better than the others, in this case, the Balanced Bagging.
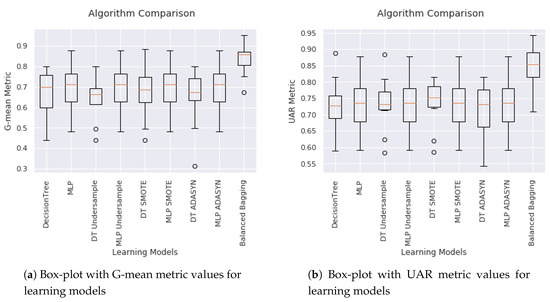
Figure 8.
Algorithms Comparison.
It becomes evident after analyzing the results that the imbalance of data makes metrics like Recall, Precision, and F1 more likely to emphasize only the accuracy of the majority class whereas it falls into the Accuracy Paradox.On the other hand, the G-mean and UAR metric presented as a better candidates to evaluate predictive models on imbalanced data because it counts in its calculation the accuracy of the minority class. It is also evidenced that, after the use of the Balanced Bagging, downsample for MLP and DT, SMOTE for MLP and ADASYN for MLP, there were an increase in the performance of the model to predict the minority class represented by the decrease of the FP error. Nevertheless, the improvement in the prediction of the minority class worsened the accuracy of the majority class represented by the increase of the FN error. In the judgment of the authors, the impact observed in FN does not present significant problems since it predicts that the student would dropout but did not occur. This fact does not bring a significant burden to the institution of education under study. On the other side, the problem of FP error has a significant impact, given it means that the student’s prediction kept in school, but the result was that the student dropped out.
6. Conclusions
After analyzing the results, we concluded that the Accuracy, Recall and F1 metrics failed to detect the high amount of errors of the minority class (the student dropped out) when the data was imbalanced. The AUC metric remained stable even when there was an increase in accuracy. However, G-mean and UAR metrics were able to capture the minority class error for the two classifiers. We also concluded that the use of data balancing technique before training the predictive model promotes a significant increase in the results when measured by the G-mean and UAR metrics. In other words, there was an improvement in the prediction of the students being dropped out. However, the best model for the problem addressed in this paper was Balanced Bagging. Therefore, for imbalanced data contexts, it is recommended to use the G-mean and UAR metric to measure the quality of the most reliable model and avoid the Accuracy Paradox. The use of data balancing techniques is also able to increase the performance of the predictive model, but better results can be obtained with Balanced Bagging. As future work, we plan to consider the use of other advanced machine learning techniques, such as Deep Learning and Probabilistic Programming, and the testing of other balance techniques, such as k-means balancing and probabilistic sampling.
Author Contributions
The all authors contributed equally to this work.
Funding
This research received no external funding.
Conflicts of Interest
The authors declare no conflict of interest.
Notations
| EDM | Educational Data Mining |
| MLP | Multilayer Perceptron |
| DT | Decision Tree |
| SVM | Support Vector Machine |
| KNN | K-Nearest Neighbors |
| SMOTE | Synthetic Minority Over-sampling |
| ADASYN | Adaptive Synthetic Sampling |
| UAR | Unweighted Average Recall |
| ROC | Receiver Operating Characteristic |
| AUC | Area Under the Curve |
| ASR | Automatic Speech Recognition |
| IFRN | Federal Institute of Rio Grande do Norte |
| TN | True Negative |
| FN | False Negative |
| FP | False Positive |
| TP | True Positive |
References
- Romero, C.; Ventura, S. Educational Data Mining: A Review of the State of the Art. IEEE Trans. Syst. Man Cybern. Part C (Appl. Rev.) 2010, 40, 601–618. [Google Scholar] [CrossRef]
- Dahdouh, K.; Dakkak, A.; Oughdir, L.; Ibriz, A. Large-scale e-learning recommender system based on Spark and Hadoop. J. Big Data 2019, 6, 2. [Google Scholar] [CrossRef]
- Zhang, C.; Chen, H.; Phang, C.W. Role of Instructors Forum Interactions With Students in Promoting MOOC Continuance. J. Glob. Inf. Manag. 2018, 26, 105–120. [Google Scholar] [CrossRef]
- Lagus, J.; Longi, K.; Klami, A.; Hellas, A. Transfer-Learning Methods in Programming Course Outcome Prediction. ACM Trans. Comput. Educ. 2018, 18, 19:1–19:18. [Google Scholar] [CrossRef]
- Kassarnig, V.; Mones, E.; Bjerre-Nielsen, A.; Sapiezynski, P.; Dreyer Lassen, D.; Lehmann, S. Academic performance and behavioral patterns. EPJ Data Sci. 2018, 7, 10. [Google Scholar] [CrossRef]
- Truta, C.; Parv, L.; Topala, I. Academic Engagement and Intention to Drop Out: Levers for Sustainability in Higher Education. Sustainability 2018, 10, 4637. [Google Scholar] [CrossRef]
- Kim, D.; Kim, S. Sustainable Education: Analyzing the Determinants of University Student Dropout by Nonlinear Panel Data Models. Sustainability 2018, 10, 954. [Google Scholar] [CrossRef]
- Martín Núñez, J.L.; Tovar Caro, E.; Hilera González, J.R. From Higher Education to Open Education: Challenges in the Transformation of an Online Traditional Course. IEEE Trans. Educ. 2017, 60, 134–142. [Google Scholar] [CrossRef]
- Barros, R.P. Políticas Públicas para a Redução do Abandono e da Evasão Escolar de Jovens; Technical report; Fundação Brava, Insper, Instituto Unibanco e Instituto Ayrton Senna, 2017; Available online: http://gesta.org.br/wp-content/uploads/2017/09/Politicas-Publicas-para-reducao-do-abandono-e-evasao-escolar-de-jovens.pdf (accessed on 15 November 2019).
- Brasil Ministry of Education. MEC Libera 100% Do OrçAmento De Custeio Para Universidades E Institutos Federais; Brasil Ministry of Education: Brasilia, Brazil, 2018.
- Burgos, C.; Campanario, M.L.; de la Peña, D.; Lara, J.A.; Lizcano, D.; Martínez, M.A. Data mining for modeling students’ performance: A tutoring action plan to prevent academic dropout. Comput. Electr. Eng. 2018, 66, 541–556. [Google Scholar] [CrossRef]
- Nelson, K.J.; Quinn, C.; Marrington, A.; Clarke, J.A. Good practice for enhancing the engagement and success of commencing students. High. Educ. 2012, 83–96. [Google Scholar] [CrossRef]
- Jayaprakash, S.M.; Moody, E.W.; Lauría, E.J.; Regan, J.R.; Baron, J.D. Early Alert of Academically At-Risk Students: An Open Source Analytics Initiative. J. Learn. Anal. 2014, 6–47. [Google Scholar] [CrossRef]
- INEP. Inep Divulga Dados InéDitos Sobre Fluxo Escolar Na EducaçãO BáSica; INEP: Sao Paulo, Brazil, 2017.
- Gray, C.C.; Perkins, D. Utilizing early engagement and machine learning to predict student outcomes. Comput. Educ. 2019, 131, 22–32. [Google Scholar] [CrossRef]
- Blieck, Y.; Kauwenberghs, K.; Zhu, C.; Struyven, K.; Pynoo, B.; Depryck, K. Investigating the relationship between success factors and student participation in online and blended learning in adult education. J. Comput. Assist. Learn. 2019, 1, 15. [Google Scholar] [CrossRef]
- Jacobsen, D.Y. Dropping Out or Dropping In? A Connectivist Approach to Understanding Participants’ Strategies in an e-Learning MOOC Pilot. Technol. Knowl. Learn. 2019, 24, 1–21. [Google Scholar] [CrossRef]
- Zhu, X.; Davidson, I. Knowledge Discovery and Data Mining: Challenges and Realities; IGI Global: Hershey, PA, USA, 2007. [Google Scholar] [CrossRef]
- Shahiri, A.M.; Husain, W.; Rashid, N.A. A Review on Predicting Student’s Performance Using Data Mining Techniques. Procedia Comput. Sci. 2015, 72, 414–422. [Google Scholar] [CrossRef]
- Chen, C.; Liaw, A.; Breiman, L. Using Random Forest to Learn Imbalanced Data; Technical report; University of California: Berkeley, CA, USA, 2004. [Google Scholar]
- Breiman, L. Random Forests. Mach. Learn. 2001, 45, 5–32. [Google Scholar] [CrossRef]
- Lemaître, G.; Nogueira, F.; Aridas, C.K. Imbalanced-learn: A Python Toolbox to Tackle the Curse of Imbalanced Datasets in Machine Learning. J. Mach. Learn. Res. 2017, 18, 1–5. [Google Scholar]
- He, H.; Garcia, E.A. Learning from Imbalanced Data. IEEE Trans. Knowl. Data Eng. 2009, 21, 1263–1284. [Google Scholar] [CrossRef]
- He, H.; Bai, Y.; Garcia, E.A.; Li, S. ADASYN: Adaptive synthetic sampling approach for imbalanced learning. In Proceedings of the 2008 IEEE International Joint Conference on Neural Networks (IEEE World Congress on Computational Intelligence), Hong Kong, China, 1–8 June 2008; pp. 1322–1328. [Google Scholar] [CrossRef]
- Kubat, M.; Matwin, S. Addressing the Curse of Imbalanced Training Sets: One-Sided Selection. In Proceedings of the Fourteenth International Conference on Machine Learning, Burlington, MA, USA, 8–12 July 1997; pp. 179–186. [Google Scholar]
- Schuller, B.W.; Steidl, S.; Batliner, A. The INTERSPEECH 2009 emotion challenge. In Proceedings of the 10th Annual Conference of the International Speech Communication Association, Brighton, UK, 6–10 September 2009. [Google Scholar]
- Kaya, H.; Karpov, A.A. Efficient and effective strategies for cross-corpus acoustic emotion recognition. Neurocomputing 2018, 275, 1028–1034. [Google Scholar] [CrossRef]
- He, H.; Ma, Y. Imbalanced Learning: Foundations, Algorithms, and Applications; Wile: Hoboken, NJ, USA, 2013. [Google Scholar]
- Drummond, C. C4.5, Class Imbalance, and Cost Sensitivity: Why Under-Sampling beats OverSampling. In Proceedings of the Twentieth International Conference on Machine Learning (ICML-2003), Washington, DC, USA, 21–24 August 2003. [Google Scholar]
- Dittman, D.J.; Khoshgoftaar, T.M.; Wald, R.; Napolitano, A. Comparison of Data Sampling Approaches for Imbalanced Bioinformatics Data. In Proceedings of the Twenty-Seventh International Florida Artificial Intelligence Research Society Conference, Pensacola Beach, FL, USA, 21–23 May 2014. [Google Scholar]
- Liu, X.Y.; Wu, J.; Zhou, Z.H. Exploratory under-sampling for class-imbalance learning. In Proceedings of the Sixth International Conference on Data Mining, Hong Kong, China, 18–22 December 2006; pp. 965–969. [Google Scholar]
- Witten, I.H.; Frank, E.; Hall, M.A.; Pal, C.J. Data Mining Practical Machine Learning Tools and Techniques; Elsevier: Amsterdam, The Netherlands, 2016; p. 654. [Google Scholar]
- Rieger, S.A.; Muraleedharan, R.; Ramachandran, R.P. Speech based emotion recognition using spectral feature extraction and an ensemble of kNN classifiers. In Proceedings of the 9th International Symposium on Chinese Spoken Language Processing, Singapore, 12–14 September 2014; pp. 589–593. [Google Scholar] [CrossRef]
- Grósz, T.; Gosztolya, G.; Tóth, L. Training Context-Dependent DNN Acoustic Models Using Probabilistic Sampling. In Proceedings of the 8th Annual Conference of the International Speech Communication Association, Stockholm, Sweden, 20–24 August 2017; pp. 1621–1625. [Google Scholar] [CrossRef]
- Lawrence, S.; Burns, I.; Back, A.; Tsoi, A.C.; Giles, C.L. Neural Network Classification and Prior Class Probabilities. In Neural Networks: Tricks of the Trade, 2nd ed.; Montavon, G., Orr, G.B., Müller, K.R., Eds.; Springer: Berlin/Heidelberg, Germany, 2012; pp. 295–309. [Google Scholar] [CrossRef]
- Ting, K.M. Confusion Matrix. In Encyclopedia of Machine Learning and Data Mining; Springer: Boston, MA, USA, 2017; p. 260. [Google Scholar] [CrossRef]
- Pedregosa, F.; Varoquaux, G.; Gramfort, A.; Michel, V.; Thirion, B.; Grisel, O.; Blondel, M.; Prettenhofer, P.; Weiss, R.; Dubourg, V.; et al. Scikit-learn: Machine Learning in Python. J. Mach. Learn. Res. 2011, 12, 2825–2830. [Google Scholar]
- Swets, J.A. Measuring the accuracy of diagnostic systems. Science 1988, 240, 1285–1293. [Google Scholar] [CrossRef] [PubMed]
- Bradley, A.P. The use of the area under the ROC curve in the evaluation of machine learning algorithms. Pattern Recognit. 1997, 30, 1145–1159. [Google Scholar] [CrossRef]
- Haykin, S. Redes Neurais, 2nd ed.; Bookman Companhia ED: Porto Alegre, Brazil, 2001. [Google Scholar]
- Hornik, K.; Stinchcombe, M.; White, H. Multilayer feedforward networks are universal approximators. Neural Netw. 1989, 2, 359–366. [Google Scholar] [CrossRef]
- Lykourentzou, I.; Giannoukos, I.; Nikolopoulos, V.; Mpardis, G.; Loumos, V. Dropout prediction in e-learning courses through the combination of machine learning techniques. Comput. Educ. 2009, 53, 950–965. [Google Scholar] [CrossRef]
- Asif, R.; Merceron, A.; Ali, S.A.; Haider, N.G. Analyzing undergraduate students’ performance using educational data mining. Comput. Educ. 2017, 113, 177–194. [Google Scholar] [CrossRef]
- Barros, T.M. Modelo IFRN Integrado. 2019. Available online: https://github.com/tmedeirosb/modelo_ifrn_integrado/blob/master/PAPER_MDPI_REVIEW.ipynb (accessed on 15 November 2019).
- Hollander, M.; Wolfe, D.A.; Hollander, M. Nonparametric Statistical Methods; Wiley: New York, NY, USA, 2013. [Google Scholar]
© 2019 by the authors. Licensee MDPI, Basel, Switzerland. This article is an open access article distributed under the terms and conditions of the Creative Commons Attribution (CC BY) license (http://creativecommons.org/licenses/by/4.0/).