Predictive Models for Imbalanced Data: A School Dropout Perspective

 ,
,  ,
,  and
and
Abstract
:1. Introduction
- The use of data balancing techniques can significantly increase the performance of predictive models when data are imbalanced (in case of school dropout);
- Precision, Recall, F1 and AUC are not adequate performance metrics for imbalanced database in this work;
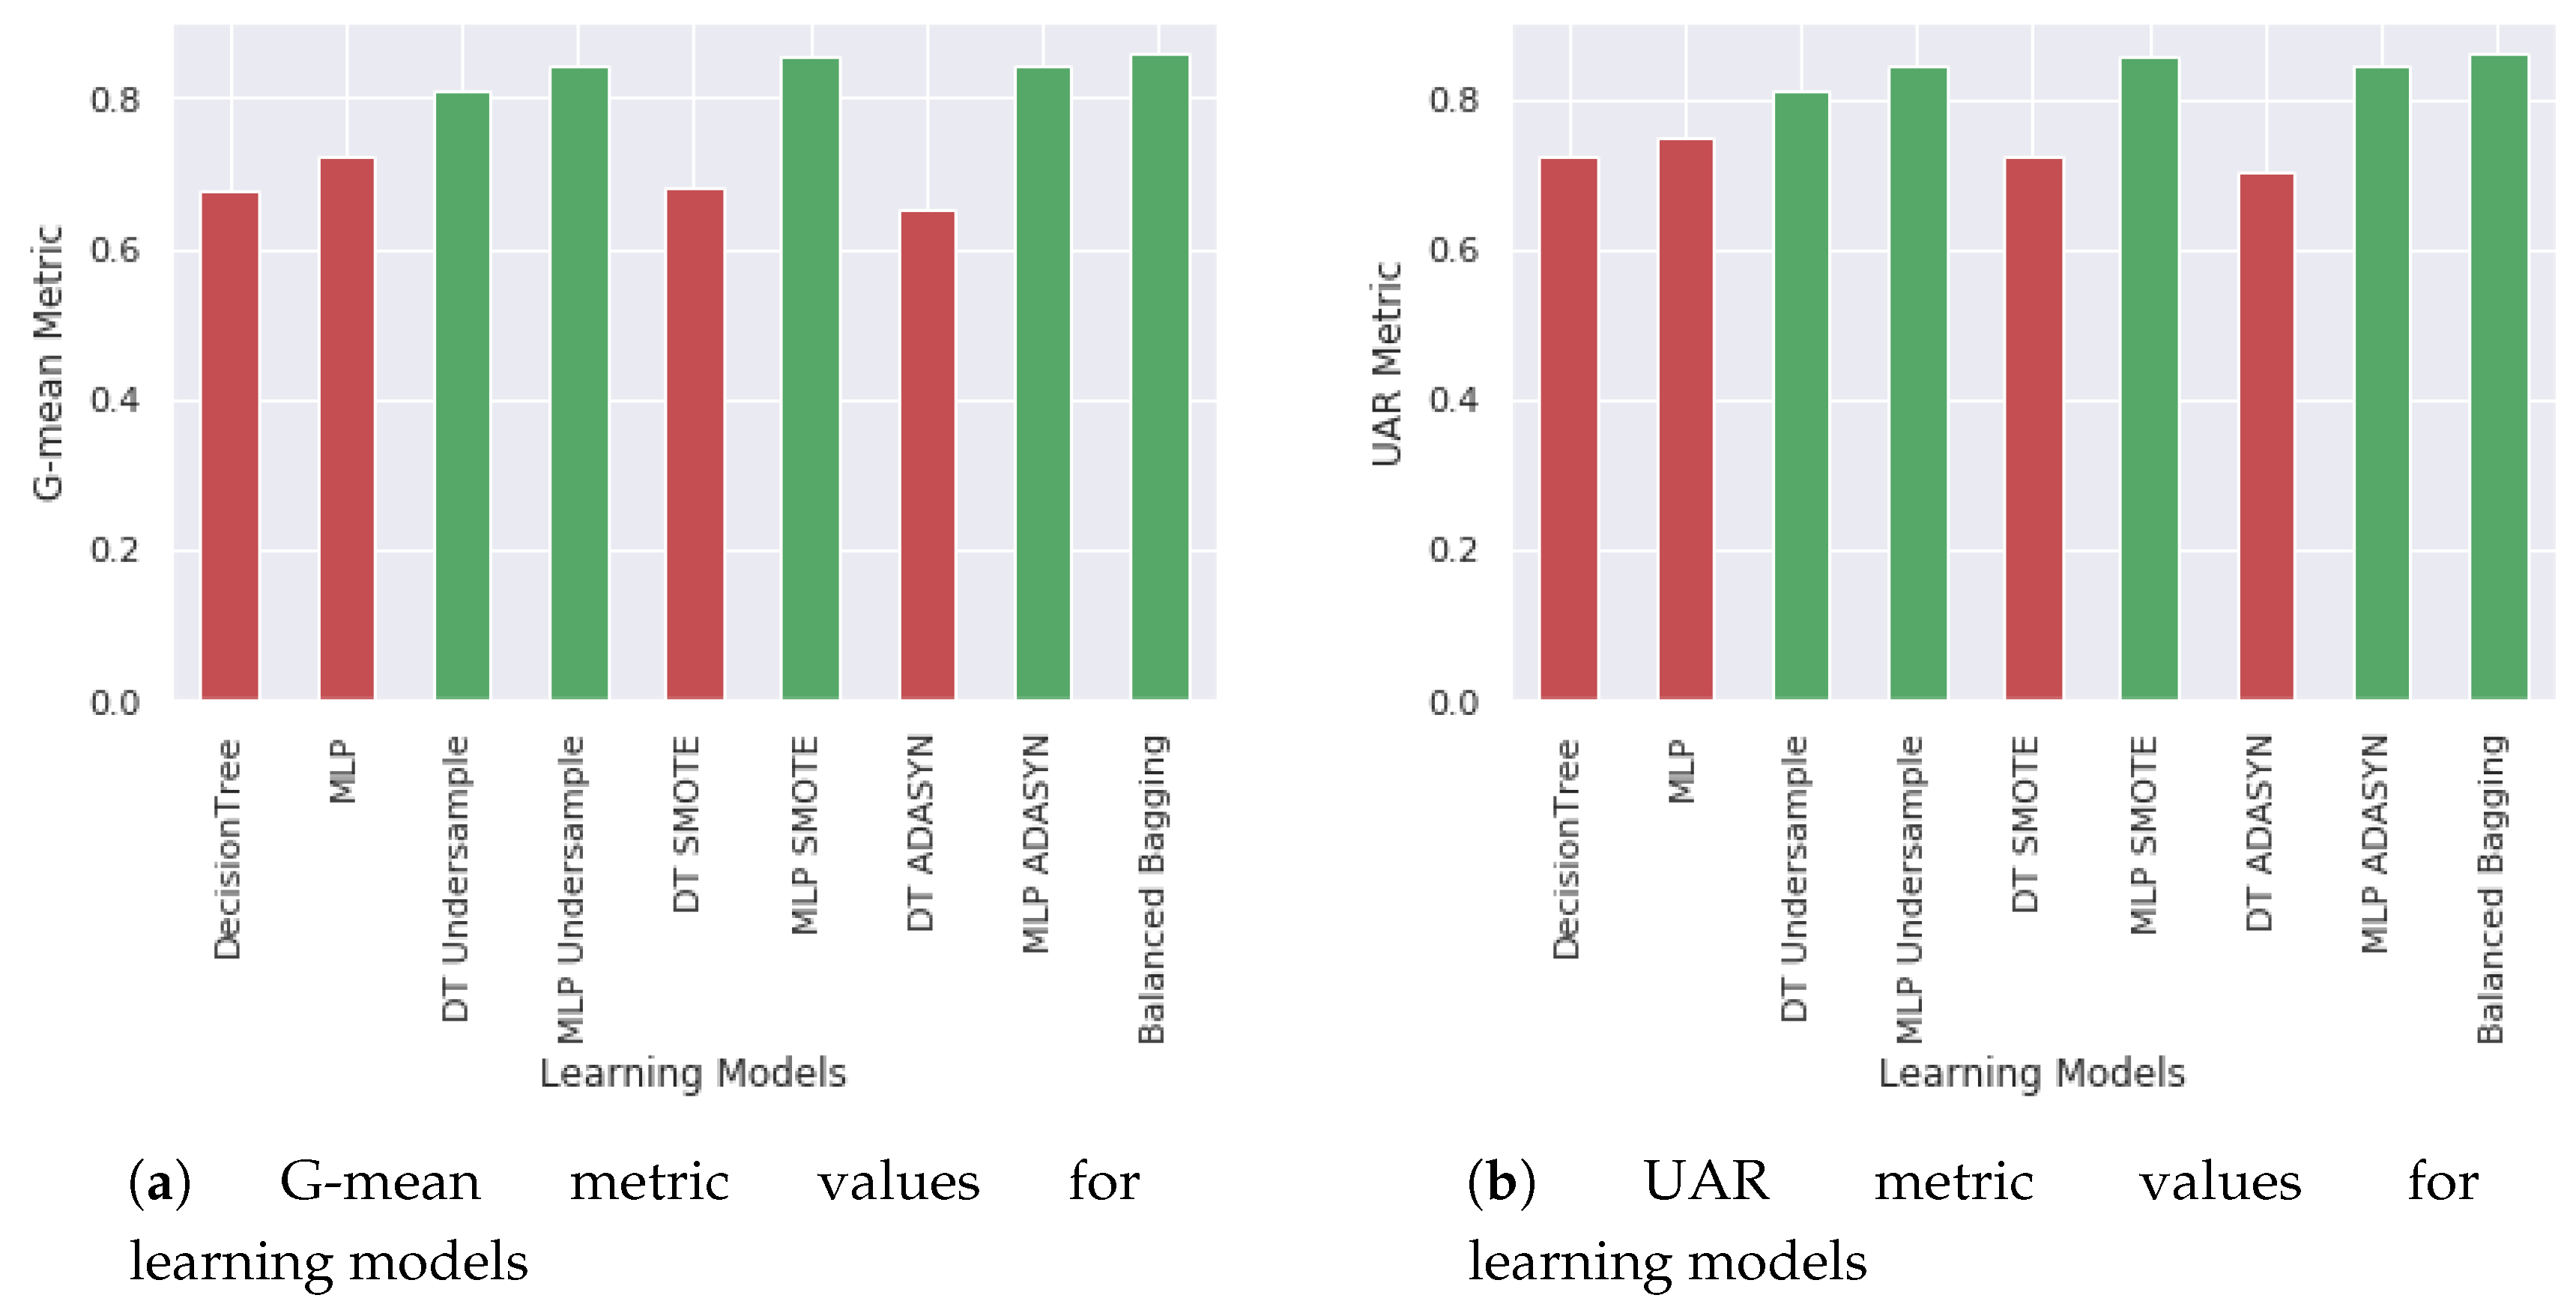
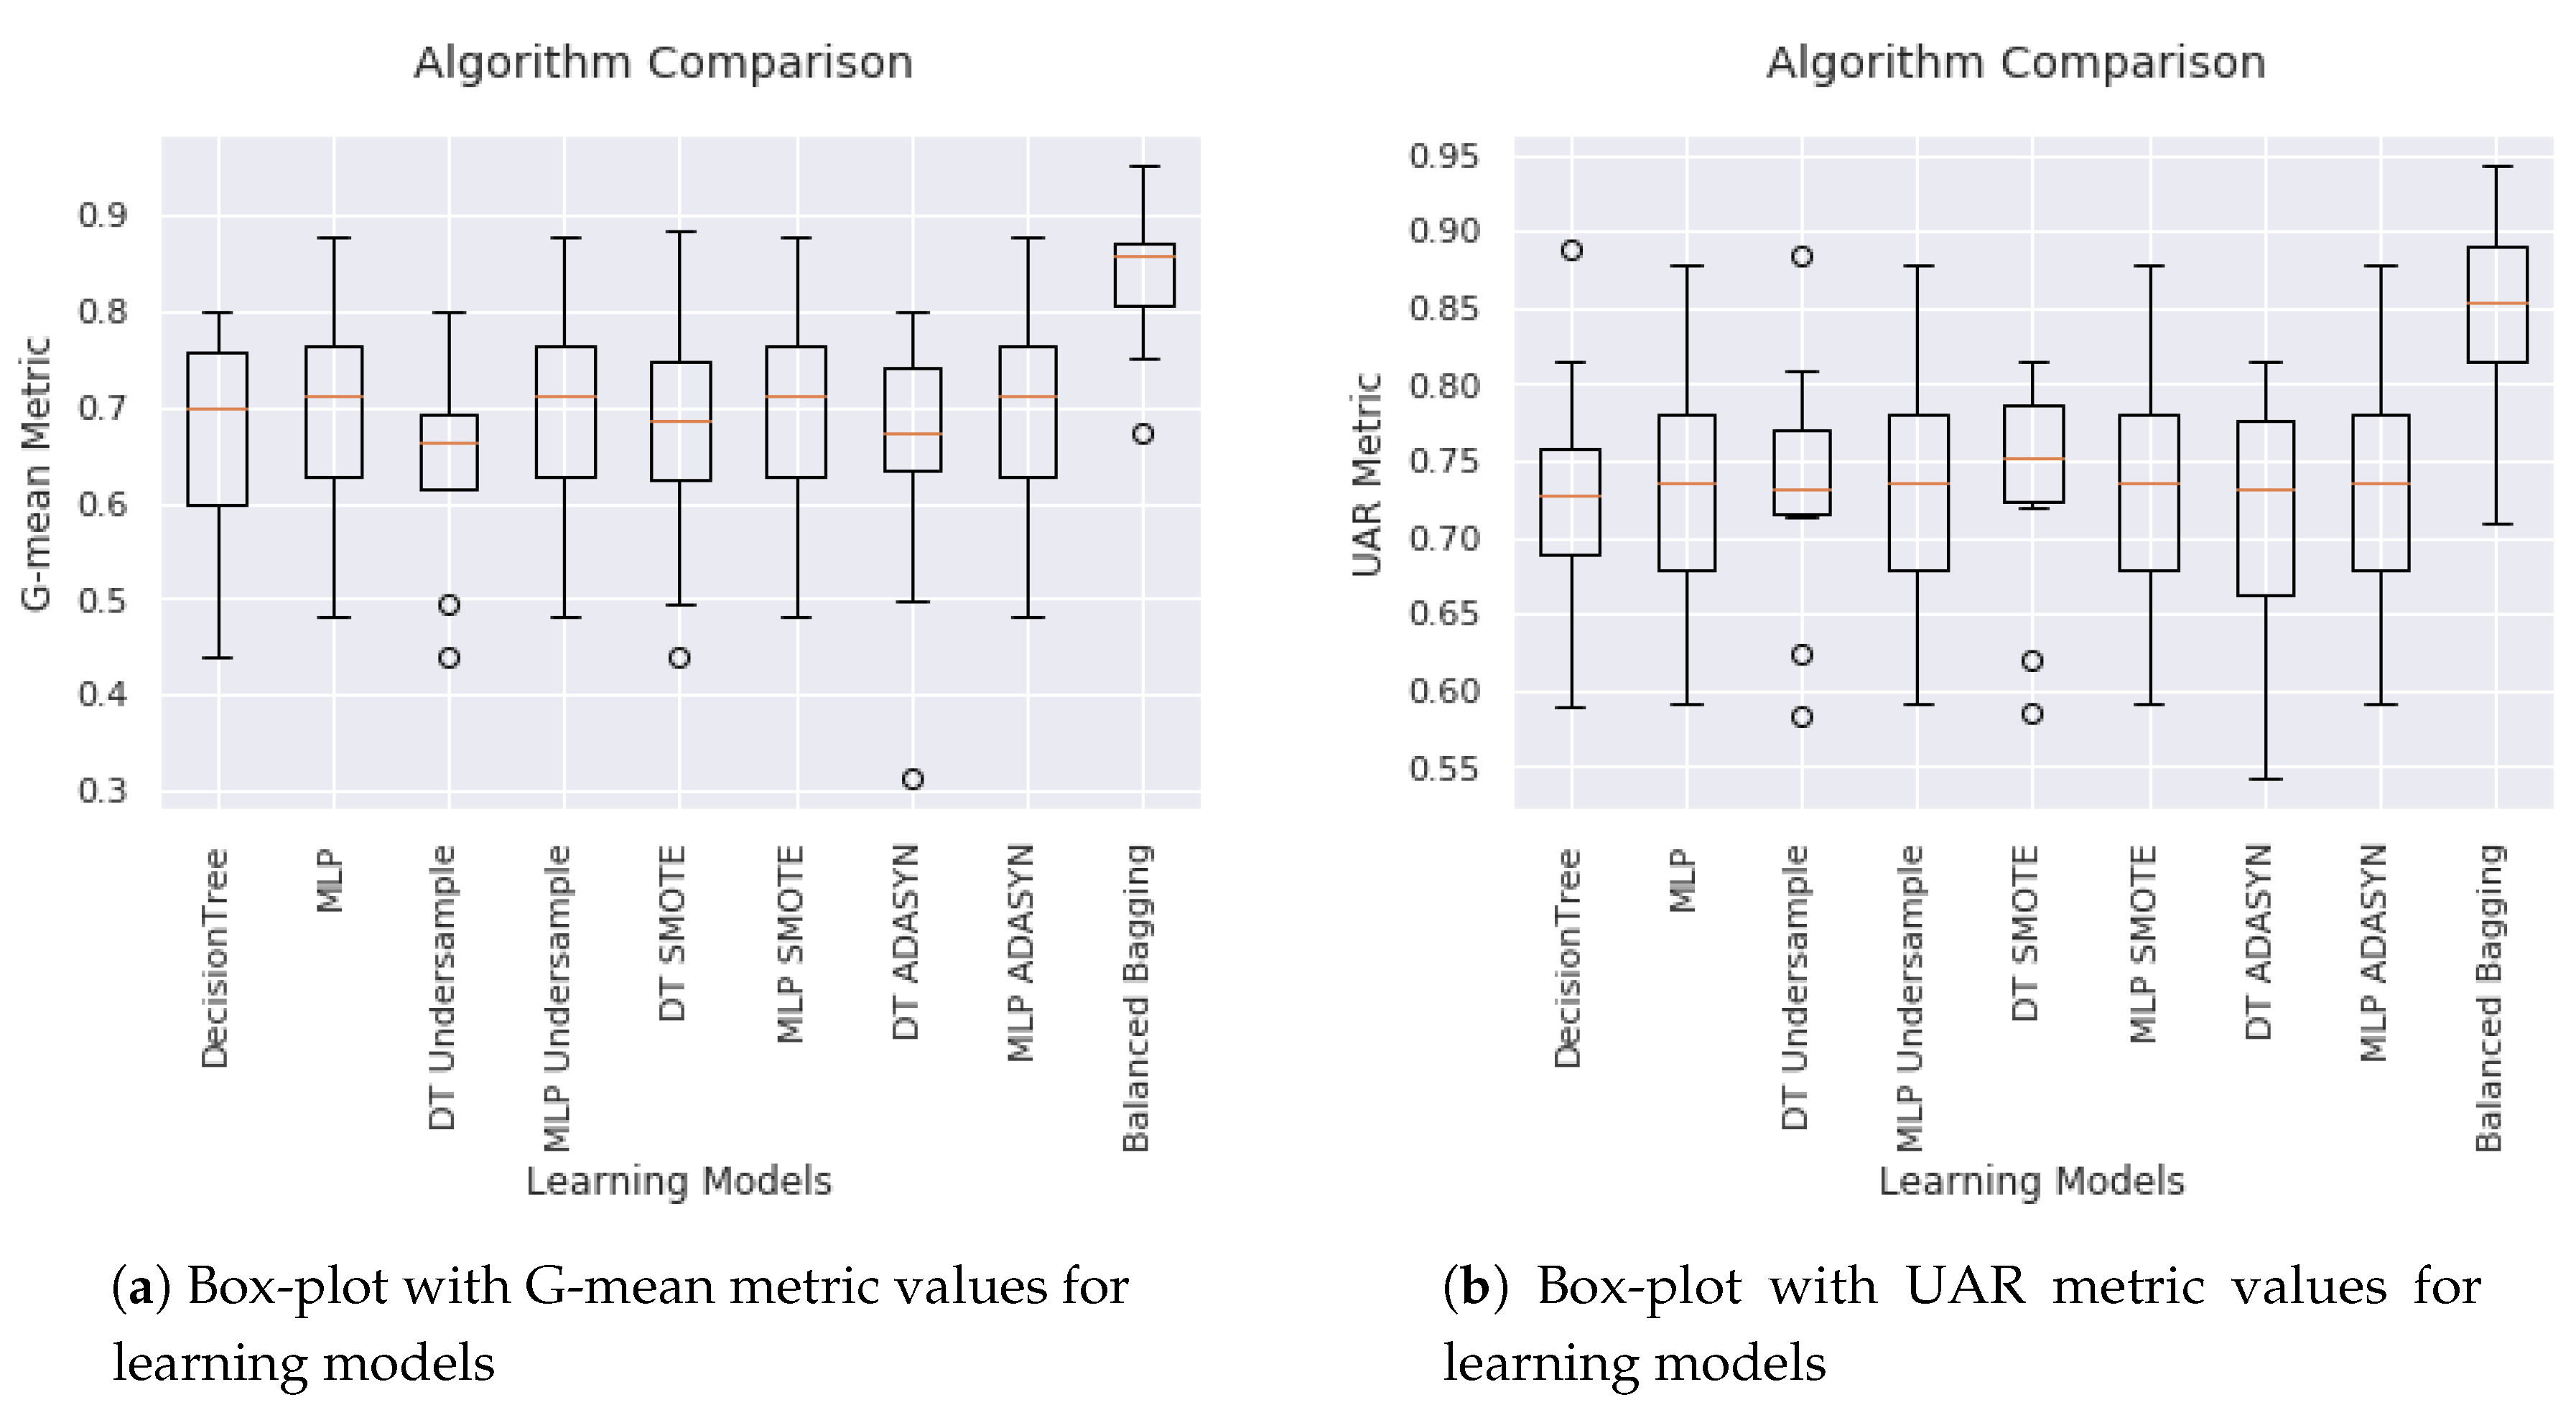
- UAR, G-mean and confusion matrices are adequate performance metrics for imbalanced database, avoiding the “Accuracy Paradox”.
- Balanced Bagging outperformed MLP and DT in performance on G-mean and UAR metrics
2. Balancing Data Problem and Performance Evaluation Metrics
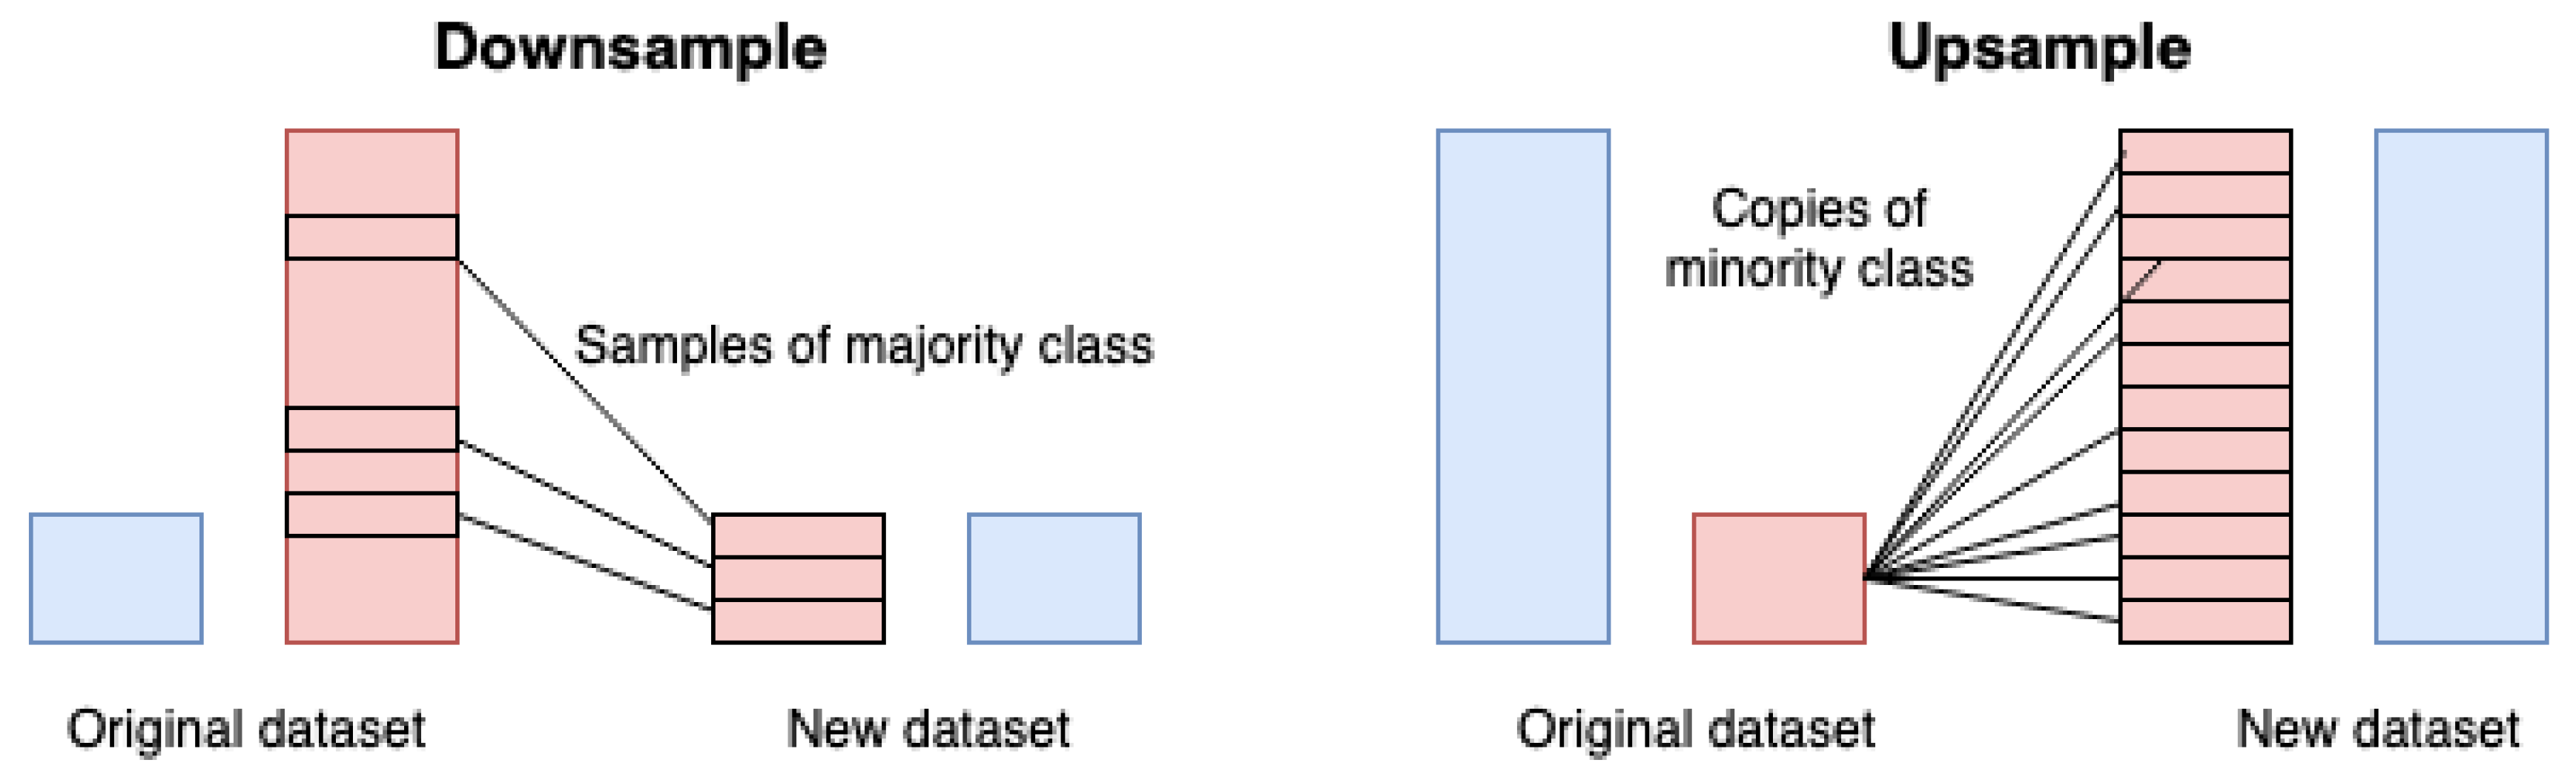
2.1. Balancing Data Techniques
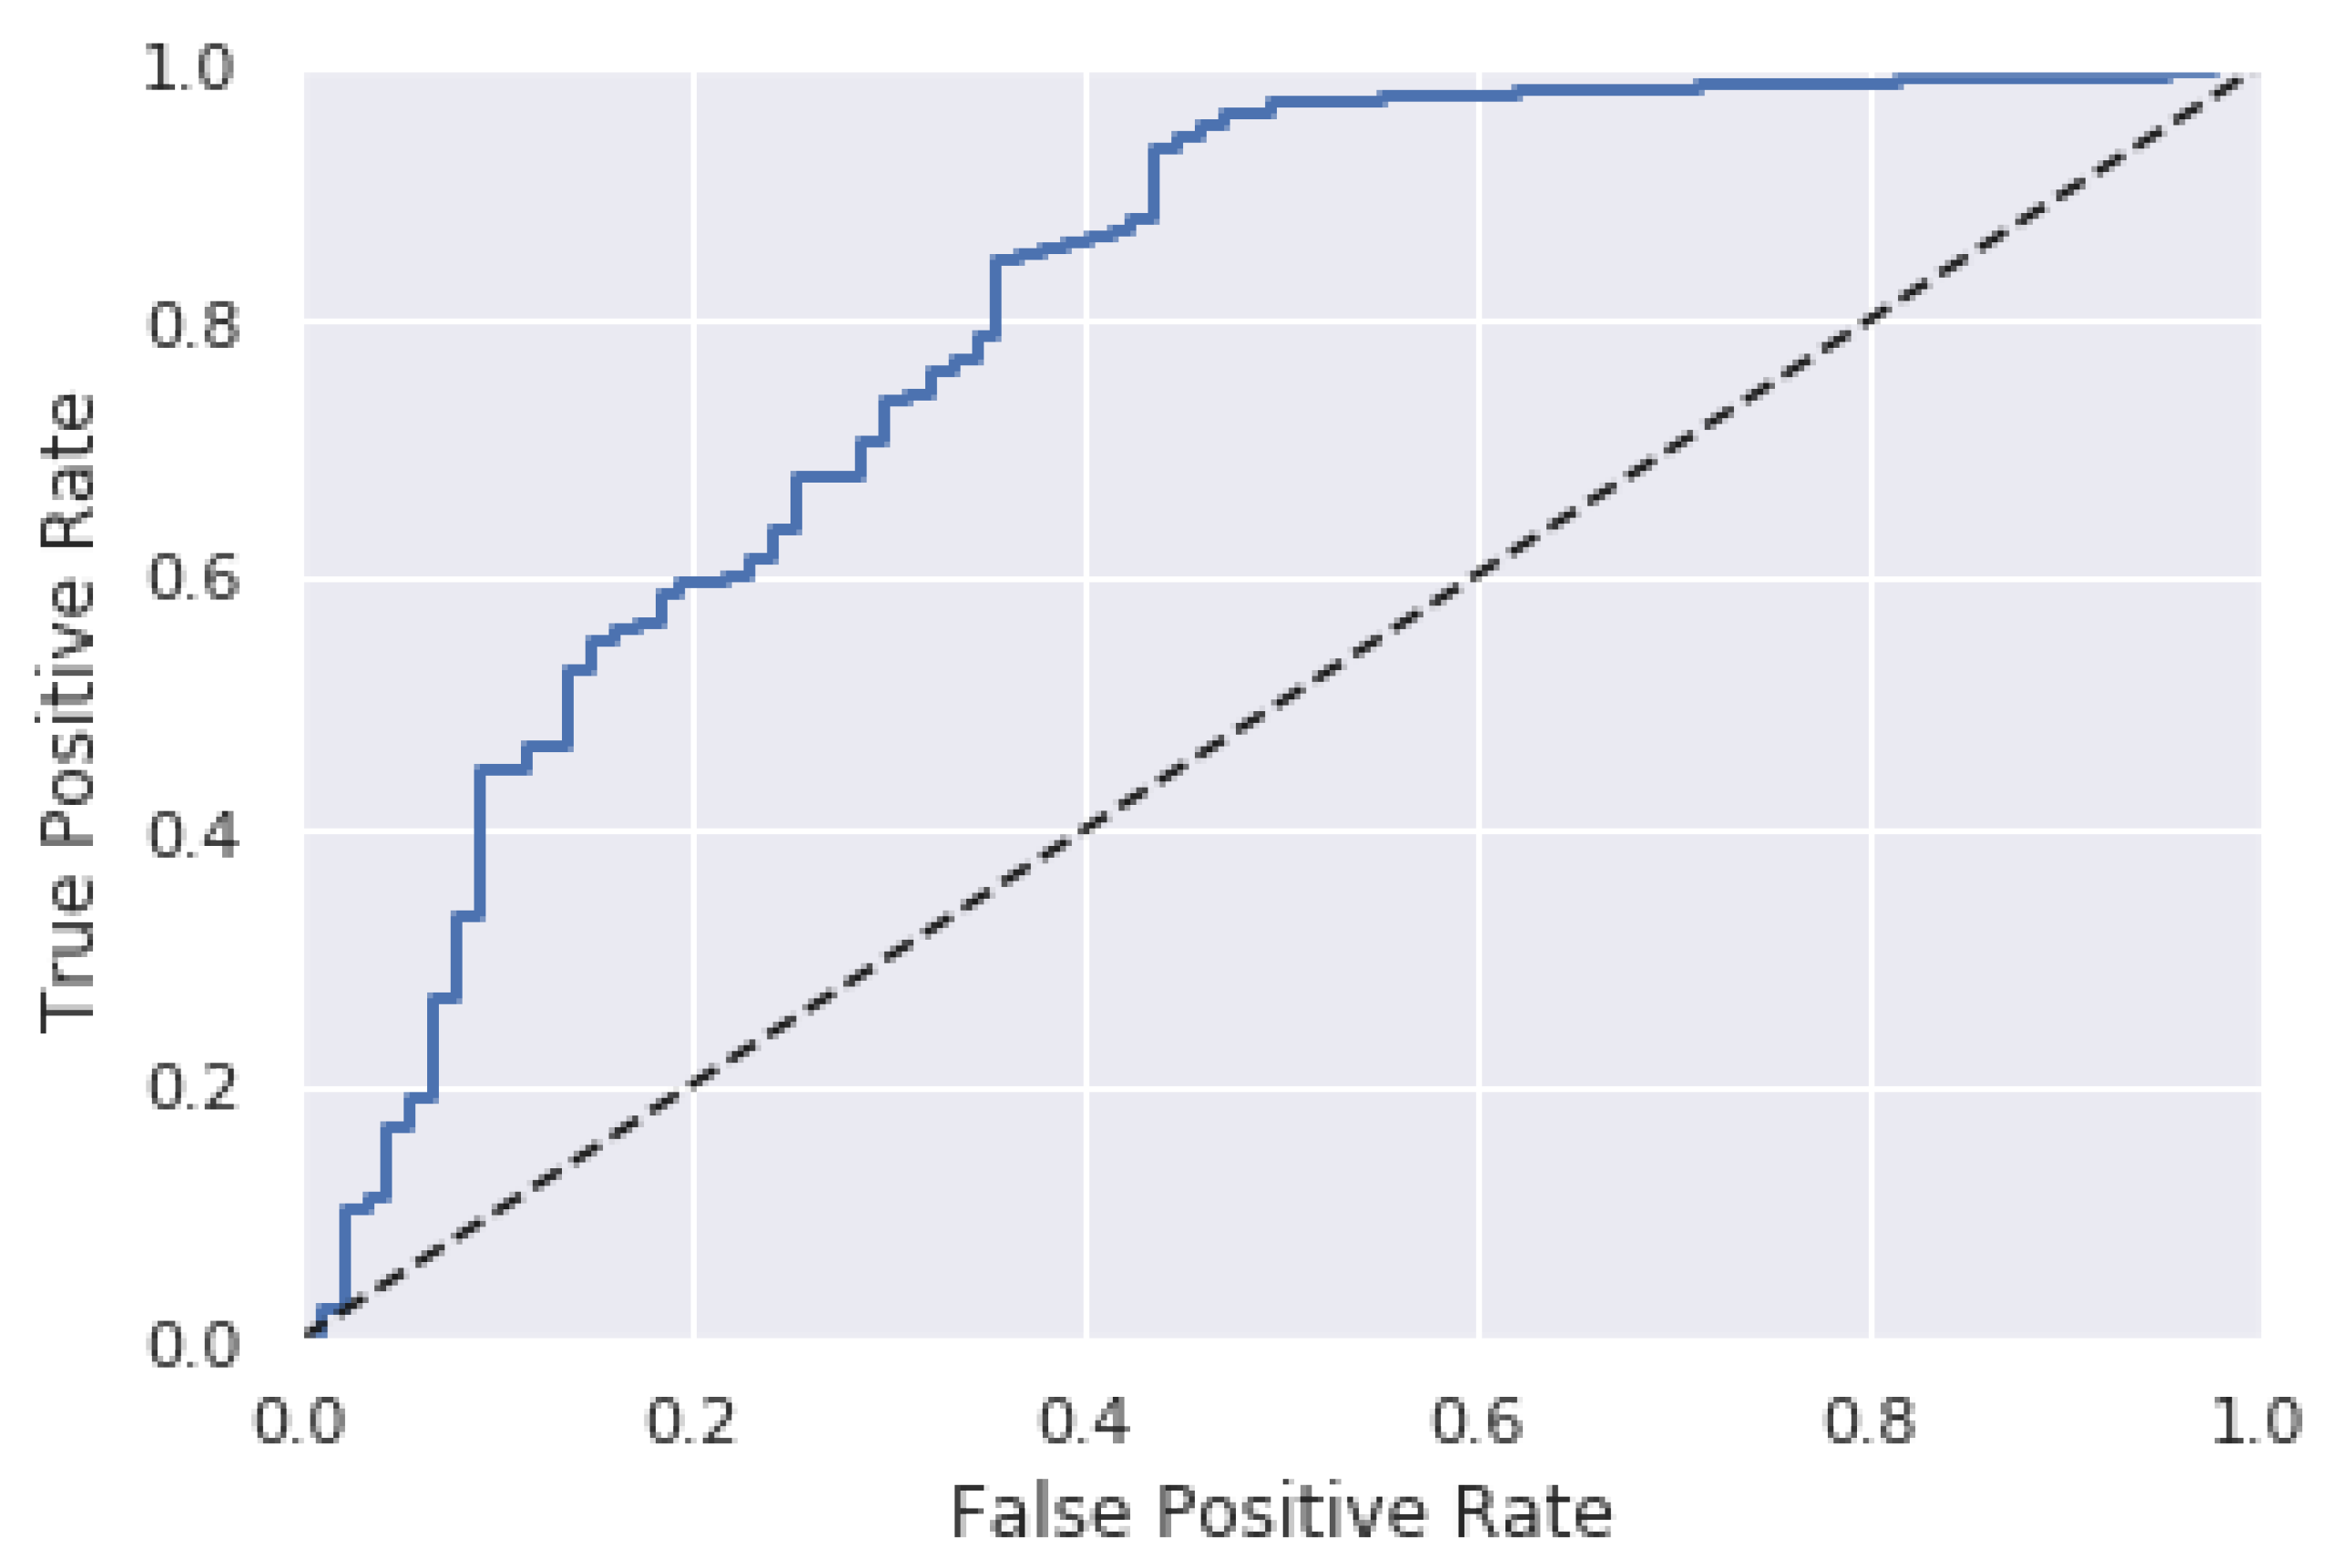
2.2. Metrics for Performance Evaluation
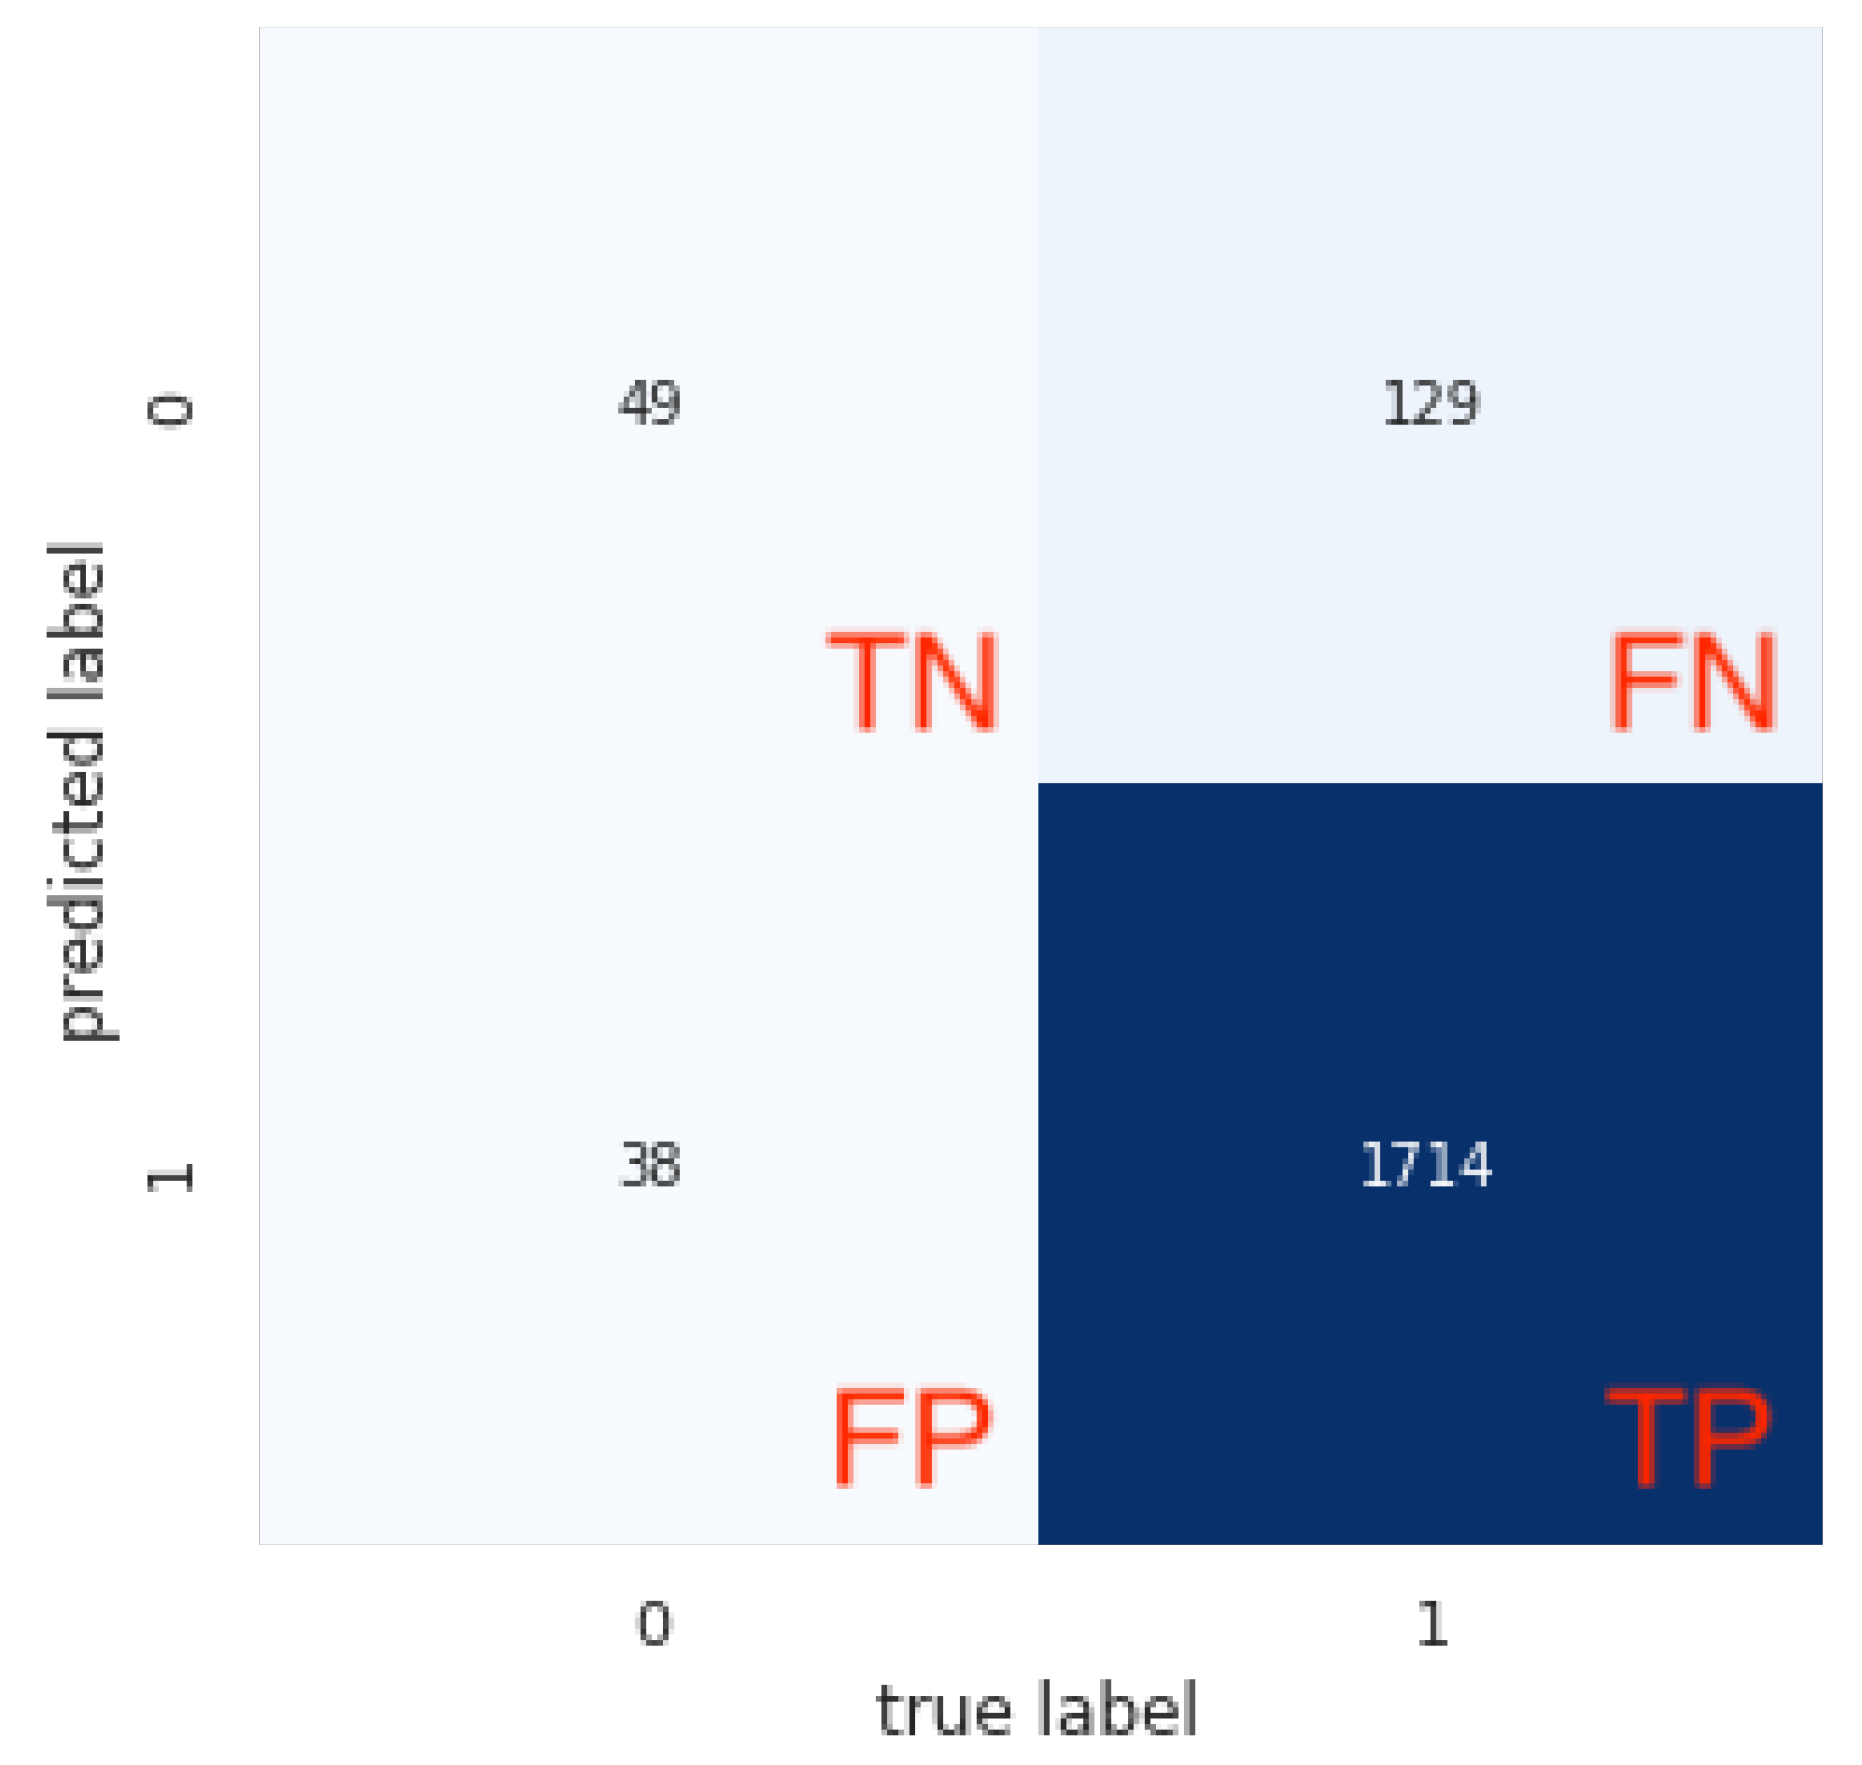
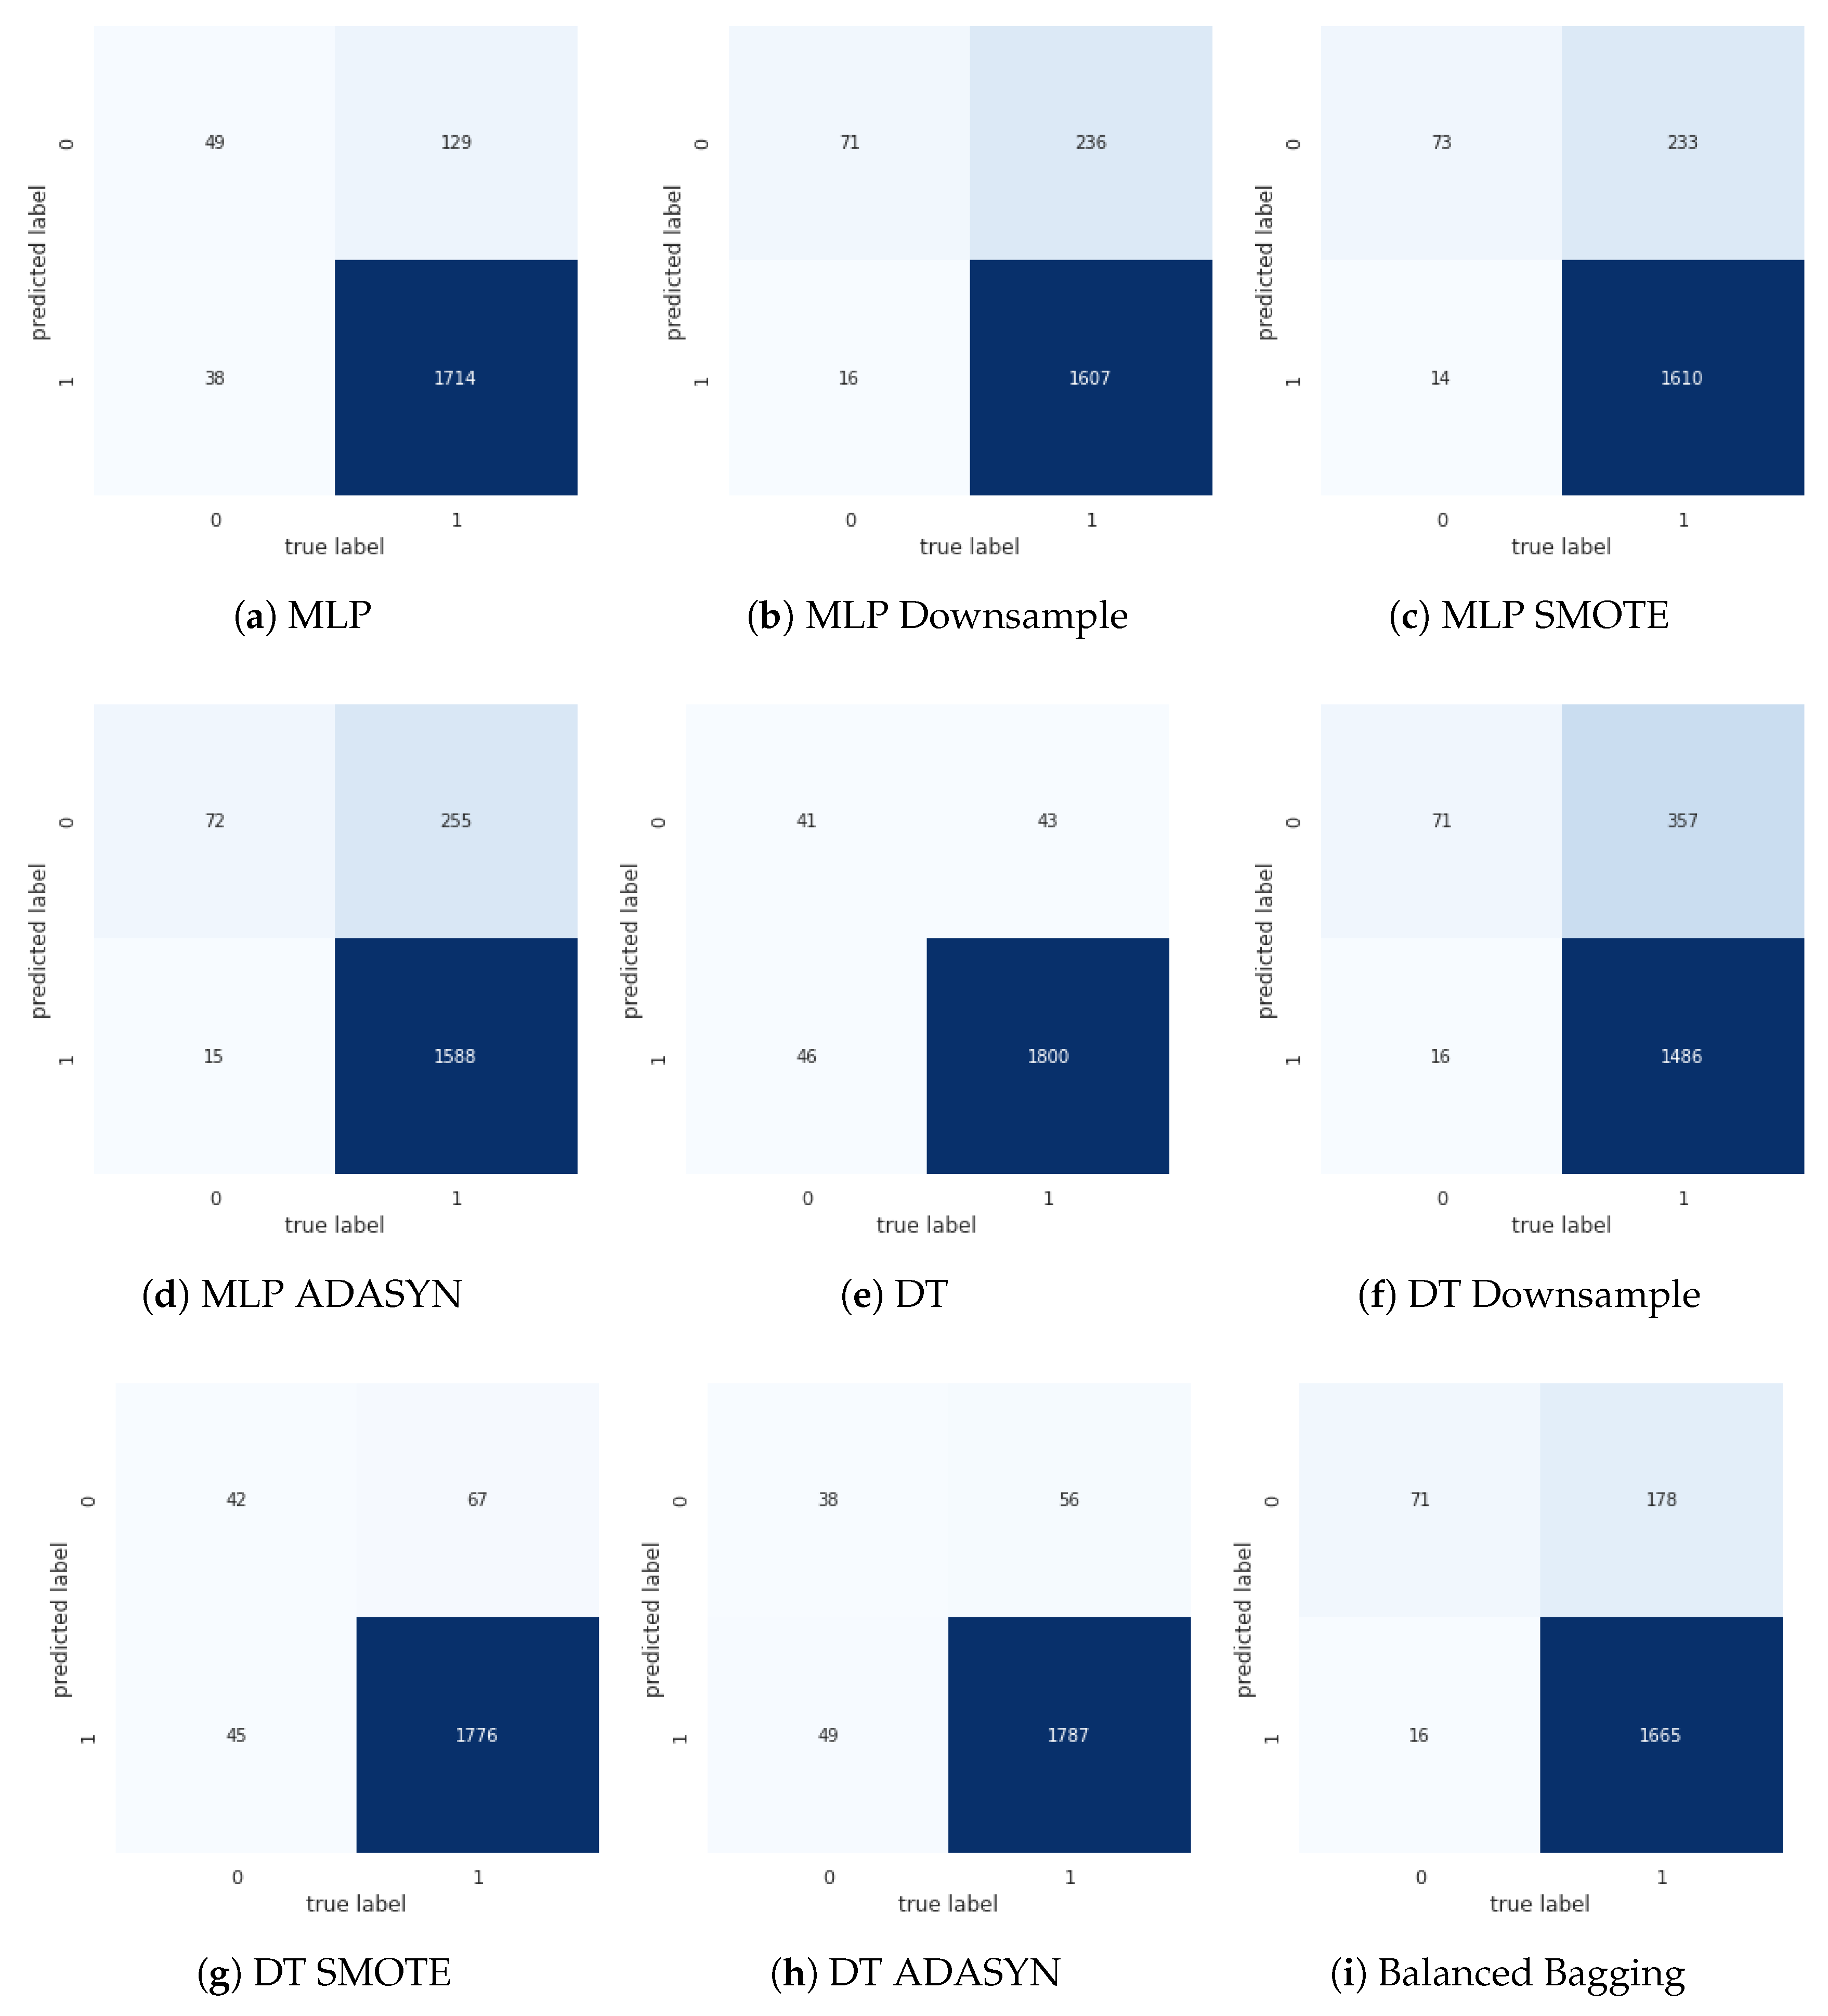
- True Negative (TN) is the number of correctly classified negative instances located in the 1st quadrant.
- False Negative (FN) is the number of positive instances incorrectly classified as negative located in the 2nd quadrant.
- False Positive (FP) is the number of negative instances classified incorrectly as positive located in the 3rd quadrant.
- True Positive (TP) is the number of positive instances correctly classified as positive located in the 4th quadrant.
3. Related Work
4. Methodology
- Balance Data: Downsample, SMOTE, ADASYN were used to generate balanced data and produce models that avoid the paradox of precision. The original training set was 5788, of which 262 minority class (dropout students) and 5526 majority class (persistent students) instances. After using the Downsampling, there was a reduction in the class of persistent students, and the new data set consisted of 524 equally distributed instances. Using the SMOTE balancing technique, the minority class set was incremented to a total of 5526 instances and the new dataset now has 11052 instances. For ADASYN the new set was 5537 for minority class and 5526 for majority class.
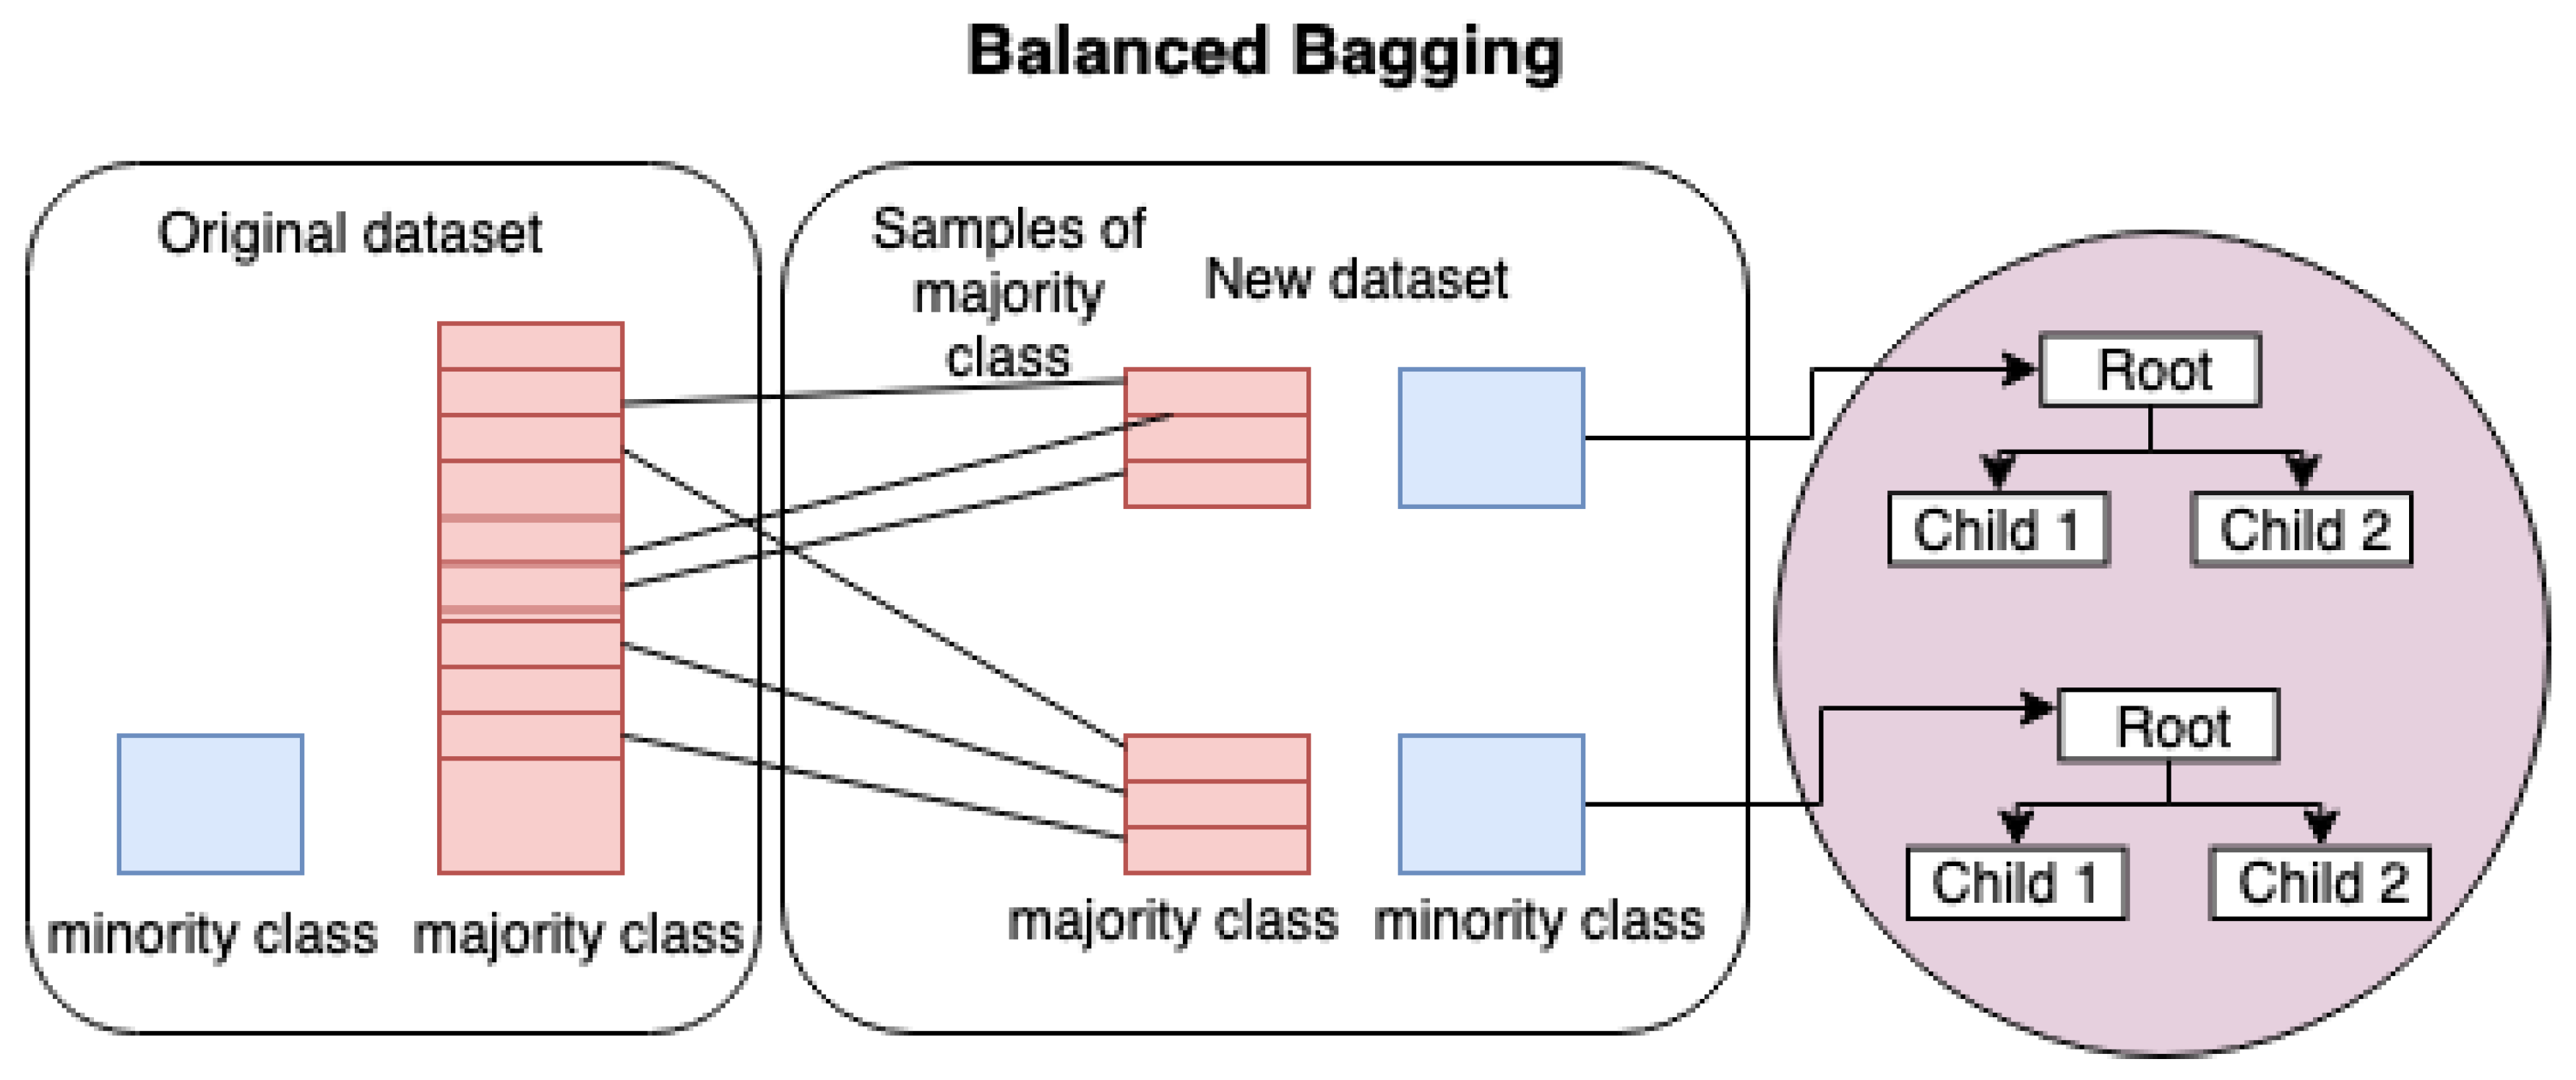
- Model / Tunning: on the balanced data are used machine learning techniques (DT, MLP, Balanced Bagging) to predict dropout. For tuning the parameters we used the exhaustive search over specified parameter values for each Model through the Gridsearch package [37]. For the DT we performed a search on the parameters: function that defines the node break (gini, entropy), the maximum tree depth (None, 3, 5), the minimum number of samples required for the leaf (None, 5, 10, 20). For the MLP the optimized parameters were: the optimization function (Limited-memory BFGS), maximum number of iterations (200), regularization term (0.1, 0.01, 0.001), number of neurons in the hidden layer (5, 8, 11, 14, 17), the seed used by the random number generator (0, 42), and rectified linear unit function like activation function. Finally, for Balanced Bagging the number of DT that makes up the ensemble (10, 30, 100, 200, 300)
- Metrics/Evaluation: with the trained models, evaluations should be performed using metrics: precision, recall, F1, UAR, AUC, G-mean and the confusion matrix.
5. Results and Discussion
6. Conclusions
Author Contributions
Funding
Conflicts of Interest
Notations
| EDM | Educational Data Mining |
| MLP | Multilayer Perceptron |
| DT | Decision Tree |
| SVM | Support Vector Machine |
| KNN | K-Nearest Neighbors |
| SMOTE | Synthetic Minority Over-sampling |
| ADASYN | Adaptive Synthetic Sampling |
| UAR | Unweighted Average Recall |
| ROC | Receiver Operating Characteristic |
| AUC | Area Under the Curve |
| ASR | Automatic Speech Recognition |
| IFRN | Federal Institute of Rio Grande do Norte |
| TN | True Negative |
| FN | False Negative |
| FP | False Positive |
| TP | True Positive |
References
- Romero, C.; Ventura, S. Educational Data Mining: A Review of the State of the Art. IEEE Trans. Syst. Man Cybern. Part C (Appl. Rev.) 2010, 40, 601–618. [Google Scholar] [CrossRef]
- Dahdouh, K.; Dakkak, A.; Oughdir, L.; Ibriz, A. Large-scale e-learning recommender system based on Spark and Hadoop. J. Big Data 2019, 6, 2. [Google Scholar] [CrossRef]
- Zhang, C.; Chen, H.; Phang, C.W. Role of Instructors Forum Interactions With Students in Promoting MOOC Continuance. J. Glob. Inf. Manag. 2018, 26, 105–120. [Google Scholar] [CrossRef]
- Lagus, J.; Longi, K.; Klami, A.; Hellas, A. Transfer-Learning Methods in Programming Course Outcome Prediction. ACM Trans. Comput. Educ. 2018, 18, 19:1–19:18. [Google Scholar] [CrossRef]
- Kassarnig, V.; Mones, E.; Bjerre-Nielsen, A.; Sapiezynski, P.; Dreyer Lassen, D.; Lehmann, S. Academic performance and behavioral patterns. EPJ Data Sci. 2018, 7, 10. [Google Scholar] [CrossRef]
- Truta, C.; Parv, L.; Topala, I. Academic Engagement and Intention to Drop Out: Levers for Sustainability in Higher Education. Sustainability 2018, 10, 4637. [Google Scholar] [CrossRef]
- Kim, D.; Kim, S. Sustainable Education: Analyzing the Determinants of University Student Dropout by Nonlinear Panel Data Models. Sustainability 2018, 10, 954. [Google Scholar] [CrossRef]
- Martín Núñez, J.L.; Tovar Caro, E.; Hilera González, J.R. From Higher Education to Open Education: Challenges in the Transformation of an Online Traditional Course. IEEE Trans. Educ. 2017, 60, 134–142. [Google Scholar] [CrossRef]
- Barros, R.P. Políticas Públicas para a Redução do Abandono e da Evasão Escolar de Jovens; Technical report; Fundação Brava, Insper, Instituto Unibanco e Instituto Ayrton Senna, 2017; Available online: http://gesta.org.br/wp-content/uploads/2017/09/Politicas-Publicas-para-reducao-do-abandono-e-evasao-escolar-de-jovens.pdf (accessed on 15 November 2019).
- Brasil Ministry of Education. MEC Libera 100% Do OrçAmento De Custeio Para Universidades E Institutos Federais; Brasil Ministry of Education: Brasilia, Brazil, 2018.
- Burgos, C.; Campanario, M.L.; de la Peña, D.; Lara, J.A.; Lizcano, D.; Martínez, M.A. Data mining for modeling students’ performance: A tutoring action plan to prevent academic dropout. Comput. Electr. Eng. 2018, 66, 541–556. [Google Scholar] [CrossRef]
- Nelson, K.J.; Quinn, C.; Marrington, A.; Clarke, J.A. Good practice for enhancing the engagement and success of commencing students. High. Educ. 2012, 83–96. [Google Scholar] [CrossRef]
- Jayaprakash, S.M.; Moody, E.W.; Lauría, E.J.; Regan, J.R.; Baron, J.D. Early Alert of Academically At-Risk Students: An Open Source Analytics Initiative. J. Learn. Anal. 2014, 6–47. [Google Scholar] [CrossRef]
- INEP. Inep Divulga Dados InéDitos Sobre Fluxo Escolar Na EducaçãO BáSica; INEP: Sao Paulo, Brazil, 2017.
- Gray, C.C.; Perkins, D. Utilizing early engagement and machine learning to predict student outcomes. Comput. Educ. 2019, 131, 22–32. [Google Scholar] [CrossRef]
- Blieck, Y.; Kauwenberghs, K.; Zhu, C.; Struyven, K.; Pynoo, B.; Depryck, K. Investigating the relationship between success factors and student participation in online and blended learning in adult education. J. Comput. Assist. Learn. 2019, 1, 15. [Google Scholar] [CrossRef]
- Jacobsen, D.Y. Dropping Out or Dropping In? A Connectivist Approach to Understanding Participants’ Strategies in an e-Learning MOOC Pilot. Technol. Knowl. Learn. 2019, 24, 1–21. [Google Scholar] [CrossRef]
- Zhu, X.; Davidson, I. Knowledge Discovery and Data Mining: Challenges and Realities; IGI Global: Hershey, PA, USA, 2007. [Google Scholar] [CrossRef]
- Shahiri, A.M.; Husain, W.; Rashid, N.A. A Review on Predicting Student’s Performance Using Data Mining Techniques. Procedia Comput. Sci. 2015, 72, 414–422. [Google Scholar] [CrossRef]
- Chen, C.; Liaw, A.; Breiman, L. Using Random Forest to Learn Imbalanced Data; Technical report; University of California: Berkeley, CA, USA, 2004. [Google Scholar]
- Breiman, L. Random Forests. Mach. Learn. 2001, 45, 5–32. [Google Scholar] [CrossRef]
- Lemaître, G.; Nogueira, F.; Aridas, C.K. Imbalanced-learn: A Python Toolbox to Tackle the Curse of Imbalanced Datasets in Machine Learning. J. Mach. Learn. Res. 2017, 18, 1–5. [Google Scholar]
- He, H.; Garcia, E.A. Learning from Imbalanced Data. IEEE Trans. Knowl. Data Eng. 2009, 21, 1263–1284. [Google Scholar] [CrossRef]
- He, H.; Bai, Y.; Garcia, E.A.; Li, S. ADASYN: Adaptive synthetic sampling approach for imbalanced learning. In Proceedings of the 2008 IEEE International Joint Conference on Neural Networks (IEEE World Congress on Computational Intelligence), Hong Kong, China, 1–8 June 2008; pp. 1322–1328. [Google Scholar] [CrossRef]
- Kubat, M.; Matwin, S. Addressing the Curse of Imbalanced Training Sets: One-Sided Selection. In Proceedings of the Fourteenth International Conference on Machine Learning, Burlington, MA, USA, 8–12 July 1997; pp. 179–186. [Google Scholar]
- Schuller, B.W.; Steidl, S.; Batliner, A. The INTERSPEECH 2009 emotion challenge. In Proceedings of the 10th Annual Conference of the International Speech Communication Association, Brighton, UK, 6–10 September 2009. [Google Scholar]
- Kaya, H.; Karpov, A.A. Efficient and effective strategies for cross-corpus acoustic emotion recognition. Neurocomputing 2018, 275, 1028–1034. [Google Scholar] [CrossRef]
- He, H.; Ma, Y. Imbalanced Learning: Foundations, Algorithms, and Applications; Wile: Hoboken, NJ, USA, 2013. [Google Scholar]
- Drummond, C. C4.5, Class Imbalance, and Cost Sensitivity: Why Under-Sampling beats OverSampling. In Proceedings of the Twentieth International Conference on Machine Learning (ICML-2003), Washington, DC, USA, 21–24 August 2003. [Google Scholar]
- Dittman, D.J.; Khoshgoftaar, T.M.; Wald, R.; Napolitano, A. Comparison of Data Sampling Approaches for Imbalanced Bioinformatics Data. In Proceedings of the Twenty-Seventh International Florida Artificial Intelligence Research Society Conference, Pensacola Beach, FL, USA, 21–23 May 2014. [Google Scholar]
- Liu, X.Y.; Wu, J.; Zhou, Z.H. Exploratory under-sampling for class-imbalance learning. In Proceedings of the Sixth International Conference on Data Mining, Hong Kong, China, 18–22 December 2006; pp. 965–969. [Google Scholar]
- Witten, I.H.; Frank, E.; Hall, M.A.; Pal, C.J. Data Mining Practical Machine Learning Tools and Techniques; Elsevier: Amsterdam, The Netherlands, 2016; p. 654. [Google Scholar]
- Rieger, S.A.; Muraleedharan, R.; Ramachandran, R.P. Speech based emotion recognition using spectral feature extraction and an ensemble of kNN classifiers. In Proceedings of the 9th International Symposium on Chinese Spoken Language Processing, Singapore, 12–14 September 2014; pp. 589–593. [Google Scholar] [CrossRef]
- Grósz, T.; Gosztolya, G.; Tóth, L. Training Context-Dependent DNN Acoustic Models Using Probabilistic Sampling. In Proceedings of the 8th Annual Conference of the International Speech Communication Association, Stockholm, Sweden, 20–24 August 2017; pp. 1621–1625. [Google Scholar] [CrossRef]
- Lawrence, S.; Burns, I.; Back, A.; Tsoi, A.C.; Giles, C.L. Neural Network Classification and Prior Class Probabilities. In Neural Networks: Tricks of the Trade, 2nd ed.; Montavon, G., Orr, G.B., Müller, K.R., Eds.; Springer: Berlin/Heidelberg, Germany, 2012; pp. 295–309. [Google Scholar] [CrossRef]
- Ting, K.M. Confusion Matrix. In Encyclopedia of Machine Learning and Data Mining; Springer: Boston, MA, USA, 2017; p. 260. [Google Scholar] [CrossRef]
- Pedregosa, F.; Varoquaux, G.; Gramfort, A.; Michel, V.; Thirion, B.; Grisel, O.; Blondel, M.; Prettenhofer, P.; Weiss, R.; Dubourg, V.; et al. Scikit-learn: Machine Learning in Python. J. Mach. Learn. Res. 2011, 12, 2825–2830. [Google Scholar]
- Swets, J.A. Measuring the accuracy of diagnostic systems. Science 1988, 240, 1285–1293. [Google Scholar] [CrossRef] [PubMed]
- Bradley, A.P. The use of the area under the ROC curve in the evaluation of machine learning algorithms. Pattern Recognit. 1997, 30, 1145–1159. [Google Scholar] [CrossRef]
- Haykin, S. Redes Neurais, 2nd ed.; Bookman Companhia ED: Porto Alegre, Brazil, 2001. [Google Scholar]
- Hornik, K.; Stinchcombe, M.; White, H. Multilayer feedforward networks are universal approximators. Neural Netw. 1989, 2, 359–366. [Google Scholar] [CrossRef]
- Lykourentzou, I.; Giannoukos, I.; Nikolopoulos, V.; Mpardis, G.; Loumos, V. Dropout prediction in e-learning courses through the combination of machine learning techniques. Comput. Educ. 2009, 53, 950–965. [Google Scholar] [CrossRef]
- Asif, R.; Merceron, A.; Ali, S.A.; Haider, N.G. Analyzing undergraduate students’ performance using educational data mining. Comput. Educ. 2017, 113, 177–194. [Google Scholar] [CrossRef]
- Barros, T.M. Modelo IFRN Integrado. 2019. Available online: https://github.com/tmedeirosb/modelo_ifrn_integrado/blob/master/PAPER_MDPI_REVIEW.ipynb (accessed on 15 November 2019).
- Hollander, M.; Wolfe, D.A.; Hollander, M. Nonparametric Statistical Methods; Wiley: New York, NY, USA, 2013. [Google Scholar]


| Metric | Formula |
|---|---|
| Precision | |
| Recall | |
| UAR | |
| F1 | |
| AUC | |
| G-mean |
| Metrics | Formula |
|---|---|
| Precision | 0.978 |
| Recall | 0.930 |
| UAR | 0.746 |
| F1 | 0.953 |
| AUC | 0.798 |
| G-mean | 0.723 |
| Reference | Prediction Techniques | Input Parameters | Evaluation Metric |
|---|---|---|---|
| [19] | Decision tree, Artificial Neural Networks, Naive Bayes, K-Nearest Neighbor and Support Vector Machine | Academic performance, demographic data, extra-curricular activities, high school background and social interaction network | Accuracy |
| [11] | Logistic Regression | academic performance | accuracy, confusion matrices |
| [42] | Combination of MLP techniques, support vector machines and probabilistic ensemble simplified fuzzy ARTMAP through Decision tree | Demographic data, prior academic performance, academic performance | Accuracy, sensitivity and precision |
| [43] | Decision tree, hierarchical clustering | Academic performance | Accuracy/Kappa, Confusion matrices |
| [15] | Decision Tree | Engagement, student’s program, the school, and the year of study | True Positive, False Positive, Precision, Area under ROC Curve |
| This paper | MLP, Decision Tree with Downsample, SMOTE, ADASYN and Balanced Bagging | Demographic data, academic performance | Confusion Matrices, Precision, Recall, AUC, G-mean, F1, UAR |
| Variable | Description |
|---|---|
| LnguaPortuguesae LiteraturaI90H | Grade in portuguese |
| LnguaPortuguesae LiteraturaI90H Dependencia | Number of dependencies in Portuguese |
| LnguaPortuguesae LiteraturaI90Hfreq | Percentage of attendance in Portuguese |
| MatemticaI120H | Grade in Math |
| MatemticaI120H_ dependencia | Number of dependencies in Math |
| MatemticaI120H_freq | Percentage of attendance in Math |
| aluno_exclusivo_ rede_publica | student only attended in public school |
| descricao_area_residencial | Student Residential Area: Urban, Rural, Indigenous, Quilombola, Uninformed |
| descricao_companhia_ domiciliar | Home Company: Spouse, Mother, Father, Parents, Other, Uninformed, Relative (s) or Friend (s), Alone |
| descricao_estado_civil | Description of student’s marital status: married, divorced, undeclared, single, stable union |
| course | Course name |
| descricao_imovel | What is the financial situation of the property in which the student lives: rented, assigned or loaned, financed, not informed, other, pension or accommodation, own |
| descricao_mae_ escolaridade | Schooling of the student’s mother: literate, complete elementary school, incomplete elementary school, complete high school, incomplete high school, complete high school, incomplete higher school, do not know, did not study, complete postgraduate, incomplete postgraduate |
| descricao_pai_ escolaridade | Schooling of the student’s father |
| descricao_raca | Student’s self-declared race: yellow, white, indigenous, undeclared, brown, black |
| descricao_responsavel_ escolaridade | Schooling of student’s legal guardian |
| descricao_responsavel_ financeiro | Who is the student’s financial officer: grandfather, spouse, brother, mother, the student himself, others, father, relatives, uncle |
| descricao_trabalho | Student’s job description: retired, self-employed, INSS beneficiary or pensioner, private company, internship or scholarship, never worked, not working, not informed, fisherman, public service, employed, rural worker / farmer |
| pessoa_fisica_sexo | Student’s gender: M, F |
| possui_necessidade_ especial | True for students with special needs |
| qtd_pessoas_domicilio | Number of people living with student |
| Sigla | What is the student Campus |
| qnt_pc | Sum of computers, notebooks and netbooks |
| qnt_salarios | Gross family income |
| tempo_entre_conclusao_ ingresso | Time between completion of elementary school and entry into IFRN |
| Name | Precision | Recall | F1 | UAR | AUC | G-Mean |
|---|---|---|---|---|---|---|
| DecisionTree | 0.975 | 0.977 | 0.976 | 0.724 | 0.737 | 0.678 |
| MLP | 0.978 | 0.930 | 0.954 | 0.747 | 0.798 | 0.724 |
| DT Undersample | 0.989 | 0.806 | 0.888 | 0.811 | 0.736 | 0.811 |
| MLP Undersample | 0.990 | 0.872 | 0.927 | 0.844 | 0.798 | 0.844 |
| DT SMOTE | 0.975 | 0.964 | 0.969 | 0.723 | 0.731 | 0.682 |
| MLP SMOTE | 0.991 | 0.874 | 0.929 | 0.856 | 0.798 | 0.856 |
| DT ADASYN | 0.973 | 0.970 | 0.971 | 0.703 | 0.743 | 0.651 |
| MLP ADASYN | 0.991 | 0.862 | 0.922 | 0.845 | 0.798 | 0.844 |
| Balanced Bagging | 0.990 | 0.903 | 0.945 | 0.860 | 0.929 | 0.859 |
© 2019 by the authors. Licensee MDPI, Basel, Switzerland. This article is an open access article distributed under the terms and conditions of the Creative Commons Attribution (CC BY) license (http://creativecommons.org/licenses/by/4.0/).
Share and Cite
Barros, T.M.; Souza Neto, P.A.; Silva, I.; Guedes, L.A. Predictive Models for Imbalanced Data: A School Dropout Perspective. Educ. Sci. 2019, 9, 275. https://doi.org/10.3390/educsci9040275
Barros TM, Souza Neto PA, Silva I, Guedes LA. Predictive Models for Imbalanced Data: A School Dropout Perspective. Education Sciences. 2019; 9(4):275. https://doi.org/10.3390/educsci9040275
Chicago/Turabian StyleBarros, Thiago M., Plácido A. Souza Neto, Ivanovitch Silva, and Luiz Affonso Guedes. 2019. "Predictive Models for Imbalanced Data: A School Dropout Perspective" Education Sciences 9, no. 4: 275. https://doi.org/10.3390/educsci9040275
APA StyleBarros, T. M., Souza Neto, P. A., Silva, I., & Guedes, L. A. (2019). Predictive Models for Imbalanced Data: A School Dropout Perspective. Education Sciences, 9(4), 275. https://doi.org/10.3390/educsci9040275