Abstract
The two studies reported on in this paper examine the features of words that distinguish students’ performances on vocabulary assessments as a means of understanding what contributes to the ease or difficulty of vocabulary knowledge. The two studies differ in the type of assessment, the types of words that were studied, and the grade levels and population considered. In the first study, an assessment of words that can be expected to appear with at least moderate frequency at particular levels of text was administered to students in grades 2 through 12. The second study considered the responses of fourth- and fifth-grade students, including English learners, to words that teachers had identified as challenging for those grade levels. The effects of the same set of word features on students’ vocabulary knowledge were examined in both studies: predicted appearances of a word and its immediate morphological family members, number of letters and syllables, dispersion across content areas, polysemy, part of speech, age of acquisition, and concreteness. The data consisted of the proportion of students who answered an item correctly. In the first study, frequency of a word’s appearance in written English and age of acquisition predicted students’ performances. In the second study, age of acquisition was again critical but so too were word length, number of syllables, and concreteness. Word location (which was confounded by word frequency) also proved to be a predictor of performance. Findings are discussed in relation to how they can inform curriculum, instruction, and research.
1. An Analysis of the Features of Words That Influence Vocabulary Difficulty
Vocabulary has long been recognized as a strong predictor of comprehension [1]. Furthermore, without strong vocabulary instruction, student performance tied to socioeconomic status is perpetuated [2]. Yet the words chosen for vocabulary instruction in school are not necessarily ones that ameliorate this gap. Historically, the criteria for choosing words for instruction have been ill defined. Gates [3] established that second-graders knew over 80% of target words prior to instruction. Almost 30 years later, Stallman et al. [4] found that the pattern reported by Gates for second-graders also applied to fifth-graders. In the Stallman et al. study, overall mean scores for both second- and fifth-grade cohorts were above 75% for grade-level words and over 70% for the “new” words that had not yet been presented.
Both the Gates [3] and Stallman et al. [4] analyses are dated but a comparison of the target words chosen for vocabulary instruction in the 1965 and 2013 copyrights of a core reading program [5] showed that the focus words for the two points in time were similar in frequency of appearance in written language, age of acquisition, and utility in different content areas. The words differed on two features—length and concreteness. In both cases, the focus words in the 2013 program were shorter and more concrete, features that have been shown to make words easier for students to learn. These patterns suggest that core reading programs—and perhaps elementary vocabulary instruction in general—lack an underlying framework for word selection.
To identify the most salient words for instruction, information is needed on students’ existing vocabulary knowledge. What features distinguish words that students know from those that they do not? Do the features of known and unknown words vary over students’ developmental trajectory? A relatively new and potentially critical source for gaining insight into which words are known or unknown by students lies in databases that have become available as a result of digitized vocabulary assessments. Digitization of texts has also resulted in a flourishing of knowledge about vocabulary from corpora linguistics [6]. This work has resulted in new knowledge about language use [7] and in numerous analytic tools [8]. Little of this work has been applied to the study of school vocabulary assessments or vocabulary instruction.
In this paper, we present two separate studies that explore a common set of word features, identified through previous research, as factors that may contribute to students’ vocabulary performance. The purpose of this research is to contribute to the conversation about the selection of words that merit instructional focus. The first study looks at students’ knowledge of words that are predicted to appear in texts at different grade levels. The second study uses the same methodology and examines the same features, but the target words are those identified by teachers as challenging for students at a specific grade band—fourth and fifth grades—rather than the span of grades 2 through 12 in the first study. Furthermore, the second study includes a large number of students who were classified as English language learners, a group that is overrepresented among the students who score at basic levels and below on the National Assessment of Educational Progress (NAEP) [9].
2. Review of Research
What it means to know a word is complex [10], and there is no consensus about how to measure the complexity of word knowledge [11,12,13]. However, there does appear to be consensus that vocabulary knowledge is multi-dimensional and that various features of words can potentially influence students’ knowledge of vocabulary. In considering multiple features of words that merit instruction, we use the theoretical framework of Nagy and Hiebert [14] to identify features that may contribute to the ease or difficulty of knowing the meanings of words. Their framework addresses the role of words in four dimensions of language and instruction: language, the lexicon, knowledge, and the lesson (see Table 1). The description that follows describes three of these four dimensions. The final cluster in the Nagy and Hiebert’s word-selection framework addresses the centrality of words in particular texts and in existing curricula. The goal of the present study is to provide evidence based on student performances to guide curriculum development. Consequently, this fourth cluster is not a basis for the selection of descriptive word factors.

Table 1.
Factors That Are Predicted to Influence Word Learning.
2.1. Role in Language
Some words are ubiquitous in written language, especially those that connect ideas in discourse (e.g., of, and, or) but most words carry nuanced or specialized meanings and appear infrequently in English texts (e.g., scurry, lurch). Moreover, some words appear in texts across a wide array of topics and content areas (e.g., sharp, flat), while other words are specific to a particular domain (e.g., concerto, metronome). Nagy and Hiebert [14] referred to these two dimensions of the role that words play in written language as frequency and domain specificity.
Frequency. It is to be expected that students who read more texts are exposed to the words that appear with moderate to high frequency in written language to a greater degree than students who read less text. This effect of exposure means that frequency of words influences virtually all word recognition tasks [15]. Frequency counts are compiled by computers based on the number of occurrences of the word in a corpus. They are given for a particular orthographic form of the word (e.g., sleep, sleeps, and sleepless all have different frequency counts). As the section on Morphological Relatedness (below) explains, evidence indicates that the frequency of the inflectional and derivational relatives of a word also influence the speed of word recognition [16].
The role of word frequency in students’ knowledge of words is not as clear-cut as its role in word recognition. Both frequency and morphological family frequency counts fail to distinguish among multiple meanings of words or polysemy [17]. Even among words with the same etymological history, differences in meanings can be substantial (e.g., milk as a liquid and milk as taking advantage of someone). The second meaning of the word may occur less frequently than the first meaning but, even so, uses of the word in the second meaning contribute to the overall frequency count.
Cervetti, Hiebert, Pearson, and McClung [18] found that polysemy was a significant factor in the vocabulary knowledge of second and third-graders, both independent of and as a result of instruction. Sullivan [19] found that acquiring a secondary sense of a word accounts for a significant amount of growth in vocabulary knowledge between Grade 3 and Grade 12. Often, as the illustration of meanings associated with the word milk suggests, secondary word senses are associated with changes in parts of speech. The degree to which the different meanings of words are associated with variations in parts of speech can add a degree of challenge for readers, especially beginning and struggling students [20].
Domain specificity. Domain specificity refers to the degree to which words appear in texts on different topics and in different subject areas. One measure of domain specificity comes from a measure that Carroll, Davies, and Richman [21] identified as dispersion. Words that appear across all subject areas receive a dispersion index of 1 (e.g., a, that, with), while words that appear in esoteric or specialized topics receive a dispersion index of <0.01 (e.g., copperplate, rotogravure, platen). Measures of dispersion can be connected to polysemy, as words often take specific secondary meanings within disciplines. For instance, the words force and energy have specific secondary meanings in physics. Cervetti et al. [18] found no significant effect for dispersion in their study of second- through fourth-graders’ knowledge of science vocabulary, in contrast to Dockerall et al. [22] who found such an effect with 5- and 6-year-olds. Additional consideration of dispersion and domain specificity seems warranted.
2.2. Role in the Lexicon
Factors related to the lexicon refer to the relationship among the meanings of words. Two types of relationships are especially relevant in understanding a word’s connections to the meanings of other words within the lexicon: semantic and morphological.
Semantic relatedness. Knowledge of a word’s meaning is not isolated to simply one word. Rather, a word’s meaning is embedded in networks of relationships to the meanings of other words. Researchers have explored various ways to group words into semantic networks. Marzano and Marzano [23], for example, applied a hierarchical semantic scheme establishing superclusters (e.g., feelings and emotions), clusters containing words with semantic ties close to the concepts (e.g., fear: fright, startle, afraid), and mini-clusters where words have synonymous meanings (e.g., startle: scare, frighten, terrify). Research indicates that semantic networks may influence word learning, although the complexity of the concept depicted by the word is an important consideration when conceptualizing semantic relatedness as a factor [24,25]. In addition, there is contradictory evidence regarding whether teaching semantically related words interferes with or enhances word learning [26,27].
Morphological relatedness. English is a morphophonemic language [28], which means that the sounds and spellings of words are influenced by the morphemes or meaning units of English. For example, at the expense of grapheme-phoneme-correspondences, the spelling of health conveys the link to its morphological family (i.e., the root word heal and other family members such as healing, healed, healthy, healthful, unhealthy), making it more likely that students will consider these words as a family rather than as separate lexical units when encountering them in a text. In identifying 88,500 as the number of word families in written English that students are likely to encounter over their school careers, Nagy and Anderson [29] estimated that there are, on average, one to three additional related words for every word that students encounter after the initial stages of reading acquisition.
Aspects of the morphological structure of words also contribute to the challenge of word learning. The speed of accessing a word’s meaning is affected by the morphological structure, including the transparency and frequency of the root word, inflected endings, and derivations [30].
2.3. Role in Students’ Existing Knowledge
Students’ existing vocabularies and background knowledge can also influence how well and how quickly they remember or learn words. Nagy and Hiebert [14] identified two aspects of students’ knowledge that influence the challenge of reading and learning words: (a) their familiarity with the words and concepts and (b) the conceptual complexity that the words represent.
Familiarity. Familiarity refers to students’ prior experience with and exposure to words and their associated concepts. Familiarity and frequency are related, but some words that appear with similar frequency in written texts can differ substantially in familiarity. For example, the words silly, slide, and resistance all have U function values of 25 [31], indicating that they appear with similar frequency in English texts, but elementary students’ familiarity with these words is likely to vary considerably.
Typical analyses of familiarity involve adults [32] and older school-aged children [33]. Because no large-scale database exists of children’s ratings of words, a more useful index of schoolchildren’s familiarity with words appears to be age of acquisition (AoA) data, an indicator of the age at which a word is typically understood or used in oral language [8]. The age at which words are acquired in oral language appears to affect word recognition performance beyond correlated variables such as word frequency [34].
Familiarity in reading also requires students to be able to associate a word’s meaning with the graphic form of the word. This act, in common parlance, is what it means to “read a word.” Length, as measured in number of syllables or letters, has been shown to be a reliable predictor of word recognition [35] and of recognition of word meaning [36].
Conceptual complexity. Conceptual complexity has often been established by identifying empirically how many students at a given age are able to identify a word’s meaning correctly [37,38]. Even though related, conceptual challenge and AoA are likely different characteristics. Efforts such as Latent Semantic Analysis [39], HAL [40], and WordNet [41] attempt to identify numbers and kinds of links between ideas, but, as yet, data are not available that establishes the relative difficulty of large numbers of specific concepts for school-age students at different developmental levels.
The one aspect of the operationalization of conceptual complexity that can be established with relative ease is concreteness. The concreteness of a word refers to how readily readers can summon a mental image of the concept. Researchers have shown that concreteness (or conversely, abstractness) and imageability [42] influence variables such as speed of lexical processing [43] and vocabulary knowledge [44]. Consequently, this construct has been prominent in models of conceptual development and cognitive processing [45].
Taken together, the three categories identified by Nagy and Hiebert [14]—the role of words in language, their role in the lexicon, and aspects that represent students’ existing knowledge—provide a theoretically and empirically grounded framework for identifying words that are known or unknown by students at particular points in development. We examined how most features identified by Nagy and Hiebert—word length, number of syllables, parts of speech, frequency, morphological family frequency, dispersion, polysemy, AoA and concreteness—predict students’ vocabulary knowledge. The construct of conceptual complexity was restricted to concreteness. Furthermore, a measure of semantic relatedness was not included. At the present time, measures of conceptual complexity (other than concreteness) and semantic relatedness have yet to be validated and are open to interpretation.
The two studies reported on in this paper examine how well the identified variables predict students’ knowledge of words on two assessments that differ in substantial ways including population, basis for selection of target words, and task. The types of words in the two studies differ but the underlying goal of both studies is directed at answering the same question: What factors predict the ease or difficulty of students’ understanding of word meaning in text? Answers to this question are critical if school time is to be directed at strengthening students’ vocabularies. Relatively large databases of students’ performances on vocabulary assessments, we believe, offer the opportunity to gain evidence to address this question.
3. Study One: Words on an Assessment of Core Vocabulary
In typical vocabulary assessments, words are not chosen to represent the lexicon in any systematic way. Rather words are selected based on psychometric analyses. Words known by most students are eliminated, leaving words where performances vary. Such assessments give an indication of individuals’ standing in relation to a norm group, but they provide little understanding of what types of words are known by students at different points in their development as readers. The perspective of the vocabulary assessment in this study takes a different direction. It aims to establish how students do with the words that form a core vocabulary. We use the term core vocabulary to refer to words that account for a substantial percentage of the words in texts.
The topic of which words occur frequently in texts has had a long history of study. In the first book of words for teachers, Thorndike [46] organized words in frequency bands (10 for the first 10,000 words), based on an analysis of approximately 4.75 million words that came from 41 sources (primarily the Bible and English classics but also some schoolbooks and children’s trade books). The initial version was followed by two additional summaries: the 20,000 most frequent words [47] and 30,000 most frequent words [48]. Gray [49] and Gates [50] used the lists for designating words in basal reading programs. Thorndike’s word frequency analyses were apparent in assessments such as the Gray Oral Reading Test and the Gates–MacGinitie Reading Tests [51]. However, the analyses of word frequency do not appear to have been the basis for vocabulary assessments in any systematic fashion.
Thorndike [46] did not describe the distribution of groups of words in text but, shortly thereafter, Zipf [52] hypothesized that the frequency of any word is inversely proportional to its rank in a frequency list. Thus, the most frequent word, the, accounts for roughly 7% of all words and the next most frequent word, of, accounts for approximately 3.5%. Zipf predicted that 135 words would account for half of the words in a large sample.
The verification of what came to be called Zipf’s [52] law in large vocabulary corpora occurred with the advent of computers. Kučera and Francis’s [53] analysis was the first to take advantage of digitization. Their corpus, however, consisted only of texts for adults and from a single year. It would be the work of Carroll et al. [21] that would provide insight into the distribution of words in school text. Their analysis consisted of five million words from schoolbooks covering grades 3 through 9 and a comprehensive selection of content areas. They identified the U function, which predicted the appearances of a word per million words of text as adjusted for a word’s distribution across content areas. This measure made it possible to provide an indication of which words accounted for particular portions of school text. They showed that, as Zipf had predicted, 135 words accounted for roughly 50% of the total words in schoolbooks.
The effort to describe the distribution of vocabulary in texts was expanded considerably by Zeno et al. [31] in the Educator’s Word Frequency Guide (EWFG), which was based on over 17 million words of texts that represented school content areas and grade levels from first through college. Several substantial efforts have produced ranks of vocabulary in large corpora of text [54,55] but the Zeno et al. analysis remains the last systematic, published database of the distribution of vocabulary in school text. The Zeno et al. work further verified Zipf’s [52] hypothesis about the distribution of words in the corpus. Of the 154,941 words in the Zeno et al. database, 87% of the words are predicted to appear less than once per million (and more than half of this group is predicted to occur approximately once in every 10 million words).
Hiebert [56] set out to establish a parsimonious vocabulary for school instruction. If only a limited number of words can be taught in school, Hiebert reasoned, the words that account for substantial portions of texts should be given priority in vocabulary instruction. The interest in identifying such a vocabulary goes much beyond the Dolch [57] words or even the 1000 most frequent words that Fry [58] emphasized. In particular, Hiebert was interested in identifying what she called a “core vocabulary” that accounts for 90% of the words in typical texts read by students in elementary through high school. The 90% level was chosen because leading literacy scholars [59,60] have proposed this level of word recognition as sufficient for comprehension.
In that success in third-grade reading has received considerable attention in policy beginning with the Reading Excellence Act [61], Hiebert [56] examined third-grade texts on norm-referenced tests, state tests, and oral reading assessments to determine the number of complex words per 100 words of text. Complex words were defined as those that were multi-syllabic or did not appear among the first 1000 words in the EWFG [31]. On average, the six assessments in the sample had 4.8 complex words per 100. The state assessments were the most challenging (6 complex words per 100) and the norm-referenced tests were the least challenging (3.5 complex words per 100).
Hiebert’s [56] use of single-syllable words as a criterion for word complexity lacks nuance in describing students’ familiarity and exposure to words. For example, third-graders are likely to know breath but not swath, even though both are single-syllable words. Subsequently, Hiebert [62] identified the words that accounted for 90% of total words in fourth-grade assessments of three states and the NAEP. For this analysis, Hiebert identified eight word zones from the EWFG’s [31] predictions of word appearances in a million words of text. The eight word zones and the number of words in each are as follows: (1) U = 68,006 to 1000 (n = 107); (2) U = 999 to 300 (n = 203); (3) U = 299 to 100 (n = 620); (4) U = 99 to 30 (n = 1676); (5) U = 29 to 10 (n = 2980); (6) U = 9 to 4 (n = 4052); (7) U = 3 to 1 (n = 9830); and (8) 0.999 and below (n = 135,473). Hiebert found that 90% of the total words on all assessments were accounted for by the words in zones 1 through 5: words that are predicted to have 10 or more appearances per million words of text.
Subsequently, Hiebert [63] analyzed excerpts from the 168 exemplar texts identified by developers of the Common Core State Standards (CCSS) [64]. In texts for grades 2–3, 92.5% of the total words were from word zones one through five. The percentage decreased to 88% for the texts at the grades 11–College and Career Ready (CCR) level. Hiebert’s [63] conclusion was that the 5586 words in word zones one through five in the EWFG could be regarded as an essential or parsimonious vocabulary for success in school reading, particularly at the elementary grades. An assessment that progressively evaluates students’ facility with the meanings of words in these word zones seemed to be a worthy endeavor. Consequently, the vocabulary component of the InSight assessment [65] was based on the word zone model. The focus was on coordinating words within a particular word zone with a developmental level at which those words are predicted to appear in texts with at least moderate frequency. Information on the factors that influence students’ performances on words from particular word zones can contribute to the underlying research question of this study: What factors influence the ease or difficulty of students’ knowledge of word meanings?
3.1. Method
3.1.1. The Assessment
The vocabulary component of the InSight assessment [65] had 12 levels with two forms, each consisting of 20 items. The 480 words on the assessment (12 levels x 2 forms x 20 items) were derived from the first seven word zones established by Hiebert [63]. The eighth word zone that encompasses words with frequencies less than 1 in the EWFG was not included in the assessment.
The assessment was intended to span the school grades of 1–12. The aim was to address word zones 1 through 3 in levels 1 through 3 of the assessment; word zone 4 in levels 4 to 6; word zone 5 in levels 7 to 9, word zone 6 in levels 10 to 11, and word zone 7 in Level 12. The words from word zone 1 were not used after results from an initial pilot test indicated that most students knew these words. Where one or more grades shared a word zone, the words were parsed into an equivalent number of sub-zones.
The goal of creating two forms of the assessment, each with 20 items, meant that words were chosen in pairs. Each set of words assigned to a grade level was divided into 20 groups. The first 2 items of a grade-level assessment came from the first group, the second pair of items from the second group, and so on. Words were sorted within a group for length, grade at which a word was known on the Living Word Vocabulary [38], and part of speech. To the degree possible, words were also matched on morphological family size and concreteness. As evident in Table 2, the features of words at the 12 levels of the final forms of the assessment show that, on the primary features of frequency, morphological frequency, and AoA, a progression of movement from easy to hard was maintained across the levels of the assessment. Differences across levels are not as distinctive on the concreteness feature.
Table 2.
Means (and Standard Deviations) of Features of Words on the 12 Levels of InSight Vocabulary Assessment and on the Vocabulary Assessment Study in Education (VASE) [66].
Item format. The assessment required students to identify a synonym for a highlighted word in a sentence. Seven categories of distractors were identified where words had: (a) an alternate meaning of the word that is not applicable in the context, (b) a thematically related but inappropriate meaning, (c) a potential miscue, (d) an opposite meaning, (e) frequently used in an expression with the highlighted word, (f) shared prefixes or suffixes, and (g) an unrelated meaning. In that the format had four distractors, all distractor types were not used for every item.
The stems for items were short (an average of 6 words) and were intended to reveal nothing about the target word except its part of speech. An illustration of an item is: I read the entire book. The correct response was whole and distractors were not broken, enter, large, and part. The words in the stems, distractors, and correct responses had approximately the same or more frequent U functions as the target word, as indicated in the information from Zeno et al. [31] following each word: I (4443), read (436), the (68,006) entire (89), book (290), whole (270), not (4356) broken (106), enter (66), large (597), and part (694). Only one word in this example—the distractor enter—had a U function that was less than the target word, but even this difference is not a substantial one.
3.1.2. Variables for Analysis
The set of variables used in analyzing the features of words associated with student performances was the same in both studies. A description of the nine variables follows.
Length. The length of the word was the number of letters as calculated by the Word Zone Profiler [67].
Syllables. The number of syllables was calculated using the syllabication breakdown found in the first line of the definition after a Google search. Each word was entered into the Google search engine, followed by the word “meaning” to produce the dictionary definition. The word entire, for example, was represented as two syllables (en, tire).
Word Frequency. The EWFG frequency measure (U function) provided the data for the frequency variable [31].
Frequency of Morphological Family. This variable captures the frequency of the members of a word’s morphological family. Frequencies for all members of a word family were obtained from the EWFG database [31]. Becker, Dixon & Anderson-Inman’s [68] morphological database was used to determine which words in the EWFG were morphologically related.
Dispersion. The EWFG [31] provides data on dispersion as the level of a word’s use across texts from different content areas. We used this D factor data for the words in the studies.
Concreteness. A word’s concreteness was based on the norms developed by Brysbaert, Warriner, and Kuperman [69], which indicate levels of concreteness from 1 (very abstract; e.g., charity) to (very concrete; e.g., chair).
AoA. This variable captures the age at which students typically understand or can use a word in oral language. We used the calculations from the database of Kuperman et al. [8].
Part of Speech. This variable captures the number of possible parts of speech for each word according to the WordNet [42] database. For example, the word zone could be both a noun and a verb for a score of 2.
Polysemy. This variable was calculated as the sum of all meanings of a word from all possible parts of speech according to WordNet [42].
All 480 words in the InSight assessment were coded according to the nine features (as was also the case with the 172 words in the VASE assessment in the second study). Descriptive statistics of the word features at the 12 levels of the InSight assessment are provided in Table 2.
3.2. Sample of Students
The InSight vocabulary assessment was administered to 28,901 students in grades 2 through 12 from 2469 schools across 46 states in the U.S. Of the 2247 schools for which demographic data were available, schools were distributed over three contexts: urban (27.5%), suburban (33%), and small town and rural (39.6%) and across four regions of the U.S: Northeast (4%), Midwest (12%), South (63%), and West (21%).
The 28,901 students were distributed across grade bands as follows: Grades 2–3, 1929; grades 4–5: 7472; grades 6–8: 13,731; and grades 9–12: 5769. For the 17,919 students for whom gender data were available, 51% were female and 49% were male. Racial/ethnicity (available for 14,133 students) was distributed as follows: American-Indian/Alaska Native/Native Hawaiian/Pacific Islander (0.81%), Asian-American (2.5%), African-American (42.4%), European-American (31.5%), Hispanic-American (21.7%), and two or more races (1.1%).
The data collection was part of the end-of-the-year assessment of students who had participated in the Reading Plus program over the academic year. The assessment is administered digitally in groups in either classroom or laboratory settings. The InSight assessment is adaptive. Students are first assigned the form for their grade level. If students’ scores fall below 70% correct on the grade-level form, they are given the form for the adjacent lower level, and so forth until they perform at 70% or higher or until they have reached the first level of the assessment. If students’ performances on the grade-level form are above 70%, they receive forms for subsequent grade levels until their scores fall below 70%. Across the 480 items, there was an average of 8865 responses. The dataset consisted of the proportion of correct responses to each word for four grade bands: Grades 2–3, 4–5, 6–8, and 9–12.
3.3. Data Analysis
We analyzed the data in two steps. The first involved looking at the overall performance of students on items (i.e., each of the 480 words) with word characteristics as moderator variables. This involved fitting a series of hierarchical models with words on level one and grade (of students) on level two. To fit these models, we used the R base program combined with the lmer4 package for hierarchical linear models [70,71]. Additionally, we applied a logistic transformation to the outcome variable (proportion correct) to normalize the outcome variable and apply linear regressions. The first model is an intercept only model (null model) and a random effect (variability), used as the base model to enable a likelihood ratio test in subsequent models. The second and third models include word feature variables indicating the proportion accounted for by each variable as well as the impact on the outcome variable p. Each model was compared to the previous model via likelihood ratio test to determine whether the additional factors account for variability.
The second step involved examining the performance of word features for each subgroup (i.e., the 4 grade groups) individually via a series of regression models. This analysis permitted an examination of which word features were important for each group level. Such an analysis is necessary because, for some variables such as word frequency, it would be expected that older students would perform better on words with lower frequencies since they have had exposure to these words over a longer period of time.
3.4. Results
3.4.1. Word Characteristics: Overall
The null model showed a large amount of variability between grades. The second model, which included word features (e.g., length, polysemy), accounted for a significant amount of variability over model 1 (see Table 3). The third model with dummy coded variables that represent student grade ranges showed that grade level accounts for a significant amount of variability beyond word characteristics alone.
Table 3.
Model Fit Between Three Models.
The null model shows that a large amount of variability occurs between grades (intraclass correlation = 0.62). The grand mean γ00 = 1.05 indicates that, on average, students answer a word correctly exp (1.05)/1+exp (1.05) = 0.74, or 74% of the time with a grade-level variability of u0. = 0.82. In the second model, the nine word features were included (i.e., word frequency, polysemy, etc.). The variables in model two accounted for a significant amount of variability over model one, χ2 (9) = 589.32, p < 0.001 (See Table 3). Of the nine variables included in the model, only two were significant across grade levels: word frequency and AoA (See Table 4). For word frequency, the results indicate that, as the frequency of the word gets smaller, the proportion correct tends to decrease. Next, the results also indicate that students tend to fail to answer words correctly when the word has a higher AoA (i.e., known by older but not younger students).
Table 4.
HLM Estimates of Main Effects.
3.4.2. Word Characteristics: Grade Bands
Next, to examine the influence of word features at different grade bands, we implemented a series of regression analyses (see Table 5). These analyses test how much impact each word feature has on the proportion of items correct at each grade band. Frequency and AoA were statistically significant across all grade levels, after adjusting for multiple comparisons via Bonferroni correction (alpha/10). The influence of frequency and AoA on proportion correct at each grade level is depicted in Figure 1 and Figure 2.
Table 5.
Regression Coefficients for Word Characteristics.
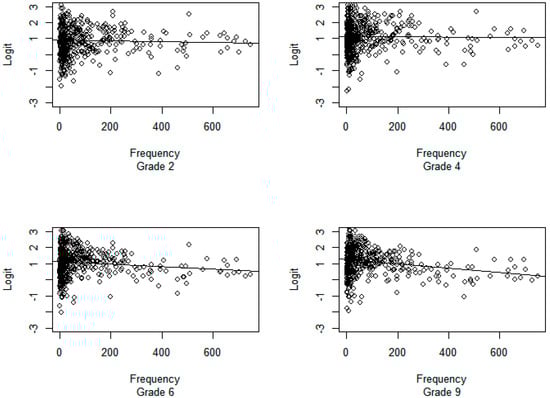
Figure 1.
Scatter plots for word frequency against logit transformed proportion correct for each grade level. The regression line becomes steeper for each grade level indicating the importance of frequency for older students.
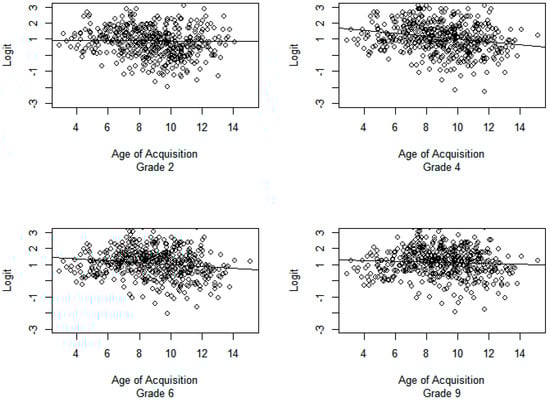
Figure 2.
Scatter plots for word age of acquisition against logit transformed proportion correct for each grade level. The line remains stable across all grade groups indicating that age of acquisition has equal importance for all grade levels in predicting proportion of items correct.
3.5. Summary
The first two criteria for selecting words for the assessment were frequency and part of speech. Pairs of words, one for each of the two assessment forms, were then vetted for comparable features on word familiarity, size of morphological family, number of syllables, and concreteness. Students’ performances on the vocabulary items were analyzed using measures of these criteria and, additionally, dispersion and polysemy. One of the original variables—familiarity—was assessed with a measure unique from that used in the original selection progress. In the original selection of words, grade norms from the LWV [38] were used to determine familiarity. In the current analysis, AoA [8], which was not available during the word-selection process, was used. The correlation between the grade norms of the LWV and the AoA ratings for the 480 words in the assessment was in the moderate range (r = 0.57). Similar to the findings of other studies [72,73], the AoA norms [8] performed robustly.
We had anticipated that morphological family size might prove to be a stronger predictor of students’ performances than proved to be the case, especially considering research linking family size to word knowledge [74,75]. Rather, the most consistent and strongest predictions came from frequency and AoA. The role of frequency and AoA in students’ word knowledge could be viewed as expected in that exposure to words, either in oral language and text or both, is required for acquisition. However, the finding that the average correct rate was 74% indicates that there were words that shared frequency and AoA metrics but were not known by students.
Furthermore, the strength of frequency and AoA in predicting students’ word knowledge does not translate into conclusions that only frequent and familiar words should be taught. Nor do these patterns translate into conclusions that only infrequent and unfamiliar words should be taught. Rather, the patterns suggest that these variables should be considered in the selection of words for instruction. If students at particular grade bands do not know particular words that can be expected to appear with some frequency in texts, these words should be a priority. Rather than devoting instructional time to words that are already known by students, vocabulary instruction should prepare students for the words that can be anticipated to appear with frequency in current and subsequent levels of text.
At the present time, criteria of frequency and AoA do not appear to undergird the selection of vocabulary for instruction in core reading programs. Among the 685 words chosen for third-grade vocabulary instruction across three core reading programs [5], half of the words were quite frequent (X = 57.2) and half were quite rare (X = 4.6). Furthermore, half of the vocabulary had a relatively low AoA (X = 6.7) and half had a relatively high AoA (X = 9.6). If the goal is to close the vocabulary gap and expand students’ vocabulary and comprehension prowess, words that are either too easy or too hard would not seem to be a good use of school time. The present findings would suggest the need to locate words within a “sweet spot” where instructed words are ones that will increase students’ facility with text but are unknown by students.
4. Study Two
The first study showed that the frequency of words and AoA predicted students’ knowledge of words anticipated to appear with some frequency at different developmental levels. The second study provides triangulation for the findings of the first study as it differs from the first in design, word selection, and the population involved. A question that remains is whether the same variables predict students’ performances on an assessment that was not derived from a model where words were chosen for particular grade bands based on their frequency.
A second question that was not addressed by the first study is how status as a native or non-native English speaker might influence performance on the variables. In 2017, over two and a half million students (42%) in Californian schools spoke a language other than English in their homes [76], a demographic shift reflected across the nation. This second study looks explicitly at students who are English learners. They comprise a significant portion of students in today’s classrooms and this population may perform differently than native English speakers on tests of English vocabulary knowledge. Scholars looking at language acquisition in a second language have examined features of words such as those explored in the first study. A review of research [77] showed that, in addition to morphological complexity and polysemy, features such as the pronounceability of words, similarity of lexical form (synformy), idiomatic expressions, and specificity of register contributed to difficulty of word knowledge among ELs. There was not, however, a clear effect for word length, part of speech or concreteness/ abstractness. In contrast, more recent research shows that ELs learn and use concrete words earlier and more easily than abstract words [78,79].
The second study uses the same methodology (logistically transformed proportions) in a non- hierarchical manner and examines the predictive nature of word features that influence student vocabulary performances. The measure used in this study, however, is unique in its representation of vocabulary knowledge—both from the measure used in study 1 and in other previous research. The VASE assessment [66] measures knowledge of individual words from students’ responses to a set of questions about the words ranging from their level of confidence in knowing the word, to information about the word’s semantic attributes, morphology, use in context, definition, and part(s) of speech. Word selection was based on teacher and researcher evaluation of the familiarity of selected items using words from an exhaustive review of grade-level math, science, and social studies textbooks, basal readers, Newbery Award-winning novels, and the California standards in English language arts. Furthermore, the nature of variables that predict English learners’ performances were also considered in this study. The criteria for word selection, the assessment task, and the composition of the sample differed in this study from that of study 1. The research question, however, remained the same: What factors predict the ease or difficulty of students’ knowledge of a word?
4.1. Method
VASE Vocabulary Assessment
The VASE assessment was developed primarily as a “proof of concept” study but has also been used to successfully assess the efficacy of the Word Learning Strategies program [80]. The VASE assessment consists of four 24-item multiple-choice tests that are each timed for 15 min. The four tests in the VASE assessment are linked using common-item equating, with four words appearing on all versions of the tests. There are two equivalent forms for fourth grade and two for fifth grade. Scores are reported on a common scale that spans the two grades, allowing for longitudinal tracking of vocabulary growth. The features of the 172 words on the various forms and tests of the VASE are summarized in Table 2.
The VASE assessment was given to 6976 fourth- and fifth-grade students in school districts across the state of California, including urban, suburban, and rural areas. Within the sample, 53% were female and 47% were male. Ethnicity was distributed as follows: Caucasian (24%), Latinx (40%), Asian (16%), African-American (7%), Filipinio (4%), and more than one ethnicity (9%).
A little over half of the sample were native English speakers (52%). The rest were classified as having different levels of English: (a) English learners (30%), (b) bilingual students deemed to be fluent in English on school entry (2%), or (c) students who had been redesignated as English Proficient in an earlier grade (16%).
The VASE assessment was developed to explore multiple dimensions of word knowledge. The six components it addresses—metacognition, semantics, morphology, syntax, definitions, and polysemy—each appear to make related but independent contributions to the richness of word knowledge [81]. Students were asked six multiple-choice questions about each word: (a) How well they know a word; (b) If they can identify a synonym related to the target word; (c) If they can identify an appropriate morphological family member; (d) If they can choose the sentence that uses the word correctly; (e) If they can choose an appropriate definition; and (f) If they can identify the part or parts of speech that could fit the word. For each question, students select one of four options. The scores reported in this study are a composite of these questions based on Thissen, Steinberg & Mooney’s [82] “testlet” construct in which related items are linked to create one larger, graded item and Samejima’s [83] graded IRT model.
In item response theory (the approach used for scaling the tests), reliability varies as a function of proficiency. However, it may be summarized for a test by averaging over the proficiency distribution, resulting in a single marginal reliability for the test. Marginal reliability for the VASE tests ranged from 0.91 to 0.93. The word-selection process, which drew words from typical classroom materials using the expertise of skilled fourth- and fifth-grade teachers in all stages of the assessment’s development, provides a strong foundation for the validity of the VASE assessment.
Because words were selected from intact texts, they were found in various morphological forms. An algorithm was used to choose the tested words from the words selected by the teachers resulting in the use of the intact morphological form, not the root word, in the assessment. For instance, VASE presented the words admiration instead of admire and graphs instead of graph. The selected words were extensively piloted and culled to develop the final set of words for the assessment.
4.2. Analysis and Results
Descriptive statistics for the variables in study 2 are included in Table 2. The present analysis used the same factors as in study 1 but operationalized in a different fashion to predict performance on the VASE assessment. In the VASE analysis, word location was included as a predictor because VASE was a speeded test. The more frequent and easier words were at the beginning of the test, along with the linking items (words common to all four tests). Many students did not reach the words on the latter portion of the assessment, making these words inherently more difficult. Word Location ranges from 1 (first item on the test) to 24 (last item on the test) with an average of 13.69 and standard deviation of 6.58.
The estimated coefficient for location is –0.1926, and the intercept is 2.0988 (see Table 6). The back transformation to change to the proportion metric is . For a word in the first position, the expected proportion of passing the word (ignoring the effects of all other predictors) would be In contrast, the expected proportion of passing a word in the 12th position would be
Table 6.
Beta Regression Analysis of Word Difficulty (All VASE Students).
Table 6 shows the estimated coefficients for all VASE respondents, along with their standard errors, test statistics, and p values. The significant predictors of proportion passing the item are word location, word length, number of syllables, AoA, and concreteness.
Further analyses were conducted for both the native English speakers and the English learners, as seen in Table 7 and Table 8. The patterns differ slightly as the role of concreteness was highly significant for the EL students, and not significant for native English speakers. Thus, the finding of significance in the overall analysis seems to be driven by the EL students.
Table 7.
Beta Regression Analysis of Word Difficulty (VASE Native English Speakers).
Table 8.
Beta Regression Analysis of Word Difficulty (VASE EL Students).
4.3. Summary
The results of the second study indicate that word location, AoA, word length, number of syllables, and concreteness were all significant word-level factors that contributed to performance on the VASE assessment. At first glance, the lack of significance in this study for word frequency may appear unexpected. This finding, however, may well represent a confound of word frequency with word location. When the VASE tests were created, there was a deliberate effort to order the words by difficulty. Since word frequency was involved in those decisions, it is likely that it is subsumed by word location in the analyses.
Like the first study, AoA was highly predictive of performance on the VASE test. However, this analysis also indicated that the graphic form of the word, as measured by the number of letters and syllables also influenced the performance of these 4th and 5th grade students. A potential explanation for the prominence of these variables in the second study but not the first study may lie in the comparative rareness of the words in the VASE assessment relative to the InSight assessment. The mean U function for the VASE was 20.64 (SD = 40.62), while the mean U function for the grades 4–5 levels of the InSight was 66.23 (SD = 16.67). The likelihood that students had encountered many of the words on the VASE previously were substantially less than for words on the InSight. Furthermore, words on the VASE were longer than those on the grades 4–5 levels of InSight: X = 7.79 (SD = 2.14) for the former and X = 6.90 (SD = 1.54) for the latter. Findings from previous studies confirm the influence of word and syllable length on students’ recognition of words [35,36].
An intriguing result relates to the concreteness factor, which was highly predictive for the English learners but not significant for students whose native language was English. This finding could be partially attributed to the preponderance of nouns in VASE. We carefully constructed the test to represent four parts of speech (adverbs, adjectives, nouns, and verbs) in relative proportion to the English language. As a result, 58% of the words were nouns, with a mean of 3.12 on the BRM Concreteness Scale from 1 (abstract) to 5 (concrete) [69].
5. Overall Discussion
The two assessments that provided the data on student vocabulary knowledge differed from one another on several dimensions. First, the content that was assessed by the two assessments differed. The InSight vocabulary assessment was designed to test students’ knowledge of core vocabulary, while the VASE used words that teachers had identified as likely challenging for grade-level students. Item formats of the two assessments also differed with a fairly conventional format of stems and single word responses on the InSight assessment and six questions that each queried students’ knowledge of unique dimensions of word knowledge on the VASE.
Even with these differences in content and format, one variable reliably predicted students’ word knowledge of the two assessments—AoA. AoA gives an indication of when words typically appear in students’ oral vocabularies. This result makes sense, as it is much more difficult for students to perform well on vocabulary assessments when the words on the test are not part of their oral vocabularies. Additionally, word frequency was a critical variable on both assessments. For the InSight measure, this variable proved the strongest predictor. Although frequency did not appear to be significant in the analysis of the VASE data, word location was a significant factor. The construction of the VASE assessment was such that frequency was subsumed in the word location factor, making it likely to be a proxy for frequency. Thus, in both assessments, exposure to words in written language was a strong predictor of knowledge of word meaning. As with the finding on AoA, this result is understandable. That is, when students have opportunities to encounter words in texts, they gain knowledge about those words. These findings, of course, do not mean that only words with high frequency or high familiarity should be taught or, conversely, only words with low frequency or low familiarity. As has been discussed previously—and will be addressed in more depth in the following section on implications of the findings for curriculum design and instruction—word selection based on data on known and unknown words and their role in texts at particular grade bands can ensure that students are extending their vocabularies strategically and efficiently.
After AoA and frequency, there was divergence in the variables that accounted for students’ performances on the two unique assessments. On the VASE assessment, syllabication, word length and concreteness were also salient variables. Word length and the concomitant number of syllables have been found to predict the rapidity with which students recognize words and their meanings [35]. It is likely that many students had not encountered the words on the VASE in texts previously, at least according to teachers’ views. Presumably, the meanings of the words and also the structure (i.e., word length, syllabication, derivations) influenced teachers’ choices and consequently the words on the VASE test.
The finding that concreteness predicted performances on the VASE assessment, especially for English learners, indicates that this could be an important and under-acknowledged factor in vocabulary learning and assessment. Others have described the role of realia and concrete nouns in English learners’ instruction in English [84]. The findings of this study provide additional evidence for instruction that emphasizes concrete nouns as a way of supporting English learners in connecting known concepts to the new English orthographic and phonological forms. While ELs should not be shielded from learning academically complex vocabulary, this finding points directly to the importance of careful selection of words during instruction and on measures of assessment, especially when students are learning English.
6. Implications for Curriculum Design and Instruction
The findings that word frequency and AoA predicted students’ performances could be met with the response, “Of course. Isn’t that to be expected? Wouldn’t that be especially anticipated when the words on the InSight assessment were chosen to represent bands according to frequency in written English?” Such an observation fails to recognize several aspects of the words in the assessments, particularly of the InSight assessment, as well as the aims of this study, which was to provide guidance for curriculum developers, publishers, and teachers in which words to choose for instruction.
First, while it is the case that the InSight assessment aimed to establish students’ facility with words chosen according to frequency norms, the assessment is not a simple measure of frequency. General academic words are prominent in the InSight vocabulary corpus: 65% of all InSight words appear in Gardner and Davies’s [85] Academic Vocabulary List. General academic words are already apparent in levels 1 through 3 of the InSight assessment where 51% of the words are on the Gardner and Davies list. General academic words have been identified as words that are relatively abstract and frequently not the focus of instruction in English/Language Arts or in content areas, making these words challenging for many students [86].
Second, findings that show that students are more likely to know words as a function of frequency and AoA does not translate into information as to what words are known by individual students or even groups of students. To identify the words that are known by individuals and also groups of students (as well as those words that are likely not known) requires analyses of individuals’ responses to specific words. Landauer, Kireyev, and Panaccione [87] called for the individualization of vocabulary instruction but, at the time of the publication of their article, assessments based on systematic analyses of critical word features were not available. Such assessments are now available and provide the means whereby publishers and curriculum developers can create vocabulary curriculum that may address the gap in vocabulary to a greater degree than was possible in the past. The specific information on which words are likely to be known and which ones are not requires further investigation. However, the instruments to gather such information are available for publishers and curriculum designers.
Finally, we repeat our cautions regarding interpretations of the current findings as justification for emphasizing either words with high frequency and familiarity or words with low frequency and familiarity in instruction. Our rationale for this study was to direct attention of curriculum designers and publishers to the availability of data from large-scale studies that can ensure that the focus words of instruction are ones with which students are not yet facile, but which are predicted to appear in current and subsequent grade bands. That is, data from large-scale assessments can support parsimonious vocabulary instruction where students’ time is spent on words that matter in texts and academic conversations and are not yet known with ease.
7. Limitations and Future Research
This project breaks ground in providing information on students’ word knowledge by using data from existing vocabulary assessments. The approach of using data on students’ performances on vocabulary assessment to determine features that influence word knowledge appears to be a productive direction for research. At the same time, we recognize the limitations of the project and the need for studies that replicate the approach and address unanswered questions in this study.
A question that was not addressed in either study is the degree to which these two assessments are an indication of students’ ability to comprehend text. To date, data are not available on the predictive validity of the VASE on tests of reading comprehension but there is evidence that the InSight vocabulary component does predict comprehension. The InSight vocabulary measure has been found to have relatively high correlations with reading comprehension assessments of three types: a state assessment (Florida Standards Assessment): r = 0.66; a consortium assessment (Smarter Balanced Assessment Consortium): r = 0.83; and a norm-referenced assessment (GRADE): r = 0.84 [88].
Such strong relationships raise the question of whether vocabulary instruction, particularly interventions, that use data on students’ knowledge of the core vocabulary could influence comprehension performances. To date, vocabulary interventions have been surprisingly ineffective in changing student performances on generalized comprehension measures [89]. One explanation is that interventions have typically not focused on the words most prominent in the lexicon at different developmental levels. English has an exceptionally large corpus of rare words [7]. If words in interventions have not been guided by the saliency of words in written English, it is not surprising that interventions have rarely closed the existing knowledge gaps between students on entering school [90]. Findings from the current study provide direction for increasing the focus and efficacy of vocabulary instruction, especially interventions. Rather than spending instructional time on words that most students already know (a pattern in historical and current core reading programs) or, alternatively, on rare words as appears to have been the case in many interventions [91], the present findings suggest that a more profitable route would be for instruction and interventions to concentrate on vocabulary that is unknown by students but can be expected to appear in students’ texts [11].
An important question for both instruction and assessment is whether frequency and AoA can be used as indicators of students’ reading exposure. Without extensive reading, students are unlikely to encounter critical vocabulary sufficiently to read automatically and with meaning. A trend in reading instruction, observed at both the elementary and middle to high school levels, is a reduction in the degree to which students are responsible for reading texts themselves with texts read aloud by teachers, read by peers in round-robin reading, or read by narrators on audio versions [92,93]. Linking normative amounts of reading to vocabulary learning through the frequency of words and AoA could be useful in tracking such trends and encouraging more extensive reading in classrooms.
Another question that this study does not address is whether knowledge of a word with particular frequency and AoA is indicative of knowledge of words within a similar band of frequency and AoA. Pearson et al. [12] raised this question as especially germane in establishing students’ vocabulary knowledge. The present study does not clarify the issue, but it does give grist for future research that considers whether word knowledge is idiosyncratic to a particular word or whether shared features can be used to make conclusions about students’ word knowledge.
In conclusion, the close examination of word features is a fruitful line of research that can yield important information for both vocabulary instruction and assessment. Two different assessments indicate that word frequency and AoA are worth consideration in the selection of words for instruction and for vocabulary assessments. Taken together, the findings from this project point to important factors to be taken up by publishers, teachers and researchers involved in vocabulary instruction and the construction of measures of assessment.
Author Contributions
Conceptualization, E.H.H. & J.A.S., methodology, A.S., J.A.S., statistical analysis, R.C., writing, original draft preparation, E.H.H., J.A.S., writing—review & editing, E.H.H., J.A.S.
Funding
Study 2 was partially supported by IES Reading and Writing Education Research Grant: Goal 5: #R305A090550-10. The content of this manuscript is the sole responsibility of the authors and does not necessarily reflect the opinions of the U. S. Department of Education.
Acknowledgments
We gratefully acknowledge the support and the participation of students and their teachers in both projects.
Conflicts of Interest
The authors declare no conflict of interest.
References
- Davis, F.B. Two new measures of reading ability. J. Educ. Psychol. 1942, 33, 365–372. [Google Scholar] [CrossRef]
- Hoff, E.; Tian, C. Socioeconomic status and cultural influences on language. J. Commun. Disord. 2005, 38, 271–278. [Google Scholar] [CrossRef] [PubMed]
- Gates, A.I. The word recognition ability and the reading vocabulary of second-and third-grade children. Read. Teach. 1962, 15, 443–448. [Google Scholar]
- Stallman, A.; Commeyras, M.; Kerr, B.; Reimer, K.; Jimenez, R.; Hartman, D.; Pearson, P.D. Are “new” words really new? Read. Res. Instr. 1989, 29, 12–29. [Google Scholar] [CrossRef]
- Hiebert, E.H. The words we teach, the words we don’t: An examination of the taught and rare vocabularies of core reading programs. Paper Presented at the Annual Meeting of the American Educational Research Association, Philadelphia, PA, USA, 7 April 2014. Available online: https://www.academia.edu/7858492/The_Words_We_Teach_The_Words_We_Dont_An_examination_of_the_taught_and_rare_vocabularies_of_core_reading_programs (accessed on 27 November 2018).
- Frankenberg-Garcia, A.; Flowerdew, L.; Aston, G. (Eds.) New Trends in Corpora and Language Learning; Bloomsbury Publishing: New York, NY, USA, 2013. [Google Scholar]
- Mugglestone, L. (Ed.) The Oxford History of English; Oxford University Press: Cambridge, UK, 2012. [Google Scholar]
- Kuperman, V.; Stadthagen-Gonzalez, H.; Brysbaert, M. Age-of-acquisition ratings for 30,000 English words. Behav. Res. Methods 2012, 44, 978–990. [Google Scholar] [CrossRef] [PubMed]
- U.S. Department of Education. Academic Performance and Outcomes for English Learners: Performance on National Assessments and On-Time Graduation Rates; U.S. Department of Education: Washington, DC, USA, 2017. Available online: https://www2.ed.gov/datastory/el-outcomes/index.html (accessed on 5 December 2018).
- Nagy, W.E.; Scott, J.A. Vocabulary processes. In Handbook of Reading Research; Kamil, M., Mosenthal, P., Pearson, P.D., Barr, R., Eds.; Lawrence Erlbaum Associates: Mahwah, NJ, USA, 2000; Volume 3, pp. 269–284. [Google Scholar]
- McKeown, M.; Deane, P.; Scott, J.; Krovetz, R.; Lawless, R. Vocabulary Assessment to Support Instruction: Building Rich Word-Learning Experiences; Guilford Press: New York, NY, USA, 2017. [Google Scholar]
- Pearson, P.D.; Hiebert, E.H.; Kamil, M.L. Vocabulary assessment: What we know and what we need to learn. Read. Res. Q. 2007, 42, 282–296. [Google Scholar] [CrossRef]
- Schmitt, N. Size and depth of vocabulary knowledge: What the research shows. Learning 2014, 64, 913–951. [Google Scholar] [CrossRef]
- Nagy, W.E.; Hiebert, E.H. Toward a theory of word selection. In Handbook of Reading Research; Kamil, M.L., Pearson, P.D., Moje, E.B., Afflerbach, P.P., Eds.; Longman: New York, NY, USA, 2011; Volume 4, pp. 388–404. [Google Scholar]
- Balota, D.A.; Yap, M.J.; Cortese, M.J. Visual word recognition: The journey from features to meaning (a travel update). Handb. Psycholinguist. 2006, 2, 285–375. [Google Scholar]
- Nagy, W.; Anderson, R.C.; Schommer, M.; Scott, J.A.; Stallman, A.C. Morphological families in the internal lexicon. Read. Res. Q. 1989, 24, 262–282. [Google Scholar] [CrossRef]
- Nerlich, B.; Clarke, D.D. Ambiguities we live by: Towards a pragmatics of polysemy. J. Pragmat. 2001, 33, 1–20. [Google Scholar] [CrossRef]
- Cervetti, G.N.; Hiebert, E.H.; Pearson, P.D.; McClung, N.A. Factors that influence the difficulty of science words. J. Lit. Res. 2015, 47, 153–185. [Google Scholar] [CrossRef]
- Sullivan, J. Developing Knowledge of Polysemous Vocabulary. Ph.D. Thesis, University of Waterloo, Waterloo, ON, Canada, 2006. [Google Scholar]
- Millis, M.L.; Bution, S.B. The effect of polysemy on lexical decision time: Now you see it, now you don’t. Mem. Cognit. 1989, 17, 141–147. [Google Scholar] [CrossRef]
- Carroll, J.B.; Davies, P.; Richman, B. The American Heritage Word Frequency Book; Houghton Mifflin: Boston, MA, USA, 1971. [Google Scholar]
- Dockrell, J.E.; Braisby, N.; Best, R.M. Children’s acquisition of science terms: Simple exposure is insufficient. Learn. Instr. 2007, 17, 577–594. [Google Scholar] [CrossRef]
- Marzano, R.J.; Marzano, J.S. A Cluster Approach to Elementary Vocabulary Instruction; International Reading Association: Newark, DE, USA, 1988. [Google Scholar]
- Jenkins, J.R.; Dixon, R. Vocabulary learning. Contemp. Educ. Psychol. 1983, 8, 237–260. [Google Scholar] [CrossRef]
- Nagy, W.E.; Scott, J.A. Word schemas: Expectations about the form and meaning of new words. Cognit. Instr. 1990, 7, 105–127. [Google Scholar] [CrossRef]
- Buchanan, T.W.; Etzel, J.A.; Adolphs, R.; Tranel, D. The influence of autonomic arousal and semantic relatedness on memory for emotional words. Int. J. Psychophysiol. 2006, 61, 26–33. [Google Scholar] [CrossRef] [PubMed]
- Erten, İ.H.; Tekin, M. Effects on vocabulary acquisition of presenting new words in semantic sets versus semantically unrelated sets. System 2008, 36, 407–422. [Google Scholar] [CrossRef]
- Venezky, R.L. The American Way of Spelling: The Structure and Origins of American English Orthography; Guilford Press: New York, NY, USA, 1999. [Google Scholar]
- Nagy, W.E.; Anderson, R.C. How many words are there in printed school English? Read. Res. Q. 1984, 19, 304–330. [Google Scholar] [CrossRef]
- Carlisle, J.F.; Stone, C. Exploring the role of morphemes in word reading. Read. Res. Q. 2005, 40, 428–449. [Google Scholar] [CrossRef]
- Zeno, S.M.; Ivens, S.H.; Millard, R.T.; Duvvuri, R. The Educator’s Word Frequency Guide; Touchstone Applied Science Associates Inc.: Brewster, MA, USA, 1995. [Google Scholar]
- Toglia, M.P.; Battig, W.F. Handbook of Semantic Word Norms; Lawrence Erlbaum: Mahwah, NJ, USA, 1978. [Google Scholar]
- Freebody, P.; Anderson, R.C. Effects of vocabulary difficulty, text cohesion, and schema availability on reading comprehension. Read. Res. Q. 1983, 18, 277–294. [Google Scholar] [CrossRef]
- Morrison, C.M.; Ellis, A.W. Roles of word frequency and age of acquisition in word naming and lexical decision. J. Exp. Psychol. Learn. Mem. Cognit. 1995, 21, 116. [Google Scholar] [CrossRef]
- Bergman, C.B.; Martelli, M.; Burani, C.; Pelli, D.; Zoccolotti, P. How the word length effect develops with age. J. Vis. 2006, 6, 999. [Google Scholar] [CrossRef]
- Miller, L.T.; Lee, C.J. Construct validation of the Peabody Picture Vocabulary Test—Revised: A structural equation model of the acquisition order of words. Psychol. Assess. 1993, 5, 438. [Google Scholar] [CrossRef]
- Biemiller, A. Words Worth Teaching: Closing the Vocabulary Gap; McGraw-Hill SRA: Columbus, OH, USA, 2010. [Google Scholar]
- Dale, E.; O’Rourke, J. The Living Word Vocabulary; World Book-Childcraft International: Chicago, IL, USA, 1981. [Google Scholar]
- Landauer, T.K.; Dumais, S.T. A solution to Plato’s problem: The latent semantic analysis theory of acquisition, induction, and representation of knowledge. Psychol. Rev. 1997, 104, 211. [Google Scholar] [CrossRef]
- Lund, K.; Burgess, C. Producing high-dimensional semantic spaces from lexical co-occurrence. Behav. Res. Methods Instrum. Comput. 1996, 28, 203–208. [Google Scholar] [CrossRef]
- Miller, G. WordNet: An Electronic Lexical Database; MIT Press: Cambridge, MA, USA, 1998. [Google Scholar]
- Paivio, A.; Yuille, J.; Madigan, S.A. Concreteness, imagery and meaningfulness values for 925 nouns. J. Exp. Psychol. 1968, 76, 1–25. [Google Scholar] [CrossRef]
- Altarriba, J.; Bauer, L.M.; Benvenuto, C. Concreteness, context-availability, and imageability ratings and word associations for abstract, concrete, and emotion words. Behav. Res. Methods Instrum. Comput. 1999, 31, 578–602. [Google Scholar] [CrossRef]
- De Groot, A.; Keijzer, R. What is hard to learn is easy to forget: The roles of word concreteness, cognate status, and word frequency in foreign language vocabulary learning and forgetting. Lang. Learn. 2000, 50, 1–56. [Google Scholar] [CrossRef]
- Varela, F.J.; Thompson, E.T.; Rosch, E. The Embodied Mind: Cognitive Science and Human Experience; The MIT Press: Cambridge, MA, USA, 1991. [Google Scholar]
- Thorndike, E.L. The Teacher’s Word Book; Bureau of Publications, Teachers College, Columbia University: New York, NY, USA, 1921. [Google Scholar]
- Thorndike, E.L. A Teacher’s Word Book of the 20,000 Words; Bureau of Publications, Teachers College, Columbia University: New York, NY, USA, 1932. [Google Scholar]
- Thorndike, E.L.; Lorge, I. The Teacher’s Word Book of 30,000 Words; Bureau of Publications, Teachers College, Columbia University: New York, NY, USA, 1944. [Google Scholar]
- Elson, W.H.; Gray, W.S. The Elson Basic Readers; Scott Foresman: Chicago, IL, USA, 1931. [Google Scholar]
- Gates, A.I. The Work-Play Books; Macmillan: New York, NY, USA, 1930. [Google Scholar]
- Hiebert, E.H.; Raphael, T.E. Psychological perspectives on literacy and extensions to educational practice. In Handbook of Educational Psychology; Berliner, D.C., Calfee, R.C., Eds.; Macmillan: New York, NY, USA, 1996; pp. 550–602. [Google Scholar]
- Zipf, G.K. The Psychology of Language; Houghton-Mifflin: Boston, MA, USA, 1935. [Google Scholar]
- Kučera, H.; Francis, W. Computational Analysis of Present Day American English; Brown University Press: Providence, RI, USA, 1967. [Google Scholar]
- Davies, M. The 385+ million word Corpus of Contemporary American English (1990–2008+): Design, architecture, and linguistic insights. Int. J. Corpus Linguist. 2009, 14, 159–190. [Google Scholar] [CrossRef]
- Leech, G.; Rayson, P. Word Frequencies in Written and Spoken English: Based on the British National Corpus; Routledge: New York, NY, USA, 2014. [Google Scholar]
- Hiebert, E.H. Standards, assessment, and text difficulty. In What Research Has to Say about Reading Instruction, 3rd ed.; Farstrup, A.E., Samuels, S.J., Eds.; International Reading Association: Newark, DE, USA, 2002; pp. 337–369. [Google Scholar]
- Dolch, E.W. A basic sight vocabulary. Elem. Sch. J. 1936, 36, 456–460. [Google Scholar] [CrossRef]
- Fry, E.B. The Vocabulary Teacher’s Book of Lists; Jossey-Bass: Hoboken, NJ, USA, 2004. [Google Scholar]
- Clay, M. Becoming Literate: The Construction of Inner Control; Heinemann: Portsmouth, NH, USA, 1991. [Google Scholar]
- Stahl, S.; Heubach, K. Fluency-oriented reading instruction. J. Lit. Res. 2005, 37, 25–60. [Google Scholar] [CrossRef]
- Reading Excellence Act. 1998. Available online: www.gpo.gov/fdsys/pkg/BILLS-105hr2614eas/pdf/BILLS-105hr2614eas.pdf (accessed on 1 January 2019).
- Hiebert, E.H. In pursuit of an effective, efficient vocabulary curriculum for the elementary grades. In The Teaching and Learning of Vocabulary: Bringing Scientific Research to Practice; Hiebert, E.H., Kamil, M., Eds.; LEA: Mahwah, NJ, USA, 2005; pp. 243–263. [Google Scholar]
- Hiebert, E.H. Core vocabulary and the challenge of complex text. In Quality Reading Instruction in the Age of Common Core Standards; Neuman, S.B., Gambrell, L.B., Eds.; International Reading Association: Newark, DE, USA, 2013; pp. 149–161. [Google Scholar]
- National Governors Association Center for Best Practices & Council of Chief State School Officers. Common Core State Standards for English Language Arts & Literacy in History/Social Studies, Science, and Technical Subjects; Appendix A; National Governors Association Center for Best Practices & Council of Chief State School Officers: Washington, DC, USA, 2010; Available online: www.corestandards.org/assets/Appendix_A.pdf (accessed on 1 January 2019).
- Reading Plus. InSight Assessment; Reading Plus: Winooski, VT, USA, 2016. [Google Scholar]
- Vocabulary Innovations in Education Consortium. Vocabulary Assessment Study in Education; August 2014. Available online: http://vineconsortium.org/vase/ (accessed on 12 August 2018).
- Hiebert, E.H. Word Zone Profiler; TextProject: Santa Cruz, CA, USA, 2012. [Google Scholar]
- Becker, W.C.; Dixon, R.; Anderson-Inman, L. Morphographic and Root Word Analysis of 26,000 High Frequency Words; University of Oregon Follow Through Project, College of Education: Eugene, OR, USA, 1980. [Google Scholar]
- Brysbaert, M.; Warriner, A.B.; Kuperman, V. Concreteness ratings for 40 thousand generally known English word lemmas. Behav. Res. Methods 2014, 46, 904–911. [Google Scholar] [CrossRef] [PubMed]
- R Core Team. R: A Language and Environment for Statistical Computing; R Foundation for Statistical Computing: Vienna, Austria, 2016; Available online: https://www.R-project.org/ (accessed on 1 January 2019).
- Bates, D.; Maechler, M.; Bolker, B.; Walker, S. Fitting linear mixed-effects models Using lme4. J. Stat. Softw. 2015, 67, 1–48. [Google Scholar] [CrossRef]
- Cortese, M.J.; Schock, J. Imageability and age of acquisition effects in disyllabic word recognition. Q. J. Exp. Psychol. 2013, 66, 946–972. [Google Scholar] [CrossRef] [PubMed]
- Monaghan, P. Age of acquisition predicts rate of lexical evolution. Cognition 2014, 133, 530–534. [Google Scholar] [CrossRef] [PubMed]
- Carlisle, J.F.; Katz, L.A. Effects of word and morpheme familiarity on reading of derived words. Read. Writ. Interdiscip. J. 2006, 19, 669–693. [Google Scholar] [CrossRef]
- Dijkstra, T.; Martín, F.M.; Schulpen, B.; Schreuder, R.; Baayen, R.H. A roommate in cream: Morphological family size effects on interlingual homograph recognition. Lang. Cognit. Process. 2007, 20, 7–41. [Google Scholar] [CrossRef]
- California Department of Education. 29 June 2018. Facts about English Learners in California. Available online: https://www.cde.ca.gov/ds/sd/cb/cefelfacts.asp (accessed on 12 August 2018).
- Laufer, B. Why are some words more difficult than others? Some intralexical factors that affect the learning of words. Int. Rev. Appl. Linguist. 1990, 28, 293–307. [Google Scholar] [CrossRef]
- Crossley, S.; Salsbury, T.; McNamara, D. Measuring L2 lexical growth using hypernymic relationships. Lang. Learn. 2009, 59, 307–334. [Google Scholar] [CrossRef]
- Salsbury, T.; Crossley, S.A.; McNamara, D.S. Psycholinguistic word information in second language oral discourse. Second Lang. Res. 2011, 27, 343–360. [Google Scholar] [CrossRef]
- Graves, M.F.; Ringstaff, C.; Li, L.; Flynn, K. Effects of teaching upper elementary grade students to use Word Learning Strategies. Read. Psychol. 2018, 1–20. [Google Scholar] [CrossRef]
- Scott, J.A.; Flinspach, S.L.; Vevea, J.L.; Castaneda, R. Vocabulary Knowledge as a Multidimensional Concept: A Six Factor Model; Poster at the Annual Meeting of the Society for the Scientific Study of Reading; Hapuna Beach: Waimea, HI, USA, 2015. [Google Scholar]
- Thissen, D.; Steinberg, L.; Mooney, J. Trace lines for testlets: A use of multiple-categorical-response models. J. Educ. Meas. 1989, 26, 247–260. [Google Scholar] [CrossRef]
- Samejima, F. The graded response model. In Handbook of Modern Item Response Theory; van der Linden, W.J., Hambleton, R.K., Eds.; Springer: New York, NY, USA, 1996; pp. 85–100. [Google Scholar]
- Graves, M.F.; August, D.; Mancilla-Martinez, J. Teaching Vocabulary to English Language Learners; Teachers College Press: New York, NY, USA, 2012. [Google Scholar]
- Gardner, D.; Davies, M. A new academic vocabulary list. Appl. Linguist. 2013, 35, 305–327. [Google Scholar] [CrossRef]
- Nagy, W.; Townsend, D. Words as tools: Learning academic vocabulary as language acquisition. Read. Res. Q. 2012, 47, 91–108. [Google Scholar] [CrossRef]
- Landauer, T.K.; Kireyev, K.; Panaccione, C. Word maturity: A new metric for word knowledge. Sci. Stud. Read. 2011, 15, 92–108. [Google Scholar] [CrossRef]
- Gehsmann, K.M.; Spichtig, A.N.; Pascoe, J.P.; Ferrara, J.D. Comparing the construct of reading proficiency across five commonly used reading assessments: Implications for policy and practice. Paper Presented at the 67th Annual Conference of the Literacy Research Association, Tampa, FL, USA, 29 November 2017. Available online: https://www.researchgate.net/publication/321731743_Comparing_the_Construct_of_Reading_Proficiency_Across_Five_Commonly_Used_Reading_Assessments_Implications_for_Policy_and_Practice_Literacy_Research_Association_December_2017 (accessed on 1 January 2019).
- Wright, T.S.; Cervetti, G.N. A systematic review of the research on vocabulary instruction that impacts text comprehension. Read. Res. Q. 2017, 52, 203–226. [Google Scholar] [CrossRef]
- Ceci, S.J.; Papierno, P.B. The rhetoric and reality of gap closing: When the “have-nots” gain but the “haves” gain even more. Am. Psychol. 2005, 60, 149–160. [Google Scholar] [CrossRef]
- Scott, J.A.; Lubliner, S.; Hiebert, E.H. Constructs underlying word selection and assessment tasks in the archival research on vocabulary instruction. In 55th Yearbook of the National Reading Conference; Hoffman, J.V., Schallert, D.L., Fairbanks, C.M., Worthy, J., Maloch, B., Eds.; NRC: Oak Creek, WI, USA, 2006; pp. 264–275. [Google Scholar]
- Brenner, D.; Hiebert, E.H.; Tompkins, R. How much and what are third graders reading? In Reading More, Reading Better: Solving Problems in the Teaching of Literacy; Hiebert, E.H., Ed.; Guilford Press: New York, NY, USA, 2009; pp. 118–140. [Google Scholar]
- Swanson, E.; Wanzek, J.; McCulley, L.; Stillman-Spisak, S.; Vaughn, S.; Simmons, D.; Fogarty, M.; Hairrell, A. Literacy and text reading in middle and high school social studies and English language arts classrooms. Read. Writ. Q. 2016, 32, 199–222. [Google Scholar] [CrossRef]


© 2019 by the authors. Licensee MDPI, Basel, Switzerland. This article is an open access article distributed under the terms and conditions of the Creative Commons Attribution (CC BY) license (http://creativecommons.org/licenses/by/4.0/).