Abstract
A teacher’s self-efficacy has been found to be one of the most important factors contributing to a successful teaching–learning outcome for both the teacher and the students. Numerous studies have shown that there is a relationship between students’ self-efficacy, students’ academic achievement, teacher burnout and a teacher’s sense of self-efficacy. In this study, the psychometric properties of the Science Teaching Efficacy and Beliefs Instrument (STEBI) by Riggs and Enochs (1990) were re-examined in a Canadian context utilizing data of 1630 teachers from the Pan-Canadian Assessment Program (PCAP) in 2013. Exploratory factor analysis (EFA) and its associated methods were used to investigate the factorial structure of the STEBI, and Cronbach’s alpha was calculated as a measure of reliability. The results showed adequacy of a two-factor solution and similar overall patterns of factor loadings across orthogonal and oblique rotations. In terms of reliability analysis, both factors had reliability coefficients lower than the original scale. The implications of these findings and the future directions for research are discussed.
1. Introduction
Bandura’s (1986) social cognitive theory has defined perceived self-efficacy as “people’s judgments of their capabilities to organize and execute courses of action required to attain designated types of performances” [1] (p. 391). This perceived self-efficacy is associated with how individuals consider their competence rather than their actual capabilities [1,2,3]. High levels of self-efficacy regulate individuals’ behavior to persist in challenging circumstances and determine the amount of effort put into allocated tasks [3,4]. In the classroom learning environment, teachers’ self-efficacy controls their activities and behaviors, their persistence particularly with students who have learning difficulties and their effort in instruction [5,6].
Teachers’ self-efficacy is defined as teachers’ beliefs about their ability to teach, to manage the classroom, and to motivate students to learn [7]. Teachers with high self-efficacy tend to stay in teaching because it has been shown that teacher retention is considerably influenced by their sense of efficacy prior to and during their career [8,9]. Recent statistics also support this claim as, for instance, the retention rate is lower among inexperienced teachers; 30% to 50% of these teachers who left the profession in their first five years reported low levels of self-efficacy [9].
From the student’s perspective, teachers with higher levels of self-efficacy are more likely to consider students’ differences in their teaching and are willing to learn and implement a variety of teaching methods to meet their students’ needs [10,11,12]. Studies indicate that efficacious teachers pursue mastery goals and have higher expectations from their students to achieve deep-learning [13,14]. Tschannen-Moran et al. (1998) reported that science teachers who believed in their competency were spending more time teaching and learning and ample time to develop the class curriculum [3]. Furthermore, self-efficacious teachers provide equal learning opportunities for all students regardless of their behavioral or learning difficulties.
Teachers’ self-efficacy shapes the class environment such that self-efficacious teachers tend to create supportive and motivational classrooms that lead to students’ higher academic outcome [15]. Recent literature on teacher self-efficacy has also indicated the positive impact of high levels of teachers’ sense of efficacy on their interpersonal relationship with students [16,17].
A large number of published studies have highlighted that teachers’ self-efficacy is related to students’ academic achievement [3,18,19,20,21]. For instance, secondary and high school students indicated remarkably higher academic achievement in science when their teachers had high levels of self-efficacy [22]. It should be noted that the link between teacher self-efficacy and student’s academic achievement is not conclusive as there are studies finding no correlation between the two [23]. On the other hand, prior literature has linked students’ self-efficacy to teachers’ self-efficacy [3,24]. The significance of students’ self-efficacy cannot be overlooked due to its salient impact on their motivation that finally influences their academic achievement [25,26,27].
There is ample evidence implicating the importance of teachers’ self-efficacy and its impact on both teachers and students. This also implies the importance of a reliable and valid measurement of teachers’ self-efficacy. To date, several instruments have been developed for this purpose with the Teacher Efficacy Scale (TES) being the first one developed by Gibson and Dembo in 1984 [5]. TES is one of the most widely used instruments in measuring teachers’ self-efficacy and has been used for developing other scales such as the Teachers’ Sense of Efficacy Scale (TSES) developed by Tschannen-Moran and Woolfolk Hoy [7] and other subject-specific measures such as teaching mathematics [28] and teaching science [29]. With respect to subject-specific measures of teacher self-efficacy, Bleicher [30] stated that the development of the Science Teaching Efficacy and Beliefs Instrument (STEBI) by Riggs and Enochs [31], as a reliable and valid measure of teacher self-efficacy, was an important contribution to the area of research on teacher self-efficacy. Several other instruments for assessing teacher self-efficacy in other disciplines were developed based on the STEBI (e.g., [32,33]). The validation study of the STEBI for pre-service teachers by Bleicher [30] found similar factor structure and comparable factor loadings as well as significant mean differences between gender, number of science courses taken and science teaching experience as additional evidence of the sound psychometric properties of the STEBI. It should be noted that there are two versions of the STEBI: STEBI-A [31] was developed to measure self-efficacy of in-service teachers and STEBI-B [34] was developed to measure self-efficacy of pre-service teachers; both versions were created by Riggs and Enochs in 1990. The STEBI in this study refers to STEBI-A as the instrument under study.
The STEBI has been used in several studies such as the Pan-Canadian Assessment Program (PCAP) in Canada to measure teachers’ self-efficacy in teaching Science. Shroyer, Riggs, and Enochs’s [35] review of several international studies that used or adapted the STEBI suggests that cross-cultural differences as well as diversity in coursework, field experiences, and characteristics of respondents can influence self-efficacy beliefs. It is noteworthy to mention that the STEBI was developed and validated in the United States which has critical differences compared to the Canadian educational context such as a different curriculum and not using provincial or national large-scale assessments as in Canada for assessing the performance of schools and teachers [36]. Such differences are important. For example, not using the results of large-scale assessments for evaluating the performance of schools and teachers can shift the focus of teaching towards meaningful learning rather than doing well on a competitive large-scale test [37]. As mentioned by DeVellis [38], the cross-cultural comparison of scales can provide validity evidence of a scale before being used in a new context. Given this statement and the above-mentioned points and the fact that there is no Canadian validation of the STEBI, the psychometric re-examination of the STEBI is vital and can shed light on the probable shortcomings of this scale in the Canadian context. Furthermore, the results of this study can provide additional insights into the reliability and validity of the STEBI through re-examining psychometric properties of the tool in a different context.
2. Materials and Methods
2.1. Data
The data from teacher self-efficacy surveys, as implemented in the teacher’s questionnaire of the Pan-Canadian Assessment Program (PCAP) in 2013, were used in the current study. The main purpose of PCAP is “to determine whether students across Canada reach similar levels of performance in core disciplines at about the same age, and to complement existing jurisdictional assessments with comparative Canada-wide data on the achievement levels attained by Grade 8/Secondary II school students across the country” [39] (p. 9). PCAP is a paper-and-pencil test and consists of three assessment domains: reading, mathematics, and science. In the PCAP 2013 study, science was the predominant domain and reading and mathematics were minor domains. In addition, PCAP 2013 was comprised of three contextual questionnaires: one for students, one for their Grade 8/Secondary II school science teacher, and one for school principals. The comprehensive structure of those three questionnaires was originated from the Wang, Haertel and Walberg synthesis of research on factors associated with school learning [40]. The science teachers of Grade 8/Secondary II school, whose students took part in the assessment, were asked to fill out a Teacher Questionnaire. This questionnaire contains six sections, as follows:
- Personal information (e.g., gender, education and experience);
- Professional development (PD) (e.g., the number of PD days);
- Time management in the classroom;
- Assessment practices including types of assessment and marking;
- Teaching strategy;
- Science-teaching efficacy and beliefs (as measured by the Science Teaching Efficacy and Beliefs Instrument).
PCAP is administered every three years by the Council of Ministries of Education, Canada (CMEC). The PCAP data are made available via CMEC for research purposes.
2.2. Participants
Ten provinces in Canada participated in PCAP 2013. In total, 1630 secondary school science teachers from about 1500 public schools across Canada responded to the survey questions; 766 (47.0%) of the teachers self-identified themselves to be male, 850 (52.1%) self-identified as females, and 14 (0.9%) chose not to disclose their gender. About 50% of the teachers had between 5 to 15 years of teaching experience and 78.1% of them had a Bachelor’s degree or equivalent.
2.3. Instrument
As mentioned earlier, only the science-teaching efficacy and beliefs portion of the teacher’s questionnaire in PCAP 2013 is considered in this study. This portion of the questionnaire utilized the original STEBI questions. The CMEC administrators changed the response options in PCAP 2013 to a 4-point Likert style as opposed to the original instrument that used a 5-point Likert style (i.e., 1 = strongly disagree, 2 = disagree, 3 = uncertain, 4 = agree and 5 = strongly agree) by omitting the middle response. No reasoning was provided for this change in the technical report of PCAP 2013. As pointed out by Morris and her colleagues [41], this omission could be due to previous critiques of the instrument in which using “uncertain” as the response option was deemed to be irrelevant to the definition of self-efficacy because no one has neutral self-efficacy. The STEBI is comprised of two main factors: the Personal Science Teaching Efficacy Beliefs (PSTE) with 13 items and the Science Teaching Outcome Expectancy (STOE) with 12 items. A total of 13 items (i.e., 5 in PSTE and 8 in STOE) should be reverse coded in order to produce consistent scores. The PSTE subscale measures teachers’ beliefs about their own ability to teach science effectively. An example of an item on the PSTE subscale is “even if I try very hard, I do not teach science as well as I will most subjects”. On the other hand, the STOE subscale measures teachers’ overall views on science teaching related to students’ learning performance. An example of an item on the STOE subscale is “when a student does better than usual in science, it is often because the teacher exerted a little extra effort”. Riggs and Enochs [31] reported Cronbach’s Alpha values of 0.92 and 0.77 for PSTE and STOE, respectively. A review by Henson, Kogan and Vacha-Haase [42] found that the PSTE subscale yielded more reliable scores across several studies than the STOE subscale.
2.4. Analysis
The data were analyzed using R software [43]. Following Riggs and Enochs (1990) study, an exploratory factor analysis (EFA) was conducted to explore the factorial structure of the STEBI. The Principal Axis Factoring method was chosen as the factor extraction technique and both orthogonal and oblique rotations were examined. In order to determine the appropriate number of extracted factors, a parallel analysis [44] was also carried out. Next, Tucker’s coefficient of congruence [45] was utilized to assess the degree of similarities between the original factor structure of the STEBI and the factor structure obtained from PCAP 2013 data. The Cronbach’s alpha was also used to estimate the reliability coefficient.
3. Results
Primarily, the Mahalanobis and Cook’s values were calculated in order to find out whether there are any outliers in the data set. Since the scale contains 25 items, the Chi-square value of 52.62 with regards to df =25 at α = 0.001 was selected as the critical value. In the first stage of analysis, the Mahalanobis distance measure was estimated for each subject and 65 cases exceeded the critical value of Chi-square. Those cases were then coded as 1 and the rest as 0, and the Cook’s value was calculated for cases coded as 1. No case had a Cook’s value greater than 1. Consequently, no cases were removed from the data set.
To ensure that the data are suitable for the factor analysis, diagnostic tests were done. The determinant value was 0.001, showing that there is no basis for concern for multicollinearity. Also, the Kaiser-Meyer-Olkin (KMO) of 0.931 and the significant (i.e., p-value ≤ 0.0001) results for the Bartlett’s test showed the sampling adequacy for conducting the exploratory factor analysis.
Initial EFA revealed four factors with eigenvalues greater than one. These four factors accounted for about 46% of the total variance (Figure 1). As mentioned by Costello and Osborne [46], using the criterion of eigenvalues greater than one for retaining factors is among the least accurate methods and they suggested using parallel analysis or Velicer’s minimum average partial (MAP) criteria. The parallel analysis showed that the fourth factor can be safely excluded from the analysis. A follow-up analysis using Velicer’s MAP criteria revealed the adequacy of a two-factor solution (Figure 2).
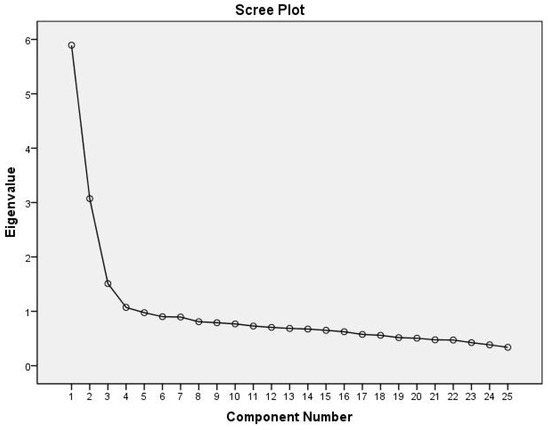
Figure 1.
Scree plot of the initial exploratory factor analysis (EFA).
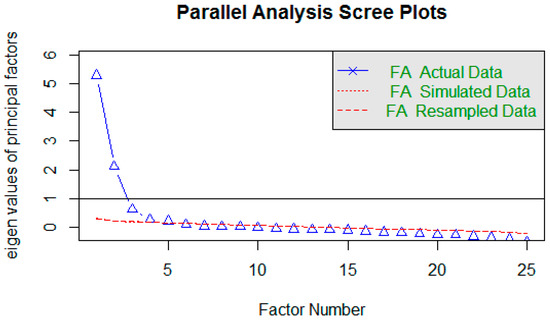
Figure 2.
Parallel analysis.
The first and second factors accounted for 23.576 and 12.290 percent of the total variance, respectively. Next, two EFAs were conducted applying an orthogonal rotation with Varimax and an oblique rotation with Direct oblimin (i.e., delta = 0) with two factors. The oblique solution showed a correlation coefficient of 0.14 between the two factors which indicated a weak relationship. The Tucker’s coefficient of congruence (TCC) was computed in order to assess the similarities between these two-factor solutions and the original STEBI. The TCC for PSTE was calculated as follows:
The same formula was used for calculation of the TCC of STOE subscales. The results showed a TCC value of 0.982 for PSTE and a TCC value of 0.971 for STOE based on the factor loadings obtained from the orthogonal solution. As for the oblique solution, a TCC value of 0.983 was found for PSTE and a TCC value of 0.973 was obtained for STOE. The TCC values show a negligible difference between the oblique and orthogonal solutions. Both solutions show a high level of congruency between the original factor structure of the STEBI as proposed by Riggs and Enochs [31] and the results obtained from the PCAP 2013 data. Table 1 shows the factor loadings obtained from the oblique and orthogonal solutions based on the PCAP 2013 data and the factor loadings reported by Riggs and Enochs [31]. Note that the factor loadings corresponding to each factor are differentiated for ease of reading.

Table 1.
Factor loadings from PCAP 2013 and the original STEBI.
A quick review of the factor loadings from the PCAP data reveals similarity between the two solutions, with a largest difference of 0.03 for item 7 followed by item 16. In comparison with the original solution, the majority of the items from the PCAP data had smaller factor loadings (i.e., 18 items); two items had the same factor loadings (i.e., item 4 and item 18) and 5 items had larger factor loadings (i.e., item 2, item 8, item 9, item 11 and item 19).
Furthermore, in order to assess internal consistency, the Cronbach’s alpha was calculated for each factor separately to compare them with the reliabilities reported for the original scale. The Cronbach’s alpha for PSTE in the original STEBI was 0.97 while in PCAP 2013, it was 0.89; for the STOE, these values were 0.77 and 0.72, respectively. All the items showed a positive contribution to the reliability of the PSTE and STOE by having moderate to strong corrected item–total correlations.
4. Discussion and Conclusions
In this study, the psychometric properties of the Science Teaching Efficacy and Beliefs Instrument (STEBI) by Riggs and Enochs [31] were re-examined in a Canadian context, utilizing data from the Pan-Canadian Assessment Program (PCAP) in 2013. Exploratory factor analysis (EFA) was used to investigate the factorial structure of the STEBI and Cronbach’s alpha was calculated as a measure of reliability.
The results showed adequacy of a two-factor solution and similar overall patterns of factor loadings across orthogonal and oblique rotations. The oblique solution showed a correlation coefficient of 0.14 between the two factors. The Tucker’s coefficient of congruence revealed high degrees of similarity between the original factor structure of the STEBI as proposed by Riggs and Enochs [31] and both the oblique and orthogonal solutions, indicating tenability of the two solutions. Similar to Riggs and Enochs’ [31] study, item 20 (i.e., effectiveness in science teaching has little influence on the achievement of students with low motivation) showed low factor loading value and cross-loadings across PSTE and STOE. Given the similarity between the orthogonal and oblique solutions for the STEBI in this study and considering the fact that human characteristics do not function in isolation, the oblique solution seems to be more rational. On the other hand, some practitioners may argue that the simplicity of orthogonal solutions (i.e., uncorrelated factors) is more desirable in applied settings. The findings of this study showed that both solutions can provide adequate and acceptable approximation to the original STEBI.
In terms of reliability analysis, both factors had reliability coefficients lower than the original scale. Several factors may have contributed to such findings. For example, the original STEBI was based on a 5-point Likert style but the middle option (i.e., uncertain) was removed in the PCAP 2013 survey which may have affected response behavior. As mentioned before, the original study took place in the United States but PCAP was administered in Canada, thus differences in terms of culture and the educational system could be another reason for these findings. As mentioned by the American Psychological Association (APA) Task Force on Statistical Inference, an instrument is not reliable or unreliable as reliability is a property of the scores for a given population of examinees [47]. This emphasizes the need for psychometric re-examination of a scale within a new context and for different populations of examinees. A cross-cultural study examining the factorial structure of the STEBI with the consideration of relevant contextual factors (e.g., demographic variables collected in PCAP) can shed more light on the observed differences found in this study. The STOE subscale showed lower reliability. This finding suggests that STOE is more susceptible to errors of measurement and it could also be due to its questionable construct validity [3]. The main difference between the PSTE and STOE is that the PSTE subscale is focused on personal beliefs but STOE is focused on the potential effects on students’ learning outcomes. This futuristic nature of STOE may contribute to its subjectivity and, consequently, to its lower reliability. Another threat to using STOE for practical and research purposes is the effect of low reliability on correlation coefficient. The correlation between STOE and other variables would be underestimated due to low reliability. This phenomenon is known as correlation attenuation due to unreliability [38].
Further research can provide more diagnostic information on the potential sources of low reliability. A differential item functioning (DIF) analysis can potentially reveal some probable causes for low reliability such as systematic bias in items across groups (e.g., male vs female). Another viable study is to examine the standard error of measurement conditional on each score on the STEBI rather than an overall reliability estimate for the whole scale. Analyzing the conditional standard error of measurement (CSEM) can reveal score intervals in which the scale and subscale scores are performing better and with less error of measurement. Based on our findings, it is arguably important to revisit and revise the STOE in order to improve its construct validity. Otherwise, it could be removed or replaced with another construct. If practitioners are willing to use this scale, they need to pay particular attention to some of the limitations associated with the STOE. One potential remedy could be using the formula for correcting attenuation due to unreliability and then using the corrected correlation coefficient between STOE and other variables. Another alternative would be using Structural Equation Modeling (SEM), instead of traditional statistical methods, which can take into account the measurement error while studying the relationships between the STEBI and other variables. One last important point to mention is the fact the STEBI was originally developed for elementary teachers but our analysis with secondary school science teachers showed its potential for use with secondary school science teachers as well. Whether it is used for elementary or secondary school teachers, the STEBI could be considered as a tool for reflective purposes while re-thinking about science teaching practices. For example, the PSTE subscale can be used for monitoring personal beliefs about teacher self-efficacy in teaching science over time and the STOE can be used for more general teaching purposes such as adjusting one’s expectations about students’ learning performance in relation to science teaching practices.
Author Contributions
Conceptualization, N.M. and A.M.; methodology, A.M.; software, N.M.; validation, N.M. and A.M.; formal analysis, N.M.; data curation, N.M.; writing—original draft preparation, N.M.; writing—review and editing, A.M.; supervision, A.M.
Funding
This research received no external funding.
Conflicts of Interest
The authors declare no conflict of interest.
References
- Bandura, A. Social Foundations of Thought and Action; Pearson Publications: Englewood Cliffs, NJ, USA, 1986. [Google Scholar]
- Bandura, A. (Ed.) Self-Efficacy in Changing Societies; Cambridge University Press: Cambridge, UK, 1995. [Google Scholar]
- Tschannen-Moran, M.; Hoy, A.W.; Hoy, W.K. Teacher efficacy: Its meaning and measure. Rev. Educ. Res. 1998, 68, 202–248. [Google Scholar] [CrossRef]
- Bandura, A. Self-efficacy: toward a unifying theory of behavioral change. Psychol. Rev. 1977, 84, 191. [Google Scholar] [CrossRef] [PubMed]
- Gibson, S.; Dembo, M.H. Teacher efficacy: A construct validation. J. Educ. Psychol. 1984, 76, 569. [Google Scholar] [CrossRef]
- Schunk, D.H. Social cognitive theory and self-regulated learning. In Self-Regulated Learning and Academic Achievement; Springer: New York, NY, USA, 1989; pp. 83–110. [Google Scholar]
- Tschannen-Moran, M.; Hoy, A.W. Teacher efficacy: Capturing an elusive construct. Teach. Teach. Educ. 2001, 17, 783–805. [Google Scholar] [CrossRef]
- Tschannen-Moran, M.; Hoy, A.W. The differential antecedents of self-efficacy beliefs of novice and experienced teachers. Teach. Teach. Educ. 2007, 23, 944–956. [Google Scholar] [CrossRef]
- Wang, H.; Hall, N.C.; Rahimi, S. Self-efficacy and causal attributions in teachers: Effects on burnout, job satisfaction, illness, and quitting intentions. Teach. Teach. Educ. 2015, 47, 120–130. [Google Scholar] [CrossRef]
- Allinder, R.M. The relationship between efficacy and the instructional practices of special education teachers and consultants. Teach. Educ. Spec. Educ. 1994, 17, 86–95. [Google Scholar] [CrossRef]
- Fackler, S.; Malmberg, L.E. Teachers’ self-efficacy in 14 OECD countries: Teacher, student group, school and leadership effects. Teach. Teach. Educ. 2016, 56, 185–195. [Google Scholar] [CrossRef]
- Gabriele, A.J.; Joram, E. Teachers’ reflections on their reform-based teaching in mathematics: Implications for the development of teacher self-efficacy. Act. Teach. Educ. 2007, 29, 60–74. [Google Scholar] [CrossRef]
- Cho, Y.; Shim, S.S. Predicting teachers’ achievement goals for teaching: The role of perceived school goal structure and teachers’ sense of efficacy. Teach. Teach. Educ. 2013, 32, 12–21. [Google Scholar] [CrossRef]
- Wolters, C.A.; Daugherty, S.G. Goal structures and teachers’ sense of efficacy: Their relation and association to teaching experience and academic level. J. Educ. Psychol. 2007, 99, 181. [Google Scholar] [CrossRef]
- Guo, Y.; Connor, C.M.; Yang, Y.; Roehrig, A.D.; Morrison, F.J. The effects of teacher qualification, teacher self-efficacy, and classroom practices on fifth graders’ literacy outcomes. Elem. Sch. J. 2012, 113, 3–24. [Google Scholar] [CrossRef]
- Leroy, N.; Bressoux, P.; Sarrazin, P.; Trouilloud, D. Impact of teachers’ implicit theories and perceived pressures on the establishment of an autonomy supportive climate. Eur. J. Psycho. Educ. 2007, 22, 529. [Google Scholar] [CrossRef]
- Mashburn, A.J.; Hamre, B.K.; Downer, J.T.; Pianta, R.C. Teacher and classroom characteristics associated with teachers’ ratings of prekindergartners’ relationships and behaviors. J. Psychoeduc. Assess. 2006, 24, 367–380. [Google Scholar] [CrossRef]
- Caprara, G.V.; Barbaranelli, C.; Steca, P.; Malone, P.S. Teachers’ self-efficacy beliefs as determinants of job satisfaction and students’ academic achievement: A study at the school level. J. Sch. Psychol. 2006, 44, 473–490. [Google Scholar] [CrossRef]
- Mojavezi, A.; Tamiz, M.P. The Impact of Teacher Self-efficacy on the Students’ Motivation and Achievement. Theory Pract. Lang. Stud. 2012, 2. [Google Scholar] [CrossRef]
- Muijs, D.; Reynolds, D. Teachers’ beliefs and behaviors: What really matters? J. Classr. Interact. 2002, 37, 3–15. [Google Scholar]
- Ross, J.A. Teacher efficacy and the effects of coaching on student achievement. Can. J. Educ. 1992, 17, 51–65. [Google Scholar] [CrossRef]
- Taştan, S.B.; Davoudi, S.M.M.; Masalimova, A.R.; Bersanov, A.S.; Kurbanov, R.A.; Boiarchuk, A.V.; Pavlushin, A.A. The Impacts of Teacher’s Efficacy and Motivation on Student’s Academic Achievement in Science Education among Secondary and High School Students. EURASIA J. Math. Sci. Technol. Educ. 2018, 14, 2353–2366. [Google Scholar] [CrossRef]
- Mahler, D.; Großschedl, J.; Harms, U. Does motivation matter?—The relationship between teachers’ self-efficacy and enthusiasm and students’ performance. PLoS ONE 2018, 13, e0207252. [Google Scholar] [CrossRef]
- Miller, A.D.; Ramirez, E.M.; Murdock, T.B. The influence of teachers’ self-efficacy on perceptions: Perceived teacher competence and respect and student effort and achievement. Teach. Teach. Educ. 2017, 64, 260–269. [Google Scholar] [CrossRef]
- Linnenbrink, E.A.; Pintrich, P.R. The role of self-efficacy beliefs instudent engagement and learning intheclassroom. Read. Writ. Q. 2003, 19, 119–137. [Google Scholar] [CrossRef]
- Pajares, F. Self-efficacy beliefs, motivation, and achievement in writing: A review of the literature. Read. Writ. Q. 2003, 19, 139–158. [Google Scholar] [CrossRef]
- Zimmerman, B.J.; Bandura, A.; Martinez-Pons, M. Self-motivation for academic attainment: The role of self-efficacy beliefs and personal goal setting. Am. Educ. Res. J. 1992, 29, 663–676. [Google Scholar] [CrossRef]
- Charalambous, C.Y.; Philippou, G.N.; Kyriakides, L. Tracing the development of preservice teachers’ efficacy beliefs in teaching mathematics during fieldwork. Educ. Stud. Math. 2008, 67, 125–142. [Google Scholar] [CrossRef]
- Çakiroglu, J.; Çakiroglu, E.; Boone, W.J. Pre-Service Teacher Self-Efficacy Beliefs Regarding Science Teaching: A Comparison of Pre-Service Teachers in Turkey and the USA. Sci. Educ. 2005, 14, 31–40. [Google Scholar]
- Bleicher, R.E. Revisiting the STEBI-B: Measuring self-efficacy in preservice elementary teachers. Sch. Sci. Math. 2004, 104, 383–391. [Google Scholar] [CrossRef]
- Riggs, I.M.; Enochs, L.G. Toward the development of an elementary teacher’s science teaching efficacy belief instrument. Sci. Educ. 1990, 74, 625–637. [Google Scholar] [CrossRef]
- Rohaan, E.J.; Taconis, R.; Jochems, W.M. Exploring the underlying components of primary school teachers’ pedagogical content knowledge for technology education. Eurasia J. Math. Sci. Technol. Educ. 2011, 7, 293–304. [Google Scholar] [CrossRef]
- Mavrikaki, E.; Athanasiou, K. Development and Application of an Instrument to Measure Greek Primary Education Teachers’ Biology Teaching Self-efficacy Beliefs. Eurasia J. Math. Sci. Technol. Educ. 2011, 7, 203–213. [Google Scholar] [CrossRef]
- Enochs, L.G.; Riggs, I.M. Further development of an elementary science teaching efficacy belief instrument: A preservice elementary scale. Sch. Sci. Math. 1990, 90, 694–706. [Google Scholar] [CrossRef]
- Shroyer, G.; Riggs, I.; Enochs, L. Measurement of Science Teachers’ Efficacy beliefs. In The Role of Science Teachers’ Beliefs in International Classrooms; Sense Publishers: Dordrecht, The Netherlands, 2014; pp. 103–118. [Google Scholar]
- Klinger, D. The evolving culture of large-scale assessments in Canadian education. Can. J. Educ. Adm. Policy 2008, 76, 1–34. [Google Scholar]
- Volante, L. An alternative vision for large-scale assessment in Canada. J. Teach. Learn. 2006, 4. [Google Scholar] [CrossRef]
- DeVellis, R.F. Scale Development: Theory and Applications; Sage Publications: Thousand Oaks, CA, USA, 2016; Volume 26. [Google Scholar]
- O’Grady, K.; Houme, K.P. PCAP 2013: Report on the Pan-Canadian Assessment of Science, Reading, and Mathematics; Council of Ministers of Education: Toronto, ON, Canada, 2015. [Google Scholar]
- Wang, M.C.; Haertel, G.D.; Walberg, H.J. Synthesis of research: What Helps Students Learn? Educ. Leadersh. 1986, 43, 60–69. [Google Scholar]
- Morris, J.E.; Lummis, G.W.; McKinnon, D.H.; Heyworth, J. Measuring preservice teacher self-efficacy in music and visual arts: Validation of an amended science teacher efficacy belief instrument. Teach. Teach. Educ. 2017, 64, 1–11. [Google Scholar] [CrossRef]
- Henson, R.K.; Kogan, L.R.; Vacha-Haase, T. A reliability generalization study of the teacher efficacy scale and related instruments. Educ. Psychol. Meas. 2001, 61, 404–420. [Google Scholar] [CrossRef]
- RCoreTeam. R: A Language and Environment for Statistical Computing; R Foundation for Statistical Computing: Vienna, Austria, 2018. [Google Scholar]
- O’connor, B.P. SPSS and SAS programs for determining the number of components using parallel analysis and Velicer’s MAP test. Behav. Res. Methods 2000, 32, 396–402. [Google Scholar] [CrossRef]
- Tucker, L.R. A Method for Synthesis of Factor Analysis Studies; Personnel Research Section Report No.984; Department of the Army: Washington, DC, USA, 1951.
- Costello, A.B.; Osborne, J.W. Best practices in exploratory factor analysis: Four recommendations for getting the most from your analysis. Pract. Assess. Res. Eval. 2005, 10, 1–9. [Google Scholar]
- Wilkinson, L.; APA Task Force on Statistical Inference. Statistical methods in psychology journals: Guidelines and explanations. Am. Psychol. 1999, 54, 594–604. [Google Scholar] [CrossRef]


© 2019 by the authors. Licensee MDPI, Basel, Switzerland. This article is an open access article distributed under the terms and conditions of the Creative Commons Attribution (CC BY) license (http://creativecommons.org/licenses/by/4.0/).