Article

Critical Consciousness and Schooling: The Impact of the Community as a Classroom Program on Academic Indicators

by
D. Gavin Luter
1,
Austin M. Mitchell
2 and
Henry L. Taylor, Jr.
3,*
1
Wisconsin Campus Compact, University of Wisconsin-Extension, Madison, WI 53706, USA
2
Department of Political Science, Texas A&M University, College Station, TX 77843, USA
3
Department of Urban and Regional Planning, University at Buffalo-State University of New York, Buffalo, NY 14260-1660, USA
*
Author to whom correspondence should be addressed.
Educ. Sci. 2017, 7(1), 25; https://doi.org/10.3390/educsci7010025
Submission received: 22 July 2016 / Revised: 18 January 2017 / Accepted: 19 January 2017 / Published: 7 February 2017

Abstract

:
The present study investigates the extent to which a program guided by the principles of critical pedagogy, which seeks to develop critical consciousness, is associated with the improved academic performance of students attending a low-performance middle-school in Buffalo, New York. The students were enrolled in an in-school academic support program called the Community as Classroom, which used critical project-based learning to show students how to improve neighborhood conditions. The study found that the Community as Classroom program bolstered student engagement as reflected in improved attendance, on-time-arrival at school, and reduced suspensions. Although class grades did not improve, standardized scores, particularly in Math and Science, dramatically improved for these students from the lowest scoring categories. We suspect that given increased student engagement and dramatically improved standardized test scores, teacher bias might be the cause of no improvements in class grades. We conclude that critical pedagogy, which leads to increased critical consciousness, is a tool that can lead to improved academic performance of students. Such a pedagogy, we argue, should be more widely used in public schools, with a particular emphasis on their deployment in Community Schools.

1. Introduction

Urban education is beset with a crisis, but no consensus exists on how best to address it [1,2]. The problem is most intervention strategies focus on “building centered” activities, which stress training and/or replacing principals, professional development, and bolstering student support, including the development of mentoring and after-school programs [3]. On the flipside, intervention strategies that connect school reform to neighborhood development are largely overlooked. By neighborhood development, we are referring to activities that improve housing and physical conditions, strengthen social and institutional processes, develop community capacity and collective efficacy, and bolster community economic development and access to the metropolitan opportunity structure. Even the highly-touted “community school” movement is mostly concerned with “passive” service delivery, rather than engagement in participatory, community-based problem-solving activities that spawn radical neighborhood transformation [4,5].
We argue that school reform strategies will fail until they are connected to the regeneration of these underdeveloped neighborhoods [6,7,8,9]. The reason is such neighborhoods are intermediary determinants of undesirable educational outcomes [10]. Underdeveloped neighborhoods are not just passive sites where everyday life unfolds. Rather, they are supra-individual sociospatial units that effect educational outcomes by erecting physical, social and institutional barriers which thwart critical consciousness, along with the academic performance of young people [6,7,8,9].
In such neighborhoods, we hypothesize that children lack the “motivation” to study because they see little or no relationship between schooling and improved life chances. Daily, they encounter people who invested in the school “dream” but never received much of a return on their investment, and the see schools located in neighborhoods that are dilapidated and rundown. The school, for whatever reasons, could not catalyze desirable change in the community. Consequently, many young people reject the promise of education [11].
There is “motivation”, and then there is critical motivation. By critical motivation, we are referring to a form of motivation that stems from an analysis of neighborhood conditions, the identification of the root causes of neighborhood underdevelopment, and an understanding of the types of activities needed to remedy the situation [12]. Of course, we realize that motivation is not the only barrier to academic success. Other obstacles include parental education level, low-income status [13], neighborhood conditions, and the like [7,8,14,15]. These barriers pose “real” obstacles; critical motivation is nevertheless a powerful force that can help children transcend them.
The community school and university-assisted community school (UACS) models advanced by the University of Pennsylvania’s Netter Center for Community Partnerships seek to connect schooling to neighborhood development, but these “community schools” overemphasize individual and family services designed to ameliorate social situations, while leaving physical and economic environments untouched [6,16,17,18,19]. While such “community school” programs represent a step forward, they will not bolster consciousness by identifying root causes of neighborhood underdevelopment, offering radical transformational strategies and advocating for substantive change [18,20].
In school choice cities, such as Buffalo, New York, connecting school reform to neighborhood development is extremely problematic, because students live and go to school in different neighborhoods. One way to overcome this problem is to use a pedagogy that shows students how to critically analyze and act to change neighborhood conditions [12,19]. Such an approach will motivate students to study and learn, while also engaging them in the life of the school and the neighborhood, because they see a connection between schooling and their ability to change neighborhood conditions. The key to developing such a pedagogy is to create a teaching method that instills critical consciousness (CC) in the children. By CC, we mean (1) developing insight into the root causes of underdeveloped neighborhoods; (2) acquiring insight into role played by elite decision-making, policy-making and investing strategies in producing and sustaining the underdevelopment of urban neighborhoods; and (3) acquiring insight into the intervention strategies that can catalyze change in these communities [4].
This paper assesses the academic performance of student participants in the Community as Classroom (CAC) initiative at Marva J. Daniel Futures Academy, a K-8th grade school located in an underdeveloped neighborhood in Buffalo, New York. The CAC is an in-school academic support program that seeks to improve the academic performance of students by teaching them how to critically analyze, understand and change conditions in their neighborhood. These types of academic activities eventuate critical consciousness and improved academic performance. The program operates from this assumption: as the student’s critical consciousness increases, so too will his/her desire to learn, thereby bolstering academic performance. Critical consciousness (CC) is thus a mediating variable between motivation and improved academic performance.
The present study investigates the impact that a program designed to bolster CC has on the academic performance of students attending a low-performance school in Buffalo, New York. We examined standardized test scores, class grades, discipline referrals, attendance and tardies over a three-year period to test the hypothesis that the CAC improves academic performance. The paper is divided into the following sections. Section 2 provides an overview of the CAC and the theoretical postulates undergirding it, while Section 3 details the methodology, Section 4 reports the results of the statistical tests, and Section 5 discusses the implications of the results. Concluding remarks are offered in Section 6.

2. Critical Consciousness and the Community as Classroom Initiative

The CAC initiative is premised on the idea that students living in underdeveloped neighborhoods do not see a connection among schooling, education, and improvement in their life chances and the development of their neighborhoods. This sense of unhopefulness—a belief that social and institutional processes do not work on their behalf—smothers motivation and spawns academic underachievement. The CAC program aims to change this outlook by showing students how to critically analyze and change the socioeconomic and physical conditions in their communities. In the program, some activities are simulated ones that are designed to enhance understanding of neighborhood underdevelopment, while others are action-oriented ones designed to bring about “real” neighborhood change. In all instances, the goal is to increase critical consciousness by deepening understanding of the root causes of neighborhood underdevelopment and by showing students how to bring about desirable neighborhood change [4].

2.1. Understanding the Underdeveloped Neighborhoods Problem

The definition of “neighborhood” and “underdeveloped neighborhoods” are two of the most important concepts that students must learn in our program. Neighborhoods are defined as multi-tier, supra-individual sociospatial units that exist at three interactive levels: physical, social, and institutional. Neighborhoods are thus dynamic places that fall along a continuum ranging from highly developed to highly underdeveloped [7]. The status of a neighborhood, then, is determined by decision-making, policy-making, and investing strategies; and neighborhood inequities and disparities are based on power relationships that determine how human and fiscal resources are invested. The neighborhood is thus a process, and its trajectory is driven by the dialect between development and underdevelopment.
In this conceptual framework, “neighborhood change” occurs in an environment driven by systemic structural racism and operates in the context of a metropolitan city building process informed by a neoliberal real estate market. Developed neighborhoods, in this scenario, privilege their mostly white residents and produce desirable socioeconomic outcomes; while underdeveloped neighborhoods constrain their mostly national minority residents and produce undesirable socioeconomic outcomes. These underdeveloped neighborhoods, then, function as intermediary determinants of undesirable socioeconomic outcomes [10,21].
It is extremely important that our students understand the distinction between developed and underdeveloped neighborhoods and know these differences are driven by the trilogy of elite decision-making, policy-making and investing strategies operating in the context of a neoliberal real estate market and the metropolitan city building process. Without such knowledge, the children will attribute neighborhood underdevelopment to the behavior of their neighbors. Concurrently, we want students to know that “agency” gives residents the power to transform these underdeveloped neighborhoods. Neighborhood status, then, is not immutable and fixed in time and space. Neighborhoods are sites of oppression and resistance. Undesirable neighborhood conditions will always produce resistance, and through agency—collective action—the residents have the power to bring about change [21,22,23].
In the CAC, student knowledge and understanding of these concepts are the foundation upon which CC is built [24,25,26]. Watts and his colleagues [12] defined CC as critical reflection, critical motivation, and critical action, which suggests that CC is a relational concept that cannot be developed without social interaction with others (peers and adults). CC is amplified when students learn the concept through engagement with underdeveloped neighborhoods [27]. The reason is this: learning is animated when students grapple with real-world problems that are meaningful to them. In the CAC model, this insight makes students conscious of the political and socioeconomic forces that drive the underdevelopment of their neighborhoods. Self-determination theory explains how such knowledge, when combined with belief in the possibility of change spawns critical motivation [26,28,29,30,31].
Lastly, in the CAC program, self-efficacy is an integral part of the definition of CC. Self-efficacy is defined as the belief in one’s ability to complete tasks and reach goals if they follow a defined course of action. When this belief (self-efficacy) is fused with critical consciousness it reinforces agency and leads to heightened critical motivation [32,33,34,35,36,37,38,39,40]. Critical motivation is intensified when it is fueled by an understanding of concrete neighborhood conditions and belief in one’s ability to bring about change [41,42].

2.2. Community Schools and Neighborhood Development

Connecting schools to neighborhood development is a concept that has gained significant traction in recent years by scholars from across the country [43,44,45,46,47,48,49]. Warren [48] (p. 145) says that the “community schools” model represents a “new vision of urban school reform”, which “build[s] social capital around the holistic provision of services to children and their families.” Educational scholar Terrance Green [44] posits that school staff and administrators linked community schools to community development in four interrelated ways: (1) developing a broad vision for the school and community; (2) positioning the school as a spatial community asset; (3) championing community concerns at the school; and (4) changing school culture to support neighborhood development. Although progressive, these approaches are nonetheless “building-centered” and “service-based” activities that do not focus on the physical and socioeconomic transformation of the community. The Community as Classroom (CAC) Initiative contributes to the conceptualization of the community schools by showing how to enhance student engagement and improved academic performance by working with residents to radically change neighborhood conditions [47,49]. In the next section, we will discuss the CAC in greater detail.

2.3. The Program

The University at Buffalo (UB) Center for Urban Studies developed the CAC as an in-school academic support program that works with students when they are not in the regular classroom. Consequently, our weekly contact hours with students is limited to between one or two hours. Within this constraint, the CAC coordinator works closely with the principal and teachers to select program participants. CAC students are not cherry picked, but are selected from a varied pool, consisting of underachievers and those with disciplinary problems. After an initial meeting, we are given a list of students permitted to participate in the program. Futures Academy is a low-performing school, so the teachers and administrators are particularly anxious to see if we can improve the engagement and/or academic performance of underachieving students. Thus, we typically have a diverse group of middle schoolers participating in the CAC. Once selected, if possible, we work with the same students until they graduate.
Children can participate in one of four interactive programs: (1) Community as Art; (2) Community Heritage; (3) Clean-A-Thon/Urban Gardening Project, and (4) Future City. (1) The Community as Art program serves between 50–70 fifth and sixth graders, and shows them how to use public art to transform the neighborhood’s visual landscape by turning abandoned housing, buildings and vacant lots into community assets; (2) The Community Heritage program serves between 10–15 seventh or eighth graders and shows them how to use the neighborhood’s past to understand its present and guide its future development; (3) The Clean-A-Thon/Urban Gardening project, serves between 10–15 seventh graders, and is based on the Kwanza principal of Ujamaa—collective work and responsibility—a concept that undergirded the Tanzania economy of Julius Nyerere in 1961. The aim is to engage students in the ongoing development of the Fruit Belt neighborhood as a healthy neighborhood. Each year, they organize a day-long neighborhood clean-up and festival, which involves the entire school and hundreds of community residents in eliminating blight and trash, along with upgrading the community garden, and opening Futures Artpark.
Lastly, the Future City competition engages 10–20 eighth grade students in a simulated problem-solving activity with real world implications. This program teaches students about the role of public policy in shaping the neighborhood’s physical and social environment. Each year, as part of a national competition sponsored by DisoverE, a national engineering foundation, students produce a scaled model of a re-imagined central city designed to solve a simulated, technology-based urban problem. The students learn how to use the SimCity software to create a re-imagined, virtual central city, designed to complement the scaled model. Then, they write an essay that explains their solution to the simulated urban problem. To connect the simulated problem to the realities of the students, we encourage them to situate their problem in a virtual Buffalo City. Collectively, these four programs aim to deepen the student’s understanding of the root causes of neighborhood underdevelopment and gain insight into ways to catalyze neighborhood transformation. For example, the Community as Art, Community Heritage, and the Clean-A-Thon/Urban Garden projects all have “learning” and “doing” components.
The CAC is about more than just “project-based” learning. Students must work on projects that deepen their knowledge and understanding of the neighborhoods in which they live and show how they can bring about change in them. For example, Futures Academy was fronted by a series of unkempt vacant lots, which disfigured the school setting. The students studied the history of the block, and discovered it was once home to a deli, and several houses of German immigrants. Those unkept vacant lots once anchored a community. The students decided to redesign the lots as an ArtPark and community garden to symbolize and remember the past community. The UB Center worked with the students to gain control over the land and to obtain the resources necessary to redevelop it. After two years of planning and development, the block of unkept vacant lots was transformed into a community garden and an ArtPark.
Projects such as these teach students that the purpose of education is not only to acquire the knowledge and skills needed to earn a living, but it also to equip them to radically change the communities in which we live. We want children to love and value their neighborhoods; rather than view them as “tough” places they need to escape from. The goal is to understand why they are “tough” places, so that they can be radically changed. Lastly, as the above example suggests, CAC programs are interactive, rather than developmental. Although each program is unique, they nevertheless complement each other, and community building and neighborhood development are the activities that connect them. A final project is produced in each program, which is shared with other student participants, building staff, and community members. This way, the program activities reinforce each other (Figure 1).
Teachers of the program are graduate students in the College of Education and the School of Architecture and Planning. The student teachers go through a rigorous training program based on a structured curriculum and set of learning objectives that the UB Center has developed. By standardizing our approach, we are able to maintain continuity across time. In addition, we conduct an in-house evaluation of the CAC each year, and use this assessment to continually improve the initiative. Classes last about 40 minutes and occur twice weekly. More details about the program are outlined in Taylor and McGlynn [4].

2.4. Theoretical Foundation

The CAC curriculum is based on the theory that children are more engaged at school, learn better, and at increasingly higher levels, through action-orientated, collaborative, real-world problem solving that is connected to the critical analysis of their social conditions [5,12,50]. Using this theoretical framework, we moved beyond traditional civic education programs, with their focus on good citizenship [51,52]. Instead, our pedagogy focuses on understanding and transforming underdeveloped neighborhoods [53,54].
Westheimer and Kahne [55] identified three types of citizenship, which are related to the CAC approach: personal-responsible citizenship, participatory citizenship, and justice-orientated citizenship. Collectively, the three programs form a typology of civic engagement ranging from being “good citizens” to engaging in volunteerism, voting, and advocating good government, to regularly being involved in community-based activities to fighting for justice. Following Watts et al. [12], we believe that “justice” drives this “good citizen” framework and that notions of “justice” should be informed by a critical social analysis (critical consciousness) that help students understand why conditions are unjust [56]. By critically analyzing neighborhood conditions, students will understand why underdevelopment is intentional, harmful, and unjust [32,57]. Thus, fighting to change these conditions is reflective of “good citizenship.”
Pedagogically, this means getting the students to question things: (1) How would you characterize conditions in your neighborhood [perception based on the stimulus]? (2) Why do these conditions exist [interpretation and meaning]? (3) What causes them [defense of interpretations]? (4) How do they make you feel [emotional and intuitive responses to the stimulus]? (5) How can we turn this neighborhood into a great place to live [action strategies] [56]?
Toward this end, the CAC uses a critical project-based learning methodology that focuses on neighborhood-based problems to teach CC [5,40,58,59,60,61]. This approach aims to strengthen student reading, writing, research, and critical and analytical thinking skills, while deepening their understanding of the root causes of neighborhood conditions. We also believe that this approach will bolster student engagement, including their desire to go to school and take part in classroom activities. Thus, increased CC spawns (critical) motivation and student engagement, which, in turn, drives their desire to attend and do well in school as measured by (1) increased attendance; (2) reduced tardiness; (3) decreased disciplinary actions; (4) improved class grades and (5) improved performance on standardized test scores.
These metrics are surrogate measures for the growth of critical consciousness and motivation among the students, and they are indicators of student engagement. Surrogate measures are always problematic. In our model, we posit that critical consciousness and motivation will catalyze improved academic performance, and this enhanced motivation will be reflected in student engagement without which academic achievement will not eventuate. Thus, if the evaluative research demonstrates that such academic improvement takes place, we theorize that it was driven by increased critical consciousness. While some research evidence does suggest that programs, which aim to involve youth in community-based problem-solving efforts such as youth participatory action research interventions, do improve student achievement [62], more research is required to validate this relationship [32].

3. Research Design

To test the impact of Community as Classroom (CAC) on academic performance, we analyzed data provided by the Buffalo Public Schools (BPS) on attendance, discipline, class grades, and standardized test scores for students at Marva J. Daniel Futures Preparatory School (Futures Academy, Public School 37). The data are pooled cross sections of students ranging from fourth through eighth grade for three academic years of 2011–2012, 2012–2013, and 2013–2014. Because of the sensitivity of the data, BPS supplied it for all students in Futures Academy in de-identified format, but also supplied some identifiable data for CAC students only. Both types of data are used in this analysis. In de-identified data all information that could reasonably be used to identify students is removed (name, address, etc.). Therefore, for obvious reasons, we used the identified data only for students enrolled in the CAC program. The use of both data sets made it possible to compare those students enrolled in the CAC program with all students in grades 4–8. The non-identifiable data includes three years of school performance statistics, and also coding for whether the student was in CAC programming each year. This enables us to compare averaged statistics for students that are in CAC programs to students that are not enrolled in CAC. Importantly, it also allowed us to control and compare the averaged statistics for students before they enrolled in CAC programs or if they left the program before becoming grade-level ineligible.
We utilize multiple regression analysis for all of our statistical tests, but we must also apply estimation according to how each dependent variable is measured in order to obtain valid statistical inferences. To conduct a comprehensive analysis of student outcomes, we employ numerous dependent variables which we discuss below. Our dependent variables have different forms of measurement, and this requires that we apply appropriate estimation procedures based on the type of dependent variable. For instance, class grades as a percent (0–100) are measured on a continuous scale but standardized test scores are measured an on ordinal scale of 1–4. We apply either ordinary least squares (OLS) or maximum likelihood estimation (MLE) in our multiple regression analyses, according to how the dependent variable is measured. Additionally, we conduct Wald tests to test the differences between coefficients for CAC enrollment status. In OLS models, the Wald test is a simple F test but in MLE models the Wald test requires a Chi2 distribution [63]. When we report the results of these Wald type Chi2 tests, the results are tests of the differences between the coefficients. We discuss the modeling strategy for each dependent variable, below.

3.1. Dependent Variables

We include a battery of dependent variables to determine the impact of CAC programs on student performance. For attendance, we include average daily attendance (ADA), which is the percentage of all days that a student attends school for all days that the student was enrolled in the school. The number of days enrolled may be less, for instance, if a student transfers schools. We use OLS models to test ADA outcomes because ADA is a continuous variable. OLS is the most unbiased and efficient estimator when data are continuous [64].
Our second attendance measure is the number of tardies per school year. Since this is a count measure, we employ negative binomial models to test tardies. When a dependent variable is limited, such as dichotomous, count, ordinal, or nominal variables, the OLS assumption that the residuals are normally distributed is no longer a valid assumption. MLE methods, such as negative binomial models, provide estimation which better approximates the data generating process [65]. Two dependent variables measure disciplinary outcomes, the number of suspensions and the number of days suspended during the school year. Both of these disciplinary variables are also count measures, and negative binomial models are also used for disciplinary tests.
Class grades are measured as the percentage score (0 to 100) per quarter semester. Classes that provide grades of simple pass/fail (or satisfactory/unsatisfactory) are excluded from the analysis. There are six different classes included in the analysis, as well as a measure of aggregate scores across all classes per quarter semester. The averaged aggregated scores and include classes in addition to the six individual class scores (Foreign Language, Health, Home Science, Music, Technology, and other classes). The six individual class score variables are Art, English, Math, Physical Education, Science, and Social Studies. Since class scores are measured on an interval/ratio scale, we use OLS models to test class grades.
Standardized test scores are measured according to New York State Department of Education (NYSED) performance levels. These scores are on an ordinal scale of 1–4, where a score of 1 represents well below proficiency for the grade level, 2 represents partially proficient, 3 is proficient, and 4 is excelling the standards of the grade level [66]. Standardized tests are offered for grades 3–8 in English Language Arts (ELA) and Math, but only grades 4 and 8 are offered in Science. Third grade ELA and Math scores are excluded from the analysis. Since the scores are measured on an ordinal scale which is a limited dependent variable, the MLE estimation of ordinal logit is used to test standardized score outcomes.

3.2. Independent and Control Variables

The main independent variables are dichotomous measures of a student’s enrollment status in the CAC program. We categorize enrollment status into four groups. Never CAC is for students who do not enroll in CAC for any years within the data. Students that are unenrolled in CAC for a given year but will enroll in the next year or two are coded as Before CAC. Students enrolled in the CAC during the current year are coded During CAC. While CAC is only offered until 8th grade, some students drop out of the program before they enter the 9th grade. Students that leave the CAC program before they finish 8th grade are coded as Left CAC for the years they were no longer in the program.
Additionally, we include CAC average daily attendance (ADA) as an independent variable to predict tardies, number of suspensions, and number of days suspended. The CAC ADA is per student in the program, so this variable is only included in models from identifiable data. CAC ADA represents the percentage (0–100) of days a student attended CAC programs for all program-days in which attendance was recorded.
The main control variable in all models is student grade level. Student performance tends to decrease between grades 4 and 8, on average. CAC programs are intended for students in grades 5, 6, 7, and 8. Since some students may not enroll in 5th grade, but may enroll in a later grade, controlling for grade level allows us to include all students in grades 5–8 without presenting bias associated with CAC enrollment for higher grades. Additionally, ADA is included as a control variable in the models of tardies, number of suspensions, and number of days suspended when CAC ADA is the main independent variable. Additional control variables cannot be included because the data are not identifiable.

4. Results

The results for attendance, discipline, class grades, and standardized test scores are presented in both tabular and graphical formats. To aid in the interpretation of the results, each dependent variable has an associated dot plot with 95% confidence intervals that compares the coefficient of Before CAC to each of the other three enrollment categories. These plots help to more clearly show whether the CAC selects students with better performance (Never CAC), whether student performance improves as a result of enrollment in CAC programs (During CAC), and how students that drop out of the program compare with average student performance before enrolling in the CAC (Left CAC). While Before CAC is the base category for the dot plots, Never CAC is the base category for all tabular results.

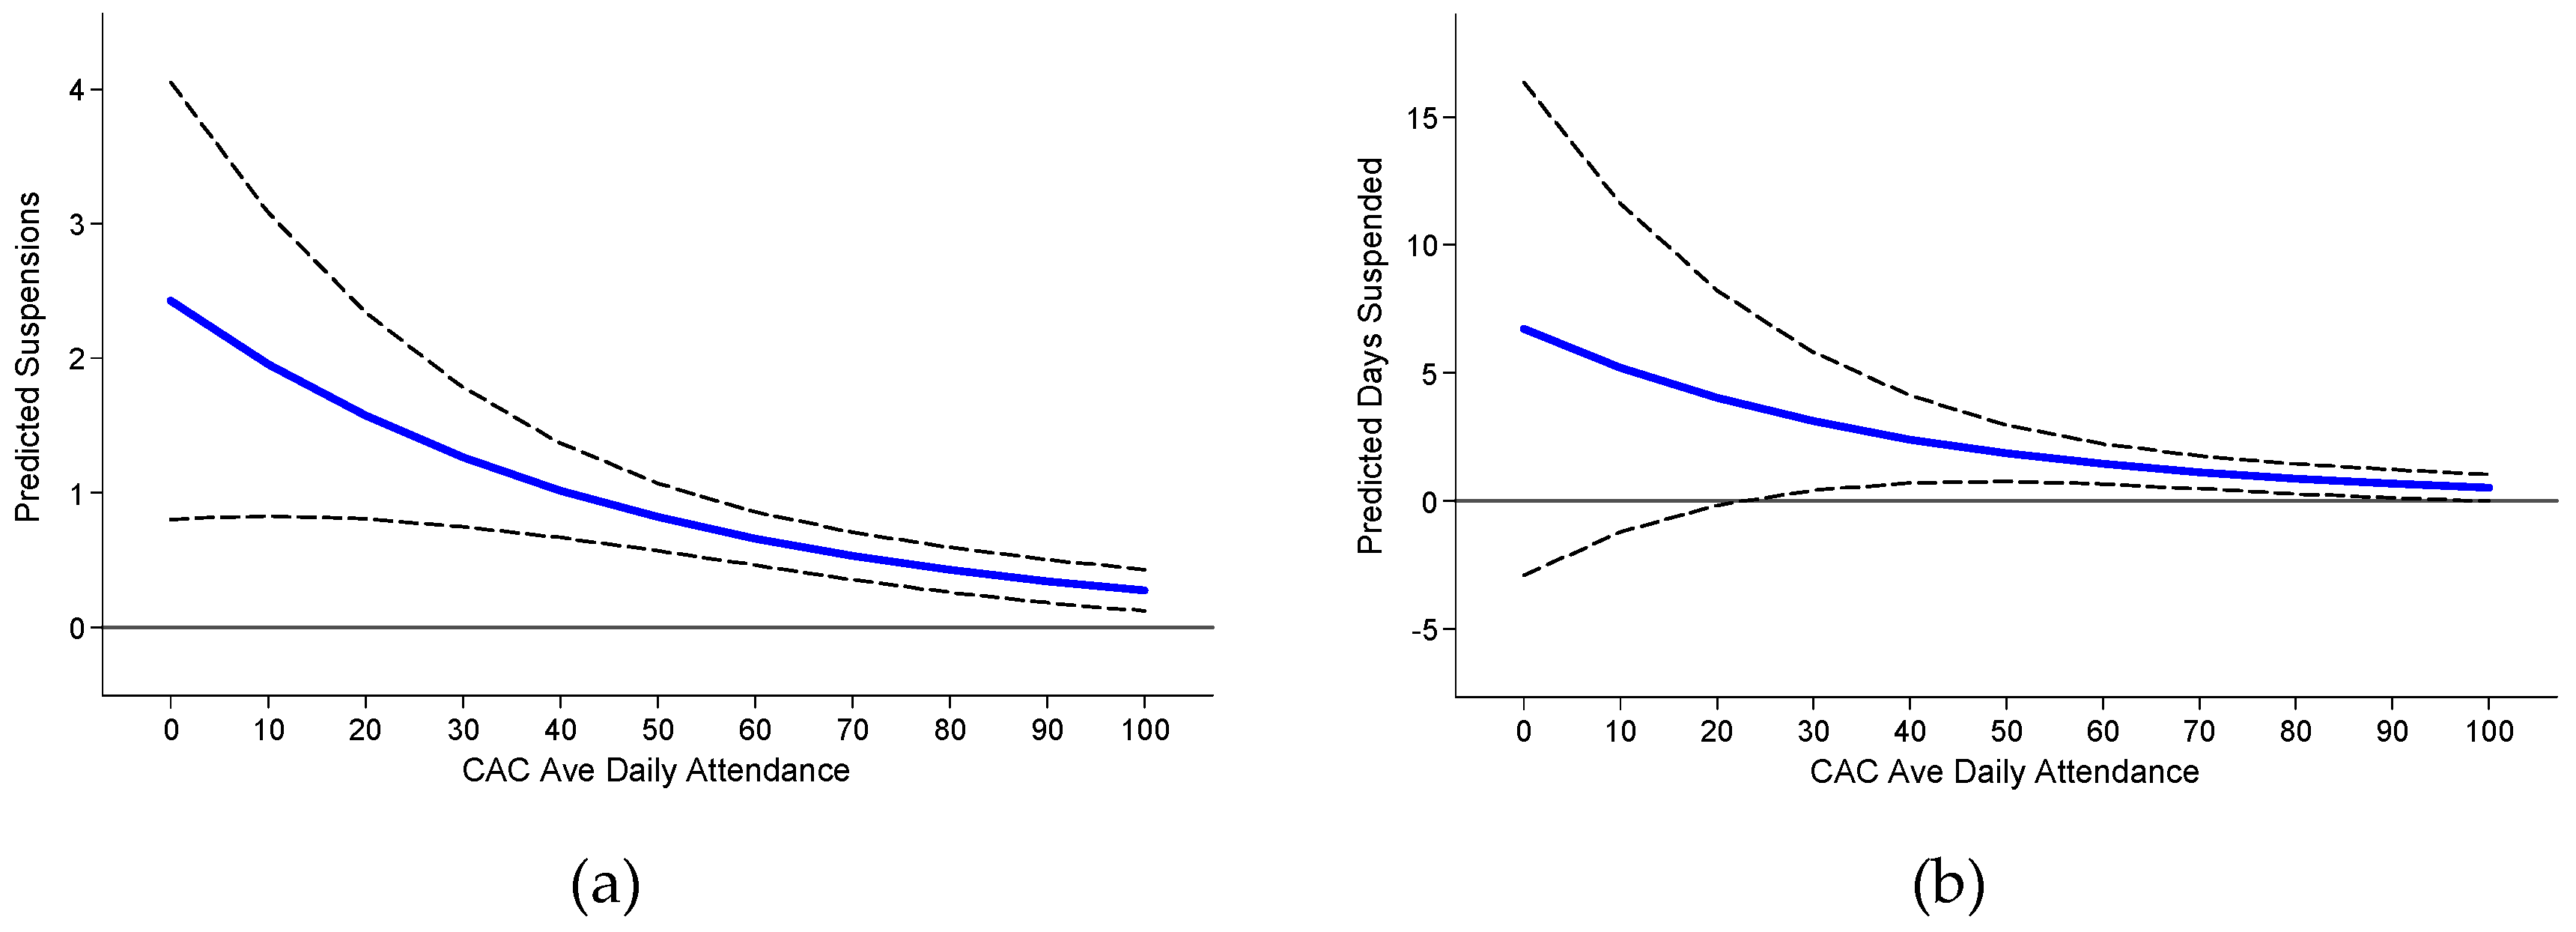
4.1. Attendance and Discipline
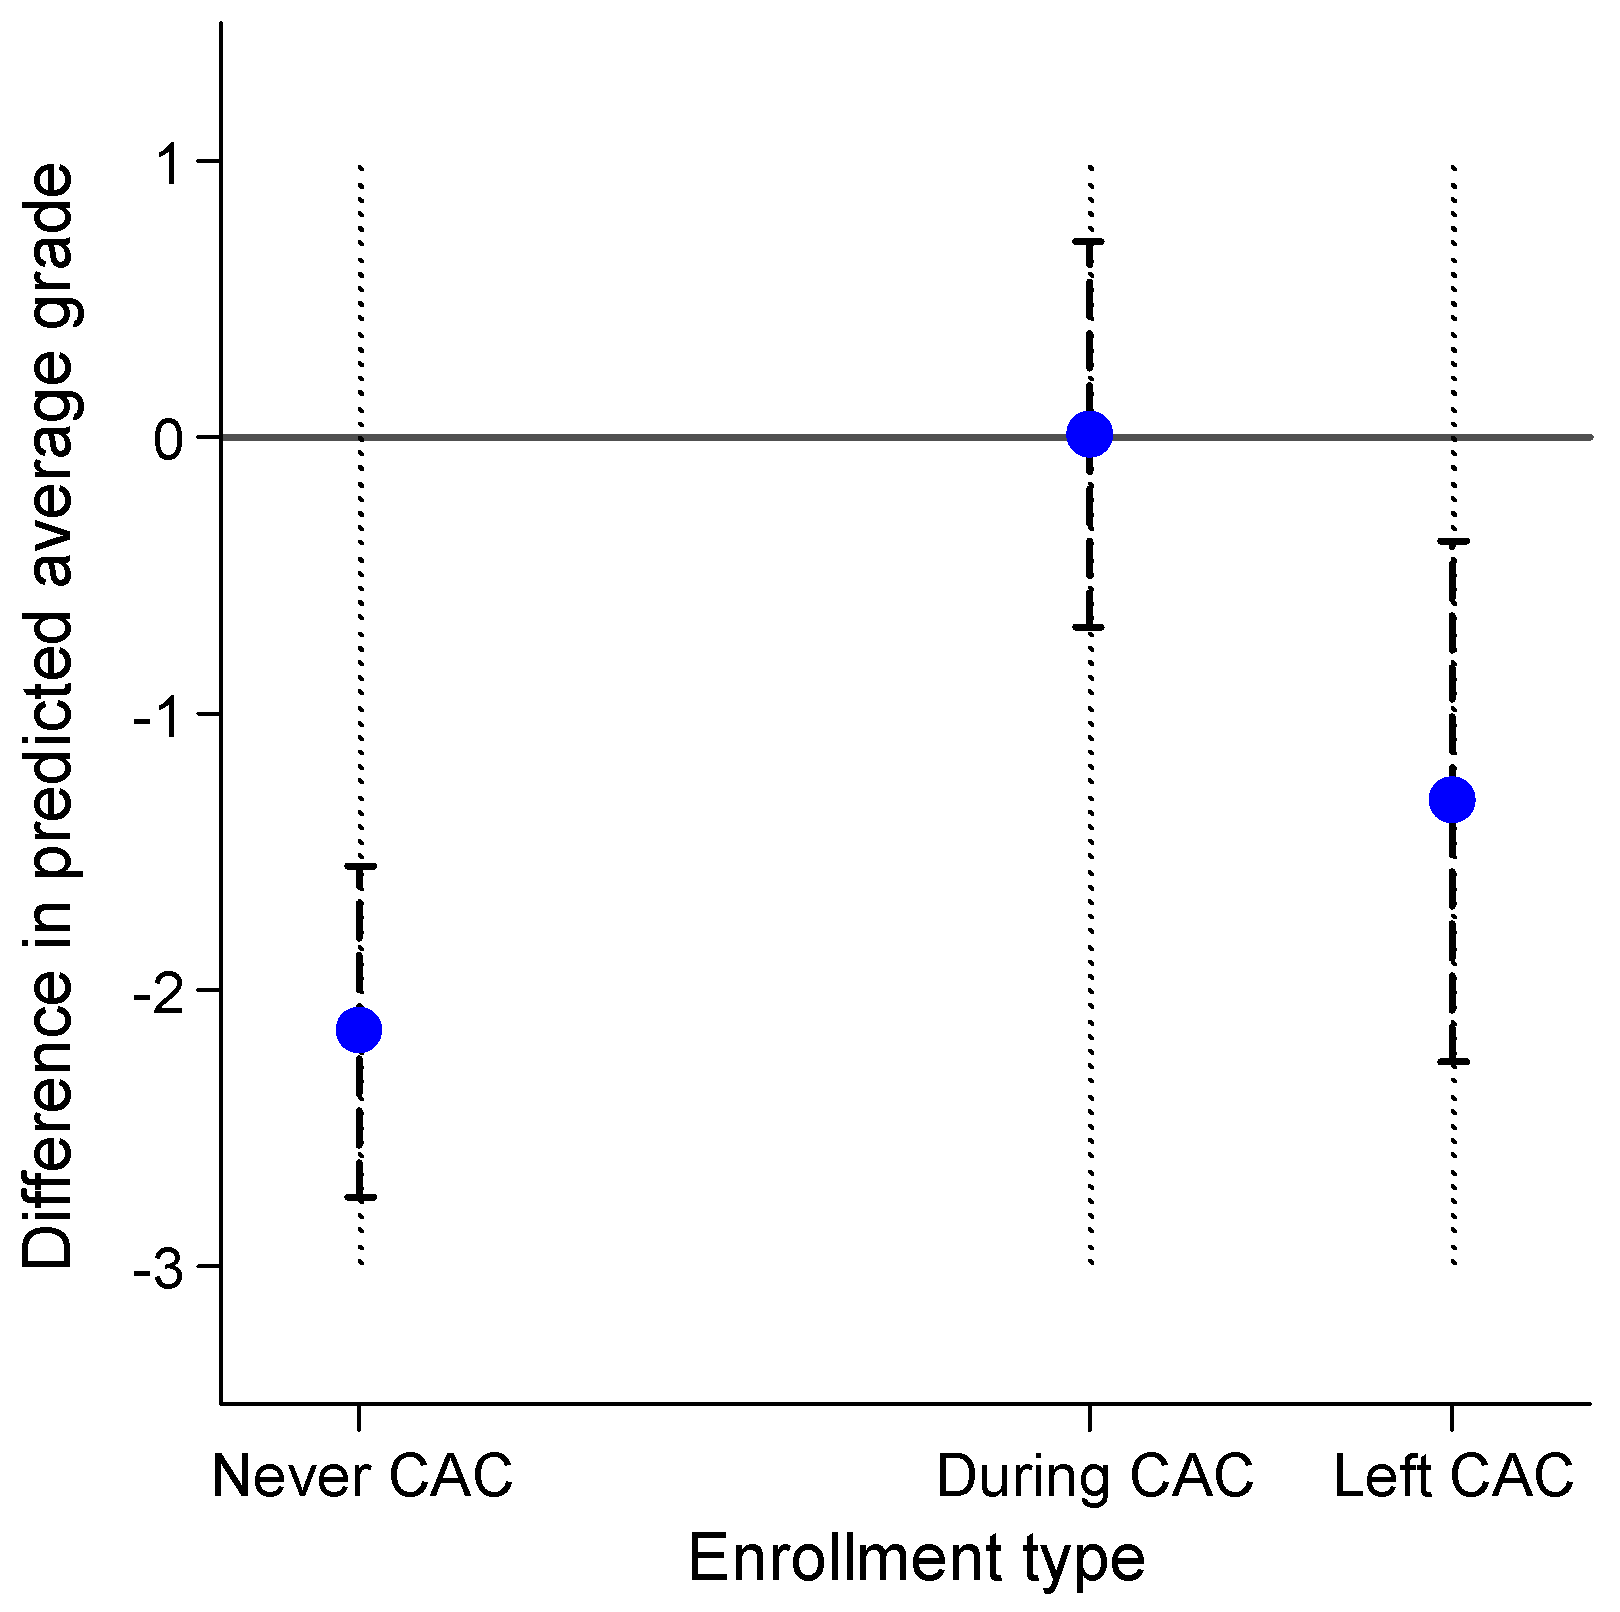
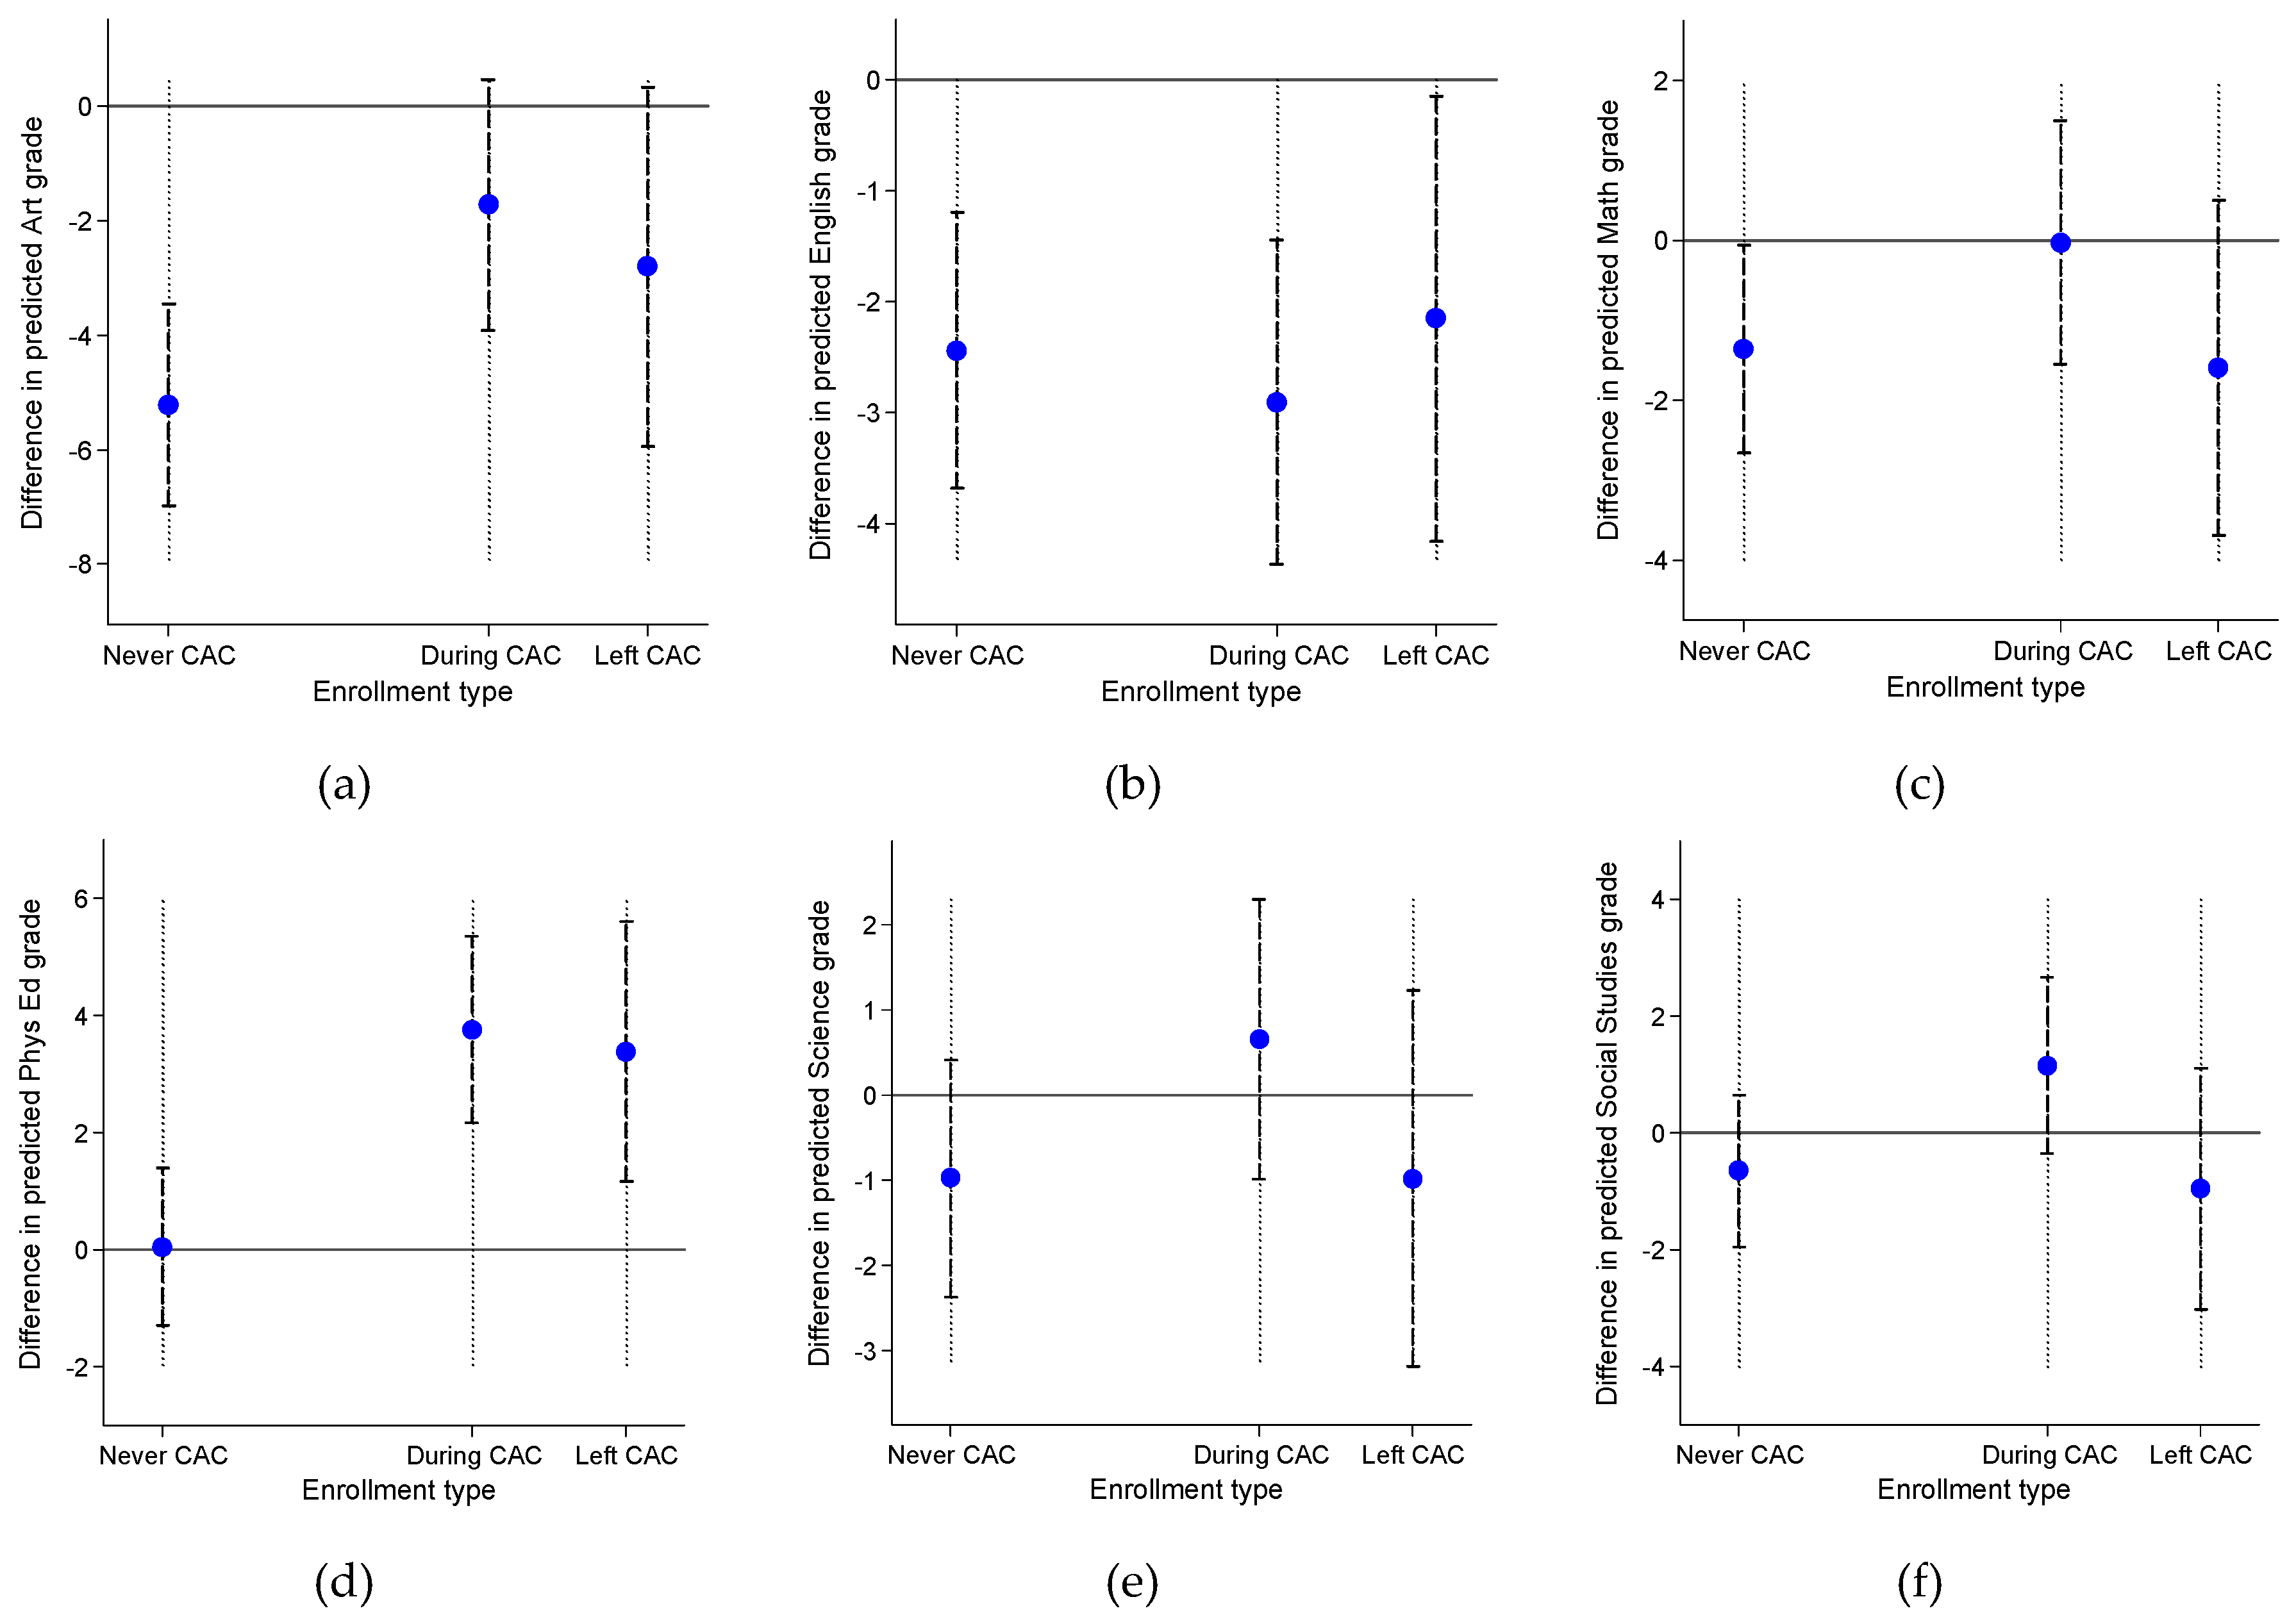
The results for attendance and discipline are provided in Table 1, and are derived of both the identifiable and de-identified data. The models which contain CAC enrollment status are for de-identified data, and models that contain CAC ADA are identifiable data. Model 1 for ADA only contains enrollment type independent variables because ADA is a control variable for CAC ADA. The predicted average daily attendance of students before they enter the CAC compared to students that never enroll in the CAC is −0.3 percentage points, and is not statistically significant. It is fair to say that the CAC is selecting students that attend class at about the same rates as all other students.
However, ADA increases by 3.1 percentage points for students when they are enrolled in the CAC compared to non-CAC students, and is statistically significant at the 95% level. The dot plot in Figure 2 for During CAC also indicates this increase in ADA. During CAC increases ADA compared to Before CAC by about 4 percentage points—a difference of 7 school days a year. Although the difference in coefficients is not statistically significant at the 95% level, statistical significance is not far off. In fact, a bulk of the data indicate positive effects, and the coefficient may be as large as about 7 percentage points.
To interpret the figures of differences in the dependent variables, each enrollment type is being compared to Before CAC. This is different than how we report results in the table where the base category is Never CAC. In addition, this is our approach throughout our analysis. By using different base categories in tables and figures, we are able to succinctly make hypothesis tests and present the results in tabular and visual formats for many comparisons.
Figure 2 indicates that the increases found in ADA for students enrolled in CAC are sustained for some students even if they drop out of the program. Though the confidence interval is larger, the predicted difference in attendance in Figure 2 for Left CAC versus Before CAC is almost as large as the difference of During CAC to Before CAC. This is a positive finding, especially given the expectation that students dropping out of the program do so because of struggles with other coursework, lack of motivation, or general disinterest. However, the result is not statistically significant at traditional levels although a portion of the students who were in the CAC but left do seem to exhibit better attendance [67].
Both Table 1 and Figure 2 indicate that the CAC appears to be selecting students that are more often tardy than other students. As shown in Figure 2, the difference in tardies for Never CAC compared to Before CAC is over 3 tardies per year, and is nearly statistically significant at the 95% level. The number of tardies is also predicted to be decreasing for students enrolled in the CAC program. According to the dot plot in Figure 2, the difference in the number of tardies for During CAC compared to Before CAC is about one less tardy per year. This finding is not statistically significantly different than zero. The prediction for Left CAC is similar to During CAC, but again the confidence interval is large. In terms of general enrollment in the CAC, while the coefficients are in the expected direction for predicted tardies, the null hypothesis cannot be rejected because of the size of the standard errors.
Although general enrollment is not statistically associated with reductions in the number of tardies, the extent to which students are engaged in the program does predict reductions in total tardies, as shown in Table 1 and the line plot and 95% confidence intervals in Figure 3. When a student attends about 0–10 percent of the CAC classes, then the predicted number of tardies is about 25 per year, and is statistically significant. However, as CAC ADA increases, the number of predicted tardies steadily decreases. Students that attend 90–100 percent of CAC classes are tardy on about 10 occasions a year. This is a drop of 15 tardies, a 60% decrease, and the difference between 10 and 90 percent enrollment is statistically significant at the 95% level (Chi2 = 4.92, d.f. = 1, and p value = 0.027). For reference, the average number of tardies of any student in the school is about 10.8 per year. It is important to note that this correlation is not due to attendance in general classes, since ADA is controlled for.
The effects of CAC enrollment on the number of suspensions and suspension days are also found Figure 4. In general, we do not see statistically significant effects of CAC enrollment status. The dot plots for both discipline variables clearly indicate that all of the confidence intervals contain zero, and that neither positive nor negative effects tend to predominate. The differences in coefficients predict that Before CAC students have more suspensions and days suspended than Never CAC students, and During CAC students have more suspensions and days suspended than Before CAC. However, the standard errors are sufficiently large that we cannot reject the null hypothesis that simply enrolling in the program will improve discipline for the average student.
However, similar to the finding for tardies, a different interpretation occurs when we assess how CAC ADA impacts suspensions. Figure 5 contains the line plots for both number of suspensions and days suspended. In both figures, attendance in CAC programs leads to decreases in the number of suspensions and days suspended. For reference, the average number of suspensions in the de-identified data is 0.6 suspensions and the average number of days suspended is 1.1. When a student only attends 0–10 percent of CAC classes, then the student is expect to be suspended about 2–2.5 times per year for a total of about 5–6 days. That is nearly a full week of classes. When a student attends 90–100 percent of the CAC classes, the student tends to be suspended nearly, but not quite, zero times a year and total days. These differences between 10 and 90 percent CAC ADA are statistically significant for the number of suspensions (Chi2 = 7.06, d.f. = 1, and p value = 0.008). Because of the predicted standard errors for the number of days suspended when CAC ADA is low, the difference in low CAC ADA and 90 percent attendance does not become statistically significant until about 50 percent compared to 90 percent (Chi2 = 4.69, d.f. = 1, and p value = 0.030), which is still strong evidence of the different effects in CAC ADA.

4.2. Grades

The models for class grades derive from the de-identified data, and only the enrollment status independent variables are tested, as indicated in Table 2. Unlike attendance and discipline, the CAC appears to be enrolling students which are performing better in general class grades. Students Before CAC outperform Never CAC students by about 2 percentage points, and this is statistically significant at the 99% level. This result may be due to teachers recommending against struggling students joining CAC because they need to remain in regular coursework to improve their grades. In other words, it may not be that CAC students tend to be better students but rather the weakest students are excluded from the program.
However, student grades in general do not change between Before CAC and During CAC. The difference in these coefficients is only 0.01 percentage points, and it is easy to see in Figure 6 that the difference is right on the line marking zero on the y axis. However, student scores slip by about 1 percentage point for those students that leave the CAC program compared to students Before CAC enrollment (Left CAC in Figure 6), and this difference is statistically significant at the 95% level. Note that because the general class scores contain more than six classes in addition to the six individually tested class grades, the result of aggregate grades cannot simply be interpreted as the effects from the six individual classes shown.
Figure 7 graphs the differences in enrollment type for each of the six individual classes, and indicates heterogeneity in the outcomes. In general, Before CAC students perform better than Never CAC students, except for Physical Education. This comparison can be seen by the plots of Never CAC in Figure 7. For Art students, this difference is as much as a 6 percentage point difference, and is statistically significant in at least the 95% confidence level, but is likely due to artistic students selecting into the Community as Art program.
However, only students in Phys. Ed., Science, and Social Studies exhibit improvement in grades Before CAC and During CAC, as shown in the plots for During CAC in Figure 7. These improvements are only about 4, 1, and 1 percentage points respectively, and the only statistically significant difference is for Phys. Ed. Grades in Art and English decline for During CAC students by approximately 2 and 3 percentage points, respectively, but only English is statistically significant at the 95% level. Math grades are predicted to be unchanged. Students that leave the CAC program also have increases or decreases in their grades compared to before enrolling in CAC, but these effects are only about 2 or 3 percentage points. The main inference to be taken from this section of the analysis is that the CAC program has little to no general impact on student’s class grades. What impact there is appears to be minimal, and not within any systematic trend.

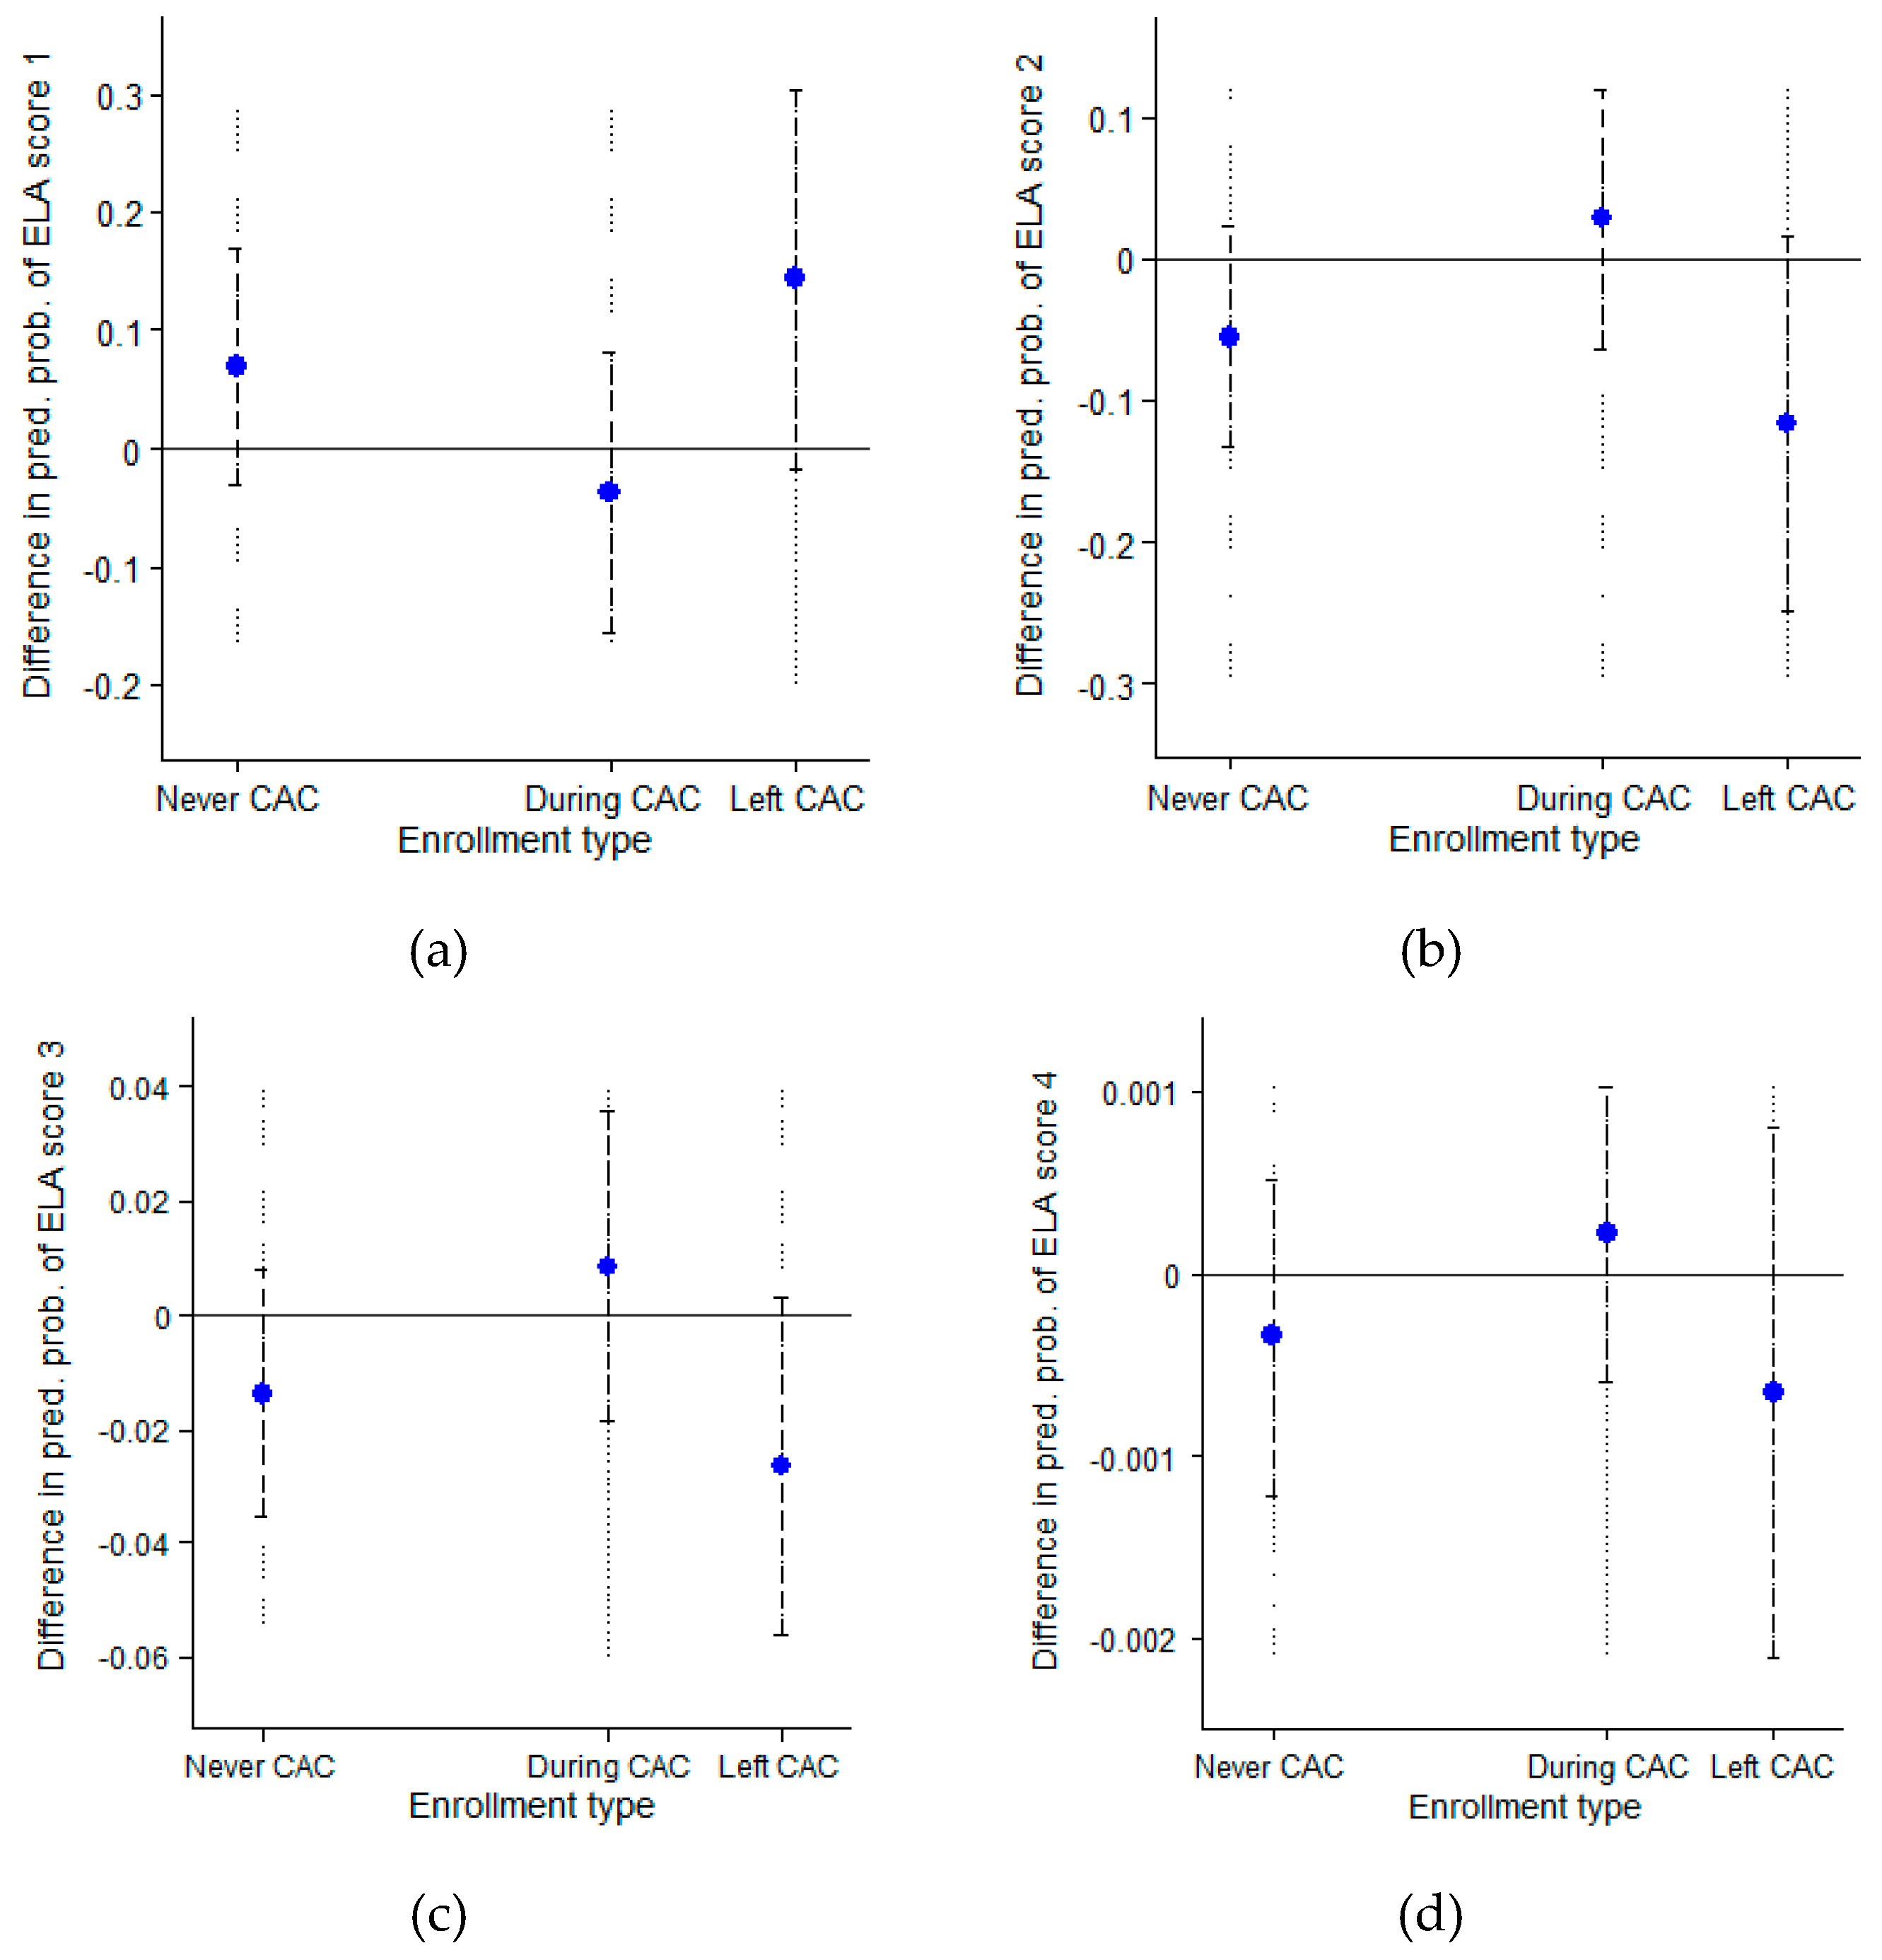
4.3. Standardized Test Scores

Like class grades, the models for standardized tests utilize the de-identified data. Table 3 provides the distribution of scores for all students. Note that students scored predominately well below proficient in ELA and Math, and predominately below proficient in Science. For instance in ELA, 665 students scored well below proficient. These 665 students were 70% of the total 947 students who took ELA exams in our data. Math scores were worse with 700, or 74%, of the 942 students scoring well below proficient.
But unlike course grades, outcomes from standardized tests do show systematic trends. The coefficients in the ordered logit models can be interpreted as the logged odds of a student increasing their standardized test score when the independent variable increases by 1 unit (or is equal to 1 for dichotomous variables such as During CAC). Since logged odds can be difficult to substantively interpret, we plot the differences in predicted probabilities that a student obtains a particular standardized score for each standardized test.
Since the models are ordinal logit for a dependent variable with four categories, the figures contain four plots each—one for each standardized score. It is important to note that the y axes are not on the same scale, and that probabilities are measures on a 0–1 scale on the y axis. For ease of interpretation, we report differences in predicted probabilities by percentage points on a 0–100 scale. Notice that the y axis for the score of well below proficient (score = 1, top left quadrant) is consistently larger than the axis for a score of excelling standards (score = 4 bottom right quadrant). Unfortunately, this is because there are far more students scoring well below proficient than are excelling above proficiency standards.
The general pattern found in standardized scores is that students tend to improve between Before CAC and During CAC. This is particularly the case for Math and Science standardized tests. It means that students who enroll in the CAC are performing better while in the program than they were before they enrolled in the program. The differences in scores for Before CAC and During CAC can be seen in Figure 8, Figure 9 and Figure 10, interpreted below.
Additionally, students During CAC outperform students who were never enrolled, Never CAC. This can easily be seen by the positive coefficients on During CAC in Table 4, which are also statistically significant at the 99% level. Moreover, students that enrolled in the CAC were not outperforming their counterparts who never enrolled in the CAC, as indicated by the lack of statistical significance for the coefficients on Before CAC in Table 4. This means that the CAC program did not enroll students who were already outperforming other students on standardized exams. However, those students who did enroll exhibited higher test scores than not only those students who never enrolled but also Math and Science scores improved for enrollees while in the program.
To interpret the figures, each plot must be understood as the difference in the predicted probabilities between Before CAC and the other enrollment categories. Any decrease in the probability between Before CAC and During CAC for a score of well below proficient (1) represents improvement in performance. All three figures exhibit this characteristic for students During CAC.
In the ELA results according to Figure 8, the probability of a During CAC student scoring well below proficient (1) decreases by roughly 4 percentage points, but is not statistically significant. The probability of scoring partially proficient (2), proficient (3), or excelling standards (4) increases by 3, 1, and 0.0002 percentage points, respectively. With only one person scoring a four in over 900 exams, the probability of scoring a 4 is very low. These are quite minor results for ELA, and are not statistically significant, but at least the predicted differences are in a positive direction.
The results for Math in Figure 9 are larger in magnitude than the results for ELA, and these results are statistically significant. The difference in the probability of a During CAC student scoring well below proficient (1) compared to a Before CAC student is a decrease of about 15 percentage points, statistically significant at the 95% level. For scores of partially proficient (2), proficient (3), and excelling standards (4), the change in percentage points are an increase of 14, 2, and 0.001, respectively. Only the prediction for scoring excelling standards (4) is not statistically significant at the 95% level. While most of the students that are moving out of scores of well below proficient (1) are only moving to a score of partially proficient (2), it is still an important improvement.
Science scores (Figure 10) exhibit even greater gains than Math scores for CAC students between the year that they were not enrolled in the program, and the years they are enrolled. For a score of well below proficient (1) the difference in probability for these two groups is a decrease of 26 percentage points, and is statistically significant at the 95% level. Compare this difference with the Never CAC students and it is clear that the effect is occurring specifically for During CAC students. Importantly, the bulk of the probability does not move into the next category, partially proficient (2). Partially proficient (2) only increases by about 2 percentage points, and is not statistically significant. Instead, the probability of scoring proficient; (3) is increasing by about 21 percentage points, and the score of excelling standards; (4) is increasing by about 3 percentage points. The difference of During CAC compared to Before CAC in the predicted score of proficient (3) is statistically significant at the 95% level, and the difference for excelling standards; (4) is significant at the 90% level (not shown in figure).
In each of the standardized tests for ELA, Math, and Science, students enrolled in the CAC program are predicted to perform better than before they had enrolled in the program, better than students that never enroll in the program, and better than those students that leave the program. These differences are not because of weaker CAC students protesting the exams because CAC students take the exams at the same rates as other students. While the CAC program aims to empower youth to critically view their urban environment and use lessons learned in the classroom to improve their communities, the program is not directly teaching the students how to better perform on standardized exams. However, the students are quite clearly achieving better exam scores.
This section found that the CAC program is associated with improvements in some aspects of student performance, such as attendance, discipline, and standardized scores. Students that are enrolled in the CAC are predicted to improve their attendance by about a week’s worth of classes compared to their enrollment before the program. Although class grades did not improve, standardized scores, particularly in Math and Science, dramatically improved for these students from the lowest scoring categories. Student engagement in the CAC program also predicts differences in outcomes. Students that attend most all CAC classes compared to those that attend only 10 percent or less of classes decrease their tardies by up to 15 less per year, decrease suspensions per year from 2 to about 0, and the number of days suspended from about 5 to about 0. In sum, enrollment in the CAC is found to improve student performance on some measures, and where simple enrollment does not predict changes, the extent of engagement in the program predicts improved performance.

5. Discussion

The goal of the Community as Classroom (CAC) initiative is to bolster student academic performance by increasing their levels of critical consciousness, which spawns the motivation to learn. This is a form of critical motivation because is it informed by a growing understanding between knowledge acquisition and the ability to change neighborhood conditions and build a more just and equitable society. Thus, the motivation is not unconscious, but the outcome of increased consciousness about injustice and the desire to do something about it. Bolstering critical consciousness, then, is the primary aim of the Community as Classroom Initiative.
The capacity of this pedagogical approach to bolster learning is revealed in its impact on student engagement. We posit that increases in attendance, on-time-arrival at school (decreased tardiness) and suspensions are critically important because they are pre- and co-requisites for academic success. This paper presents the concept of a proximal-distal continuum in educational outcomes. Attendance, on-time arrival at school, and decreased suspensions are important proximal outcomes without which the distal outcome—academic achievement gains—will not eventuate. Thus, these three variables are significant indicators of student engagement, which is an essential component in the quest for improved academic performance. Along the proximal-distal continuum, then, the initial signs of increased student engagement will be seen in improved attendance, on-time arrival at school and reduced suspensions.
The results of this study show that class grades did not improve, but standardized scores, particularly in Math and Science, dramatically improved for these students from the lowest scoring categories. This poses an interesting question, “Why did class grades not improve?” Most of the teachers at Futures Academy are white, and there is an abundance of data that indicates that teachers’ perceptions, expectations, and behaviors can impact student performance and evaluation [68]. The white teachers at Futures Academy may not have positively viewed or even noticed incremental improvements in their student’s academic performance. Therefore, while their classroom grades did not improve, their engagement did increase, as well as their performance on standardized test scores in Math and Science.
These results are extremely encouraging and suggest that greater attention should be paid to pedagogy in the formulation of school reform strategies. The Community as Classroom initiative uses a critical pedagogy method and utilizes a curriculum based on critical project-based learning. Student motivation to learn, we theorize, is driven by the development of a critical understanding of neighborhood underdevelopment and their positionality in society. It is this connection between critical consciousness and critical motivation that drives them along this proximal-distal continuum of academic improvement [21,53].
On the flipside, we posit that living in underdeveloped neighborhoods, without critical consciousness, produces “self-hatred”, limited interest in schooling, and other negative psychosocial outcomes [41,50,69]. The reason is attribution theory shows that people will invent causality if they have no reasonable explanation for why a problem exists [70]. Thus, if the socioeconomic and political forces responsible for the underdevelopment of neighborhoods are not explicated, the children will most likely attribute these conditions to the actions of blacks themselves, thereby, reinforcing negative stereotypes and self-hatred [19,41].
The CAC uses a critical pedagogical approach, and the study results show that such a pedagogy is associated with enhanced student engagement (improvement in attendance, on-time-arrivals at school, and reduced suspensions) and improved academic performance (standardized test scores). We found no general association of CAC with changes to the student’s class grades, but we suspect that this might be related to teacher bias in grading [68]. The results of this study are particularly impressive considering the limited time spent with the children weekly. Students can only attend the CAC one or two hours weekly, because they must get release time from other in-school activities. If more time was spent in the program, we theorize that improvements in student academic performance would be even more dramatic.
Finally, the findings of this study suggest that critical pedagogy, which uses a critical project-based approach to learning, should be more broadly applied in central city public schools. In this regard, we believe critical pedagogy and project-based learning are particularly applicable to the community school model. The dominant community school model focuses on service delivery and appears to proceed with conventional curricula and pedagogies. The model is based on the assumption that students do not succeed academically because of psycho-social issues and limited academic skills. Consequently, they emphasize enhanced service delivery, including counseling, mentoring and varied forms of academic support [71].
In our approach, the pedagogy must be changed, and in the process, a better strategy for student engagement is achieved. The point is that using supportive services for addressing barriers to learning combined with emphasis on classroom readiness must be complemented by enhanced critical consciousness. Such consciousness is the engine that drives critical motivation and student engagement, without which academic gains will not eventuate. Ironically, such an approach might even reduce the need for social service programs designed to improve attendance, tardies, and suspensions.

6. Conclusions

This study suggests that increased critical consciousness is associated with certain dimensions of improved academic performance, including student engagement, thereby demonstrating the importance of using a critical pedagogy to teach critical consciousness. The study also contributes to the evidence supporting the theory that school reform must be linked to the radical reconstruction of underdeveloped neighborhoods. The findings of this study are particularly important because it is an in-school academic support program, which limits the contact-hours spent with the children. Even so, student academic performance improved in most areas, and academic performance across all areas were either stable or showed movement in a positive direction. Participation in the CAC initiative appeared to be associated with improved academic performance.
In 2013, building on its success, the UB Center for Urban Studies launched a six-week Summer Academic Camp on Neighborhood Development modeled after the CAC. In this program, it was demonstrated that a more ambitious curriculum could be organized around project-based learning. Again, this program was designed with the principles of critical consciousness (CC) in mind, and our preliminary results confirm the hypothesis that programs aimed at bolstering CC seem to be associated with certain aspects of improved academic performance. Thus, we hypothesize that academic programs based on developing CC should be expanded, especially in community school settings. Lastly, by demonstrating the impact of critical consciousness on academic performance, this paper contributes to the quest of Dewey and Freire to transform schools into authentic hubs of community learning and catalysts of neighborhood transformation [5,50]. (The Dewey-Freire problem refers to the challenge of using schooling not only to educate and instill critical consciousness in children, but also to transform schools into hubs of community life and catalyst of change. This is what we believe Dewey had in mind when developed his concept of participatory democracy and what Freire believe to be the essence of critical consciousness.)

7. Limitations

This program is designed to bolster the critical consciousness of children by teaching them the role of political and economic processes in catalyzing the underdevelopment of their neighborhoods and by showing them how to develop intervention strategies that will bring about desirable neighborhood change. We posit that these academic experiences increase critical consciousness, which heighten student motivation to learn. The evaluative strategy used in the study is outcome rather than process based. Thus, we use academic performance variables—attendance, tardiness, disciplinary action, class grades, and performance on standard tests—as surrogate measures for critical consciousness.
Direct measures of critical consciousness are important; but for this study, we were mostly concerned about the program’s impact on academic performance. The CAC’s endgame is to produce sustainable academic progress in blacks and Latinx students in troubled central city schools. Therefore, for us, the single most important question is “did participation in the program lead to improved academic performance?” If so, we posit that increased critical consciousness is responsible. In this proposition, critical consciousness is a mediating variable that catalyzes improved academic performance. In the next stage of our research, we will directly measure increases in critical consciousness and correlate these increments to academic performance (We have conducted these evaluative measures of critical consciousness in our Summer Academic Camp on Neighborhood Development, and our evaluative studies show that the program does in fact lead to increases in critical consciousness.).
This study was also not designed as a mixed methods analysis; so, no attempt was made to triangulate the data with interviews, focus groups, or document analysis. This was a quantitative analysis designed to determine if participation in the CAC led to student academic achievement. We theorized that improvement in student achievement was caused by critical motivation triggered by increased critical consciousness, but more research must be done to demonstrate the connection between the two—bolstered critical consciousness and improved academic performance.
The selection process is limited because we do not make the final selection, and this caveat should be considered when interpreting the results of this study. However, it is also worth mentioning that we tested the differences in performance between students that enter the CAC program against the performance of those students who do not enter. We find that students who enter the CAC were generally not out-performing their peers, which suggests that selection bias is not a problem.

Acknowledgments

The Community as Classroom happens, in part, due to a grant from the Erie County Youth Bureau. We appreciate their support.

Author Contributions

D. Gavin Luter managed the CAC program and completed the literature review. D. Gavin Luter and Austin M. Mitchell conceived the research design. Austin M. Mitchell analyzed the data with D. Gavin Luter and Henry L. Taylor. Henry L. Taylor conceived of the program. D. Gavin Luter oversaw writing the paper. Austin M. Mitchell authored the research design and results sections. Henry L. Taylor provided final edits.

Conflicts of Interest

The authors declare no conflict of interest.

References

  1. Losen, D.J.; Skiba, R. Suspended Education: Urban Middle Schools in Crisis; The Civil Rights Project at the University of California—Los Angeles: Los Angeles, CA, USA, 2010. [Google Scholar]
  2. Swanson, C.B. Cities in Crisis: A Special Analytic Report on High School Graduation; Editorial Projects in Education Research Center: Bethesda, MD, USA, 2008. [Google Scholar]
  3. Brighouse, H.; Schouten, G. Understanding the context for existing reform and research proposals. In Whither Opportunity? Rising Inequality, Schools, and Children’s Life Chances; Duncan, G.J., Murnane, R.J., Eds.; Russell Sage Foundation: New York, NY, USA, 2011; pp. 507–522. [Google Scholar]
  4. Taylor, H.L.; McGlynn, L. The “Community as Classroom Initiative:” The case of Futures Academy in Buffalo, New York. Univ. Commun. Sch. 2010, 8, 31–43. [Google Scholar]
  5. Benson, L.; Harkavy, I.; Puckett, J. Dewey’s Dream; Temple University Press: Philadelphia, PA, 2007. [Google Scholar]
  6. Luter, D.G. Tensions and contradictions in approaches to improving urban inner-city schools in the United States. In Challenges and Opportunities of Educational Leadership Research and Practice: The State of the Field and Its Multiple Futures; Bowers, A., Shoho, A., Barnett, B., Eds.; Information Age Publishing: Charlotte, NC, USA, 2015. [Google Scholar]
  7. Sampson, R.J. Great American City: Chicago and the Enduring Neighborhood Effect; University of Chicago Press: Chicago, IL, USA, 2012. [Google Scholar]
  8. Sharkey, P. Stuck in Place: Urban Neighborhoods and the End of Progress toward Racial Equality; University of Chicago Press: Chicago, IL, USA, 2013. [Google Scholar]
  9. Taylor, H.L.; Jung, J.K.; Martin, L. Who Owns the Houses with the Broken Windows? Rethinking the Black Neighborhood Development Process; Working Paper; University at Buffalo Center for Urban Studies: Buffalo, NY, USA, 2015. [Google Scholar]
  10. Solar, O.; Irwin, A. A Conceptual Framework for Action on the Social Determinants of Health; Social Determinants of Health Discussion Paper 2 (Policy and Practice); World Health Organization: Geneva, Switzerland, 2010. [Google Scholar]
  11. Taylor, H.L.; McGlynn, L.G. The connection: Schooling, youth development, and community building—The Futures Academy case. New Dir. Youth Dev. Theory Pract. Res. 2009, 2009, 19–40. [Google Scholar] [CrossRef] [PubMed]
  12. Watts, R.J.; Diemer, M.A.; Voight, A.M. Critical consciousness: Current status and future directions. In Youth Civic Development: Work at the Cutting Edge. New Directions for Child and Adolescent Development; Flanagan, C.A., Christens, B.D., Eds.; John Wiley & Sons: Hoboken, NJ, USA, 2011; pp. 43–57. [Google Scholar]
  13. Davis-Kean, P.E. The influence of parent education and family income on child achievement: The indirect role of parental expectations and the home environment. J. Fam. Psychol. 2005, 19, 294–304. [Google Scholar] [CrossRef] [PubMed]
  14. Rendón, M.G. Drop out and “disconnected” young adults: Examining the impact of neighborhood and school contexts. Urban Rev. 2013, 1–28. [Google Scholar] [CrossRef]
  15. Jargowsky, P.A.; Komi, M.E. Before or After the Bell? School Context and Neighborhood Effects on Student Achievement; Working Paper 28; The Urban Institute: Washington, DC, USA, 2009. [Google Scholar]
  16. Blank, M.; Melaville, A.; Shah, B.P. Making the Difference: Research and Practice in Community Schools; Coalition for Community Schools: Washington, DC, USA, 2003. [Google Scholar]
  17. Children’s Aid Society. Building Community Schools: A Guide for Action; Children’s Aid Society: New York, NY, USA, 2013. [Google Scholar]
  18. Taylor, H.L.; McGlynn, L.; Luter, D.G. Neighborhoods matter: The role of universities in the school reform neighborhood development movement. PJE 2013, 88, 541–563. [Google Scholar] [CrossRef]
  19. Taylor, H.L.; Miller, C.; McGlynn, L. Critical Consciousness, Youth Empowerment and Black Neighborhoods. Univ. Commun. Sch. 2016, 8, 26–33. [Google Scholar]
  20. Kubisch, A.C.; Auspos, P.; Brown, P.; Dewar, T. Voices from the Field III: Reflections on Comprehensive Community Change; The Aspen Institute: Washington, DC, USA, 2011. [Google Scholar]
  21. Taylor, H.L. Stores in the hood: Neighborhood-based business and community development in underdeveloped neighborhoods of color. J. Urban Hist. Forthcoming.
  22. Young, I.M. Justice and the Politics of Difference; Princeton University Press: Princeton, NJ, USA, 1990. [Google Scholar]
  23. Sutton, S.E.; Kemp, S.P. (Eds.) The Paradox of Urban Space: Inequality and Transformation in Marginalized Communities; Palgrave Macmillan: New York, NY, USA, 2011.
  24. Taylor, H.L. The historical roots of the crisis in housing affordability: The case of Buffalo, New York. In Fair and Affordable Housing in the US: Trends, Outcomes, Future Directions; Silverman, R.M., Patterson, K.L., Eds.; Brill: Leiden, The Netherlands, 2011; pp. 245–276. [Google Scholar]
  25. Gonzales, N.; Cauce, A.M.; Friedman, R.J.; Mason, C.A. Family, peer and neighborhood influences on academic achievement among African-American adolescents: One year prospective effects. Am. J. Commun. Psychol. 1996, 24, 365–387. [Google Scholar] [CrossRef]
  26. Sirin, S.R. Socioeconomic status and academic achievement: A meta-analytic review of research. Rev. Educ. Res. 2005, 75, 417–453. [Google Scholar] [CrossRef]
  27. Garcia, T.; Pintrich, P.R. Critical thinking and its relationship to motivation, learning strategies, and classroom experience. In Proceedings of the 100th Annual Meeting of the American Psychological Association, Washington, DC, USA, 14–18 August 1992.
  28. Bradley, R.H.; Corwyn, R.F.; McAdoo, H.P.; Coll, C.G. The home environments of children in the United States. Part 1: Variations by age, ethnicity, and poverty status. Child Dev. 2001, 72, 1868–1886. [Google Scholar] [CrossRef] [PubMed]
  29. Bandura, A. Social cognitive theory: An agentic perspective. Annu. Rev. Psychol. 2001, 52, 1–26. [Google Scholar] [CrossRef] [PubMed]
  30. Pajares, F.; Schunk, D.H. Self-beliefs and school success: SE, self-concept, and school achievement. In Perception; Riding, R., Rayner, S., Eds.; Alex Publishing: London, UK, 2001; pp. 239–266. [Google Scholar]
  31. Richardson, M.; Abraham, C.; Bond, R. Psychological correlates of university students’ academic performance: A systematic review and meta-analysis. Psychol. Bull. 2012, 138, 353–387. [Google Scholar] [CrossRef] [PubMed] [Green Version]
  32. Diemer, M.A.; McWhirter, E.H.; Ozer, E.J.; Rapa, L.J. Advances in the conceptualization and measurement of critical consciousness. Urban Rev. 2015, 47, 809–823. [Google Scholar] [CrossRef]
  33. Bandura, A. Guide for constructing self-efficacy scales. In Self-Efficacy Beliefs of Adolescents; Pajares, F., Urdan, T., Eds.; Information Age Publishing: Charlotte, NC, USA, 2006; Volume 5, pp. 307–337. [Google Scholar]
  34. Schwarzer, R.; Jerusalem, M. Generalized Self-Efficacy scale. In Measures in Health Psychology: A User’s Portfolio. Causal and Control Beliefs; Weinman, J., Wright, S., Johnston, M., Eds.; NFER-Nelson: Windsor, UK, 1995; pp. 35–37. [Google Scholar]
  35. Sampson, R.J.; Raudenbush, S.W.; Earls, F. Neighborhoods and violent crime: A multilevel study of collective efficacy. Science 1997, 277, 918–924. [Google Scholar] [CrossRef] [PubMed]
  36. Smith, E.P.; Osgood, D.W.; Caldwell, L.; Hynes, K.; Perkins, D.F. Measuring collective efficacy among children in community-based afterschool programs: Exploring pathways toward prevention and positive youth development. Am. J. Commun. Psychol. 2013, 52, 27–40. [Google Scholar] [CrossRef] [PubMed]
  37. Parham, T.A.; Helms, J.E. The influence of Black students’ racial identity attitudes on preference for counselor’s race. J. Couns. Psychol. 1981, 28, 250–258. [Google Scholar] [CrossRef]
  38. Scottham, K.M.; Sellers, R.M.; Nguyên, H.X. A measure of racial identity in African American adolescents: The development of the Multidimensional Inventory of Black Identity—Teen. Cult. Divers. Ethn. Minor. Psychol. 2008, 14, 297. [Google Scholar] [CrossRef] [PubMed]
  39. Vandiver, B.J.; Cross, W.E., Jr.; Worrell, F.C.; Fhagen-Smith, P.E. Validating the Cross Racial Identity Scale. J. Couns. Psychol. 2002, 49, 71. [Google Scholar] [CrossRef]
  40. Vandiver, B.J.; Fhagen-Smith, P.E.; Cokley, K.; Cross, W.E., Jr.; Worrell, F.C. Cross’ nigrescence model: From theory to scale to theory. J. Multicult. Couns. Dev. 2001, 29, 174–200. [Google Scholar] [CrossRef]
  41. Fanon, F. Black Skin, White Masks; Grove Press: New York, NY, USA, 1967. [Google Scholar]
  42. Watts, R.J.; Hipolito-Delgado, C.P. Thinking ourselves to liberation? Advancing sociopolitical action in critical consciousness. Urban Rev. 2015, 47, 847–867. [Google Scholar] [CrossRef]
  43. Chung, C. Using Public Schools as Community-Development Tools: Strategies for Community-Based Developers; Joint Center for Housing Studies of Harvard University: Cambridge, MA, USA, 2002. [Google Scholar]
  44. Green, T.L. Leading for urban school reform and community development. Educ. Adm. Q. 2015, 51, 679–711. [Google Scholar] [CrossRef]
  45. Khadduri, J.; Schwartz, H.; Turnham, J. Policy Roadmap for Expanding School-Centered Community Revitalization; Enterprise Community Partners: Columbia, MD, USA, 2008. [Google Scholar]
  46. Noguera, P.A. A broader and bolder approach uses education to break the cycle of poverty: Making bold assertions that all children can achieve while doing nothing to address the challenges they face is neither fair nor sound public policy. Phi Delta Kappan 2011, 93, 8–14. [Google Scholar] [CrossRef]
  47. Shirley, D. Community Organizing for Urban School Reform; University of Texas Press: Austin, TX, USA, 1997. [Google Scholar]
  48. Warren, M.R. Communities and schools: A new view of urban education reform. Harv. Educ. Rev. 2005, 75, 133–173. [Google Scholar] [CrossRef]
  49. Warren, M.R.; Mapp, K.L.; Community Organizing and School Reform Project. A Match on Dry Grass: Community Organizing as a Catalyst for School Reform; Oxford University Press: New York, NY, USA, 2011. [Google Scholar]
  50. Freire, P. Pedagogy of the Oppressed. 1970; Continuum: New York, NY, USA, 1993. [Google Scholar]
  51. Seigel, S.; Rockwood, V. Democratic education, student empowerment, and community service: Theory and practice. Equity Excell. Educ. 1993, 26, 65–70. [Google Scholar] [CrossRef]
  52. Michelsen, E.; Zaff, J.F.; Hair, E.C. Civic Engagement Programs and Youth Development: A Synthesis; Child Trends: Washington, DC, USA, 2002. [Google Scholar]
  53. Powell, J.A. Structural Racism: Building upon the Insights of John Calmore. N. C. Law Rev. 2007, 86, 791–816. [Google Scholar]
  54. Fry, S.; Bentahar, A. Student attitudes towards and impressions of Project Citizen. J. Soc. Stud. Educ. Res. 2013, 4, 1–23. [Google Scholar]
  55. Westheimer, J.; Kahne, J. What kind of citizen? The politics of educating for democracy. Am. Educ. Res. J. 2004, 41, 237–269. [Google Scholar] [CrossRef]
  56. Watts, R.J.; Flanagan, C. Pushing the envelope on youth civic engagement: A developmental and liberation psychology perspective. J. Commun. Psychol. 2007, 35, 779–792. [Google Scholar] [CrossRef]
  57. Watts, R.J.; Griffith, D.M.; Abdul-Adil, J. Sociopolitical development as an antidote for oppression—Theory and action. Am. J. Commun. Psychol. 1999, 27, 255–271. [Google Scholar] [CrossRef]
  58. Barron, B.; Darling-Hammond, L. Teaching for meaningful learning: A review of research on inquiry-based and cooperative learning. In Powerful Learning: What We Know about Teaching and Understanding; Darling-Hammond, L., Barron, B., Pearson, P.D., Schoenfeld, A.H., Stage, E.K., Zimmerman, T.D., Cervetti, G.N., Tilson, J.L., Eds.; Jossey Bass: San Francisco, CA, USA, 2008. [Google Scholar]
  59. Gijbels, D.; Dochy, F.; Van den Bossche, P.; Segers, M. Effects of problem-based learning: A meta-analysis from the angle of assessment. Rev. Educ. Res. 2005, 75, 27–61. [Google Scholar] [CrossRef]
  60. Walker, A.; Leary, H. A problem based learning meta-analysis: Differences across problem types, implementation types, disciplines, and assessment levels. Interdiscip. J. Probl.-Based Learn. 2009, 3, 12–43. [Google Scholar] [CrossRef]
  61. Bell, S. Project-based learning for the 21st century: Skills for the future. Clearing House 2010, 83, 39–43. [Google Scholar] [CrossRef]
  62. Kornbluh, M.; Ozer, E.J.; Allen, C.D.; Kirshner, B. Youth participatory action research as an approach to sociopolitical development and the new academic standards: Considerations for educators. Urban Rev. 2015, 47, 868–892. [Google Scholar] [CrossRef]
  63. Greene, W. Econometric Analysis, 7th ed.; Prentice Hall: Upper Saddle River, NJ, USA, 2012. [Google Scholar]
  64. Wooldridge, J.M. Multiple regression analysis: Estimation (CH 3). In Introductory Econometrics: A Modern Approach; South-Western Cengage Learning: Mason, OH, USA, 2009. [Google Scholar]
  65. Long, J.S. Regression Models for Categorical and Limited Dependent Variables; Sage Publications: Thousand Oaks, CA, USA, 1997. [Google Scholar]
  66. New York State Education Department, Office of State Assessment. Elementary/Intermediate Tests General Information. 2015. Available online: http://www.p12.nysed.gov/assessment/ei/eigen.html (accessed on 2 August 2015). [Google Scholar]
  67. Rainey, C. Arguing for a negligible effect. Am. J. Political Sci. 2014, 58, 1083–1091. [Google Scholar] [CrossRef]
  68. Ferguson, R. Teachers’ Perceptions and Expectations and the Black-White Test Score Gap. Urban Educ. 2003, 38, 460–507. [Google Scholar] [CrossRef]
  69. Clark, K.B. Dark Ghetto: Dilemmas of Social Power; Harper and Row: New York, NY, USA, 1965; pp. 111–153. [Google Scholar]
  70. Jones, E.E.; Kannouse, D.E.; Kelley, H.H.; Nisbett, R.E.; Valins, S.; Weiner, B. (Eds.) Attribution: Perceiving the Causes of Behavior; General Learning Press: Morristown, NJ, USA, 1972.
  71. Dryfoos, J.; Maguire, S. Inside Full-Service Community Schools; Corwin Press, Inc.: Thousand Oaks, CA, USA, 2002. [Google Scholar]
Figure 1. Community as Classroom Logic Model.
Education 07 00025 g001
Figure 2. Differences in attendance and tardies for enrollment types compared to Before CAC.
Education 07 00025 g002
Figure 3. CAC ADA predictions of tardies.
Education 07 00025 g003
Figure 4. Differences in suspensions for enrollment types compared to Before CAC.
Education 07 00025 g004
Figure 5. CAC ADA predictions of suspensions and days suspended.
Education 07 00025 g005
Figure 6. Differences in general grades for enrollment types compared to Before CAC.
Education 07 00025 g006
Figure 7. Differences in grades by classes for enrollment types compared to Before CAC.
Education 07 00025 g007
Figure 8. Differences in ELA scores for enrollment types compared to Before CAC.
Education 07 00025 g008
Figure 9. Differences in Math scores for enrollment types compared to Before CAC.
Education 07 00025 g009
Figure 10. Differences in Science scores for enrollment types compared to Before CAC.
Education 07 00025 g010
Table 1. OLS Regressions of Attendance and Discipline.
(1)(2)(3)(4)(5)(6)(7)
ADATardiesTardiesNo. Susp.No. Susp.Days Susp.Days Susp.
(OLS)(Ng. Bin.)(Ng. Bin.)(Ng. Bin.)(Ng. Bin.)(Ng. Bin.)(Ng. Bin.)
Before CAC−0.3360.280 ** 0.234 0.343
(1.782)(0.132) (0.255) (0.435)
During CAC3.086 **0.173 * 0.370 ** 0.368
(1.282)(0.093) (0.185) (0.319)
Left CAC2.4870.106 0.256 0.836 *
(2.630)(0.159) (0.274) (0.466)
Days enrolled0.346 ***0.013 ***0.008 0.009 0.017
(0.007)(0.001)(0.005) (0.008) (0.016)
Average daily 0.001−0.002 0.019 0.053 *
attendance (0.003)(0.014) (0.021) (0.032)
CAC ADA −0.011 *** −0.022 *** −0.026 **
(0.004) (0.005) (0.011)
Grade level 0.268 ** 0.577 *** 0.308
(0.107) (0.191) (0.300)
Constant29.780 ***−0.0120.231−0.627 ***−6.516 **0.018−8.122 *
(1.030)(0.256)(1.496)(0.051)(2.558)(0.086)(4.455)
Observations1970121415033421913342191
R20.597
Note: Never CAC is the base category for CAC enrollment; Standard errors in parentheses; * p < 0.1, ** p < 0.05, *** p < 0.01; All models are OLS or negative binomial.
Table 2. OLS regressions of class grades.
(8)(9)(10)(11)(12)(13)(14)
All ClassesArtEnglishMathPhysicalScienceSocial
Before CAC2.148 ***5.223 ***2.445 ***1.363 **−0.0520.9760.644
(0.306)(0.900)(0.636)(0.661)(0.687)(0.711)(0.664)
During CAC2.158 ***3.506 ***−0.4651.335 ***3.706 ***1.633 ***1.794 ***
(0.230)(0.818)(0.491)(0.513)(0.535)(0.552)(0.500)
Left CAC0.833 **2.427 *0.288−0.2283.333 ***−0.005−0.319
(0.396)(1.402)(0.854)(0.886)(0.943)(0.928)(0.867)
Grade level−1.659 ***−2.421 ***−0.736 ***−0.990 ***−1.099 ***−0.824 ***−1.228 ***
(0.074)(0.260)(0.157)(0.163)(0.173)(0.178)(0.165)
Constant89.971 ***93.125 ***80.669 ***82.786 ***93.931 ***85.065 ***86.289 ***
(0.446)(1.451)(0.932)(0.967)(1.030)(1.074)(1.002)
Observations16717198324412433176722432277
R20.0380.0640.0230.0210.0370.0130.029
Note: Never CAC is the base category for CAC enrollment; Standard errors in parentheses; * p < 0.1, ** p < 0.05, *** p < 0.01; All models are OLS.
Table 3. Distribution of standardized test scores.
ScoreInterpretationELAMathScience
1Well below proficient655700115
2Partially proficient249221125
3Proficient422069
4Excelling standards116
Total Students 947942315
Table 4. Ordered logit regressions of standardized test scores.
(15)(16)(17)
ELAMathScience
Before CAC0.321−0.342−0.406
(0.228)(0.268)(0.440)
During CAC0.481 ***0.476 **0.958 ***
(0.178)(0.187)(0.323)
Left CAC−0.405−0.3730.062
(0.410)(0.462)(0.484)
Grade level−0.071−0.178 ***−0.347 ***
(0.056)(0.061)(0.067)
Observations947942315
Note: Never CAC is the base category for CAC enrollment. Standard errors in parentheses; * p < 0.1, ** p < 0.05, *** p < 0.01; All models are ordered logit.

