
Investigating Gender and Racial/Ethnic Invariance in Use of a Course Management System in Higher Education

Abstract
:1. Introduction
1.1. Gender Differences
1.2. Race/Ethnicity Difference
1.3. Why Study the Use of CMS
2. Methods
2.1. Sample

| Sample | University Population | |
|---|---|---|
| Ethnicity (percentage) | ||
| African American | 1.82% | 3.50% |
| Native American/Alaskan Native | 0.28% | 0.34% |
| Asian American | 5.46% | 5.45% |
| Caucasian | 86.83% | 85.00% |
| Hispanic American | 3.36% | 3.11% |
| Other & Not Reported | 2.24% | 2.60% |
| Gender (percentage) | ||
| Female | 51.90% | 42.40% |
| Male | 48.10% | 57.60% |
| Age (mean) | 20.13 | 20.60 |
2.2. Measures of Constructs
| Indicator Variable (Label) | Description | Type |
|---|---|---|
| Discussion postings read (DisR) | The total number of discussion postings opened by the student. If a student opens the same discussion posting multiple times, the system records each entry. | Interval (Min = 1, Max = 191) |
| Content folder viewed (Content) | The total number of content files opened by the student. If a student opens the same content file multiple times, the system records each entry. | Interval (Min = 1, Max = 823) |
| Assessments completed (Assess) | The number of assessments completed by the student. If a student opens the same assessment task multiple times, the system records each entry. | Interval (Min = 1, Max = 6) |
| Web link viewed (Web) | The total number of web links associated with the course opened by the student. If a student opens the same link multiple times, the system records each entry. | Interval (Min = 1, Max = 111) |
| Files viewed (File) | The number of course files opened by the student. If a student opens the same course file multiple times, the system records each entry. | Interval (Min = 1, Max = 280) |
3. Analysis Results
| Indicator/Outcome Variables | Mean | SD | Skewness | Kurtosis | ||||
|---|---|---|---|---|---|---|---|---|
| Male | Female | Male | Female | Male | Female | Male | Female | |
| Academic Aptitude | ||||||||
| GPA | 2.84 | 3.01 | 0.86 | 0.74 | −0.67 | −0.89 | −0.19 | 0.60 |
| SAT_Verbal | 567.52 | 547.77 | 74.17 | 77.34 | 0.02 | 0.23 | −0.08 | −0.29 |
| SAT_Mathematic | 636.97 | 564.63 | 77.79 | 83.91 | −0.36 | −0.02 | 0.07 | −0.38 |
| SAT_Writing | 550.20 | 544.94 | 75.48 | 77.76 | −0.04 | −0.07 | 0.02 | 0.07 |
| CMS Use | ||||||||
| Sessions | 56.59 | 58.10 | 36.49 | 40.04 | 1.40 | 1.55 | 2.56 | 3.90 |
| Discussions Read Messages | 42.92 | 41.94 | 32.84 | 37.97 | 1.05 | 0.92 | 1.68 | −0.02 |
| Assessments Began | 0.92 | 0.76 | 0.89 | 0.86 | 1.57 | 1.35 | 4.67 | 2.24 |
| Web Links Viewed | 7.34 | 8.44 | 12.25 | 14.91 | 3.82 | 3.47 | 17.93 | 14.44 |
| Content Folders Viewed | 188.24 | 153.80 | 135.47 | 154.12 | 1.15 | 1.33 | 1.40 | 1.65 |
| Files Viewed | 65.47 | 54.85 | 47.54 | 52.88 | 1.22 | 1.09 | 2.10 | 0.69 |
| Outcome | ||||||||
| Final Grade | 3.89 | 4.00 | 1.08 | 0.99 | −0.67 | −0.87 | −0.42 | 0.30 |
| Indicator/Outcome Variables | Mean | SD | Skewness | Kurtosis | ||||||||
|---|---|---|---|---|---|---|---|---|---|---|---|---|
| CC | AA | AH | CC | AA | AH | CC | AA | AH | CC | AA | AH | |
| Academic Aptitude | ||||||||||||
| GPA | 2.92 | 2.95 | 2.62 | 0.80 | 0.74 | 0.74 | −0.82 | −0.28 | −0.10 | 0.19 | −1.05 | −0.81 |
| SAT_Verbal | 561.85 | 564.36 | 502.43 | 74.78 | 73.41 | 69.50 | 0.17 | −0.55 | −0.33 | −0.31 | 0.79 | −0.64 |
| SAT_Mathematic | 591.35 | 659.74 | 544.59 | 85.41 | 76.79 | 90.60 | −0.14 | −0.70 | −0.08 | −0.28 | −0.02 | −0.71 |
| SAT_Writing | 549.09 | 562.05 | 499.72 | 75.36 | 73.78 | 83.96 | −0.01 | −0.55 | 0.01 | 0.15 | 0.17 | −0.40 |
| CMS Use | ||||||||||||
| Sessions | 54.27 | 65.41 | 64.54 | 36.94 | 35.14 | 46.95 | 1.69 | 0.96 | 1.36 | 4.76 | 0.02 | 1.96 |
| Discussions Read Messages | 42.43 | 49.78 | 51.13 | 36.56 | 44.27 | 27.99 | 0.89 | 1.69 | 0.42 | 0.03 | 3.73 | 0.34 |
| Assessments Began | 0.77 | 1.29 | 0.81 | 0.78 | 1.07 | 0.74 | 1.21 | 1.05 | 0.94 | 2.40 | 0.82 | 1.70 |
| Web Links Viewed | 7.46 | 6.03 | 13.00 | 13.25 | 12.44 | 21.68 | 3.67 | 5.31 | 3.12 | 16.40 | 29.91 | 11.02 |
| Content Folders Viewed | 154.57 | 221.54 | 202.92 | 137.94 | 132.03 | 180.40 | 1.33 | 0.89 | 1.03 | 2.07 | 0.41 | 0.37 |
| Files Viewed | 54.38 | 78.41 | 74.54 | 48.48 | 39.49 | 61.64 | 1.25 | 0.42 | 0.81 | 1.83 | 0.11 | −0.18 |
| Outcome | ||||||||||||
| Final Grade | 3.93 | 4.08 | 3.68 | 1.02 | 0.87 | 1.18 | −0.70 | −0.66 | −0.39 | −0.21 | −0.20 | −0.93 |
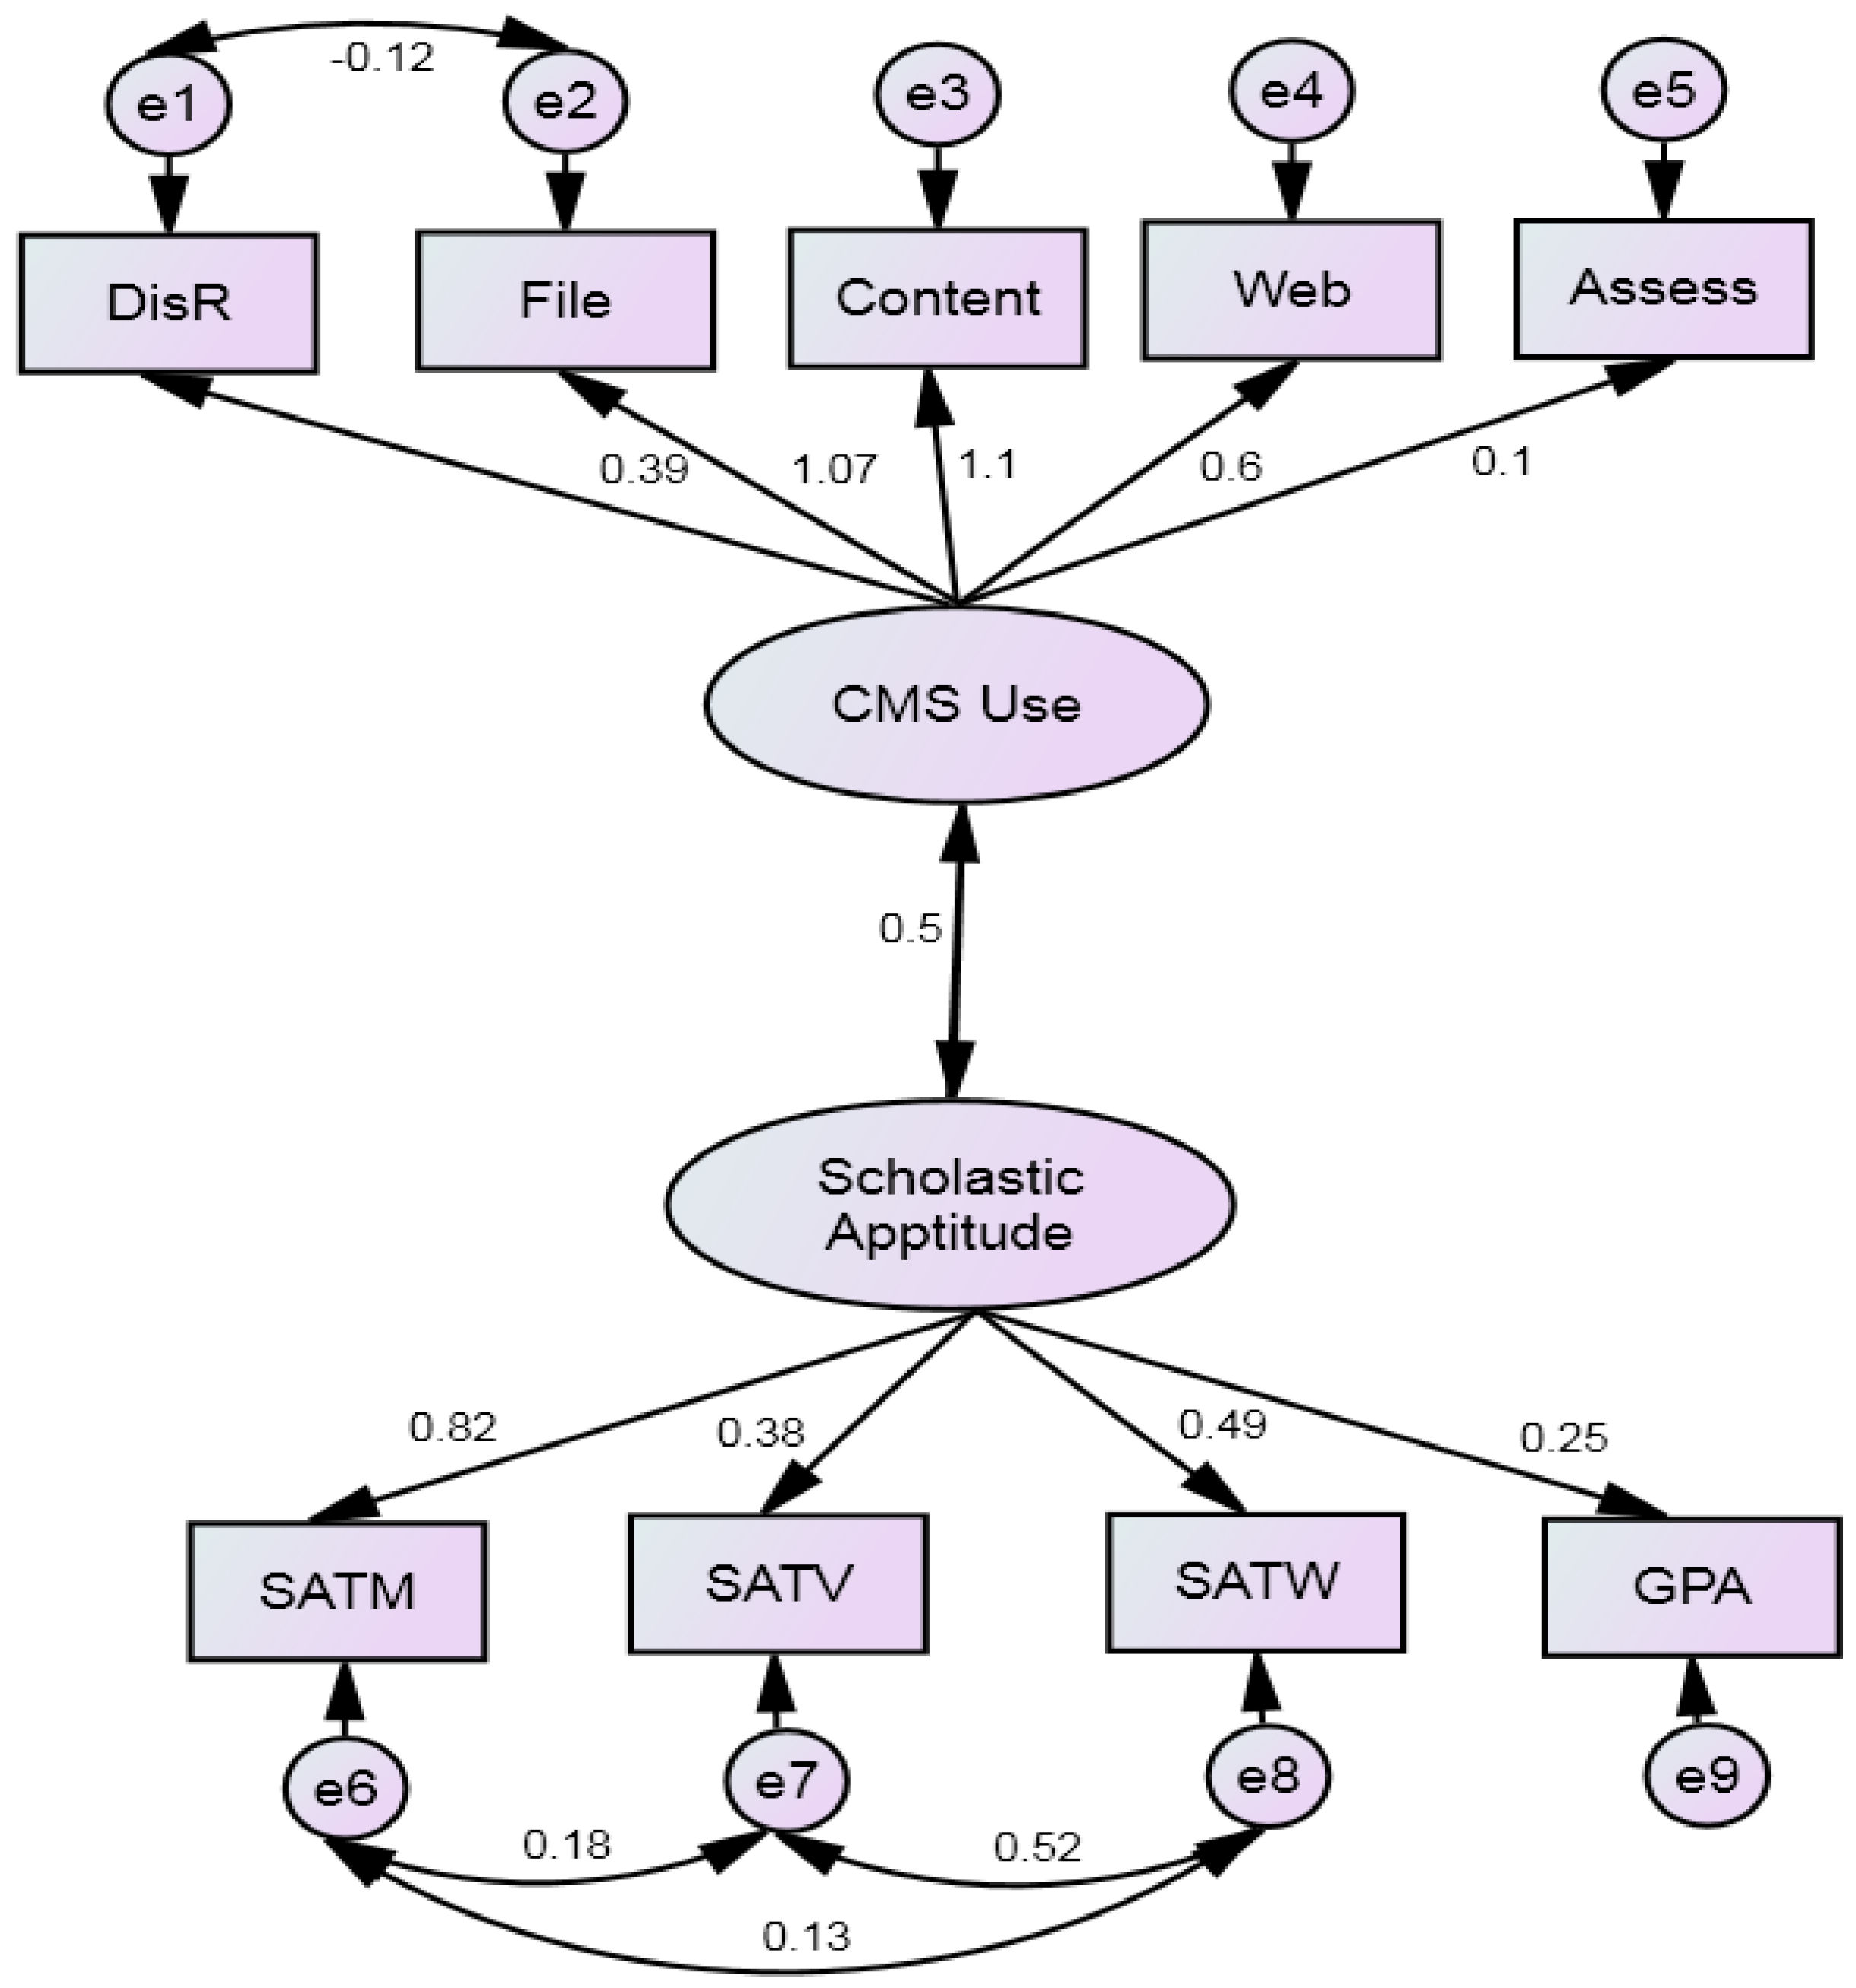
3.1. Measurement Model

| Loading | S.E. | Est./S.E. | p-Value | |
|---|---|---|---|---|
| CMS Use | ||||
| Discussion | 0.394 | 0.063 | 6.271 | <0.001 |
| Content | 1.100 | 0.027 | 40.956 | <0.001 |
| File | 1.066 | 0.028 | 38.096 | <0.001 |
| Web | 0.601 | 0.060 | 9.976 | <0.001 |
| Assessment | 0.097 | 0.043 | 2.269 | 0.023 |
| Academic Aptitude | ||||
| GPA | 0.245 | 0.042 | 5.839 | <0.001 |
| SAT Verbal | 0.384 | 0.082 | 4.682 | <0.001 |
| SAT Math | 0.821 | 0.095 | 8.648 | <0.001 |
| SAT Writing | 0.487 | 0.094 | 5.155 | <0.001 |
| CMS Use with Academic Aptitude a | 0.497 | 0.067 | 7.397 | <0.001 |
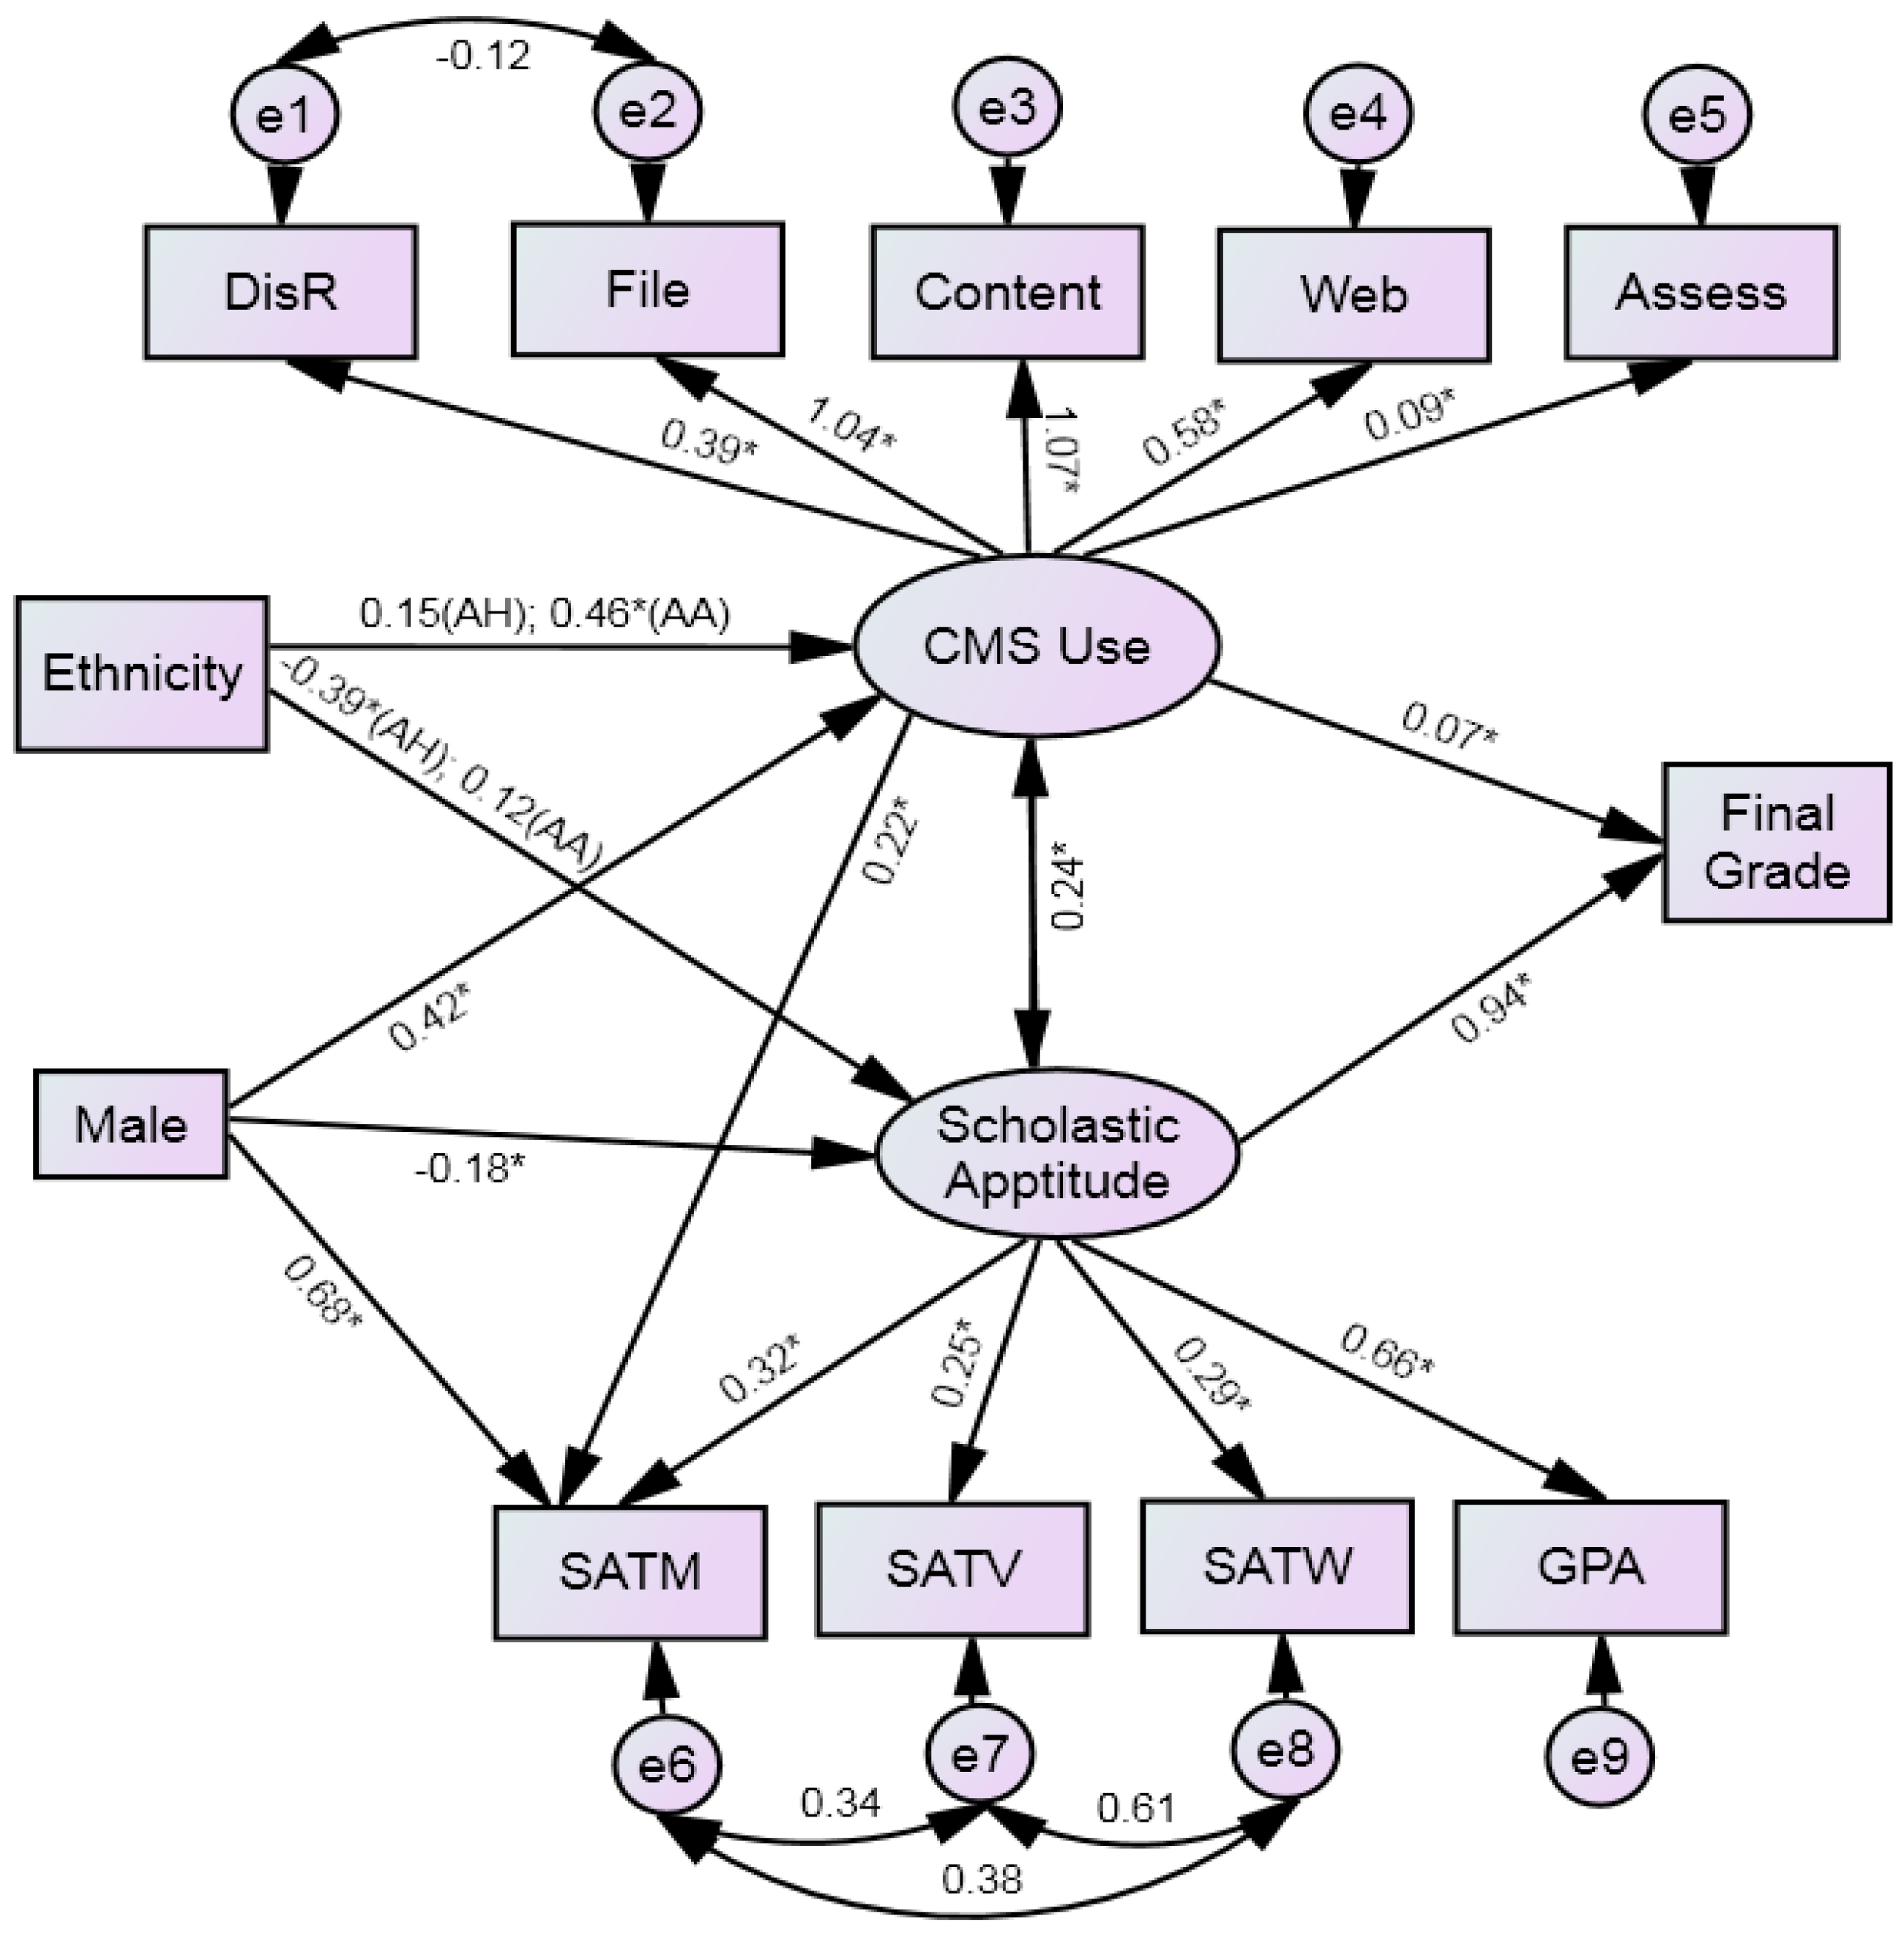
3.2. Structural Model

| CMS Use on a | Estimate (β) | S.E. | Estimate/S.E |
|---|---|---|---|
| Gender (Male = 1) | 0.420 | 0.076 | 5.562 * |
| African American & Hispanic | 0.153 | 0.182 | 0.841 |
| Asian | 0.459 | 0.111 | 4.147 * |
| Scholastic Aptitude on | |||
| Gender (Male = 1) | −0.178 | 0.082 | −2.184 * |
| African American & Hispanic | −0.388 | 0.198 | −1.961 * |
| Asian | 0.118 | 0.155 | 0.758 |
| CMS Use by b | |||
| SAT Mathematic | 0.221 | 0.027 | 8.246 * |
| SAT Mathematic on | |||
| Gender (Male = 1) | 0.678 | 0.053 | 12.721 * |
| Final Grade on | |||
| CMS Use | 0.068 | 0.028 | 2.450 * |
| Scholastic Aptitude | 0.944 | 0.039 | 24.259 * |
4. Discussion
4.1. Implication for Practice
4.1.1. Set Specific Educational Goals for Use of CMS and Providing Guidance
4.1.2. Encourage the Use of Advanced Statistical Modeling Methods to Integrate with Academic Analytics to Support Decision Making Process
4.1.3. Be Realistic about the Impact of CMS on Learning
4.2. Future Direction and Limitations
5. Conclusions
Acknowledgments
Conflicts of Interest
References
- Venkataraman, S.; Sivakumar, S. Engaging students in group based learning through e-learning techniques in higher education system. Int. J. Emerg. Trends Sci. Technol. 2015, 2, 1741–1746. [Google Scholar]
- Dahlstrom, E. The ECAR Study of Undergraduate Students and Information Technology. 2012. Available online: http://net.educause.edu/ir/library/pdf/ERS1208/ERS1208.pdf (accessed on 9 August 2014).
- Panday, R.; Purba, J.T. Lecturers and students technology readiness in implementing services delivery of academic information system in higher education institution: a case study. Commun. Comput. Inform. Sci. 2015, 516, 539–550. [Google Scholar]
- Pearce, K.; Rice, R. Digital divides from access to activities: Comparing mobile and personal computer Internet users. J. Commun. 2013, 63, 721–744. [Google Scholar] [CrossRef]
- Olatunji, S.O. Comparative assessment of public-private universities’ computer literacy contents of English language teacher preparation curricula in Nigeria. Eur. J. Sci. Res. 2011, 53, 108–116. [Google Scholar]
- Weller, C.E. Economic Snapshot: September. 2013. Available online: https://cdn.americanprogress.org/wp-content/uploads/2013/09/Economic_Snapshot_sep2013.pdf (accessed on 9 March 2015).
- Krumsvik, R.J. From digital divides to digital inequality—The emerging digital inequality in the Norwegian Unitarian school. US China Educ. Rev. 2008, 5, 1–17. [Google Scholar]
- Ghandoura, A.W. A qualitative study of ESL college students’ attitudes about computer-assisted writing classes. Engl. Lang. Teach. 2012, 5, 57–64. [Google Scholar]
- Bain, C.D.; Rice, M.L. The influence of gender on attitudes, perceptions, and uses of technology. J. Res. Technol. Educ. 2006, 39, 119–132. [Google Scholar] [CrossRef]
- Jackson, L.A.; Ervin, K.S.; Gardner, P.D.; Schmitt, N. Gender and the internet: Women communicating and men searching. Sex Roles 2009, 44, 363–379. [Google Scholar] [CrossRef]
- Schumacher, P.; Morahan-Martin, J. Gender, internet, and computer attitudes and experiences. Comput. Hum. Behav. 2001, 17, 95–110. [Google Scholar] [CrossRef]
- Compaine, B.M. The Digital Divide: Facing a Crisis or Creating a Myth? MIT Press: Cambridge, MA, USA, 2001. [Google Scholar]
- Norris, P. Digital Divide: Civic Engagement, Information Poverty, and the Internet Worldwide; Cambridge University Press: Cambridge, MA, USA, 2001. [Google Scholar]
- Johns, S.; Johnson-Yale, C.; Millermaier, S.U.S. College students’ internet use: Race, gender and digital divides. J. Comput. Mediat. Commun. 2001, 14, 244–264. [Google Scholar]
- Shashaani, L. Socioeconomic status, parents’ sex-role stereotypes, and the gender gap in computing. J. Res. Comput. Educ. 1994, 26, 433–452. [Google Scholar]
- Shashaani, L. Gender differences in computer attitudes and use among college students. J. Educ. Comput. Res. 1997, 16, 37–51. [Google Scholar] [CrossRef]
- Middendorf, E. Computernutzung und Neue Medien im Studium [Computer Use and New Media in Higher Education]; Bundesministerium fur Bildung und Forschung: Bonn, Germany, 2002. (In German) [Google Scholar]
- McCoy, L.P.; Heafner, T.L. Effect of gender on computer use and attitudes of college seniors. J. Women Minor. Sci. Eng. 2004, 10, 55–66. [Google Scholar] [CrossRef]
- Weber, K.; Custer, R. Gender-based preferences toward technology education content, activities, and instructional methods. J. Technol. Educ. 2005, 16, 55–71. [Google Scholar]
- Nicole, L.M.; Rosanna, E.G. Make new friends or keep the old: Gender and personality differences in social networking use. Comput. Hum. Behav. 2012, 28, 107–112. [Google Scholar]
- Deursen, A.V.; Dijk, J.V. The digital divide shift to differences in usage. New Media Soc. 2014, 16, 507–526. [Google Scholar] [CrossRef]
- Slate, J.R.; Manuel, M.; Brinson, K.H. The “digital divide”: Hispanic college students’ views of educational uses of the Internet. Assess. Educ. High. Educ. 2002, 27, 75–93. [Google Scholar] [CrossRef]
- Linda, A.; Jackson, L.A.; Zhao, Y.; Kolenic, A.; Fitzgerald, H.E.; Harold, R.; Eye, A.V. Race, gender, and information technology use: The new digital divide. CyberPsychol. Behav. 2008, 11, 437–442. [Google Scholar]
- Witte, J.C.; Mannon, S.E. The Internet and Social Inequalities; Routledge: New York, NY, USA, 2010. [Google Scholar]
- Wei, L.; Hindman, D.B. Does the digital divide matter more? Comparing the effects of new media and old media use on the education-based knowledge gap. Mass Commun. Soc. 2011, 14, 216–235. [Google Scholar] [CrossRef]
- Junco, R. Inequalities in Facebook use. Comput. Hum. Behav. 2013, 29, 2328–2336. [Google Scholar] [CrossRef]
- Chen, Y.C.; Hwang, R.H.; Wang, C.Y. Development and evaluation of a Web 2.0 annotation system as a learning tool in an e-learning environment. Comput. Educ. 2011, 58, 1094–1105. [Google Scholar] [CrossRef]
- Rollag, K. Teaching business cases online through discussion boards: Strategies and best practices. J. Manag. Educ. 2010, 34, 499–526. [Google Scholar] [CrossRef]
- Ross, D.N.; Rosenbloom, A. Reflections on building and teaching an undergraduate strategic management course in a blended format. J. Manag. Educ. 2011, 35, 351–376. [Google Scholar] [CrossRef]
- Empson, R. Education Grant Blackboard buys MyEdu to Help Refresh Its Brand and Reanimated Its User Experience. 2014. Available online: http://techcrunch.com/2014/01/16/education-giant-blackboard-buys-myedu-to-help-refresh-its-brand-and-reanimate-its-user-experience/ (accessed on 6 January 2015).
- Burgess, L.A. WebCT as an e-learning tool: A study of technology students’ perceptions. J. Technol. Educ. 2003, 15, 6–15. [Google Scholar]
- Unal, Z.; Unal, A. Evaluating and comparing the usability of web-based course management systems. J. Inf. Technol. Educ. 2011, 10, 19–38. [Google Scholar]
- Arbaugh, J.B.; Desai, A.; Rau, B.L.; Sridhar, B.S. A review of research on online and blended learning in the management disciplines: 1994–2009. Org. Manag. J. 2010, 7, 39–55. [Google Scholar] [CrossRef]
- Billsberry, J.; Rollag, K. Special issue: New technological advances applied to management education. J. Manag. Educ. 2010, 34, 634–636. [Google Scholar] [CrossRef]
- Wei, H.; Peng, H.; Chou, C. Can More Interactivity Improve Learning Achievement in an Online Course? Effects of College Students’ Perception and Actual Use of a Course-Management System on Their Learning Achievement. Comput. Educ. 2015, 83, 10–21. [Google Scholar] [CrossRef]
- Schneider, W.; Bjorklund, D.F. Expertise, aptitude, and strategic remembering. Child Dev. 1992, 63, 461–473. [Google Scholar] [CrossRef] [PubMed]
- Carstens, C.B.; Beck, H.P. The relationship of high school psychology and natural science courses to performance in a college introductory psychology class. Teach. Psychol. 1986, 13, 116–118. [Google Scholar] [CrossRef]
- Griggs, R.A.; Jackson, S.L. A reexamination of the relationship of high school psychology and natural science courses to performance in a college introductory psychology class. Teach. Psychol. 1998, 15, 142–144. [Google Scholar] [CrossRef]
- Adomi, E.A.; Anie, S.O. An Assessment of Computer Literacy Skills of Professionals in Nigerian University Libraries. Libr. Hi Tech. News 2006, 23, 10–14. [Google Scholar] [CrossRef]
- Erdogan, Y.; Aydin, E.; Kabaca, T. Exploring the psychological predictors of programming achievement. J. Instr. Psychol. 2008, 35, 264–270. [Google Scholar]
- West, S.G.; Finch, J.F.; Curran, P.J. Structural equation models with non-normal variables: Problems and remedies. In Structural Equation Modeling: Concepts, Issues, and Applications; Hoyle, R.H., Ed.; Sage: Thousand Oaks, CA, USA, 1995; pp. 56–75. [Google Scholar]
- Burbules, N.; Callister, T., Jr. Watch IT: The Promises and Risks of New Information Technologies for Education; Westview Press: Boulder, CO, USA, 2000. [Google Scholar]
- Flora, D.B.; Curran, P. An evaluation of alternative methods of estimation for confirmatory factor analysis with ordinal data. Psychol. Methods 2004, 9, 466–491. [Google Scholar] [CrossRef] [PubMed]
- Hu, L.T.; Bentler, P.M. Cutoff criteria for fit indexes in covariance structure analysis: Conventional criteria versus new alternative. Struct. Equ. Model. 1999, 6, 1–55. [Google Scholar] [CrossRef]
- MacCallum, R.C.; Austin, J.T. Application of structural equation modeling in psychology research. Annu. Rev. Psychol. 2000, 51, 201–226. [Google Scholar] [CrossRef] [PubMed]
- Kline, R.B. Principles and Practice of Structural Equation Modeling; Guilford Press: New York, NY, USA, 2005. [Google Scholar]
- Browne, M.V.; Cudeck, R. Alternative ways of assessing model fit. In Testing Structural Equation Model; Bollen, K.A., Long, J.S., Eds.; Sage: Newbury Park, CA, USA, 1993; pp. 136–161. [Google Scholar]
- Muthén, L.K.; Muthén, B.O. Mplus: Statistical Analysis with Latent Variables, User’s Guide; Muthén & Muthén: Los Angeles, CA, USA, 2010. [Google Scholar]
- College Entrance Examination Board. Profile of SAT and Achievement Test Takers; College Entrance Examination Board: New York, NY,USA, 1988. [Google Scholar]
- Butcher, D.F.; Muth, W.A. Predicting performance in an introductory computer science course. Commun. ACM 1985, 28, 263–268. [Google Scholar] [CrossRef]
- Dey, S.; Mand, L.R. Effects of mathematics preparation and prior language exposure on perceived performance in introductory computer science courses. SIGSCE Bull. 1986, 18, 144–148. [Google Scholar]
- Fan, T.S.; Li, Y.C. Is math ability beneficial to performance in college computer science programs? J. Natl. Taipei Teach. Coll. 2002, 1, 69–98. [Google Scholar]
- Konvalina, J.; Wileman, S.A.; Stephens, L.J. Math proficiency: A key to success for computer science students. Commun. ACM 1983, 26, 377–382. [Google Scholar] [CrossRef]
- Green, M.E. Journalism Students, Web 2.0 and the Digital Divide. Ph.D. Thesis, The University of Southern Mississippi, Hattiesburg, MS, USA, 2009. [Google Scholar]
- Bailey, M.J.; Dynarski, S.M. Gains and Gaps: Inequality in U.S. College Entry and Completion. 2011. Available online: http://www.nber.org/papers/w17633.pdf (accessed on 3 January 2015).
- Chee, K.H.; Pino, N.W.; Smith, W.L. Gender differences in the academic ethic and academic achievement. Coll. Stud. J. 2005, 39, 604–619. [Google Scholar]
- Abbott, R.; O’Donnell, J.; Hawkins, D.; Hill, K.; Kosterman, R.; Catalano, R. Change teaching practices to promote achievement and bonding to school. Am. J. Orthopsychiatry 1998, 64, 542–552. [Google Scholar] [CrossRef]
- Lei, J.; Zhao, Y. Technology uses and student achievement: A longitudinal study. Comput. Educ. 2007, 49, 284–296. [Google Scholar] [CrossRef]
- Warschauer, M.; Knobel, M.; Stone, L. Technology and equity in schooling: Deconstructing the digital divide. Educ. Policy 2004, 18, 562–588. [Google Scholar] [CrossRef]
- Dar, Y.; Getz, S. Learning ability, socioeconomic status, and student placement for undergraduate studies in Isreal. High. Educ. 2007, 54, 41–60. [Google Scholar] [CrossRef]
- Spencer, H.E. Mathematical SAT test scores and college chemistry grades. J. Chem. Educ. 1996, 73, 1150–1153. [Google Scholar] [CrossRef]
- House, J.D. Noncognitive predictors of achievement introductory college chemistry. Res. High. Educ. 1995, 36, 473–490. [Google Scholar] [CrossRef]
- Carmichael, J.W.J.; Bauer, J.S.; Sevenair, J.P.; Hunter, J.T.; Gambrell, R.L. Predictors of first-year chemistry grades for Black Americans. J. Chem. Educ. 1986, 63, 333–336. [Google Scholar] [CrossRef]
- Busato, V.V.; Prins, F.J.; Elshout, J.J.; Hamaker, C. The relation between learning styles, the big five personality traits and achievement motivation in higher education. Personal. Individ. Differ. 2000, 26, 129–140. [Google Scholar] [CrossRef]
- Chamorro-Premuzik, T.; Furnham, A. Personality predicts academic performance: Evidence from two longitudinal university samples. J. Res. Personal. 2003, 37, 319–338. [Google Scholar] [CrossRef]
- Reeves, T.C.; Reeves, P.M. Educational technology research in a VUCA world. Educ. Technol. 2015, 55, 26–30. [Google Scholar]
- Judith, S. Using an adapted, task-level technology acceptance model to explain why instructors in higher education intend to use some learning management system tools more than others. Comput. Educ. 2014, 71, 247–256. [Google Scholar]
- Siemens, G. The journal of learning analytics: Supporting and promoting learning analytics research. J. Learn. Anal. 2014, 1, 3–4. [Google Scholar]
- Lei, J. Quantity versus quality: A new approach to examine the relationship between technology use and student outcomes. Br. J. Educ. Technol. 2009, 41, 455–472. [Google Scholar] [CrossRef]
- MacCallum, R.C.; Wegener, D.T.; Uchino, N.N.; Fabrigar, L.R. The problem of equivalent models in applications of covariance structure analysis. Psychol. Bull. 1993, 114, 185–199. [Google Scholar] [CrossRef] [PubMed]
© 2015 by the authors; licensee MDPI, Basel, Switzerland. This article is an open access article distributed under the terms and conditions of the Creative Commons Attribution license ( http://creativecommons.org/licenses/by/4.0/).
Share and Cite
Li, Y.; Wang, Q.; Campbell, J. Investigating Gender and Racial/Ethnic Invariance in Use of a Course Management System in Higher Education. Educ. Sci. 2015, 5, 179-198. https://doi.org/10.3390/educsci5020179
Li Y, Wang Q, Campbell J. Investigating Gender and Racial/Ethnic Invariance in Use of a Course Management System in Higher Education. Education Sciences. 2015; 5(2):179-198. https://doi.org/10.3390/educsci5020179
Chicago/Turabian StyleLi, Yi, Qiu Wang, and John Campbell. 2015. "Investigating Gender and Racial/Ethnic Invariance in Use of a Course Management System in Higher Education" Education Sciences 5, no. 2: 179-198. https://doi.org/10.3390/educsci5020179
APA StyleLi, Y., Wang, Q., & Campbell, J. (2015). Investigating Gender and Racial/Ethnic Invariance in Use of a Course Management System in Higher Education. Education Sciences, 5(2), 179-198. https://doi.org/10.3390/educsci5020179