Article

Diverging Trajectories: A Five-Year Study of Teachers’ and Students’ Technology Perceptions Across the Arrival of Generative AI

School of Education, Adelaide University, Adelaide, SA 5005, Australia
Educ. Sci. 2026, 16(9), 1542; https://doi.org/10.3390/educsci16091542 (registering DOI)
Submission received: 30 August 2026 / Revised: 16 September 2026 / Accepted: 16 September 2026 / Published: 18 September 2026

Abstract

This five-wave survey study (2021–2025), longitudinal at school level and repeated cross-sectional at respondent level, tracked teachers’ and students’ (n = 1355 and 1756 responses, respectively) perceptions of classroom technology in four Australian secondary schools spanning a broad socioeconomic range using the UTAUT constructs as an analytical lens across the period of generative artificial intelligence’s (Gen-AI’s) arrival. Perceptions rose in both groups for three years, then diverged sharply: successive student cohorts continued rising on all four constructs, while teachers reversed, ending below their 2021 baseline on performance expectancy (d = −1.06) and social influence (d = −0.94). Linear mixed-effects models confirmed the wave–group interaction on every construct (all p < 0.001). School means were ordered consistently with socioeconomic advantage (ICSEA) at every wave, while device policy was associated with smaller differences. The reversal coincided with the emergence of Gen-AI as a dominant technology in respondents’ free-text nominations. Because the UTAUT items concern classroom technology in general, this coincidence is an association between two independently measured series. On that basis, I propose that discontinuity is a property of the relation between a technology’s capabilities and a role’s accountable tasks and is, therefore, a question to be asked separately of each school population.

1. Introduction

The presence of digital technology in Australian secondary schools has shifted from exception to infrastructure within a generation. One-to-one computing programs, learning management systems (LMSs) and ubiquitous classroom projection have combined to create what Paiva et al. (2016) characterise as a condition in which the “e” is quietly disappearing from “e-learning”. The COVID-19 pandemic accelerated an already established trajectory. A substantial body of research has, however, established that access to technology is only weakly related to effectiveness in its use (Selwyn et al., 2017) and that technology-rich classrooms often reproduce rather than transform pre-existing pedagogies (Ertmer et al., 2012; Selwyn et al., 2017). Understanding technology in secondary schools, therefore, requires attention not only to what is installed, but to how teachers and students perceive it.
This question has acquired new urgency with the arrival of generative artificial intelligence (Gen-AI) in classrooms. Some commentators argue that Gen-AI differs in that rather than storing, delivering, or presenting content, it produces it and, in doing so, unsettles assessment, authorship and the teacher’s epistemic authority (Chan, 2023; Kasneci et al., 2023). The historical record, however, counsels caution about claims of rupture. Successive technologies, from film and radio to interactive whiteboards and tablets, have each been heralded as transformative, only to be absorbed into the existing routines of schooling (Barbieri & Palmer, 2025; Hu et al., 2020). Whether Gen-AI marks a genuine discontinuity or is assimilated like its predecessors is, at present, an open empirical question that perceptions tracked across the period of its arrival are well placed to address.
Despite the maturity of this literature, important and related gaps remain. Most perception research is cross-sectional, which struggles to explain how perceptions shift over time. Furthermore, teacher voices dominate the empirical record, with student perceptions at the secondary level comparatively under-represented (Section 2.2). And although the digital-divide literature shows access and meaningful use stratified along socioeconomic lines (Section 2.3), few perception studies differentiate systematically across school-level measures of socioeconomic status. Finally, although device-policy arrangements (for instance, whether a school mandates particular devices or expects students to supply their own) are a daily variable in contemporary Australian secondary schooling, they are rarely treated as a structured analytical variable.
This study addresses those gaps through a five-year longitudinal survey investigation (2021–2025) of four co-educational Australian secondary schools spanning Index of Community Socio-Educational Advantage (ICSEA) values from 913 to 1122, drawn from the government, Catholic and independent sectors. Two of the participating schools operate mandated-device programs, in which the school specified the device; two operate bring-your-own-device (BYOD) programs. In each year of this study, Year 9 student cohorts and all teaching staff at each school complete an online survey.
Perceptions are analysed through the Unified Theory of Acceptance and Use of Technology (UTAUT; Venkatesh et al., 2003) and its four core determinants—performance expectancy (PE), effort expectancy (EE), social influence (SI) and facilitating conditions (FC)—which organise survey responses from both groups across the five waves. The framework and the analytical rather than predictive use made of it here are detailed in Section 2.4.
This design supports four research questions:
RQ1: What technologies do teachers and Year 9 students identify as most important in their classrooms, and how does this change over 2021–2025?
RQ2: How do teachers’ and students’ perceptions of classroom technologies, as measured through UTAUT constructs, change over five years?
RQ3: How do these perceptions differ across schools of varying socioeconomic status?
RQ4: How does voluntariness of technology use, operationalised through the contrast between mandated-device and BYOD school policies and validated against a direct measure of perceived voluntariness, relate to teachers’ and students’ perceptions?

2. Literature Review

2.1. Technology in Secondary Education

The past two decades have seen successive waves of digital technology enter Australian secondary classrooms (Barbieri & Palmer, 2025; Selwyn et al., 2017). Shared computer laboratories gave way to trolleys of laptops, then to one-to-one programs underpinned by cloud-based productivity suites. Across OECD countries, Australia has been identified as among the most intensive school-based users of the internet. In 2012, Australian students spent more time online during school hours than those of any other participating country (OECD, 2015). Cloud-hosted documents and LMSs now form the infrastructure of everyday teaching rather than a supplementary layer added to conventional methods.
The COVID-19 pandemic both accelerated and exposed this trajectory. In a study of headteacher leadership across the United Kingdom during the March–June 2020 lockdown, Beauchamp et al. (2023) describe the period as one in which schools drew rapidly on already available technologies to sustain core educational functions. Similar observations have been made in widely varying national contexts (Chomunorwa et al., 2022), where the pandemic forced previously optional technologies into frontline pedagogical roles. For the present study, this matters because the five-year data-collection window (2021–2025) begins in the immediate aftermath of this step-change, allowing perceptions to be tracked as what was once emergency practice consolidates, or not, into routine practice.
A critical strand of the literature cautions against reading ubiquity as transformation. Selwyn et al. (2017), in an ethnographic study of three Australian secondary schools, found that personal devices were largely subsumed into existing organisational routines—the latest instance of a century-old pattern of technologies bent to reproduce rather than disrupt established classroom practice (Barbieri & Palmer, 2025). Selwyn et al. (2020) extend this argument, urging scholarship to move beyond framings of digital tools as inherently positive goods and to attend to the sociocultural and political-economic dynamics shaping what is adopted, on whose terms, and with what consequences.

2.2. Teacher and Student Perceptions

Research on how teachers perceive classroom technology has long emphasised the mediating role of beliefs. Ertmer et al. (2012), in a widely cited study of twelve award-winning technology-using teachers, revisited the distinction between first-order barriers (external factors such as access, training and support) and second-order barriers (internal factors such as beliefs about teaching and confidence in technology). They found that, as first-order barriers diminish, second-order barriers become increasingly decisive (Johnson, 2009).
Subsequent work has refined and complicated this picture. Sauers and McLeod (2018) found that teachers in 1:1 schools in Iowa reported higher levels of both personal technology competency and classroom technology integration than their counterparts in non-1:1 schools. This phenomenon, repeated in Australian educational contexts (Barbieri, 2020), suggests that school-level structural decisions can condition the individual-level beliefs that Ertmer and colleagues identify. Comparative studies similarly show teacher perceptions negotiated against institutional cultures and material conditions rather than held in isolation (Chomunorwa et al., 2022; Demetriadis et al., 2003). The literature on school leadership (Banoğlu et al., 2023; Håkansson Lindqvist, 2019) further demonstrates that principals’ and headteachers’ technology leadership practices shape the conditions under which teachers form and revise their perceptions.
Student perceptions have received less sustained attention, particularly at the secondary level. The limited existing work sketches a complex and sometimes unflattering picture. Stone (2017), reporting on a secondary school 1:1 laptop program, found that student perceptions were predominantly negative due to a range of technical issues. Mourlam et al. (2020) found that primary and middle-school children’s experiences of educational technology varied sharply with contextual resourcing (e.g., 1:1 vs. computer lab). At the secondary level, Goriss-Hunter et al. (2022) draw on Australian student and teacher data to argue that student digital agency is a critical correlate of engagement. Cutting across these findings is Selwyn et al.’s (2017) observation that students’ classroom device use was characterised by ordinariness rather than transformation.

2.3. Socioeconomic Context and Technology

The digital-divide literature distinguishes between a “first digital divide” concerned with physical access to devices and connectivity, and a “second digital divide” concerned with differences in the quality, variety and skilled use of the technologies to which people have access (Attewell, 2001; DiMaggio et al., 2004; OECD, 2015). PISA data analysed in the OECD’s Students, Computers and Learning report show that, across most OECD countries during the 2009–2012 period, first-order access gaps narrowed considerably, yet second-order gaps in how students used ICT persisted and, in some cases, widened (OECD, 2015). In the words of that analysis, equal access does not imply equal opportunity.
The prior literature (Chomunorwa et al., 2022; Mourlam et al., 2020) suggests that SES differences are most likely to be visible in infrastructural, technical and available support resources, rather than in beliefs about usefulness or ease per se. This conjecture is examined empirically in the present study through the tracking of the participating schools’ Index of Community Socio-Educational Advantage (ICSEA), a measure developed by the Australian Curriculum, Assessment and Reporting Authority (ACARA) that combines parental education and occupation, geographic location, and the proportion of Indigenous students to provide a standardised comparator across schools (2015). ICSEA is widely used in analyses of academic outcomes, but it is rarely deployed in the educational-technology literature as a systematic variable for comparing school contexts.

2.4. The UTAUT Framework

UTAUT (Venkatesh et al., 2003) was developed by consolidating eight prior models of individual technology acceptance into a single parsimonious framework. Drawing on longitudinal data collected at three measurement points across four organisations, Venkatesh et al. (2003) showed that the unified model substantially outperformed each of its eight source models in explaining intention to use a new technology. This longitudinal validation is worth noting at the outset because UTAUT was not designed as a cross-sectional instrument. The model was built to capture how the weight of each determinant shifts as users move through the early, intermediate and sustained phases of use. UTAUT is, therefore, well-suited to longitudinal research design.
UTAUT specifies four direct determinants of behavioural intention and use. Performance expectancy (PE) is defined as “the degree to which an individual believes that using the system will help him or her to attain gains in job performance” (Venkatesh et al., 2003, p. 447); effort expectancy (EE) as the degree of ease associated with using the system (p. 450); social influence (SI) as the perception that important others believe one should use it (p. 451); and facilitating conditions (FC) as “the degree to which an individual believes that an organizational and technical infrastructure exists to support use of the system” (p. 453). The UTAUT framework has been extensively applied in educational research, including to the adoption of LMSs, mobile learning, virtual classrooms, interactive whiteboards and emerging mobile technologies (Ley et al., 2022). Šumak and Šorgo (2016) applied an extended UTAUT model to schoolteachers’ acceptance of interactive whiteboards and showed that the determinants of acceptance differed systematically between teachers who had already adopted the technology and those who had not. This finding complicates the assumption of a single, stable acceptance profile and supports tracking UTAUT determinants over time.
Three features of UTAUT suit the present investigation. First, its consolidation of prior models offers more analytical purchase than the narrower two-construct TAM, while remaining simpler to operationalise than UTAUT2 (Venkatesh et al., 2012). Second, UTAUT’s voluntariness-of-use moderator maps directly onto the BYOD/mandated-device distinction that divides the four participating schools. Relatedly, Venkatesh et al.’s (2003) finding that effort-expectancy effects attenuate with experience supports a directional expectation for the longitudinal dimension.
UTAUT is not without limitations. Ley et al. (2022) argue that the framework and its variants treat the technology as a fixed object rather than as something that is socially constructed and adapted in use. Similar critiques have been raised by ethnographic and critical scholars (Selwyn et al., 2017, 2020), who argue that technology use in schools is shaped as much by organisational routines, power relations, and sociocultural norms as by individual-level attitudes. Methodologically, UTAUT has also been criticised for achieving its high explanatory power partly through the addition of up to four moderators, which some have argued compromises parsimony (see Dwivedi et al., 2019). The present study responds to these critiques by using UTAUT as an analytical lens rather than a purely predictive structural model. Items are mapped to its constructs and scores tracked across years, schools and groups.

2.5. Generative AI and the Teaching Role

Gen-AI entered schools during the study period, and the literature on it is recent and fast-growing. Early reviews converged on assessment, authorship and academic integrity as the domains most immediately unsettled (Kasneci et al., 2023; Lo, 2023; Swiecki et al., 2022). Cotton et al. (2024) framed the integrity problem as one of distinguishing student work from generated work; Bower et al. (2024), surveying 318 educators across levels and regions, found that most expected Gen-AI to have a profound effect on teaching and assessment, with expectations varying by teaching level and discipline. A parallel line of work asks directly whether Gen-AI can substitute for teachers, a question that has moved from speculation (Selwyn, 2019) to empirical study of perceptions of replacement (Chan & Tsi, 2024) and to appraisal of the limits of that substitution (Selwyn, 2024).
Regarding teachers’ perceptions, surveys and interviews conducted after Gen-AI’s arrival report a mixture of anticipated productivity gains, concern about integrity and de-skilling, and uncertainty about institutional expectations (Bower et al., 2024; Kaplan-Rakowski et al., 2023), extending an earlier review that had already identified workload, trust, and role ambiguity as recurrent themes (Celik et al., 2022). Technology-acceptance research has followed the same path, extending UTAUT and UTAUT2 with AI-specific constructs and testing them on respondents surveyed after adoption (Cabero-Almenara et al., 2024; Section 5.4). Almost all of this work is cross-sectional and post-arrival. Secondary schooling is also under-represented relative to higher education, where most of the assessment and integrity literature originates.
Institutional and policy responses were led by UNESCO (2023), which issued guidance calling for human-centred, age-appropriate and regulated use. In Australia, the period of the present study spans the national response. Education Ministers released the Australian Framework for Generative Artificial Intelligence in Schools in December 2023 and implemented it from Term 1 of 2024 (Australian Government Department of Education, 2023). Its six principles address teaching and learning, wellbeing, transparency, fairness, accountability and privacy, and leave the development of school-level positions on assessment and permitted use to jurisdictions and schools. The framework’s arrival between the third and fourth waves of this study, therefore, marks the point at which schools moved from an absence of guidance to a national statement of principle without, as yet, settled local practice.

3. Methodology

3.1. Research Design

This study adopted a five-wave survey design, longitudinal at the level of each school’s teacher and Year 9 populations and repeated cross-sectional at the level of individual respondents. The same instrument was administered annually over five consecutive years (2021–2025) to Year 9 student cohorts and all teaching staff at four Australian secondary schools (Table 1), with institutional ethics clearance by the University of Adelaide Human Research Ethics Committee (H-2021-159; consent procedures are described in the Informed Consent Statement).
Surveys were administered in Term 4 of each year at all four schools within a 3-week window, so that the waves are comparable in position within the school year. Neither strand is a panel. Surveys were anonymous, and responses were not linked across waves. The student strand is a repeated cross-section of successive Year 9 cohorts; the teacher strand is a series of repeated samples drawn from substantially overlapping, but not identical, school staff populations (Section 3.2). The estimand throughout is, therefore, change in group-level means across waves, not within-person change.
Three features made this design appropriate. The phenomenon under investigation (teachers’ and students’ perceptions of classroom technologies) is dynamic, so repeated annual measurement was intrinsic to the research questions. This involved administering the same UTAUT-based instrument to both groups in the same schools over the same period to allow their trajectories to be compared directly, and the comparative design across four schools and two device-policy regimes required measurement consistent across contexts. Two contextual facts bear on the interpretation of the later waves. The Australian Framework for Generative Artificial Intelligence in Schools (Australian Government Department of Education, 2023), which applied to all four schools, was released between the Y3 and Y4 waves and took effect from Term 1 of 2024, so Y4 was the first wave collected under a national policy on Gen-AI (Section 2.5). Device provision at all four schools was unchanged across the five waves. Other hypothetical school-level events that could bear on the findings were not recorded.

3.2. Participants and Sites

3.2.1. Schools and Context

The study was conducted in four co-educational secondary schools located in Australia, selected to span the three dominant schooling sectors (government, Catholic, independent) and a broad range of the Index of Community Socio-Educational Advantage (ICSEA; ACARA, 2015). Table 2 summarises the four sites, here anonymised as Schools A, B, C, and D. Two schools operate mandated-device programs and two schools operate BYOD programs.

3.2.2. Year 9 Student Participants

Each year, the Year 9 cohort at each school was invited to complete the student survey (selected because Year 9 precedes Senior school curricular requirements that constrain devices and software options that students can use for assessment). Across the five waves, 1756 students participated (61.7% of the eligible Year 9 cohorts across the four schools and five years), with annual per-school samples detailed in Table 1. Student respondents were 53% female, 41% male and 6% other/not stated, with proportions stable across waves. Each year, the Year 9 cohort was a fresh group of students, so the student data constitute a repeated cross-sectional design at the cohort level rather than a panel design at the individual level.

3.2.3. Teacher Participants

All teaching staff at each school were invited to complete the teacher survey each year. All staff were surveyed because teachers teach across year levels—most teach Year 9 in any given year—and the items concern whole-school technology context rather than practice at a single year level. Across the five waves, 1355 teacher surveys were completed (80.1% of invited teaching staff), with annual per-school samples detailed in Table 1. Surveys were anonymous and individual responses were not linked across waves.
Teacher respondents were 57% female, 41% male and 3% other; 52% had taught for more than ten years, 30% for fewer than five; and the largest learning-area groups were English and Mathematics at 32% each. These proportions varied by no more than 5% across waves at any school, consistent with the stable staff population described above. Because teaching staff at each school remained largely stable across the study period, successive teacher samples overlap substantially in membership. However, the design cannot estimate within-person change, distinguish continuing from newly appointed teachers, assess individual-level attrition, or model teacher-specific trajectories. The teacher strand is, therefore, best understood as a series of repeated samples from overlapping populations rather than as a panel, and all teacher results are reported as changes in wave means.

3.3. Survey Instrument

The survey was organised into six sections: Section A gathered demographic information; Section B asked respondents to list in free text the technologies they considered most important in their classrooms (RQ1); Section C asked about choice and voluntariness in technology use; Section D presented the four UTAUT batteries (rated 1–7: PE, EE, SI and FC); Section E covered technology and learning impacts; and Section F invited final free-text thoughts. Parallel student and teacher versions of the instrument were identical in structure and differed only in role-appropriate wording (Table S2). This paper analyses Sections B, C and D (Table S2). Section A was used to characterise the samples (Section 3.2). Section E is reported in a companion study. Section F responses are not analysed here. The instrument is available from the author, subject to the conditions of the ethics approval.
Section D items were adapted from Venkatesh et al.’s (2003) original UTAUT scales, with wording modifications to fit the secondary-school classroom context (Table S2). Items were rated on a seven-point Likert scale anchored on “strongly disagree” (1) and “strongly agree” (7), following Venkatesh et al.’s (2003) original response format. The one reverse-worded item (facilitating conditions; Venkatesh et al.’s PBC5) was reverse-scored prior to subscale computation. Subscale scores were computed as the mean of the four construct items for respondents with at least three valid items; respondents with fewer than three valid items on a construct were excluded from that construct’s analyses only. No imputation was performed. The extent and distribution of item-level missingness, and a complete-case sensitivity analysis, are reported at the start of Section 4. Internal consistency of each UTAUT subscale was assessed at each wave using Cronbach’s alpha, with the a priori expectation that α ≥ 0.70 would indicate acceptable reliability for each subscale at each wave.

3.4. Data Analysis

The first stage of analysis was descriptive, reflecting the study’s comparative and longitudinal aims. For each UTAUT subscale, means and standard deviations were computed per school, per wave, and for teacher and student groups separately. Group-level means reported in the text and in Table 3 are the unweighted average of the four school means, so that each school context contributes equally to the aggregate irrespective of its cohort size. The mixed-effects models (below) are estimated on respondent-level data and, therefore, weight respondents equally. The two bases differ by at most 0.02 points at any wave. Change across the five waves was examined through plots of subscale means over time, disaggregated by school and by device-policy regime. Differences between schools and between device-policy regimes were examined descriptively through effect sizes (Cohen’s d for pairwise comparisons, η2 for multi-school comparisons). Device-policy comparisons were computed separately for teachers and students, since the BYOD/mandated distinction governs student device choice directly and teacher device provision only indirectly. Between-school comparisons are reported descriptively; individual- and group-level comparisons are tested inferentially in the second stage below. Cronbach’s alpha was computed for each UTAUT subscale in each school–wave–group cell as the instrument-reliability check described in Section 3.3. The Section C voluntariness item was analysed descriptively as a validity check on the device-policy contrast used to address RQ4.
Free-text responses to the Section B item were analysed through structured content analysis. Responses were segmented into individual technology nominations, normalised to consolidate spelling variants and brand-name synonyms, and coded into technology categories using a frame developed inductively from the Y1 responses and extended, with earlier categories retained, as new technologies appeared. Coding was performed by the author using a written codebook in Y1 and thereafter extended only by adding categories. Categories were developed inductively from the Y1 responses by grouping normalised nominalisations by primary classroom function. Categories were only added in later waves when nominations that fitted no existing category exceeded 10% of responses in that wave. A random 20% sample of responses stratified by wave was re-coded by the author after an interval of 10 weeks, with intra-coder agreement of κ = 0.80. Where the two passes disagreed, the disagreement was resolved by reference to the codebook definition. Because coding was not independently replicated, the category prevalences should be read as the product of a single coder’s judgement; this is recorded as a limitation in Section 5.7. Coding was not blind to respondent group or wave. Multi-technology responses generated one nomination per technology. Ambiguous nominations were resolved by assigning the category to the corresponding function the respondent described, and nominations too vague to classify were coded ‘unspecified’ and therefore excluded. Category prevalence was computed per wave and group as the percentage of respondents nominating at least one technology in the category; these figures underpin the three-phase periodisation in Section 4.1.
The second stage tested the study’s longitudinal contrast between teacher and student trajectories. This was achieved formally through linear mixed-effects models, estimated separately for each UTAUT construct. This approach respects the nesting of respondents within schools and provides a formal test of the wave–group interaction, a stronger warrant than a series of pairwise effect sizes. Each model specified the respondent-level subscale mean as the outcome; wave (Y1–Y5), group (teacher-vs.-student) and their interaction as fixed effects; and a random intercept for school. Seeing as respondents were not linked across waves, each wave was treated as an independent sample within school, and the wave–group interaction estimates change in the difference between the teacher and student wave means, rather than change within individuals. The two series also differ in composition. The student series compares successive Year 9 cohorts, whose members differ in prior schooling, digital experience and exposure to Gen-AI, whereas the teacher series compares heavily overlapping samples of the same staff. A rising student series is, therefore, consistent with cohort replacement, as well as with attitude change, and the interaction should be read as a divergence between two population-level series rather than as a comparison of two within-population trajectories. The wave–group interaction (the model term corresponding to the teacher–student divergence) was evaluated through likelihood-ratio tests comparing maximum-likelihood fits with and without the interaction term. Unconditional (intercept-only) models were estimated first to partition variance within and between schools via the intraclass correlation coefficient (ICC).
Two constraints follow from the four-school design: school-level characteristics were not entered as predictors, and, because random-effect variance estimates are unstable with few clusters (McNeish & Stapleton, 2016), all models were re-estimated with school as fixed effects, with substantive conclusions unchanged. Multilevel modelling conventions follow Raudenbush and Bryk (2002). A final caveat concerns measurement invariance: formal invariance testing across groups and waves was not conducted, so comparisons of construct levels between teachers and students assume the adapted items functioned equivalently in both populations (Putnick & Bornstein, 2016). This assumption is least secure for PE, whose items differ in wording between student and teacher versions, and most secure for EE, SI and FC, whose items are identical.
All analyses used lme4 (Bates et al., 2015) and lmerTest (Kuznetsova et al., 2017). Mixed-effects models were specified as yij = β0 + Σβ_w Wave_w + β_g Group + Σβ_wg (Wave_w × Group) + uj + eij, with Wave entered as four dummy variables (reference Y1), Group as one dummy (reference Student), uj ~ N(0, τ2) the school random intercept, and eij ~ N(0, σ2) the residual. Models were estimated by maximum likelihood so that nested models could be compared by likelihood-ratio test. ICCs were computed as τ2/(τ2 + σ2) from the unconditional models. Respondents with a valid subscale score (Section 3.3) contributed to that construct’s model. Residual diagnostics (Q–Q plots and residual-versus-fitted plots) showed no material departure from normality. Cohen’s d was computed for each pairwise comparison as the difference in cell means divided by the pooled standard deviation of the two cells being compared. Where a mean d across waves is reported, it is the arithmetic mean of the five wave-specific values. η2 for the four-school comparison was computed from a one-way ANOVA on respondent-level subscale scores within each wave–group cell.


4. Findings

The findings are reported in seven subsections: the changing technology landscape (4.1), the four UTAUT constructs (4.2–4.5), the mixed-effects models testing the teacher–student divergence (4.6), and a synthesis against the research questions (4.7). Reliability is reported at the end of each construct subsection. Cohen’s d effect sizes are reported for headline comparisons, and η2 values are reported for the four-school school-level comparison at each wave, with each following Cohen (1988) conventions.

4.1. Changing Technology Landscape

The free-text Section B item asked teachers and students each year to identify the technologies they considered most important in their classrooms. Across the five waves, three distinct phases emerged. In 2021 (Y1), responses were dominated by video-conferencing platforms (Zoom, Microsoft Teams) and LMSs (SEQTA, Daymap, Google Classroom, SchoolBox). This pattern reflects the immediate post-lockdown environment, in which schools had stabilised on the platforms of emergency remote learning. Video-conferencing platforms were nominated by 64% of teachers and 56% of students in Y1, and LMSs by 72% and 65%, respectively. No other category was nominated by more than a quarter of either group.
In 2022–2023 (Y2–Y3), the dominant referents shifted away from video conferencing toward tablet-based hardware and content-creation software (Canva, iMovie, Adobe Express, Notability, Word, Powerpoint, Keynote). This middle-phase pattern is more pronounced in Schools C and D, reflecting the higher density of personal devices at the higher-ICSEA sites. Video-conferencing nominations collapsed to 11% of teachers and 9% of students by Y3, while nominations of tablet hardware rose to 51% and 58%, respectively, and content-creation software to 47% and 52%. LMS nominations, by contrast, remained within a narrow band across the entire study (58–72% across all cells), consistent with their infrastructural rather than foreground status. At Schools C and D, 61% of students nominated at least one technology in the tablet or content-creation categories at the Y2–Y3 peak, against 36% at Schools A and B.
In 2024–2025 (Y4–Y5), Gen-AI tools (ChatGPT in particular, as well as Copilot and Gemini) emerged as a third dominant category, alongside the persistent LMS. Gen-AI tools, nominated by 7% of teachers and 5% of students in Y3, were nominated by 44% and 39% in Y4 and by 71% and 66% in Y5. Over the same interval, nominations of tablet hardware and content-creation software fell to roughly half their Y3 levels (Table 4). By Y5, the pairing of an AI tool with the LMS was the modal response for both groups, offered by 52% of teachers and 47% of students, with no other pairing exceeding 30%.
Subscale scores were computed for respondents with at least three of the four construct items (Section 3.3). Item-level missingness on the Section D batteries was low. Across the 3111 surveys, 7.2% of respondents had at least one missing UTAUT item, and 4.1% were excluded from at least one construct for having fewer than three valid items. The per-construct exclusions were 3 (PE), 89 (EE), 16 (SI) and 23 (FC); analytic sample sizes for each model are reported in Table 5. The rate of any missing item varied modestly by wave (5–8%), school (4–8%) and group (teachers 6%, students 8%). Re-estimating the mixed-effects models on complete cases (respondents with all four items on every construct, n = 2983) left all wave–group interactions significant at p < 0.001; descriptive effect sizes were not recomputed on the complete-case sample.

4.2. Performance Expectancy

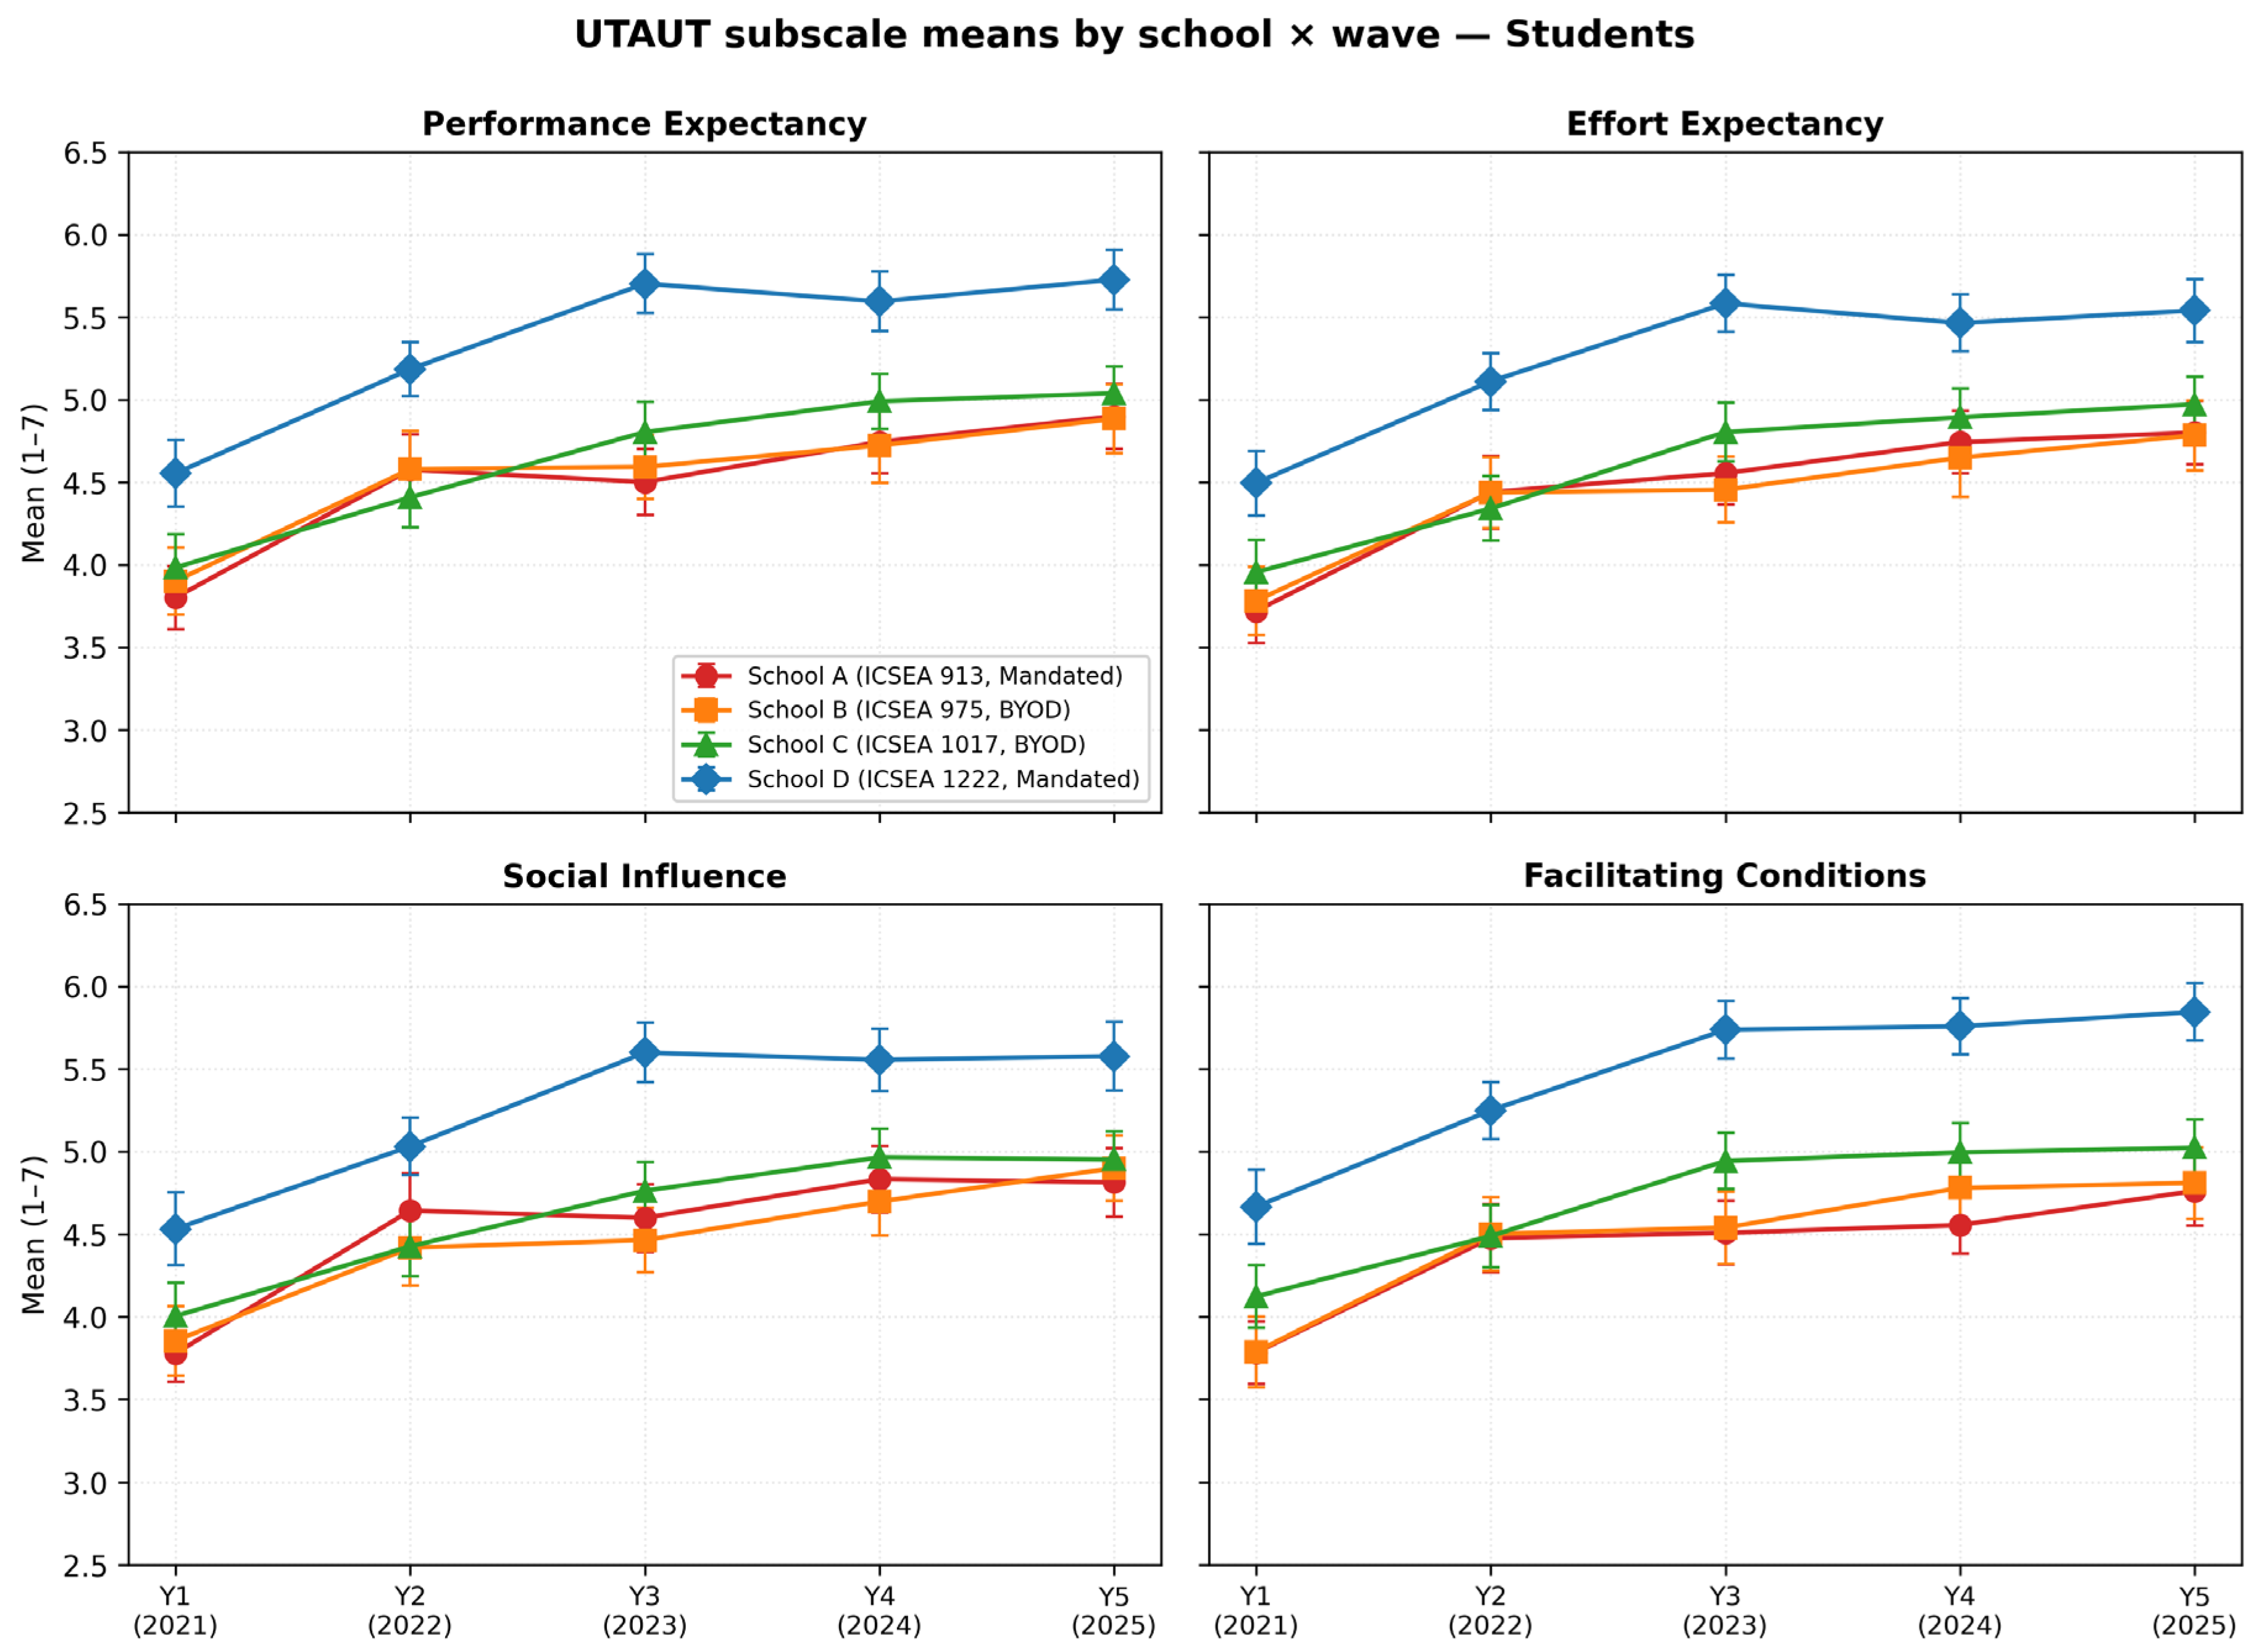
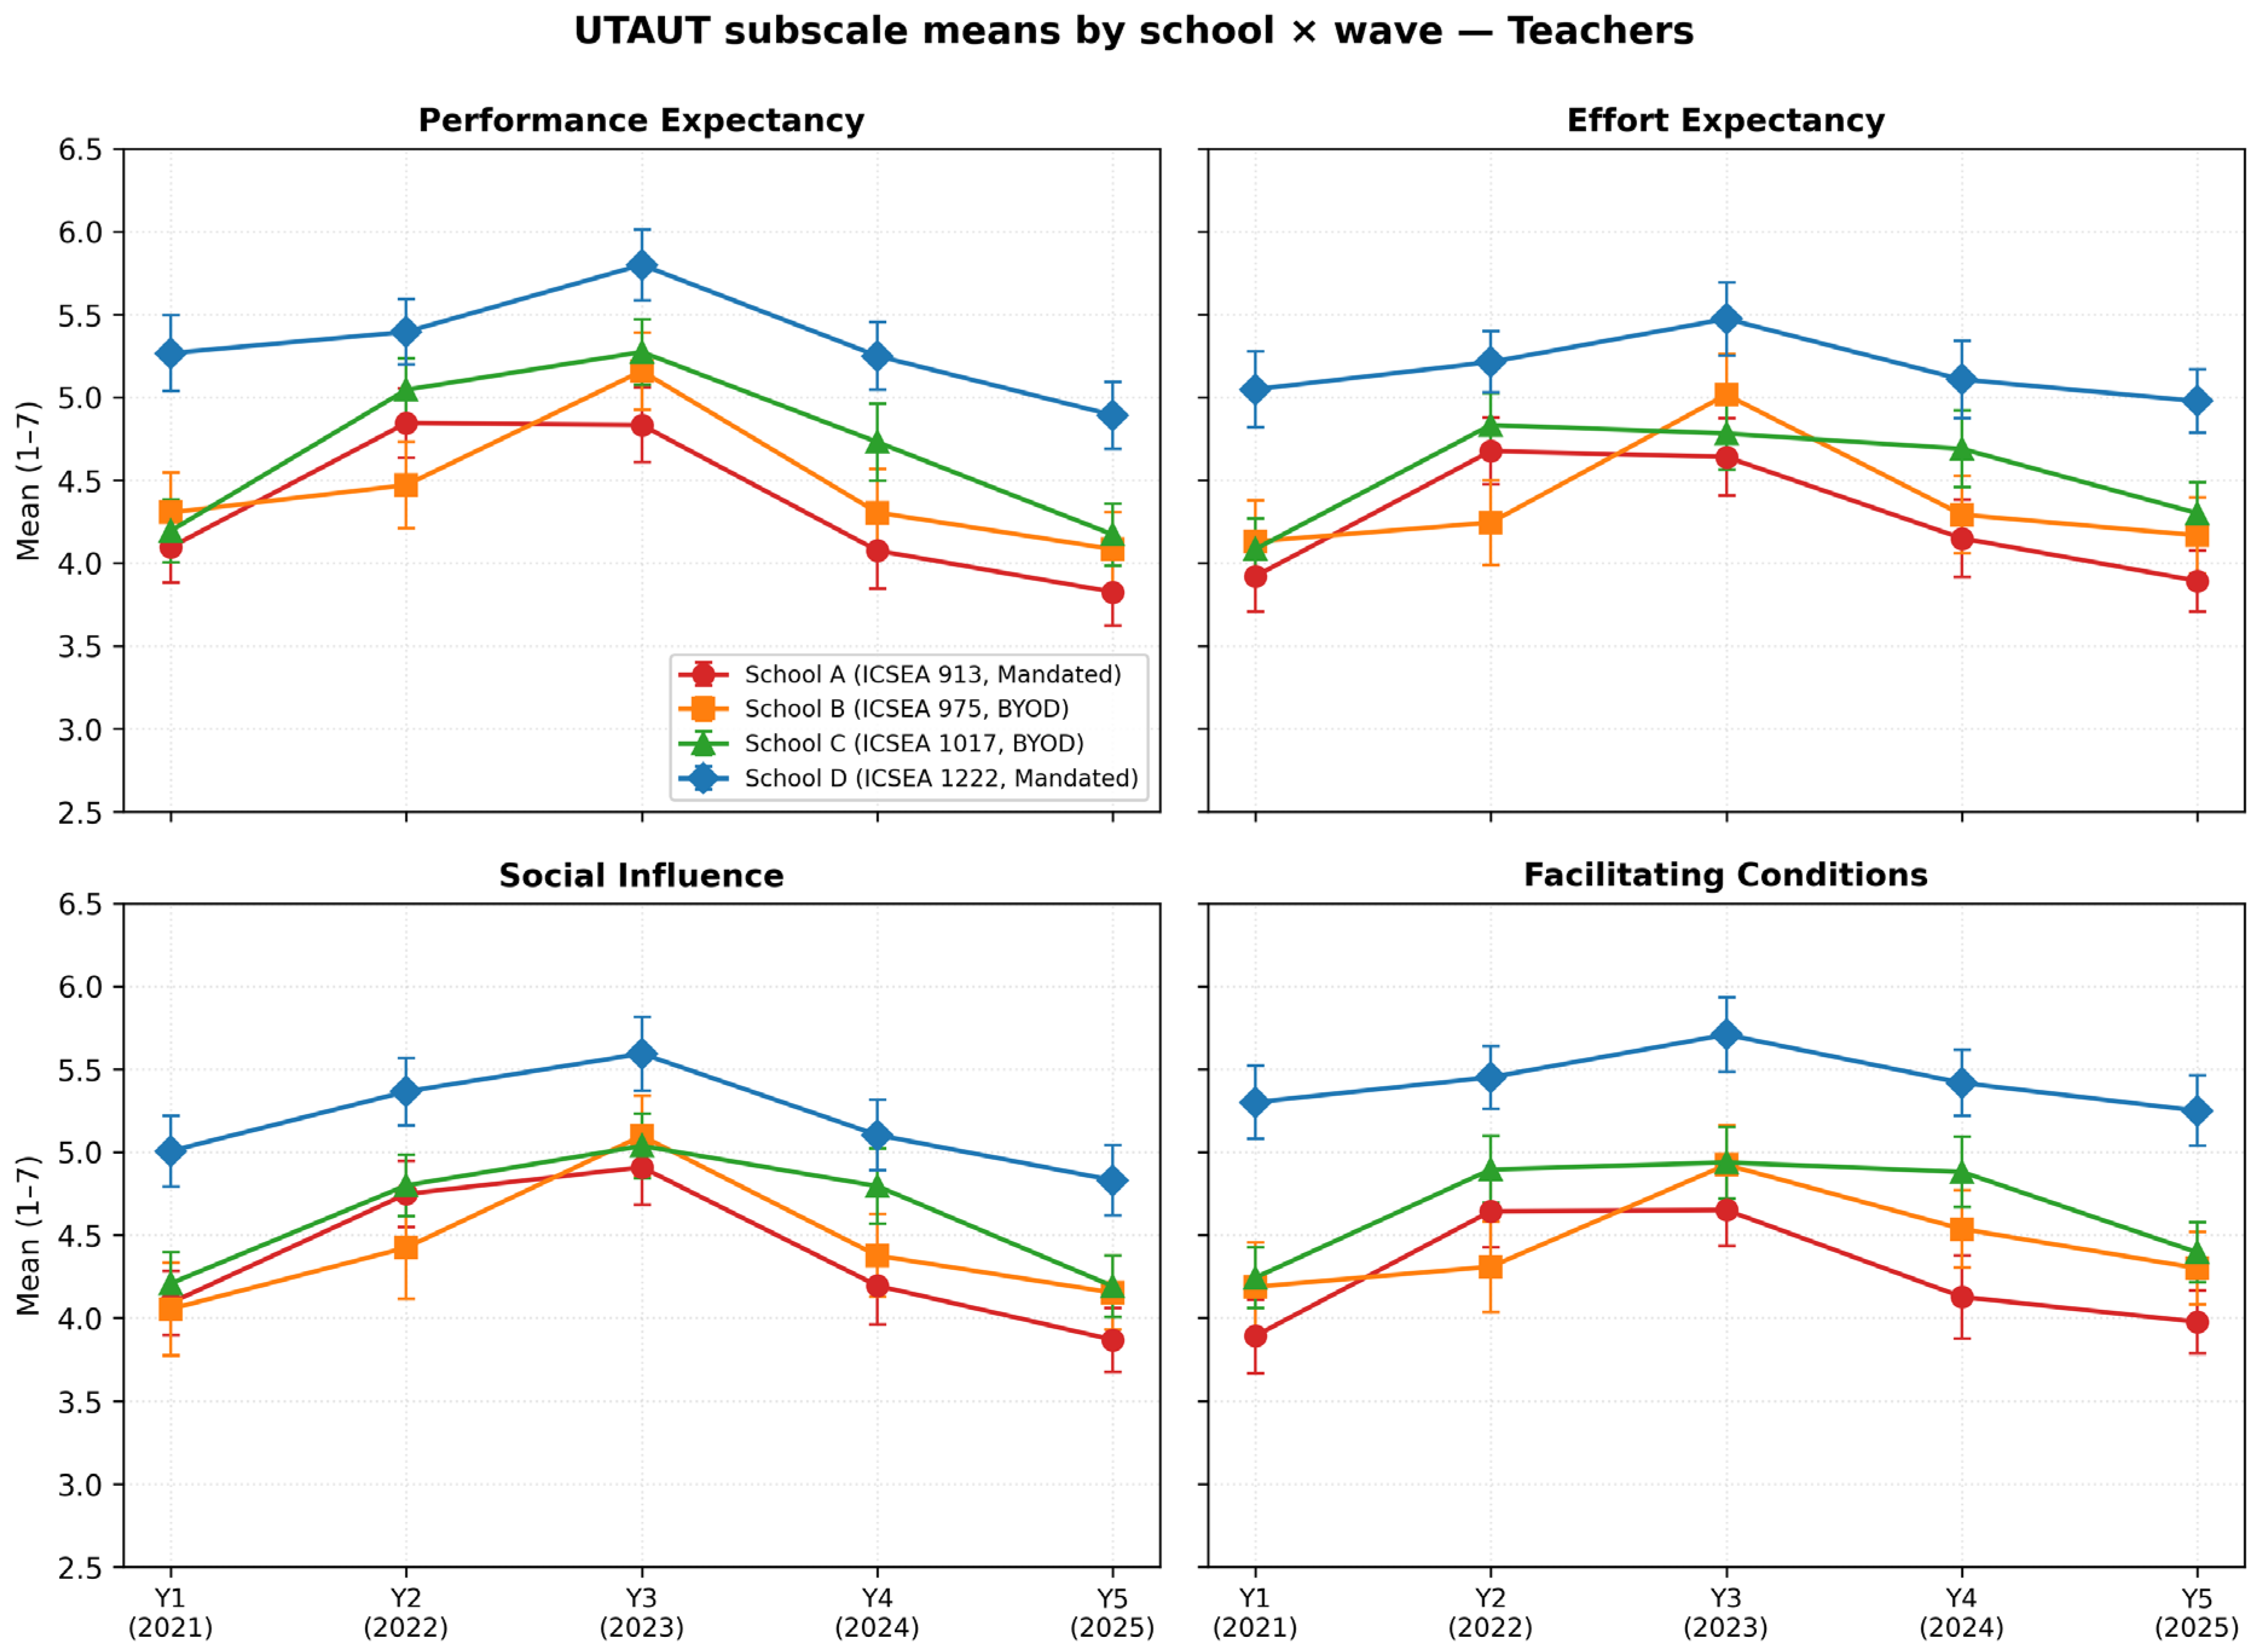
Group-level means for all four constructs are reported in Table 3; school-level cell means, standard deviations and 95% confidence intervals are reported in Supplementary Table S1 and visualised in Figure 1 (students) and Figure 2 (teachers).
PE rose substantially for both groups across the first three waves. Student PE rose from M = 4.06 in Y1 to M = 4.90 in Y3 and continued to rise more gradually through Y4 (M = 4.99) and Y5 (M = 5.14). Teacher PE rose more steeply, from M = 4.46 in Y1 to a peak of M = 5.26 in Y3. From Y3 onward, however, the two groups diverged. Teacher PE fell to M = 4.60 in Y4 and to M = 4.23 in Y5, ending the study below its Y1 baseline. The Y3-to-Y5 change in the teacher wave mean corresponded to a large negative effect size (d = −1.06). The student wave mean over the same interval continued to rise, with a small positive effect size (d = 0.22).
School-level differences were substantial. Averaged across the five waves, student PE was lowest at School A (M = 4.48) and highest at School D (M = 5.31), with Schools B (M = 4.52) and C (M = 4.70) intermediate. A similar ordering held for teachers (Schools A 4.32, B 4.59, C 4.59, D 5.30), though Schools B and C did not differ. The η2 for the four-school comparison ranged from 0.09 to 0.22 across waves and groups, indicating consistent medium-to-large effects. The pairwise School D vs. School A comparison ranged from d = 0.64 to d = 1.23 across the five waves and both groups (mean d = 0.90), a large effect throughout. The Y3-to-Y5 teacher decline was visible at all four schools (with preserved ICSEA ordering) but most pronounced at School B.
Cronbach’s α for the four-item PE subscale was acceptable across all 40 cells, ranging from 0.73 to 0.86. No PE cells fell below the a priori 0.70 threshold.

4.3. Effort Expectancy

Student EE rose from M = 3.99 in Y1 to M = 4.84 in Y3 and continued to rise to M = 5.02 in Y5. Teacher EE rose from M = 4.29 to M = 4.98 over the first three waves, then fell to M = 4.32 in Y5, a medium negative effect (d = −0.66) that returned the teacher mean to close to its Y1 baseline (Table 3). School-level differences again separated Schools A and D, with Schools B and C intermediate and closely matched (Table S1). The School D vs. School A comparison ranged from d = 0.70 to d = 1.09 across waves (mean d = 0.90), and the η2 for the four-school comparison ranged from 0.09 to 0.20. Two cells returned Cronbach’s α below the 0.70 threshold: School D Y2 students (α = 0.69) and School D Y2 teachers (α = 0.67). In both, the depressed reliability appears to reflect a mild ceiling effect, with item means clustered in the upper range of the scale and reduced variance. The remaining 38 EE cells returned α between 0.71 and 0.85.

4.4. Social Influence

Both groups rose substantially across the first three waves, with teacher SI peaking at M = 5.16 in Y3 (Table 3). Teacher SI then fell to M = 4.62 in Y4 and M = 4.25 in Y5, a large Y3-to-Y5 effect (d = −0.94) that ended the study below the Y1 baseline, while student SI continued to rise across all five waves to M = 5.06. The school ordering matched that of PE and EE (Table S1). The School D vs. School A comparison ranged from d= 0.62 to d = 1.00 (mean d = 0.78), and the η2 for the four-school comparison ranged from 0.07 to 0.19, the smallest of the four constructs. Cronbach’s α for SI ranged from 0.73 to 0.87 across the 40 cells.

4.5. Facilitating Conditions

FC rose for both groups across the first three waves, with teacher FC reaching M = 5.05 in Y3 (Table 3). The Y3-to-Y5 teacher decline was the smallest of the four constructs (d = −0.59, medium negative), and the Y5 teacher mean (M = 4.46) remained slightly above the Y1 baseline (M = 4.41). Student FC rose throughout to M = 5.11. School-level differences were largest on this construct (Table S1). The School D vs. School A comparison ranged from d = 0.74 to d = 1.26 (mean d = 1.05), a large effect for teachers at every wave and for students from Y3 onwards, and η2 for the four-school comparison ranged from 0.12 to 0.26, the largest range of the four constructs. Cronbach’s α for FC ranged from 0.71 to 0.85 across the 40 cells; no FC cells fell below the a priori threshold.

4.6. Linear Mixed-Effects Models of the Teacher–Student Divergence

The descriptive patterns reported above (Table 4) were tested formally through the linear mixed-effects models specified in Section 3.4, estimated separately for each construct with a random intercept for school. Model summaries are reported in Table 5. Unconditional models indicated that between-school differences accounted for a meaningful share of variance in every construct. Intraclass correlations were 0.15 (PE), 0.14 (EE), 0.12 (SI) and 0.20 (FC). The ICC ordering—largest for FC, smallest for SI—mirrors the descriptive η2 pattern.
In the full models, the wave–group interaction was significant for every construct (likelihood-ratio tests: PE χ2(4) = 242.6; SI χ2(4) = 180.2; EE χ2(4) = 131.5; FC χ2(4) = 110.8; all p < 0.001), confirming that teacher and student trajectories diverged over the five waves. Interaction coefficients reveal that, relative to the Y1 baseline, the teacher–student gap was essentially unchanged at Y2 and Y3 (coefficients between −0.19 and −0.01), then shifted sharply at Y4 (−0.59 to −0.81) and further at Y5 (−0.94 to −1.29, all p < 0.001). Because residual standard deviations were close to 1.0 in every model, these coefficients can be read approximately as within-cell standard-deviation units. The Y5 coefficients order PE (−1.29), SI (−1.11), EE (−1.00), FC (−0.94): largest for the evaluative constructs, smallest for the operational. Sensitivity models replacing the school random intercept with school fixed effects returned similar conclusions (interaction F tests: p < 0.001), indicating that findings do not depend on random-effects specification with the small number of clusters.

4.7. Synthesis: Cross-Cutting Patterns and the Teacher–Student Divergence

The most consistent school-level pattern was ordering by ICSEA. Across all four constructs, at every wave and in both groups, the school means were ordered from School A to School D, with medium-to-large D-vs-A effects throughout and school-level variance shares confirmed by the multilevel ICCs (Table 4 and Table 5). This is the headline answer to RQ3: school means were ordered consistently with ICSEA on every construct, with the largest between-school differences on FC and the smallest on SI. With four schools, the gradient is reported as an association rather than as an effect of socioeconomic composition. The pattern aligns directly with the digital-divide literature reviewed in Section 2.3, particularly the OECD (2015) finding that infrastructural and support gaps persist even where headline access has been equalised.
Perceived voluntariness of technology use (the Section C item) tracked school device policy closely. Respondents at the BYOD schools reported far higher voluntariness (M = 5.0, SD = 1.1) than respondents at the mandated-device schools (M = 2.5, SD = 1.1), d = 2.27, confirming that the policy contrast functions as a valid proxy for voluntariness as experienced. The device-policy comparison, therefore, carries the answer to RQ4. Descriptive differences between the two device-policy groupings were considerably smaller than the differences between individual schools, and they moved in opposite directions for the two groups. Mandated-device schools (A and D) showed higher means than BYOD schools (B and C) on all four constructs, averaging d = 0.23 among teachers and d = 0.34 among students. Among teachers, the gap was widest in the first two waves and attenuated thereafter, consistent with Venkatesh et al.’s (2003) finding that social influence is most salient in mandatory settings and fades as use routinises. Among students, the gap instead widened to a Y3 peak (Table 6). Two qualifications temper this reading: the effect was of similar magnitude on all four constructs rather than concentrated on SI, and the device-policy groupings are not balanced on ICSEA composition.
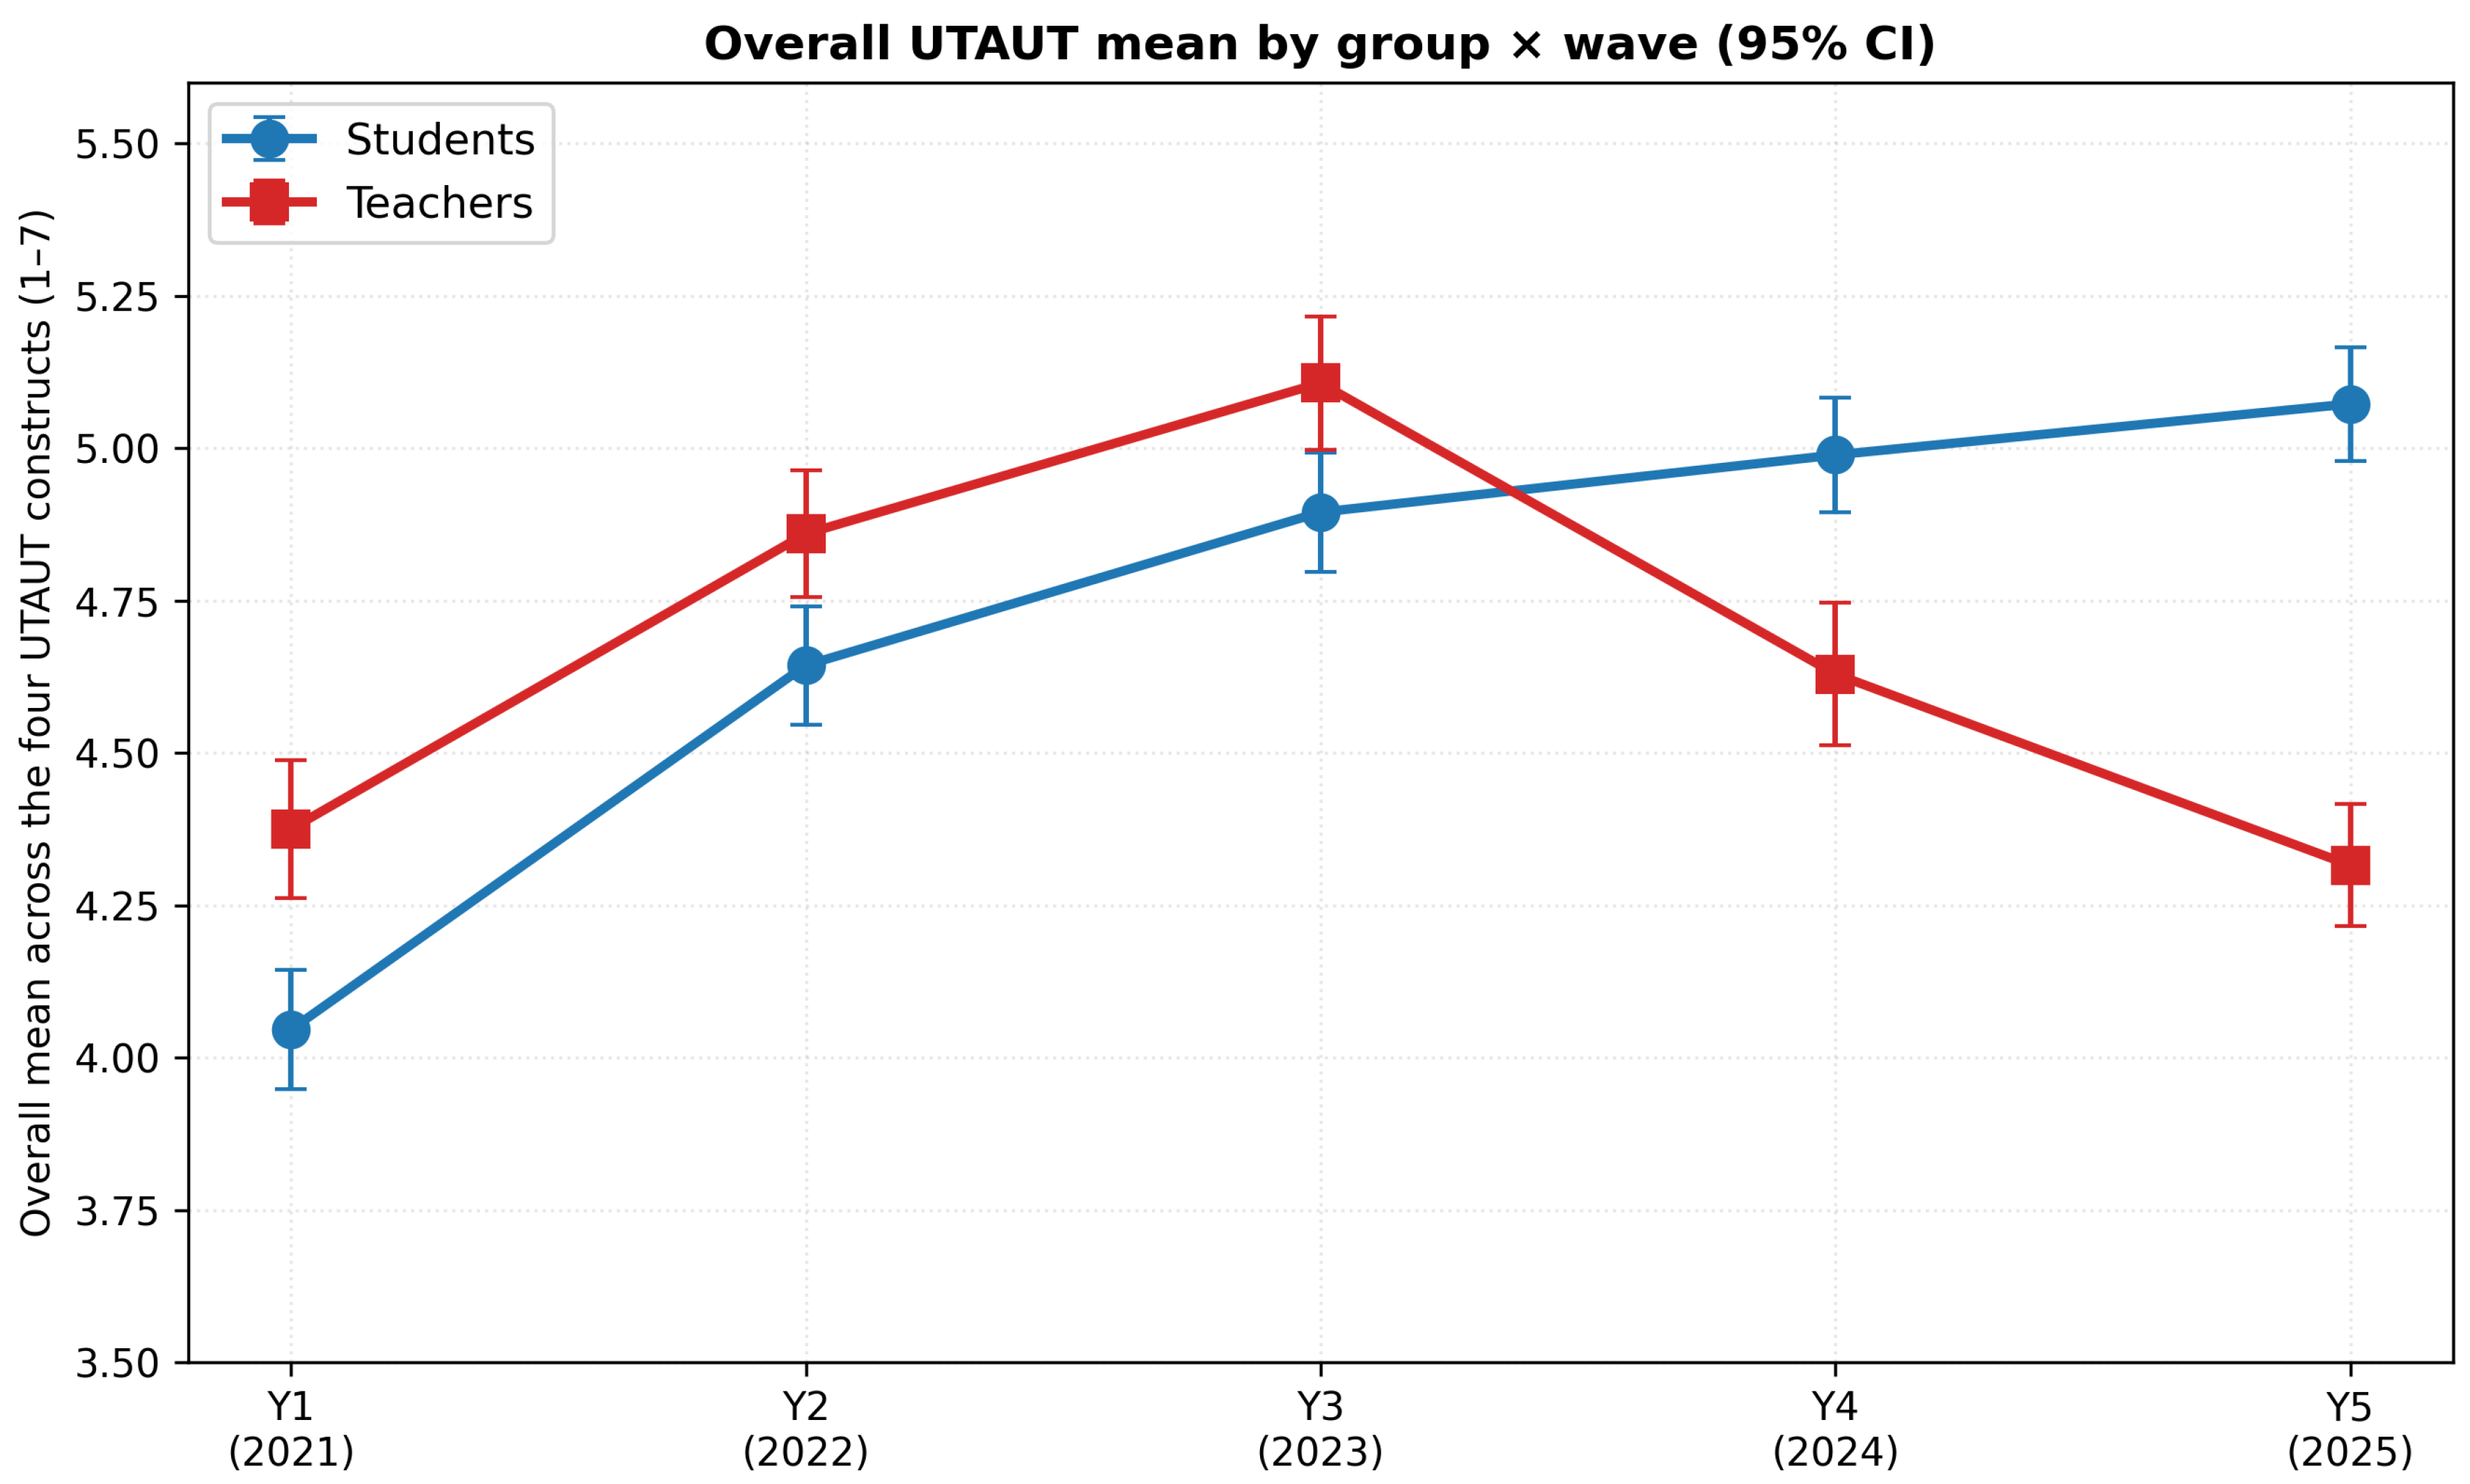
Another significant pattern is that teacher and student series diverged sharply between Y3 and Y5. Where successive student cohorts continued to rise on all four constructs across the five waves, teacher wave means showed a substantial Y3-to-Y5 decline, though unevenly across constructs. Teacher PE fell most steeply (d = −1.06), followed by teacher SI (d = −0.94), teacher EE (d = −0.66) and teacher FC (d = −0.59). The construct-by-construct profile of the teacher decline is interpretively meaningful. Teachers’ perceptions of PE and SI declined sharply, while their perceptions of EE and FC declined less. By Y5, the cross-group gap that had favoured teachers in Y1 had reversed: teachers scored below students on every construct (Table 3; Figure 3). Figure 3 plots the mean of the four subscale scores as a descriptive summary of the crossover. It is not treated as a scale, and the four constructs are analysed separately throughout. Any comparison of levels between the two groups assumes that the adapted items functioned equivalently in both populations. The change in the gap, rather than its sign at any single wave, is the finding on which the study relies. The mixed-effects models in Section 4.6 show that this divergence is a statistically significant wave–group interaction on every construct rather than an artefact of aggregation.
The profile of the teacher decline, steepest on the evaluative constructs, is the central finding of the study. It coincided with the emergence of Gen-AI as a dominant technology category in Y4–Y5, an association examined in Section 5.

5. Discussion

The findings raise three questions, taken in turn below: whether acceptance of classroom technology can reverse; whether a technological transition is experienced uniformly across a school community; and what the answers imply for the theoretical apparatus of technology-acceptance research.

5.1. The Reversal and Its Methodological Consequences

Aggregate teacher acceptance of classroom technology did not improve and then plateau; it improved substantially for three years. It reached its peak on every construct at Y3 and then reversed on every construct, ending below the Y3 level on all four and below the Y1 baseline on PE and SI (Table 3). Five years in which device access was universal, the LMS infrastructure was established and staff experience with it accumulated ended with teachers holding marginally less favourable perceptions of classroom technology than they held at the beginning. This trajectory is difficult to accommodate within the standard treatment of experience in technology-acceptance research. Venkatesh et al. (2003) modelled experience as a moderator that attenuates the weight of effort-based perceptions as users move towards routinisation. Subsequent educational applications (Šumak & Šorgo, 2016) have largely inherited the assumption. This present study suggests that acceptance in schools can be non-monotonic, and that the reversal need not be preceded by any deterioration in the material conditions of use.
The methodological consequence holds independently of any explanation for the reversal. A cross-sectional study of these four schools conducted in 2023 would have found teachers scoring above students on every construct; the same study in 2025 would have found the reverse. Whether either snapshot licensed a claim about which group was ‘more favourably disposed’ depends on measurement equivalence the present study could not verify, but the methodological point does not. The two snapshots would have supported opposite conclusions. Neither snapshot would have been wrong about its moment; each would have supported conclusions that the other contradicts. Given that the great majority of teacher- and student-perception research is cross-sectional, this is a caution about the evidentiary base of the field rather than about any individual study.
Admittedly, while Y1 and Y5 answered identically worded items about “classroom technology,” the referent of that phrase changed materially over the five years (from video conferencing and LMS to Gen-AI). Part of the reversal may, therefore, reflect a change in what was being evaluated rather than a change in how a stable object was evaluated. The force of this concern is bounded, however, by its symmetry. The referent changed for students under the same items in the same classrooms, and the Section B data indicate that the change was common to both groups. The category composition of free-text nominations moved in near lockstep for teachers and students (Table 7). Referent change common to both populations cancels out of the teacher–student contrast; the divergence would be an artefact of referent instability only if the two groups had come to evaluate materially different technologies, which the free-text record contradicts.

5.2. A Role-Specific and Construct-Selective Reversal

The reversal of responses was confined to one of the two populations surveyed, and within that population, it was concentrated in a particular pair of constructs. The student series offers a comparison, though not a control. It constrains only those explanations that would be expected to register in both populations to a similar degree, such as a school-wide failure of infrastructure or a withdrawal of device provision, since a shock of that kind would be unlikely to leave successive student cohorts rising on facilitating conditions while teachers fell. It does not constrain explanations that bear more heavily on teachers than on students, and there are many: workload intensification, assessment-integrity concerns, professional accountability, staffing shortages, curriculum reform, changing leadership expectations, uncertainty about institutional policy on AI, general morale, and fatigue among staff who were surveyed up to five times where each student cohort was surveyed once. The student series is further weakened as a comparison by its repeated cross-sectional composition. Its rise may reflect cohort replacement as much as attitude change. What the comparison does establish is narrower than a clean counterfactual. The decline was specific to occupying the teaching role in these schools, and whatever produced it did not extend to the students taught in the same rooms with the same technologies.
Teacher perceptions fell on all four constructs, and it would be inaccurate to describe EE or FC as having held steady: both declined by medium effects (d = −0.66 and −0.59). Yet, the evaluative constructs (PE: d = −1.06; SI: d = −0.94) fell approximately 1.4 to 1.8 times as far as the operational constructs, and this ratio was reproduced independently at each of the four schools (1.46, 1.37, 1.83 and 1.67). Four separate sites, differing in sector, socioeconomic composition and device policy, each show similar internal shapes to the decline. Whatever changed for teachers in the final two waves bore more heavily on their assessment of the technology’s educational value than on their sense of being able to operate it. Among the teacher-specific rivals, general deterioration in morale is the most serious because it is the most diffuse. The final two waves coincided with well-documented strain on the Australian teaching workforce (AITSL, 2023), which could depress teacher responses while leaving students untouched. Two features of the data weigh against it without excluding it. Generalised disaffection has no evident reason to reproduce a particular internal structure, yet these teachers discriminated between constructs in the same way at all four schools. And the decline was abrupt where workforce strain built gradually across the period. Neither observation rules out a morale explanation, and the other teacher-specific rivals listed above cannot be tested with the present data. The contextual record in Section 3.1 is limited to named elements (Section 5.7).
The timing of the divergence is also significant. Restricting the mixed-effects models to the first three waves returns no significant wave–group interaction on any construct (PE χ2(2) = 0.85, EE χ2(2) = 3.25, SI χ2(2) = 0.47, FC χ2(2) = 3.41, all p > 0.18). Across two successive technological transitions, teachers and students moved together. Restricting the same models to Y3 through Y5 returns a significant interaction on every construct (χ2(2) = 142.2, 59.3, 106.8 and 52.1 respectively, all p < 0.001). The divergence is not a gradual drift that happened to become detectable by Y5; it appears abruptly between Y3 and Y4 and continues in the same direction at Y5.
The evaluative constructs (PE and SI) may simply be more responsive to any negative shift in mood, in which case the observed differential is a property of the instrument rather than of what teachers experienced. Furthermore, technology-related institutional changes, such as the introduction of new devices, new policies, changes in school leadership, or IT infrastructural changes, may have occurred. Some of these changes bear more heavily on teachers than on students and could conceivably produce a decline confined to one population. What survives these considerations is a reversal specific to occupying the teaching role in these schools, concentrated in evaluative rather than operational perceptions, and beginning abruptly after three years of convergent improvement.

5.3. Augmentation, Substitution, and the Question of Discontinuity

Section 1 posed the question of whether Gen-AI represents a genuine discontinuity in classroom technology or will be assimilated as its predecessors were. The pattern described above offers a way into that question, though not a resolution, and its limits are stated first. The survey items refer to classroom technology in general and never ask about AI specifically; Gen-AI enters the study only through the Section B nominations reported in Section 4.1. Any connection between that shift and the reversal in teacher perceptions is, therefore, a connection between two independently measured series, not a measurement of how teachers perceive AI.
That said, two measures of different kinds (Likert trajectories and unprompted free-text nominations) inflect at the same point in the same schools, and the inflection in the Likert series was abrupt rather than gradual. The two earlier transitions produced no reversal and no divergence. If the mechanism were the arrival of unfamiliar technology as such, the earlier transitions offer two opportunities for it to have shown itself, and it did not.
A structural difference between Gen-AI and its predecessors in this study offers one account of why the third transition behaved unlike the first two. Video conferencing relocated where teaching happened. LMSs organised its logistics. Tablets and content-creation applications helped both groups produce work. Each assisted a task whose ownership was unambiguous. The teacher still authored the lesson, and the student the assignment. Gen-AI can instead produce the artefact itself. For students, this extends a long lineage of academic support tools. For teachers, the same capability lands twice over, generating lesson materials difficult to distinguish from a teacher’s own and student work difficult to distinguish from a student’s own, undermining submitted work as evidence of learning. Where earlier technologies augmented tasks teachers owned, Gen-AI is the first in this five-year window that could, in principle, substitute for them, a capability described in the literature (Kasneci et al., 2023; Selwyn, 2024; Swiecki et al., 2022), with the assessment-integrity dimension widely noted (Cotton et al., 2024).
This suggests a reframing of the discontinuity question itself, which is offered as the study’s principal interpretive proposal rather than as a tested finding. The literature reviewed in Section 1 divides between accounts treating Gen-AI as different in kind from earlier educational technologies and accounts counselling scepticism about rupture claims on historical grounds. The present findings suggest that the disagreement may be badly posed, because discontinuity is a property of the relation between what a technology can do and what a given role is professionally responsible for doing. The same tools, in the same four schools, across the same two years, were associated with continued improvement in one population’s perceptions and a sharp reversal in the other’s. If the substitution account is correct, both camps describe the same phenomenon from different positions: assimilation for those whose accountable tasks the technology assists, discontinuity for those whose accountable tasks it can perform. Whether a technology constitutes a rupture would then be a question to be asked separately of each population within an institution. Questions of the form “do schools accept AI?” are accordingly underspecified; an institution is not a unit of acceptance. Research designs, adoption surveys and policy instruments that treat the school as the adopting unit would systematically miss the population for whom the technology is most consequential. This also suggests an explanation for the polarised character of the current Gen-AI literature: accounts of transformative promise and accounts of professional threat may both be accurate descriptions, offered from different positions within the same institutions. For educational technology generally, the account would recast the assimilation thesis that runs from Cuban (2001) through Selwyn et al. (2017) and Barbieri and Palmer (2025). The historical record of absorption has been read as evidence about schools; it may instead be evidence about the technologies, each of which assisted tasks whose ownership it left intact. This suggests a candidate criterion, stated here as a hypothesis for prospective testing rather than a conclusion of the present data: a technology should be expected to be absorbed by those whose work it assists and resisted by those whose work it can perform.

5.4. Implications for the UTAUT Framework

In their original formulation, the four constructs operate as coordinate, conceptually parallel determinants of behavioural intention (Venkatesh et al., 2003). The trajectories reported here are not parallel. Evaluative perceptions moved substantially further than operational ones, suggesting the constructs are better treated as separable dimensions of a respondent’s relationship with a technology than as parallel predictors of a single outcome. Furthermore, UTAUT treats accumulating experience as attenuating the weight of effort-based perceptions, and the present data are consistent with that. What the framework does not anticipate is that overall acceptance might reverse while experience continues to accumulate. Experience in UTAUT is a proxy for familiarity, and familiarity is assumed to be monotonically increasing and helpful. In a setting where the referent of “the technology” is itself changing, accumulated experience with last year’s tools may confer little advantage with this year’s and may even sharpen the perception that the ground has moved. The moderator may hence require reconceptualisation for domains in which the object of acceptance is unstable, as is often the case in the domain of educational technologies.
A parallel reconsideration applies to the voluntariness moderator, which motivated RQ4. Although the BYOD/mandated split produced the expected gulf in perceived voluntariness, its association with the four constructs was modest, evenly spread rather than concentrated on SI as Venkatesh et al.’s (2003) account predicts, and moved in opposite temporal directions for the two groups. In school settings, where a single policy regime governs many technologies simultaneously and is entangled with socioeconomic details, voluntariness may function less as an individual-level moderator of acceptance than as a stable feature of institutional context.
Finally, a growing literature extends UTAUT and UTAUT2 to Gen-AI by adding constructs (trust, privacy risk, hedonic motivation) and testing the extended model on respondents surveyed after Gen-AI’s arrival (Cabero-Almenara et al., 2024). Such work cannot observe what the present design observes: how perceptions were moving before the technology existed, and what happened to each construct as it arrived. Neither the decoupling of evaluative from operational constructs nor the reversal of an apparently settled upward trajectory is visible to a design that begins measuring after the event. The implication is less that UTAUT requires new constructs for AI than that questions about AI’s distinctiveness require prospective, repeated-measures designs—and that the value of such designs rises with the pace at which the object of study changes.

5.5. The Socioeconomic Gradient and the Uneven Distribution of the Reversal

Across all four constructs, in both populations and at every wave, school means were ordered consistently with ICSEA, with School-D-versus-School-A effect sizes ranging from d = 0.85 on SI to d = 1.23 on FC. Schools differ most in what they materially provide, and less in what their members believe about the technology. That reading is inferential, as the four-school design cannot attribute the gradient to socioeconomic composition alone. Ostensibly, this is the second digital divide, as the OECD (2015) described it, observed a decade later in a setting where first-order access has been equalised. All four schools had achieved working device access and a functioning LMS by 2021, and the free-text technology landscape was broadly common across sites. What differed was the depth and reliability of the infrastructure and support surrounding that access, which is precisely the dimension that access-focused policy framings do not reach.
The equity implications are sharpened by the arrival of Gen-AI. If the analysis in Section 5.3 is correct, the transition now underway is the most demanding of the three observed in this study, and the ordering of FC suggests it is being navigated with the thinnest perceived institutional support at the schools serving the least advantaged students.
The divide may, therefore, be positioned to compound. Beyond second-order gaps in quality of use, a possible third-order gap (proposed here as a hypothesis for future research) concerns the quality of institutional mediation of AI: whether a school can develop a considered position on its use, redesign assessment around it, and induct students into productive use. What productive use involves is beginning to be specified. Rehman et al. (2026) find that the learning benefits of Gen-AI operate through reduced cognitive load and personalised support, and these benefits depend on how learners are taught to engage with the tool rather than on access alone. The gap proposed here is, therefore, not cosmetic; it concerns whether students receive the instructional mediation on which those benefits are conditional. One explanatory hypothesis is that students at high-ICSEA schools are more likely to encounter AI through a scaffolded institutional stance; students at low-ICSEA schools are more likely to encounter it unmediated. For policy, the implication is that funding frameworks organised around device access do not reach the dimension on which schools now differ most.

5.6. Implications for Practice

The construct profile of the teacher decline suggests that the difficulty in the final two waves was not principally one of capability or provision. Rather, what fell furthest was their assessment of whether the technology served their teaching and whether their schools held a coherent position on it. Gen-AI poses questions that are constitutive rather than operational: what submitted work is evidence of, or where the boundary between assistance and substitution lies. These are questions no amount of tool-training answers, and the steepness of the PE and SI declines is consistent with teachers having registered that, although the instrument did not ask about Gen-AI directly. A school without an articulated position on these questions leaves each teacher to hold them individually, which is one plausible mechanism for the fall in SI observed here. If this account is correct, it implies a testable proposition: that developing an explicit, whole-school position on Gen-AI would do more to restore teachers’ evaluative perceptions than tool-focused professional development. The present study evaluated neither intervention, and the proposition inverts the current practice in which training is typically the first institutional response. It is, therefore, offered as a hypothesis for evaluation rather than as a recommendation the data establish.

5.7. Limitations

The sample comprises four purposively selected schools. They span sector, ICSEA and device policy, but they were not randomly drawn, and each combination of characteristics is represented by a single site. School identity is, therefore, confounded with ICSEA, sector, device policy and any unmeasured institutional characteristic, so the between-school patterns reported in Section 4.7 and Section 5.5 are associations that this design cannot attribute to any one of them.
The design is repeated cross-sectional at the respondent level. Responses were anonymous and unlinked across waves, so the teacher series consists of repeated samples from a largely stable staff population and the student series of distinct annual Year 9 cohorts. All longitudinal claims concern change in group means. Within-teacher change cannot be estimated, and continuing and newly appointed staff cannot be distinguished. The rise in the student series may reflect cohort replacement (successive cohorts differing in prior schooling, digital experience and exposure to Gen-AI), as well as attitude change. The student series constrains only those explanations that would be expected to register in both populations.
The instrument measured perceptions of classroom technology in general and contained no direct measure of attitudes towards, or use of, Gen-AI. The coincidence between the teacher reversal and the rise of Gen-AI in the free-text nominations is an association between two independently measured series, supported by temporal correspondence. The substitution account developed in Section 5.3 is an interpretation consistent with that pattern, not a mechanism the design can test.
Beyond the national framework and the stability of device provision (Section 3.1), school-level events that could bear on the teacher-specific decline (local AI policies, assessment-rule changes, AI-related professional development, and changes of leadership) were not systematically documented, and their timing relative to the Y3–Y4 boundary cannot be established.
Formal measurement invariance across groups and waves was not tested. Comparisons of construct level between teachers and students should, therefore, be read as descriptive, particularly for PE, whose items differ in wording between the student and teacher versions. The within-group change on which the central finding rests is robust to stable group differences in item interpretation, but that stability was not demonstrated.
All measures are self-reported perceptions and carry the response biases attached to them; they describe how respondents evaluated classroom technology, not how they used it. The free-text coding that underpins the periodisation in Section 4.1 was performed by a single coder, and item-level missingness, though low, was handled by available-case scoring rather than a formal imputation procedure.
With four clusters, the school random intercept is imprecisely estimated (McNeish & Stapleton, 2016). Conclusions were unchanged under a school-fixed-effects specification, but the intraclass correlations in Table 5 should be read as indicative rather than precise.

6. Conclusions

This study followed teachers’ and Year 9 students’ perceptions of classroom technology across five annual waves in four Australian secondary schools spanning a 209-point ICSEA range, through a period in which the dominant classroom technologies shifted from video conferencing, through tablet-based content creation, to Gen-AI (RQ1). Teacher and student perceptions rose together for three years and then diverged sharply: students continued upward on all UTAUT constructs while teachers reversed, ending below their 2021 baseline on PE and SI (RQ2). School means were ordered consistently with ICSEA at every wave, most strongly on FC (RQ3). Device policy was associated with smaller differences (RQ4).
The study demonstrates that teacher and student perceptions of classroom technology, measured with an unchanged instrument in the same four schools, diverged sharply after three years of parallel improvement, with the wave–group interaction significant on every UTAUT construct and the teacher decline concentrated in PE and SI. It documents an association: this divergence coincided with the emergence of Gen-AI as the dominant nominated classroom technology in Y4–Y5, where two earlier technological transitions produced no such divergence. And it proposes, as an explanatory framework for prospective testing, that Gen-AI’s capacity to perform tasks for which teachers are professionally accountable, but which it merely assists for students, is proposed as a possible explanation for the role-specific character of the reversal.
Methodologically, the demonstrated divergence stands regardless of the proposed explanation. Technology acceptance in these schools was neither monotonic nor uniform across populations. A cross-sectional study conducted in 2023 and the same study conducted in 2025 would have supported opposite conclusions about which group viewed classroom technology more favourably. Section 5.7 marks the boundaries of what the design can support. What follows from it is an agenda: linked panel designs that can separate within-person change from cohort replacement, instruments that ask about specific technologies rather than technology in general, and continued waves through further transitions.

Supplementary Materials

The following supporting information can be downloaded at https://www.mdpi.com/article/10.3390/educsci16091542/s1.

Funding

This research received no external funding.

Institutional Review Board Statement

The study was conducted in accordance with the Declaration of Helsinki and approved by the Human Research Ethics Committee of the University of Adelaide (H-2021-159). Approval to conduct research in the participating schools was also obtained from relevant sector authorities and from relevant school staff.

Informed Consent Statement

Teacher participants gave informed consent at the point of survey completion, having been provided with a participant information sheet describing the study’s purpose, the voluntary and anonymous nature of participation, and their right to withdraw. For Year 9 students, opt-in written consent was obtained from a parent or guardian prior to each wave, and students additionally provided their own assent immediately before completing the survey. Students could decline to participate or stop at any point without consequence. No identifying information was collected at any wave.

Data Availability Statement

The datasets generated and analysed during the current study are not publicly available because the ethics approval and participant consent under which the data were collected do not permit public release. Respondents include minors, surveys were completed on the understanding of anonymity, and the small number of participating schools creates a risk of school and individual re-identification even in de-identified form. De-identified aggregate data (subscale means, standard deviations and sample sizes by school, wave and group) are available from the corresponding author on reasonable request, subject to the conditions of the institutional ethics approval.

Conflicts of Interest

The author declares no conflict of interest.

References

  1. Attewell, P. (2001). Comment: The first and second digital divides. Sociology of Education, 74(3), 252–259. [Google Scholar] [CrossRef] [Scilit]
  2. Australian Curriculum, Assessment and Reporting Authority. (2015). Guide to understanding ICSEA (Index of community socio-educational advantage) values. Available online: https://www.acara.edu.au/ (accessed on 15 March 2026).
  3. Australian Government Department of Education. (2023). Australian framework for generative artificial intelligence in schools. Available online: https://www.education.gov.au/schooling/resources/australian-framework-generative-artificial-intelligence-ai-schools (accessed on 15 March 2026).
  4. Australian Institute for Teaching and School Leadership. (2023). Australian teacher workforce data: National trends—Teacher workforce (June 2023 edition). AITSL. Available online: https://www.aitsl.edu.au/research/australian-teacher-workforce-data/atwd-reports (accessed on 15 March 2026).
  5. Banoğlu, K., Vanderlinde, R., Çetin, M., & Aesaert, K. (2023). Role of school principals’ technology leadership practices in building a learning organization culture in public K–12 schools. Journal of School Leadership, 33(1), 66–91. [Google Scholar] [CrossRef] [Scilit]
  6. Barbieri, W. (2020). The impact of introducing iPads in teacher education: A case study. In M. A. White, & F. McCallum (Eds.), Critical perspectives on teaching, learning and leadership. Springer. [Google Scholar] [CrossRef] [Scilit]
  7. Barbieri, W., & Palmer, E. (2025). Learning theories and learning technologies: A history of application. In Risks and opportunities in using educational technologies. SpringerBriefs in Education. Springer. [Google Scholar] [CrossRef] [Scilit]
  8. Bates, D., Mächler, M., Bolker, B., & Walker, S. (2015). Fitting linear mixed-effects models using lme4. Journal of Statistical Software, 67(1), 1–48. [Google Scholar] [CrossRef] [Scilit]
  9. Beauchamp, G., Joyce-Gibbons, A., Clarke, L., Hulme, M., Hamilton, T., & Harvey, J. (2023). Conceptualising headteachers’ leadership of technology in schools across the United Kingdom during COVID-19. Management in Education. Advance online publication. [Google Scholar] [CrossRef] [Scilit]
  10. Bower, M., Torrington, J., Lai, J. W. M., Petocz, P., & Alfano, M. (2024). How should we change teaching and assessment in response to increasingly powerful generative artificial intelligence? Outcomes of the ChatGPT teacher survey. Education and Information Technologies, 29(12), 15403–15439. [Google Scholar] [CrossRef] [Scilit]
  11. Cabero-Almenara, J., Palacios-Rodríguez, A., Loaiza-Aguirre, M. I., & Andrade-Abarca, P. S. (2024). The impact of pedagogical beliefs on the adoption of generative AI in higher education: Predictive model from UTAUT2. Frontiers in Artificial Intelligence, 7, 1497705. [Google Scholar] [CrossRef] [Scilit]
  12. Celik, I., Dindar, M., Muukkonen, H., & Järvelä, S. (2022). The promises and challenges of artificial intelligence for teachers: A systematic review of research. TechTrends, 66(4), 616–630. [Google Scholar] [CrossRef] [Scilit]
  13. Chan, C. K. Y. (2023). A comprehensive AI policy education framework for university teaching and learning. International Journal of Educational Technology in Higher Education, 20, 38. [Google Scholar] [CrossRef] [Scilit]
  14. Chan, C. K. Y., & Tsi, L. H. Y. (2024). Will generative AI replace teachers in higher education? A study of teacher and student perceptions. Studies in Educational Evaluation, 83, 101395. [Google Scholar] [CrossRef] [Scilit]
  15. Chomunorwa, S., Mashonganyika, E., & Marevesa, A. (2022). Educator perspectives on the use of technology in schools in previously disadvantaged communities. South African Computer Journal, 34(2), 35–49. [Google Scholar] [CrossRef] [Scilit]
  16. Cohen, J. (1988). Statistical power analysis for the behavioural sciences. Routledge. [Google Scholar]
  17. Cotton, D. R. E., Cotton, P. A., & Shipway, J. R. (2024). Chatting and cheating: Ensuring academic integrity in the era of ChatGPT. Innovations in Education and Teaching International, 61(2), 228–239. [Google Scholar] [CrossRef] [Scilit]
  18. Cuban, L. (2001). Oversold and underused: Computers in the classroom. Harvard University Press. [Google Scholar]
  19. Demetriadis, S., Barbas, A., Molohides, A., Palaigeorgiou, G., Psillos, D., Vlahavas, I., Tsoukalas, I., & Pombortsis, A. (2003). “Cultures in negotiation”: Teachers’ acceptance/resistance attitudes considering the infusion of technology into schools. Computers & Education, 41(1), 19–37. [Google Scholar] [CrossRef] [Scilit]
  20. DiMaggio, P., Hargittai, E., Celeste, C., & Shafer, S. (2004). Digital inequality: From unequal access to differentiated use. In K. M. Neckerman (Ed.), Social inequality (pp. 355–400). Russell Sage Foundation. [Google Scholar]
  21. Dwivedi, Y. K., Rana, N. P., Jeyaraj, A., Clement, M., & Williams, M. D. (2019). Re-examining the Unified Theory of Acceptance and Use of Technology (UTAUT): Towards a revised theoretical model. Information Systems Frontiers, 21(3), 719–734. [Google Scholar] [CrossRef] [Scilit]
  22. Ertmer, P. A., Ottenbreit-Leftwich, A. T., Sadik, O., Sendurur, E., & Sendurur, P. (2012). Teacher beliefs and technology integration practices: A critical relationship. Computers & Education, 59(2), 423–435. [Google Scholar] [CrossRef] [Scilit]
  23. Goriss-Hunter, A., Sellings, P., & Echter, A. (2022). Information communication technology in schools: Students exercise ‘digital agency’ to engage with learning. Technology, Knowledge and Learning, 27(3), 785–800. [Google Scholar] [CrossRef] [Scilit]
  24. Håkansson Lindqvist, M. (2019). School leaders’ practices for innovative use of digital technologies in schools. British Journal of Educational Technology, 50(3), 1226–1240. [Google Scholar] [CrossRef] [Scilit]
  25. Hu, S., Laxman, K., & Lee, K. (2020). Exploring factors affecting academics’ adoption of emerging mobile technologies: An extended UTAUT perspective. Education and Information Technologies, 25, 4615–4635. [Google Scholar] [CrossRef] [Scilit]
  26. Johnson, D. B. (2009). The digital disconnect: Uncovering barriers that sustain the phenomena of unplugged teachers in a technological era [Doctoral dissertation, Louisiana State University]. LSU Scholarly Repository. [Google Scholar]
  27. Kaplan-Rakowski, R., Grotewold, K., Hartwick, P., & Papin, K. (2023). Generative AI and teachers’ perspectives on its implementation in education. Journal of Interactive Learning Research, 34(2), 313–338. [Google Scholar] [CrossRef] [Scilit]
  28. Kasneci, E., Sessler, K., Küchemann, S., Bannert, M., Dementieva, D., Fischer, F., Gasser, U., Groh, G., Günnemann, S., Hüllermeier, E., Krusche, S., Kutyniok, G., Michaeli, T., Nerdel, C., Pfeffer, J., Poquet, O., Sailer, M., Schmidt, A., Seidel, T., … Kasneci, G. (2023). ChatGPT for good? On opportunities and challenges of large language models for education. Learning and Individual Differences, 103, 102274. [Google Scholar] [CrossRef] [Scilit]
  29. Kuznetsova, A., Brockhoff, P. B., & Christensen, R. H. B. (2017). lmerTest package: Tests in linear mixed effects models. Journal of Statistical Software, 82(13), 1–26. [Google Scholar] [CrossRef] [Scilit]
  30. Ley, T., Tammets, K., Sarmiento-Márquez, E. M., Leoste, J., Hallik, M., & Poom-Valickis, K. (2022). Adopting technology in schools: Modelling, measuring and supporting knowledge appropriation. European Journal of Teacher Education, 45(4), 548–571. [Google Scholar] [CrossRef] [Scilit]
  31. Lo, C. K. (2023). What is the impact of ChatGPT on education? A rapid review of the literature. Education Sciences, 13(4), 410. [Google Scholar] [CrossRef] [Scilit]
  32. McNeish, D. M., & Stapleton, L. M. (2016). The effect of small sample size on two-level model estimates: A review and illustration. Educational Psychology Review, 28(2), 295–314. [Google Scholar] [CrossRef] [Scilit]
  33. Mourlam, D. J., DeCino, D. A., Newland, L. A., & Strouse, G. A. (2020). “It’s fun!” Using students’ voices to understand the impact of school digital technology integration on their well-being. Computers & Education, 159, 104003. [Google Scholar] [CrossRef] [Scilit]
  34. OECD. (2015). Students, computers and learning: Making the connection. OECD Publishing. [Google Scholar] [CrossRef] [Scilit]
  35. Paiva, J., Morais, C., Costa, L., & Pinheiro, A. (2016). The shift from “e-learning” to “learning”: Invisible technology and the dropping of the “e”. British Journal of Educational Technology, 47(2), 226–238. [Google Scholar] [CrossRef] [Scilit]
  36. Putnick, D. L., & Bornstein, M. H. (2016). Measurement invariance conventions and reporting: The state of the art and future directions for psychological research. Developmental Review, 41, 71–90. [Google Scholar] [CrossRef] [Scilit]
  37. Raudenbush, S. W., & Bryk, A. S. (2002). Hierarchical linear models: Applications and data analysis methods (2nd ed.). SAGE. [Google Scholar]
  38. Rehman, N., Huang, X., Zhang, Y., & Mahmood, A. (2026). The nexus of Gen-AI features in higher education: Reducing cognitive load, building resilience, and personalizing learning. Journal of Computer Assisted Learning, 42(5), e70312. [Google Scholar] [CrossRef] [Scilit]
  39. Sauers, N. J., & McLeod, S. (2018). Teachers’ technology competency and technology integration in 1:1 schools. Journal of Educational Computing Research, 56(6), 892–910. [Google Scholar] [CrossRef] [Scilit]
  40. Selwyn, N. (2019). Should robots replace teachers? AI and the future of education. Polity. [Google Scholar]
  41. Selwyn, N. (2024). On the limits of artificial intelligence (AI) in education. Australian Educational Researcher, 51(1), 3–19. [Google Scholar] [CrossRef] [Scilit]
  42. Selwyn, N., Hillman, T., Eynon, R., Ferreira, G., Knox, J., Macgilchrist, F., & Sancho-Gil, J. M. (2020). What’s next for Ed-Tech? Critical hopes and concerns for the 2020s. Learning, Media and Technology, 45(1), 1–6. [Google Scholar] [CrossRef] [Scilit]
  43. Selwyn, N., Nemorin, S., Bulfin, S., & Johnson, N. F. (2017). Left to their own devices: The everyday realities of ‘one-to-one’ classrooms. Oxford Review of Education, 43(3), 289–310. [Google Scholar] [CrossRef] [Scilit]
  44. Stone, J. A. (2017). The impact of technology exposure on student perceptions of a 1:1 program. Education and Information Technologies, 22(5), 2281–2309. [Google Scholar] [CrossRef] [Scilit]
  45. Swiecki, Z., Khosravi, H., Chen, G., Martinez-Maldonado, R., Lodge, J. M., Milligan, S., Selwyn, N., & Gašević, D. (2022). Assessment in the age of artificial intelligence. Computers and Education: Artificial Intelligence, 3, 100075. [Google Scholar] [CrossRef] [Scilit]
  46. Šumak, B., & Šorgo, A. (2016). The acceptance and use of interactive whiteboards among teachers: Differences in UTAUT determinants between pre- and post-adopters. Computers in Human Behavior, 64, 602–620. [Google Scholar] [CrossRef] [Scilit]
  47. UNESCO. (2023). Guidance for generative AI in education and research (F. Miao, & W. Holmes, Eds.). UNESCO. [Google Scholar] [CrossRef] [Scilit]
  48. Venkatesh, V., Morris, M. G., Davis, G. B., & Davis, F. D. (2003). User acceptance of information technology: Toward a unified view. MIS Quarterly, 27(3), 425–478. [Google Scholar] [CrossRef] [Scilit]
  49. Venkatesh, V., Thong, J. Y. L., & Xu, X. (2012). Consumer acceptance and use of information technology: Extending the unified theory of acceptance and use of technology. MIS Quarterly, 36(1), 157–178. [Google Scholar] [CrossRef] [Scilit]
Figure 1. UTAUT subscale means by school-wave—Year 9 students. Note. Error bars are 95% confidence intervals computed from respondent-level variation within each school–wave cell and do not adjust for clustering within schools. The mixed-effect models in Section 4.6 account for clustering.
Education 16 01542 g001
Figure 2. UTAUT subscale means by school–wave—Teachers. Note. Error bars are 95% confidence intervals computed from respondent-level variation within each school–wave cell and do not adjust for clustering within schools. The mixed-effect models in Section 4.6 account for clustering.
Education 16 01542 g002
Figure 3. Overall UTAUT mean by group–wave (95% CI). Note. Points are the mean of the four UTAUT subscale scores, shown as a descriptive summary of the crossover rather than as a composite scale. The four constructs are analysed separately throughout (Section 4.2, Section 4.3, Section 4.4, Section 4.5 and Section 4.6). Group means are the unweighted average of the four school means (Table 3). Error bars are 95% confidence intervals computed from respondent-level variation and do not adjust for clustering within schools.
Education 16 01542 g003
Table 1. Annual survey data-collection cycle and sample summary.
WaveGroupSchool A (n)School B (n)School C (n)School D (n)
Y1 (2021)Students89789184
Y1 (2021)Teachers73527768
Y2 (2022)Students776310887
Y2 (2022)Teachers70537866
Y3 (2023)Students827910186
Y3 (2023)Teachers71557569
Y4 (2024)Students838711380
Y4 (2024)Teachers72547665
Y5 (2025)Students818512082
Y5 (2025)Teachers76568069
TotalStudents/Teachers412/362392/270533/386419/337
Note. Cell values are completed surveys (n). Totals across the five waves: 1756 student responses and 1355 teacher responses (3111 in total).
Table 2. School profiles.
SchoolSectorICSEADevice Policy
AGovernment913Mandated
BCatholic975BYOD
CGovernment1017BYOD
DIndependent1122Mandated
Note. ICSEA is the Index of Community Socio-Educational Advantage, a school-level measure of socio-educational background published by ACARA (2015); the national mean is 1000 and the standard deviation 100. Values are as reported for the year of first data collection. “Mandated” indicates a school-specified device required of all students; “BYOD” indicates a bring-your-own-device program. Schools are anonymised and ordered by ICSEA.
Table 3. UTAUT subscale means by group–wave, averaged across the four schools.
ConstructGroupY1 (2021)Y2 (2022)Y3 (2023)Y4 (2024)Y5 (2025)
PEStudent4.06 [3.80–4.55]4.68 [4.41–5.13]4.90 [4.50–5.70]4.99 [4.78–5.43]5.14 [4.88–5.73]
PETeacher4.46 [4.09–5.27]4.96 [4.66–5.46]5.26 [4.83–5.80]4.60 [4.21–5.13]4.23 [3.83–4.86]
EEStudent3.99 [3.72–4.49]4.58 [4.32–5.07]4.84 [4.45–5.58]4.93 [4.66–5.41]5.02 [4.78–5.54]
EETeacher4.29 [3.92–5.05]4.77 [4.41–5.27]4.98 [4.64–5.47]4.56 [4.13–5.17]4.32 [3.90–4.94]
SIStudent4.04 [3.78–4.53]4.63 [4.34–5.18]4.85 [4.46–5.60]5.01 [4.78–5.50]5.06 [4.81–5.58]
SITeacher4.34 [4.05–5.01]4.87 [4.55–5.20]5.16 [4.91–5.59]4.62 [4.30–5.16]4.25 [3.88–4.81]
FCStudent4.09 [3.78–4.67]4.69 [4.40–5.18]4.93 [4.51–5.74]5.04 [4.66–5.61]5.11 [4.76–5.85]
FCTeacher4.41 [3.89–5.30] 4.85 [4.43–5.59]5.05 [4.65–5.71]4.75 [4.18–5.42]4.46 [3.99–5.21]
nStudent342335348363368
nTeacher270267270267281
Note. Cell entries are the unweighted mean of the four school means, with the range across schools (lowest–highest school mean) in brackets, on the original 7-point Likert metric (1 = strongly disagree, 7 = strongly agree). Schools are weighted equally, rather than respondents, so that the aggregate reflects the four school contexts equally regardless of cohort size; the respondent-level analyses in Section 4.6 weight all respondents equally. School-level means, standard deviations, cell sizes and 95% confidence intervals are reported in Supplementary Table S1. The n rows give the number of respondents contributing to each group–wave cell, summed across the four schools (Table 1).
Table 4. Cohen’s d for headline comparisons across the four UTAUT constructs.
ComparisonPEEESIFC
Teachers Y3 → Y5−1.06−0.66−0.94−0.59
Students Y3 → Y5+0.22+0.17+0.19+0.15
School D vs. School A (mean across waves)+0.89+0.90+0.78+1.05
Mandated vs. BYOD, teachers (mean across waves)+0.22+0.23+0.24+0.24
Mandated vs. BYOD, teachers (Y1)+0.43+0.36+0.41+0.34
Mandated vs. BYOD, teachers (Y5)+0.19+0.17+0.15+0.24
Mandated vs. BYOD, students (mean across waves)+0.35+0.34+0.36+0.33
Mandated vs. BYOD, students (Y1)+0.23+0.23+0.21+0.24
Mandated vs. BYOD, students (Y5)+0.37+0.30+0.27+0.37
Note. Cohen’s d magnitudes: |d| < 0.20 negligible, 0.20–0.50 small, 0.50–0.80 medium, ≥ 0.80 large (Cohen, 1988). Sign convention: positive d means group 1 > group 2. Mandated-device schools are A and D. BYOD schools are B and C. Device-policy comparisons are reported separately for teachers and students because the two groups showed opposing wave-on-wave trends. Y3–Y5 comparisons are between independent wave samples and describe change in group means. Effect sizes for the school comparison are computed from the cell means and standard deviations reported in Table S1; those for group-level and device-policy comparisons are computed from respondent-level data.
Table 5. Linear mixed-effects models: variance partition and wave–group interaction, by construct.
ConstructNICC (School)Interaction LRT χ2(4)pY4 × Teacher b (SE) [95% CI]Y5 × Teacher b (SE) [95% CI]
PE31080.15242.6<0.001−0.81 [−1.03, −0.59]−1.29 [−1.49, −1.09]
EE30220.14131.5<0.001−0.67 [−0.89, −0.45]−1.00 [−1.22, −0.78]
SI30950.12180.2<0.001−0.69 [−0.91, −0.47]−1.11 [−1.33, −0.89]
FC30880.20110.8<0.001−0.59 [−0.81, −0.37]−0.94 [−1.14, −0.74]
Note. Each model regresses the respondent-level subscale mean on wave (four dummies, reference Y1), group (reference Student) and their interaction, with a random intercept for school (maximum-likelihood estimation). ICC is from the unconditional model. The likelihood-ratio test compares the full model with the same model omitting the four interaction terms. Coefficients are unstandardised, with 95% confidence intervals in brackets, and represent the change in the teacher–student gap relative to Y1; residual SDs were close to 1.0 in all models, so coefficients can be read approximately in within-cell standard-deviation units.
Table 6. Cohen’s d for the mandated-vs-BYOD comparison by wave, group and construct.
GroupConstructY1Y2Y3Y4Y5
TeacherPE+0.43+0.33+0.09+0.08+0.19
TeacherEE+0.36+0.38+0.17+0.08+0.17
TeacherSI+0.41+0.43+0.19+0.00+0.15
TeacherFC+0.34+0.39+0.24+0.00+0.24
StudentPE+0.23+0.45+0.41+0.29+0.37
StudentEE+0.23+0.43+0.45+0.32+0.30
StudentSI+0.21+0.45+0.50+0.35+0.27
StudentFC+0.24+0.41+0.37+0.25+0.37
Note. Values are Cohen’s d for the comparison between mandated-device schools (A and D) and BYOD schools (B and C) at each wave, computed separately for teachers and students. Positive values indicate higher means at the mandated-device schools. Because the two policy groupings are not balanced on school socioeconomic composition—the mandated grouping contains the lowest- and highest-ICSEA sites, the BYOD grouping the two intermediate sites—these comparisons are descriptive and may partly reflect ICSEA rather than device policy.
Table 7. Prevalence of technology-category nominations in free-text responses by group–wave (% of respondents).
CategoryGroupY1Y2Y3Y4Y5
Video conferencingTeacher64311164
Video conferencingStudent5624953
LMSsTeacher7269666865
LMSsStudent6562606158
Tablet Teacher2246513827
Tablet Student2653584230
Content creation softwareTeacher1839473526
Content creation softwareStudent2145523929
Gen-AITeacher0174471
Gen-AIStudent0053966
Note. Cell values are the percentage of respondents in each group–wave cell nominating at least one technology in the category, following the coding procedure described in Section 3.4. Respondents could nominate multiple technologies, so column percentages do not sum to 100. Categories shown are the five most prevalent across the study period; nominations were assigned to categories after normalisation of spelling variants, abbreviations and brand-name synonyms (e.g., “Teams” and “Microsoft Teams”). Group ns per wave range from 267 to 281 (teachers) and 335 to 368 (students); per-wave sample sizes are reported in Table 1. Video-conferencing platforms include Zoom and Microsoft Teams; learning management systems include SEQTA, Daymap, Google Classroom and SchoolBox; content-creation software includes Canva, iMovie, Adobe Express, Notability, Word, PowerPoint and Keynote; generative-AI tools include ChatGPT, Copilot and Gemini.
Disclaimer/Publisher’s Note: The statements, opinions and data contained in all publications are solely those of the individual author(s) and contributor(s) and not of MDPI and/or the editor(s). MDPI and/or the editor(s) disclaim responsibility for any injury to people or property resulting from any ideas, methods, instructions or products referred to in the content.