1. Introduction
Artificial intelligence has moved, in the space of a few years, from a specialist topic to a pervasive feature of everyday academic life. The release of ChatGPT in November 2022 made generative AI directly usable by hundreds of millions of people, and the growing literature documents substantial changes in how students write, study, and search for information in the period that followed (
Chatterji et al., 2025;
Krause et al., 2025;
X. Zhao et al., 2024;
Y. Zhao et al., 2024). Universities responded with a wave of policies, guidelines, and curricular reforms aimed at both harnessing and containing the technology (
Krause et al., 2025;
Lee et al., 2024;
Wang et al., 2024). Underneath these institutional responses lies a more basic question: how ready are students themselves for the AI age, and do the 2022 and 2024 student cohorts, surveyed as generative AI became a mass phenomenon, differ in that readiness?
Two overlapping research programmes inform this question. The first concerns AI literacy—the competencies that allow a person to critically evaluate, communicate with, and use AI.
Long and Magerko (
2020) offered a seminal conceptualisation, identifying competencies spanning recognising AI, understanding its strengths and limits, and reasoning about AI ethics. Subsequent review work by
Ng et al. (
2021) consolidated the broader AI literacy literature into four dimensions: knowing and understanding AI, using and applying AI, evaluating and creating with AI, and AI ethics. The second programme concerns psychological readiness and acceptance, drawing on technology-acceptance theory (
Bamasoud et al., 2025;
Davis, 1989;
Ngo et al., 2025;
Venkatesh et al., 2003), where behavioural intention to use a technology is shaped by perceived usefulness, affective response, and social and contextual factors. Recent work locates generative-AI adoption squarely within this tradition, showing that perceived usefulness, performance expectancy, social influence, trust, and readiness-related factors shape students’ intention to use tools such as ChatGPT (
Ngo et al., 2025;
Strzelecki, 2024;
Y. Zhao et al., 2024;
Zogheib & Zogheib, 2024).
For clarity, we use these terms as follows throughout. AI literacy denotes a person’s (here, self-rated) knowledge of what AI can do; AI readiness denotes confidence in using AI tools and perceptions of their everyday benefit; technology acceptance denotes the broader theoretical tradition linking beliefs and affect to use; and behavioural intention denotes a person’s stated intention to continue learning about and using AI. The first two are constructs in our measurement model; the latter two situate the outcome variable theoretically.
Bringing these strands together,
Dai et al. (
2020) conceptualised students’ readiness for the AI age as a multidimensional construct involving AI literacy, perceived relevance, confidence, AI anxiety, and AI readiness. Building on this readiness perspective, subsequent AI-education research has incorporated behavioural intention, social good, intrinsic motivation, self-efficacy, and ethical learning as related constructs shaping students’ AI learning, literacy development, and readiness (
Chai et al., 2020,
2024;
Ng et al., 2024). This model is attractive because it treats readiness not as knowledge alone but as a constellation of competence, motivation, and affect. However, most applications of such instruments have been cross-sectional and single-country, and very few span the 2022 generative-AI inflection. As a result, the field has rich descriptions of where students stand but limited evidence on how successive student cohorts have differed as AI became ubiquitous, or on whether the constructs behave equivalently across cohorts and national contexts—a precondition for any valid comparison (
Medina-Gual et al., 2025;
Ng et al., 2024;
Oksanen et al., 2026;
Putnick & Bornstein, 2016).
We address these gaps through a secondary analysis of an openly available multi-national dataset collected in 2022, 2023, and 2024 with
Dai et al.’s (
2020) instrument, originally gathered and documented by
Skalka et al. (
2025a,
2025b; see
Section 2.1). The temporal structure offers a rare cohort contrast: the original data collector confirmed that every response in the 2022 wave was completed before ChatGPT’s public release on 30 November 2022, whereas the 2024 wave followed its rapid diffusion. This ordering does not make the design causal. The waves are repeated cross-sections in which most students appear once, but 59 students participated in both the 2022 and 2024 waves and are linkable through anonymised identifiers (
Skalka et al., 2025b). The design is therefore best described as repeated cross-sectional with a small embedded panel. All primary analyses account for repeated participants through cluster-robust inference; individual use of or exposure to ChatGPT was not measured; and the analyses identify differences between cohorts, not causal effects of any specific tool. Because the waves differ in national composition, we anchor the temporal comparison in a subsample of information-technology (IT) undergraduates from a single country and corroborate it with covariate-adjusted models across overlapping national samples. We pursue three questions:
RQ1. Did students’ AI-readiness constructs—in particular self-rated AI literacy, AI anxiety, and behavioural intention—differ between the 2022 and 2024 survey cohorts?
RQ2. Are the readiness constructs measured equivalently across cohorts, supporting a valid comparison?
RQ3. Which readiness constructs are independently associated with students’ behavioural intention to adopt AI?
We propose three hypotheses. Because generative AI dramatically lowered the cost of using AI and made its benefits salient, we expected behavioural intention to be higher in the 2024 cohort (H1). Because the same period made risks around accuracy, academic integrity, and labour-market disruption highly salient in public and campus discourse—and because prior work links greater awareness of a technology’s capabilities to heightened threat appraisal and computer- or AI-related anxiety—we expected AI anxiety to be higher in the 2024 cohort (H2). Finally, drawing on technology-acceptance theory, we expected behavioural intention to be associated primarily with affective and instrumental appraisals—satisfaction, relevance, and readiness—rather than with self-rated literacy (H3).
2. Materials and Methods
2.1. Design, Data Source, and Participants
We analysed the openly available dataset “AI Literacy Questionnaire data” (
Skalka et al., 2025b), published on Figshare under a CC BY 4.0 licence and documented in an accompanying data article. The dataset contains 1205 valid survey records from 1146 unique university students collected across three annual waves: 2022 (535 records), 2023 (112), and 2024 (558). Fifty-nine students participated in both the 2022 and 2024 waves and are linkable across waves through an anonymised identifier assigned by the data collectors for this purpose (
Skalka et al., 2025b). The design is therefore repeated cross-sectional with a small embedded panel; we report record counts and unique-student counts separately throughout, use cluster-robust inference (clustering on student) for all primary analyses, and use fully deduplicated and within-person (panel) analyses as sensitivity checks (
Section 2.4).
Respondents came from eight countries, predominantly in Central and Eastern Europe—Slovakia (686 records), Poland (299), and Czechia (106)—with an additional Southeast Asian sample from Indonesia (65) and smaller groups from Lithuania, Türkiye, France, and Ukraine. Most respondents were enrolled in information-technology programmes (832 records), with smaller numbers in education (188) and other fields. The sample was 65.8% male (793 records) and 33.4% female (402); 10 respondents (0.8%) selected a category other than male or female and were retained in all pooled analyses, with gender-adjusted models using a female-versus-other-categories indicator (results were unchanged when these 10 respondents were excluded;
Section 3.5). The mean age was 22.8 years (SD = 5.4, range 17–56). Because the 2023 wave comprised an entirely distinct set of countries, it was excluded from temporal comparisons; it was retained in the pooled measurement analyses (reliability and the confirmatory factor analysis) and in the behavioural intention regression, where national composition is controlled or not at issue (
Section 2.4).
The original data collector confirmed that recruitment used non-probability institutional convenience sampling. Invitations were distributed through verbal announcements, university websites, and institutional email communications; questionnaires were completed anonymously or anonymised through online forms, including Moodle and Google Forms. Participating institutions were not systematically retained as a dataset variable by wave, and the number of students who received or saw an invitation was not recorded; reliable wave-specific response rates therefore cannot be calculated. The original collector also confirmed that every response assigned to the 2022 wave was collected before the public release of ChatGPT on 30 November 2022. The contrast consequently has clear temporal ordering, while remaining a non-causal cohort comparison.
The dataset was first analysed by
Skalka et al. (
2025a), whose published study examined satisfaction, readiness, and relevance across gender, discipline, and year of study using non-parametric group comparisons. The present study is a secondary analysis with distinct research questions and methods: it analyses the 2022-versus-2024 cohort comparison, tests measurement invariance, models the documented not-applicable response structure, and estimates multivariate associations with behavioural intention, using seven constructs (AI literacy, anxiety, behavioural intention, career motivation, confidence, intrinsic motivation, social good) not analysed in the original report.
Table A1 (
Appendix A) summarises the relationship between the two studies.
2.2. Instrument
Readiness was measured with the previously published and psychometrically evaluated instrument of
Dai et al. (
2020), comprising 50 items across ten constructs rated on a five-point Likert scale: AI literacy (5 items), relevance of AI (6), career motivation (4), confidence (5), social good (5), intrinsic motivation (4), AI anxiety (5), AI readiness (6), satisfaction (5), and behavioural intention (5). Six demographic items captured year of study, age, gender, country, study programme, and cumulative hours of AI-related coursework. Using a previously published instrument supports comparability with prior work, although we treat its validity in the present multilingual, multi-cohort context as an empirical question examined in
Section 3.1 and
Section 3.2 rather than as being established. For the Slovak, Czech, and Polish samples, the questionnaire was administered in translated national-language versions prepared by the original data collectors to permit participation outside English-taught programmes; other samples completed the English version (
Skalka et al., 2025a). Formal back-translation procedures and quantitative evidence of cross-linguistic equivalence were not documented for the source collection; we therefore treat linguistic equivalence as an assumption, mitigate it by anchoring the primary cohort contrast within a single country and language, and flag it as a limitation (
Section 4.4).
2.3. Not-Applicable Responses and Data Preparation
For four constructs that presuppose direct experience of AI coursework—intrinsic motivation, confidence, satisfaction, and behavioural intention—the questionnaire offered an explicit “Not applicable” response, coded 0, for respondents who had no experience with AI courses or had not formed an opinion; these values were retained in the dataset by design (
Skalka et al., 2025b). Consistent with this documentation, zeros occur exclusively in these four constructs (affecting 47.4%, 41.3%, 48.1%, and 30.8% of records, respectively) and never in the six universally applicable constructs. Selecting “Not applicable” was strongly associated with lacking AI-course experience (odds ratio = 0.23 for students with any AI coursework,
p < 0.001); item completion among students with AI coursework was 85–93%, versus 57–72% among students without it.
Because these zeros are structurally inapplicable responses rather than stochastically missing data, we did not impute them: imputing an answer to a question a respondent was not in a position to answer would manufacture data for an undefined quantity. Instead, the four experience-contingent constructs were analysed among respondents who provided substantive answers (available-case analysis), complemented by a stricter analysis restricted to students reporting any AI coursework, for whom the items were unambiguously applicable (
Section 3.4). The six universally applicable constructs have complete data. Construct scores were computed as the mean of substantive item responses where at least half of a construct’s items were answered; a stricter all-items rule left the primary contrasts unchanged (
Section 3.5). Cumulative AI-course hours contained implausible outliers (maximum 1000; 32 records > 100) and were winsorised at the 99th percentile for descriptive and covariate use.
2.4. Analytic Strategy
All primary inferential analyses respect the data structure described in
Section 2.1: group contrasts and regressions were estimated on records with cluster-robust standard errors clustering on the student identifier, so the 59 twice-observed students do not spuriously inflate precision. Two sensitivity strategies complement this: (a) fully deduplicated analyses retaining each student’s first record (strictly independent observations), and (b) within-person analyses of the panel students present in the primary subsample (paired
t-tests). Measurement models (reliability, CFA, invariance) were estimated on the deduplicated dataset (
n = 1146; one record per student) to satisfy the independence assumptions of these models.
We first evaluated the measurement model through internal consistency (Cronbach’s α), composite reliability (CR), average variance extracted (AVE), and a confirmatory factor analysis (CFA) of the ten-factor structure. CFA and invariance models were estimated in R with lavaan 0.6-17 using maximum likelihood with robust (Huber–White) standard errors and a scaled test statistic (MLR); the five-point items were treated as continuous approximations. We report robust CFI and TLI, robust RMSEA with 90% confidence intervals, and SRMR. Discriminant validity was evaluated formally with the heterotrait–monotrait ratio (HTMT) for every pair of constructs on the deduplicated sample, after recoding structural 0 values as missing. We report the full matrix, flag values above 0.85 and 0.90, and use a 2000-resample case bootstrap for percentile 95% confidence intervals. For the three pairs showing the largest factor correlations or HTMT values, we prespecified one-factor-collapse sensitivities—relevance with career motivation, satisfaction with behavioural intention, and intrinsic motivation with satisfaction—and compared each with the hypothesised ten-factor model on the same 451 complete cases. These structural comparisons used covariance-structure ML with conventional CFI, TLI, RMSEA, SRMR, AIC, and BIC; the robust MLR ten-factor model remained the primary measurement model.
To assess whether comparisons across cohorts are tenable (RQ2), we tested measurement invariance between the 2022 and 2024 cohorts in the sequence configural → metric (equal loadings) → scalar (equal loadings and intercepts) → partial scalar where required, both for each construct separately and for the full ten-factor model.
Section 3.2 reports CFI, TLI, RMSEA, and SRMR for every model and changes between successive steps. Following
Cheung and Rensvold (
2002) and
Chen (
2007), equality constraints were judged to add limited deterioration when ΔCFI was no smaller than −0.010, supplemented by ΔRMSEA ≤ 0.015 and ΔSRMR ≤ 0.030 for metric or ≤0.010 for scalar constraints. These change criteria were interpreted conditionally on configural and absolute fit: a small ΔCFI indicates that equality constraints do not materially worsen a model, but does not by itself establish that the underlying model fits well. Where scalar constraints failed, the score-test-identified intercept was freed and the cohort contrast was estimated under a partial scalar model.
For RQ1 we contrasted the 2022 and 2024 cohorts of Slovak IT undergraduates (186 vs. 180 records; 311 unique students, 55 in both waves) by cluster-robust regression of each construct score on a cohort indicator, with Holm correction across ten constructs. For the four experience-contingent eligible-subgroup comparisons, we additionally applied Holm correction across that family of four tests. Cohort comparability was profiled and focal contrasts were re-estimated with compositional covariates. Supporting models used the overlapping Slovakia, Poland, and Czechia samples. For RQ3 we first reproduced the principal standardised multiple regression of behavioural intention on the nine remaining constructs. We then estimated a sensitivity model adding country, survey wave, programme, gender, year of study, age, any AI-course experience, and winsorised AI-course hours while retaining student-clustered inference. Because RESET indicated functional-form misspecification, a prespecified parsimonious sensitivity added quadratic terms for the five constructs significant in the principal model (satisfaction, career motivation, relevance, AI readiness, intrinsic motivation), jointly and without stepwise selection; an adjusted-plus-quadratic model and grouped ten-fold cross-validation provided further checks. Descriptive and regression analyses were conducted in Python (version 3.11); measurement invariance was estimated in R (Lavaan). Full reproducible outputs are provided in the public analysis repository (see the Data Availability Statement).
3. Results
3.1. Measurement Properties
Table 1 reports the reliability and convergent validity on the deduplicated sample. The internal consistency was good to excellent for eight constructs (α = 0.83–0.89) and lower for social good (0.74) and AI literacy (0.69). Eight constructs met AVE ≥ 0.50; social good (0.42) and AI literacy (0.48) did not. The ten-factor CFA (MLR,
n = 451 complete cases) yielded scaled χ
2(1130) = 2753.9, robust CFI = 0.867, robust TLI = 0.856, robust RMSEA = 0.061 (90% CI [0.058, 0.064]), and SRMR = 0.073: acceptable approximate fit on RMSEA and SRMR, but incremental indices below 0.90. Standardised loadings were ≥0.67 for most items; the weakest occurred in AI literacy (0.31–0.92), AI readiness (0.52–0.81), and social good (0.49–0.75). The largest factor correlations were relevance–career motivation (r = 0.90), satisfaction–behavioural intention (r = 0.88), and intrinsic motivation–satisfaction (r = 0.87). No residual correlations or other post hoc modifications were added.
The formal discriminant-validity results were mixed (
Appendix B,
Table A2 and
Table A3). HTMT exceeded 0.85 for relevance–career motivation (0.872, 95% bootstrap CI [0.836, 0.906]) and intrinsic motivation–satisfaction (0.856 [0.799, 0.906]); satisfaction–behavioural intention was 0.834 [0.790, 0.875]. No pair exceeded 0.90. In prespecified alternative CFAs, collapsing relevance with career motivation, satisfaction with behavioural intention, or intrinsic motivation with satisfaction worsened fit relative to the ten-factor model (ΔAIC = +68.6, +153.2, and +87.1; ΔBIC = +31.6, +116.2, and +50.1, respectively; all nested comparisons
p < 0.001). Retaining theoretically distinct factors is therefore defensible, but discriminant validity is not uniformly satisfactory: results involving relevance–career motivation and intrinsic motivation–satisfaction should be interpreted as partly shared variance. VIF values in the behavioural intention regression address coefficient instability, not measurement discriminant validity.
3.2. Measurement Invariance Across Cohorts
Table 2 reports the complete invariance sequence comparing the 2022 and 2024 cohorts (deduplicated; 535 vs. 499 students). Equality constraints produced limited additional deterioration: metric constraints changed the CFI by no more than 0.010 for any construct, and scalar constraints met the stated change criteria for seven constructs. AI literacy (ΔCFI = −0.022), social good (−0.021), and career motivation (−0.031) required freeing L5, SG2, and CM2, respectively; the partial models met the criterion for AI literacy (ΔCFI = −0.006) and social good (−0.008), but career motivation remained outside it (−0.012). These incremental results are consistent with some stability of item–construct relations, but they do not establish strong equivalence because the absolute fit was imperfect. The full ten-factor configural model had robust CFI = 0.812 and TLI = 0.796 (RMSEA = 0.072; SRMR = 0.085), and behavioural intention had a particularly weak single-factor configural fit (CFI = 0.844, TLI = 0.688, RMSEA = 0.271). Accordingly, metric stability is described as conditional; full-scalar latent-mean interpretation is most reasonable for the seven constructs meeting scalar criteria, partial scalar results for AI literacy and social good are exploratory, and career motivation remains descriptive.
Under these qualifications, latent AI anxiety (Δ = +0.26 SD, 95% CI [0.13, 0.40], p < 0.001) and behavioural intention (Δ = +0.29 SD [0.16, 0.43], p < 0.001) were higher in 2024 under full scalar models. Latent AI literacy was lower (Δ = −0.23 SD [−0.38, −0.07], p = 0.004) under the partial scalar model; because α = 0.69, AVE = 0.48, L5 was freed, and absolute measurement fit was imperfect, this result is retained but treated as exploratory rather than as firm evidence of a change in competence. Social good showed no significant partial scalar difference. Career motivation and other contrasts without adequate scalar support are not given inferential latent-mean weight. Within the deduplicated Slovak IT subsample, directions were similar (AI literacy Δ = −0.24, p = 0.083; anxiety Δ = +0.26, p = 0.033; behavioural intention Δ = +0.44, p = 0.002), and again subject to the absolute-fit limitations.
3.3. Primary Cohort Contrast Across All Ten Constructs
Before comparing outcomes, we profiled the two Slovak IT cohorts (
Table 3). The cohorts did not differ significantly in age or winsorised AI-course hours, but the 2024 cohort was earlier in its studies (M = 1.8 vs. 2.5 years,
p < 0.001), more likely to report no AI coursework at all (63.9% vs. 46.8%,
p = 0.001), and included more women (14.4% vs. 7.0%,
p = 0.032). All primary contrasts were therefore re-estimated with these compositional variables as covariates.
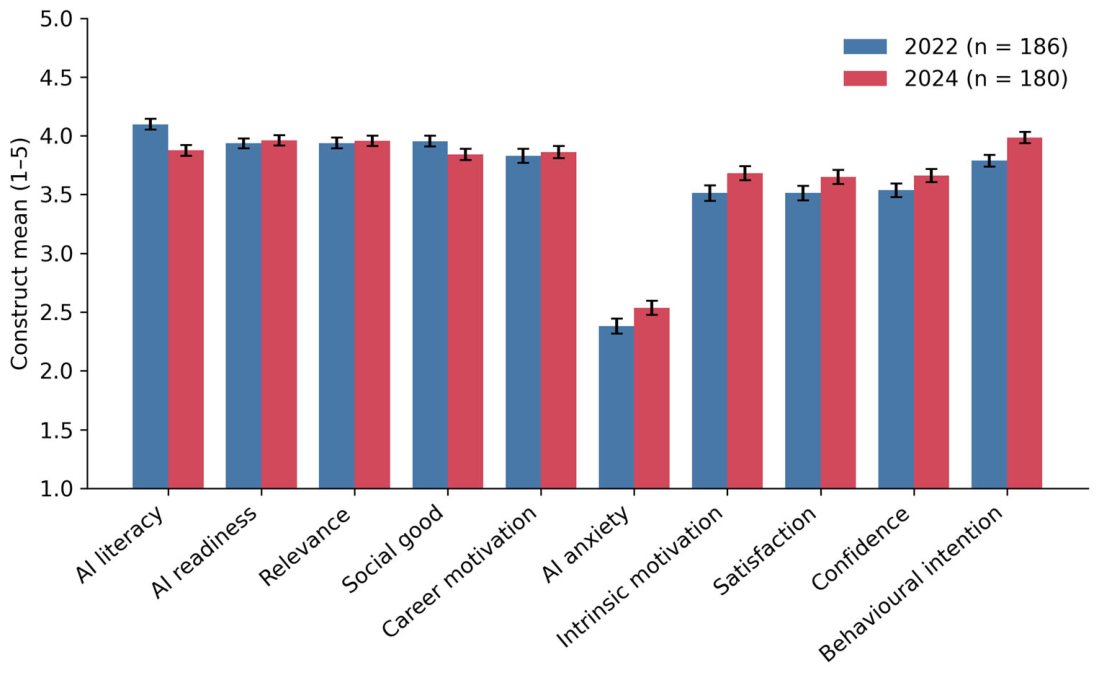
Table 4 reports the contrast for all ten constructs, with cluster-robust inference as primary;
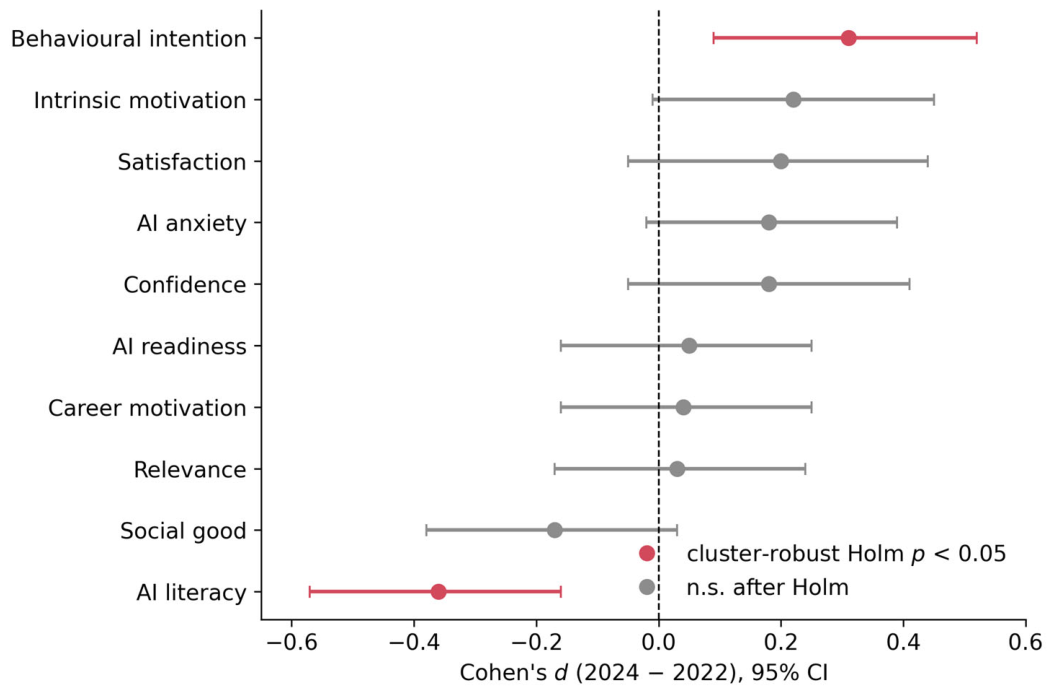
Figure 1 shows the construct means by cohort and
Figure 2 the standardised differences. After Holm correction, two constructs differed reliably: self-rated AI literacy was lower in the 2024 cohort (M = 4.10 vs. 3.88; difference = −0.22, 95% CI [−0.34, −0.10]; d = −0.36, 95% CI [−0.57, −0.16]; Holm
p = 0.004) and behavioural intention was higher (M = 3.79 vs. 3.98; difference = +0.20 [0.07, 0.32]; d = +0.31 [0.09, 0.52]; Holm
p = 0.024). The distribution-free checks agreed (AI literacy: U = 13,260.5, rank-biserial = −0.21,
p < 0.001; behavioural intention: U = 16,811.5, rank-biserial = +0.20,
p = 0.002). AI anxiety and the experience-contingent constructs were nominally higher in 2024 by roughly a fifth of a standard deviation but did not survive correction. Both corrected differences persisted when adjusting for the compositional differences in
Table 3 (AI literacy: b = −0.19, cluster-robust
p = 0.002; behavioural intention: b = +0.19,
p = 0.005; adjusted for year of study, gender, age, and no-AI-coursework status). All observed effect sizes are small to moderate by conventional standards.
The cluster-robust covariate-adjusted models across Slovakia, Poland, and Czechia (
n = 1091 records; 2022 and 2024 waves) reproduced this pattern: relative to the 2022 cohort, the 2024 cohort scored lower on AI literacy (b = −0.11, SE = 0.04,
p = 0.005) and higher on behavioural intention (b = +0.23, SE = 0.05,
p < 0.001), with AI anxiety also significantly higher (b = +0.16, SE = 0.06,
p = 0.005), adjusting for country, gender, and age. Extended specifications additionally adjusting for year of study and winsorised AI-course hours left all three coefficients essentially unchanged (AI literacy b = −0.11,
p = 0.006; behavioural intention b = +0.23,
p < 0.001; anxiety b = +0.15,
p = 0.007). We designate the Slovak IT contrast as the primary analysis and the three-country models as supporting analyses (public analysis repository; see the Data Availability Statement); on this basis, H1 (higher intention) is supported in both, whereas H2 (higher anxiety) is supported only in the supporting multi-country analysis and at the latent level (
Section 3.2), not in the Holm-corrected primary subsample.
3.4. Cohort Differences: Experience-Contingent Constructs Among Eligible Students
Because intrinsic motivation, satisfaction, confidence, and behavioural intention carried a designed “Not applicable” option (
Section 2.3), we examined students reporting any AI coursework (2022: 99 records; 2024: 65); per-construct analytic samples are slightly smaller (2022: 92–97; 2024: 58–64) because item-level “Not applicable” responses vary by construct. Holm correction was applied across these four eligible-subgroup comparisons. All four remained statistically significant: confidence difference = +0.39, d = +0.54, raw
p = 0.0002, Holm
p = 0.0009; intrinsic motivation +0.33, d = +0.44, raw
p = 0.0050, Holm
p = 0.0150; behavioural intention +0.24, d = +0.36, raw
p = 0.0131, Holm
p = 0.0263; and satisfaction +0.23, d = +0.33, raw
p = 0.0287, Holm
p = 0.0287. These results provide multiplicity-controlled supporting evidence among course-experienced respondents; they do not replace the ten-construct primary comparison in
Table 4, and they generalise only to students for whom the items were applicable.
3.5. Robustness: Data Grain, Scoring, and Sample Definitions
Conclusions were stable across every alternative treatment of the data structure. Deduplicating to strictly independent samples (one record per student; primary contrast 311 students) reproduced the primary results (AI literacy b = −0.24, p < 0.001; behavioural intention b = +0.22, p = 0.003; anxiety b = +0.21, p = 0.034, uncorrected). Within-person changes among the panel students pointed in the same directions (AI literacy: mean change = −0.16, n = 55, p = 0.139; behavioural intention: +0.18, n = 49, p = 0.093; both underpowered but directionally consistent with the cohort contrasts). Under the stricter all-item scoring rule, the results were unchanged (AI literacy b = −0.22, p < 0.001; behavioural intention b = +0.19, p = 0.014). Excluding the 10 respondents reporting a gender other than male or female left the three-country models unchanged (AI literacy b = −0.10, p = 0.008; behavioural intention b = +0.24, p < 0.001; anxiety b = +0.15, p = 0.007).
3.6. Constructs Associated with Behavioural Intention
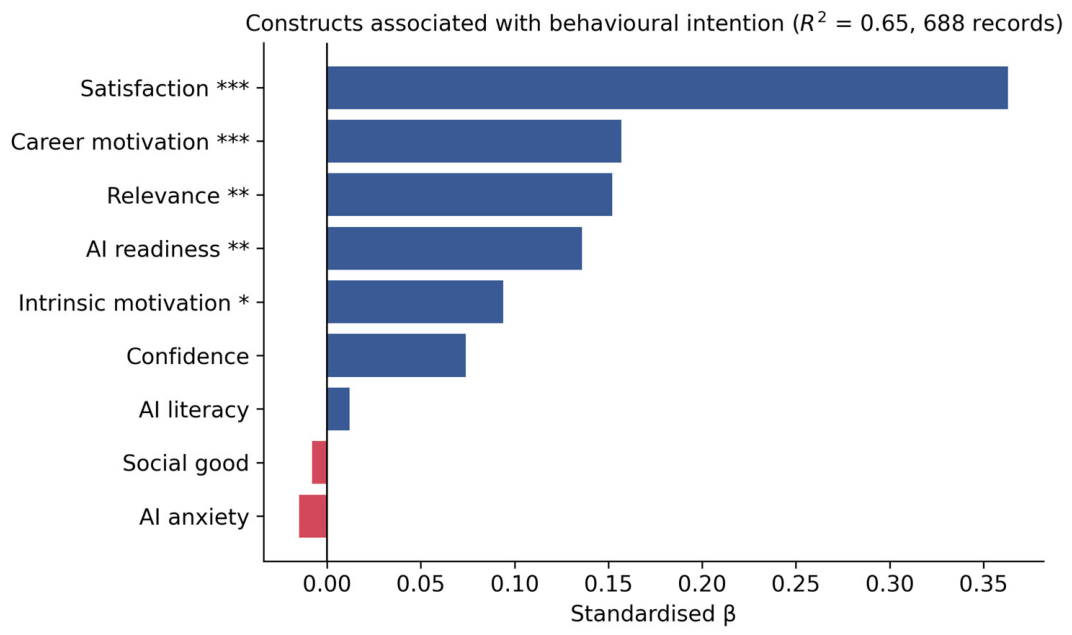
The reproduced principal standardised multiple regression used 688 records from 656 students and explained 65.2% of behavioural intention variance (adjusted R
2 = 0.647). Satisfaction showed the largest unique association (β = 0.363), followed by career motivation (0.157), relevance (0.152), AI readiness (0.136), and intrinsic motivation (0.094); confidence, AI literacy, social good, and AI anxiety were not significant. The fully adjusted sensitivity model added country, survey wave, programme, gender, year of study, age, any AI-course experience, and winsorised AI-course hours and increased R
2 to 0.681. The focal pattern was stable: satisfaction β = 0.361, career motivation 0.162, relevance 0.132, AI readiness 0.116, and intrinsic motivation 0.093 (all
p < 0.05); confidence 0.065, AI literacy 0.045, social good 0.000, and anxiety −0.031 remained non-significant. The largest absolute focal coefficient change was 0.033 (AI literacy).
Table 5 and
Figure 3 report the principal model,
Table 6 compares the focal coefficients across sensitivities, and
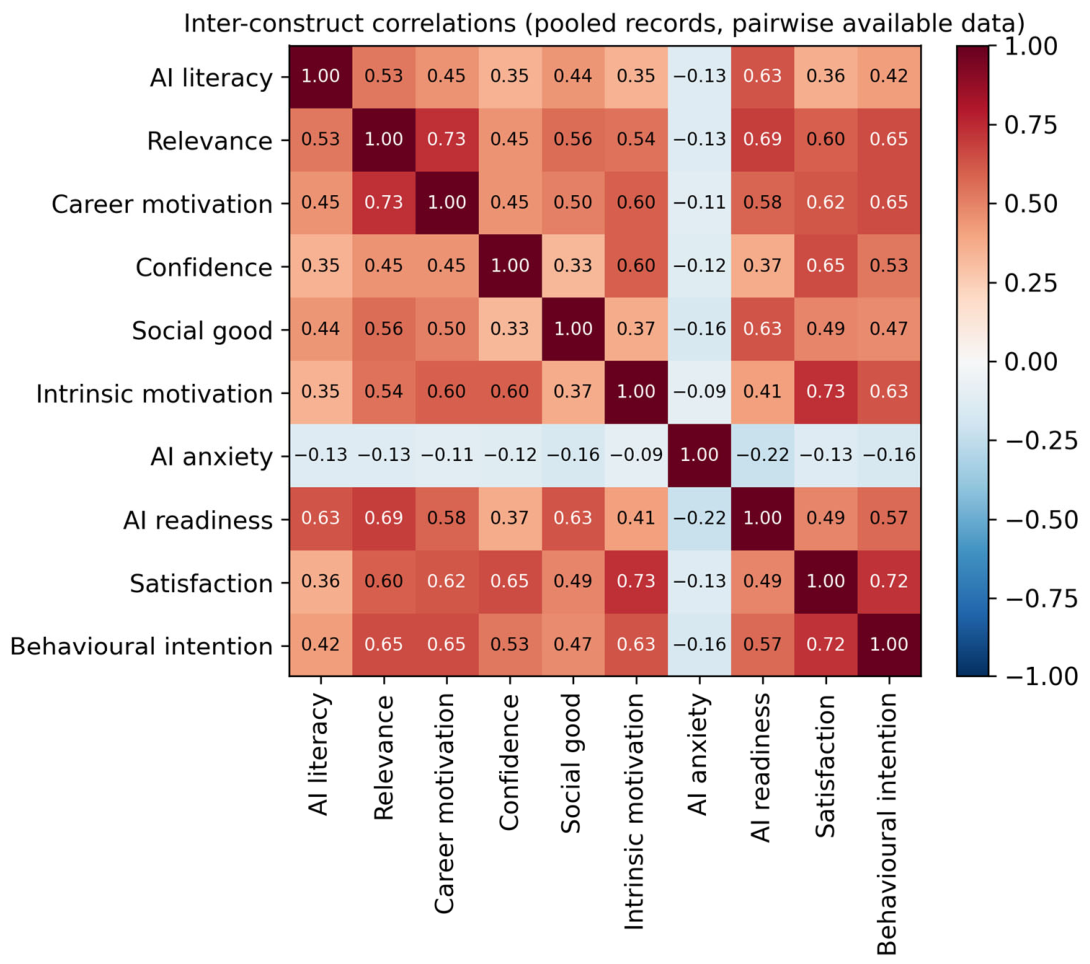
Figure 4 shows the inter-construct correlations across the pooled sample.
The RESET result was reproduced (F = 7.41, p = 0.0066), so robust standard errors alone were not treated as a remedy for functional-form misspecification. Adding the five prespecified quadratic terms increased R2 to 0.667; the terms were jointly significant, Wald χ2(5) = 18.61, p = 0.0023, driven mainly by a negative career-motivation quadratic (β = −0.159, p = 0.0011). The central linear pattern remained: satisfaction β = 0.338, career motivation 0.101, relevance 0.163, AI readiness 0.145, and intrinsic motivation 0.092, all p < 0.05. The adjusted-plus-quadratic model yielded R2 = 0.693 and the same substantive ordering; the grouped ten-fold cross-validated RMSE improved only modestly from 0.600 to 0.594. Alternative predictor subsets and influence deletion likewise left satisfaction dominant. These are cross-sectional associations, not causal effects, and the curvature cautions against treating a one-unit increase as constant across the full career-motivation scale.
4. Discussion
4.1. Principal Findings
All responses from 2022 preceded ChatGPT’s public release, whereas the 2024 cohort was surveyed after its diffusion. The 2024 cohort reported higher behavioural intention and lower self-rated AI literacy in the primary comparison; higher anxiety appeared only in supporting multi-country and latent analyses. These results were stable to clustering, deduplication, compositional adjustment, and multiplicity correction. Their measurement support is qualified: equality constraints caused little additional deterioration, but the configural and several single-factor models had imperfect absolute fit. Thus, the evidence is strongest as a description of cohort differences, not as proof of strong measurement equivalence or a causal effect of ChatGPT. The eligible-subgroup results for intention, satisfaction, confidence, and intrinsic motivation all survived Holm correction across their four-test family.
4.2. Interpretation and Theoretical Implications
Why might a cohort more eager to use AI rate its own AI literacy lower? One interpretation is an awareness or calibration account: greater exposure to capable but imperfect AI systems may make the breadth of the field more visible and self-assessments more conservative. This mechanism was not measured. Composition, shifting response standards, and item drift are equally plausible. The literacy result warrants particular caution because reliability was modest (α = 0.69), AVE was below 0.50 (0.48), L5 required freeing for partial scalar invariance, and absolute model fit was imperfect. The latent difference survived freeing L5, so the result is not discarded, but it is best treated as exploratory evidence about self-perception rather than as a demonstrated decline in objective competence.
The multivariate model relates to technology-acceptance theory (
Davis, 1989;
Venkatesh et al., 2003). Satisfaction, career motivation, relevance, AI readiness, and intrinsic motivation retained unique positive associations with behavioural intention after national, temporal, demographic, educational, and AI-course adjustment and under the nonlinear sensitivities. The HTMT and alternative-CFA results nevertheless show mixed discriminant validity: relevance and career motivation, and intrinsic motivation and satisfaction, share substantial variance even though collapsing each pair worsened model fit. Individual coefficients should therefore be read as conditional associations among overlapping appraisals. The evidence motivates, but cannot establish, the hypothesis that authentic and relevant AI-learning experiences may support adoption readiness.
4.3. Practical and Equity Implications
For universities, the pattern of results suggests two complementary tasks: creating learning opportunities in which students experience authentic and meaningful uses of AI, and teaching students to evaluate the capabilities, limits, and ethics of AI critically. This is consistent with AI literacy research describing the competence as involving not only knowledge and use but also critical evaluation and ethical awareness (
Medina-Gual et al., 2025;
Ng et al., 2024). We note that the equity considerations below are practical implications drawn from this and prior literature, not empirical findings of the present study: we did not test whether the cohort differences varied by gender, country, discipline, or socioeconomic background, and such moderation analyses are an important direction for future work. With that caveat, the concern is real: prior research, including on this dataset (
Skalka et al., 2025a), documents lower readiness and perceived relevance among women and non-IT students, and institutions that do not support less-prepared groups risk widening existing gaps as AI tools become routine in academic and professional settings (
Chai et al., 2024;
Dai et al., 2020).
4.4. Limitations
The findings should be read against eight limitations. First, the design is dominated by repeated cross-sections; the original collector confirmed that all 2022 responses preceded 30 November 2022, but temporal ordering does not isolate ChatGPT from concurrent curricular, recruitment, or social changes. Second, recruitment used non-probability institutional convenience sampling; participating institutions were not retained systematically by wave, invitation denominators were not recorded, and response rates cannot be calculated. Third, invariance constraints added little deterioration, but the full configural model (CFI = 0.812; TLI = 0.796) and several single-factor baselines—especially behavioural intention—had weak absolute fit, limiting the strength of metric and scalar claims. Fourth, AI literacy had α = 0.69, AVE = 0.48, partial scalar invariance with L5 freed, and imperfect fit; its cohort difference is exploratory. Fifth, HTMT indicated overlap for relevance–career motivation and intrinsic motivation–satisfaction, so regression coefficients cannot cleanly apportion all shared variance. Sixth, structural “Not applicable” responses restrict four constructs to respondents with substantive or course-eligible experience. Seventh, RESET and the quadratic sensitivity identified career-motivation curvature; although the central pattern persisted, linear coefficients are approximations. Eighth, all measures are self-reports susceptible to common-method variance, social desirability, and shifting standards; the sample is dominated by male IT undergraduates from Central and Eastern Europe, and documented back-translation evidence is unavailable.
5. Conclusions
Comparing university-student cohorts surveyed before ChatGPT’s public release in 2022 and after its diffusion in 2024, we found higher behavioural intention in the later cohort and higher anxiety only in supporting analyses, alongside lower self-rated AI literacy. The literacy difference is retained as exploratory because its construct had modest reliability, AVE below 0.50, partial scalar invariance, and imperfect absolute fit. Equality constraints produced limited additional deterioration, but this does not overcome weak configural fit. Discriminant validity was mixed for two highly overlapping construct pairs, although collapsed-factor models fitted worse. Behavioural intention remained associated with satisfaction, career motivation, relevance, AI readiness, and intrinsic motivation after broad covariate adjustment and reasonable nonlinear sensitivities. The study therefore supports cautious statements about cohort differences and cross-sectional associations—not causal effects of ChatGPT or any other tool—and motivates testing whether authentic, relevant, and critically framed AI learning experiences can support capable use.





 ,
,