Article

Analysis of Attitudinal Components Towards Statistics: A Comparative Study Between Pre-Service and In-Service Teachers


by
Francisco Rodríguez-Alveal
1,
Angel Peiró-Signes
2 and
Oscar Trull
3,*
1
Department of Educational Sciences, Universidad del Bío-Bío, Chillán 3780000, Chile
2
Department of Business Management, Universitat Politècnica de València, 46022 València, Spain
3
Department of Applied Statistics, Operational Research and Quality, Universitat Politècnica de València, 46022 València, Spain
*
Author to whom correspondence should be addressed.
Educ. Sci. 2026, 16(7), 1033; https://doi.org/10.3390/educsci16071033
Submission received: 4 March 2026 / Revised: 19 June 2026 / Accepted: 23 June 2026 / Published: 29 June 2026

Abstract

Understanding teachers’ attitudes towards statistics is essential, as these attitudes influence both teaching practices and students’ learning outcomes. This study examines attitudes toward statistics among Chilean teachers, comparing pre-service and in-service teachers across emotional, cognitive, and behavioral dimensions. Using quantitative methods, data were collected from 111 teachers through a modified version of the Attitudes Toward Statistics and Its Teaching Scale survey. The results show that in-service teachers display more positive attitudes toward statistics than pre-service teachers, suggesting that professional experience and continuous development contribute to greater confidence and competence in teaching statistics. Positive emotional experiences, such as enjoyment and interest in statistics, are strongly associated with higher engagement in both learning and teaching the subject. Additionally, perceiving statistics as valuable has a positive effect on teachers’ instructional behavior. These findings have important implications for teacher education. They highlight the need for targeted professional development initiatives that strengthen statistical knowledge while addressing emotional and attitudinal barriers. Furthermore, integrating real-world statistical applications into teacher training programs can enhance relevance and engagement. Overall, promoting positive attitudes toward statistics among teachers is key to improving the quality of statistics education and preparing students to function effectively in an increasingly data-driven society.

1. Introduction

Statistics is an integral part of modern education systems worldwide, serving as a crucial tool for understanding and interpreting data in various fields. The inclusion of statistics in university curricula varies across countries and is influenced by educational policies and labor-market demands. In many countries, statistics is a mandatory component of education at the primary and secondary level; integrating statistical concepts into the mathematics curriculum and university curricula is essential for fostering statistical literacy, which is increasingly recognized as a critical skill in the information age (Scheaffer & Jacobbe, 2014). Statistics prepares students for the data-driven world (Estrada et al., 2018; Zieffler et al., 2017). It aims to develop students’ ability to interpret and critically analyze data, which is considered fundamental in society, where citizens encounter vast amounts of information daily (Gal, 2004; Garfield & Ben-Zvi, 2008) and in the professional field, as industries increasingly rely on data-driven decision-making (Batanero et al., 2004; Gal et al., 1997). This reflects a global trend where statistical education is not confined to mathematics but extends to social sciences, health sciences, and other disciplines, ensuring a comprehensive educational experience (Watson & Smith, 2022).
Despite the recognized importance of statistics, educators around the world face numerous challenges in teaching this subject (Batanero & Díaz, 2012). The first significant barrier is the perception of statistics as a complex and abstract subject. Many students and educators view statistics as intimidating, which hinders their engagement and motivation (Steinberger, 2020). Overcoming these perceptions requires innovative teaching approaches that make statistics more accessible and relevant to students’ lives and future careers (Gal, 2004) and address the varying levels of statistical competence among teachers themselves (Gal & Ginsburg, 1994; Hannigan et al., 2013; Makar & Fielding-Wells, 2011). Many teachers, especially those not specializing in mathematics or statistics, may feel unprepared to teach statistical concepts (Schoen et al., 2025). This lack of confidence can translate into less effective teaching, which not only has consequences for students’ learning experiences but also shapes the learning environment (Ertmer & Ottenbreit-Leftwich, 2010; Marzano & Marzano, 2003). An inadequate attitude from a teacher provoked by this lack of preparation can lead to inappropriate responses to students with trauma, increasing traumatization (Carton et al., 2025).
Incorporating statistics into the curriculum poses unique challenges that require targeted teacher training. Effective teaching in this area requires more than familiarity with the subject; it demands an understanding of its multifaceted nature, common misconceptions, and the cognitive biases students often exhibit (Batanero et al., 2016). Many teachers have limited exposure to practical applications and lack of experience in designing classroom activities involving investigations or simulations (Kvatinsky & Even, 2002; Stohl, 2005). Furthermore, prospective teachers frequently share the same misconceptions about probability as their students, which can hinder effective instruction (Batanero et al., 2014; Prodromou, 2014).
Another key element of effective learning is teacher engagement (Ingvarson et al., 2005). The attitudes and actions of teachers shape both students’ perceptions and their engagement with learning (Fairhurst et al., 2023; Leighton et al., 2022), deeply influencing the learning environment. Hollenstein et al. (2024) found that teachers with high expectations are associated with a decrease in anxiety, especially in Statistics, where anxiety is common among both students and teachers (Steinberger, 2020). Teachers’ preferences for constructivist environments shape how students engage with knowledge and build understanding, because these environments prioritize interaction and collaboration, emphasize accessibility and adaptability in their design and shift the role of teachers from information providers to facilitators (Van Petegem et al., 2005). In other words, a teacher’s attitude can create a dynamic and supportive learning environment that not only enhances student achievement but also fosters enthusiasm for learning. However, a teacher’s ability to change the learning environment is often constrained by the educational system. There is often resistance to change within educational systems. Traditional curricula and teaching methods may not prioritize statistical education, and integrating new content and methods requires teachers’ time, resources, and professional development. This can be particularly challenging in under-resourced educational environments where teachers may already be overburdened (Batanero & Díaz, 2012).
As we have seen, attitudes comprise cognitive and affective dimensions. The cognitive dimension includes knowledge and beliefs about statistics, while the affective dimension involves feelings towards the subject. The experiential dimension covers personal experiences with statistics (Unidad de Currículum y Evaluación [UCE], 2016). Thus, teachers’ attitudes towards statistics can either facilitate or hinder their teaching practices. Positive attitudes are associated with diverse instructional strategies and a willingness to engage students in statistical reasoning (Groth & Meletiou-Mavrotheris, 2018), and they are crucial for effective teaching. For example, teachers with positive attitudes toward statistics are more likely to use statistical methods in their teaching, thereby enhancing their students’ learning experiences (Estrada et al., 2018). Conversely, negative attitudes may lead to avoiding statistical content or reliance on rote teaching methods, undermining student learning (Estrada et al., 2004).
Enthusiastic and confident teachers can inspire similar attitudes in their students, fostering a positive learning environment. Conversely, teachers who view statistics as difficult or irrelevant may pass these views on to their students, negatively affecting engagement and performance (Rodriguez-Alveal, 2017). Indeed, teachers using real-world applications and examples can make statistics more relevant and engaging for teachers and students (Gamboa Araya & Moreira-Mora, 2016).
These dynamics are present across both pre-service and in-service teachers: while pre-service teachers’ views on constructivist learning and teaching strategies shape their emerging practice (Avsec & Jagiełło-Kowalczyk, 2018; Cimermanová, 2017; Savolainen et al., 2012), in-service teachers must continually renew their approaches to sustain student motivation (Borges, 2022; Debbag & Fidan, 2022). In both cases, fostering supportive attitudes is essential for creating inclusive and effective learning environments (Monsen et al., 2014).
In this context, understanding teachers’ attitudes toward statistics is vital, as these attitudes significantly influence learning contexts and student achievement and attitudes (Dushimimana et al., 2024). Positive attitudes towards statistics among teachers are associated with greater enthusiasm and effectiveness in teaching the subject, fostering a more engaging and supportive learning environment for students. Assessing these attitudes helps identify areas where teachers may need additional support or professional development, ensuring they are well-equipped to deliver high-quality statistical education (Zieffler et al., 2017). Furthermore, it can help in curriculum design and in developing teaching resources that better address teachers’ needs and concerns (Tishkovskaya & Lancaster, 2012).
Various efforts are being made to assess teachers’ attitudes towards statistics. One common approach is to use standardized assessment tools that measure teachers’ attitudes, beliefs, and self-efficacy in statistics. For example, the Attitudes Toward Statistics and Its Teaching Scale (EAEE) is widely used to evaluate these components and identify specific areas where teachers may require additional support (Estrada et al., 2011). Jong and Hodges (2015) used Mathematics Experiences and Conceptions Surveys (MECS) to analyze the evolution of attitudes among pre-service elementary school teachers enrolled in three universities (in mathematics coursework). They showed that coursework can be an effective tool for developing positive attitudes towards mathematics. Professional development programs are among the most popular ways to enhance teachers’ attitudes toward statistics, providing opportunities to deepen their understanding of statistical concepts, learn new teaching methodologies, and gain confidence in their ability to teach statistics effectively. By participating in these programs, teachers can develop a more positive outlook on statistics and become more effective educators (Gal & Ginsburg, 1994; Hannula, 2002; Ivars et al., 2020; Mendes et al., 2024). In addition to professional development, collaborative learning communities where teachers can share experiences and best practices have proven beneficial. Such communities foster a supportive environment in which teachers can discuss challenges, exchange ideas, and receive feedback from peers, thereby improving attitudes and teaching practices (Schau et al., 1995).
The primary aim of this study is to investigate attitudes towards statistics among teachers in Chile and to compare them between pre-service and in-service teachers, with the objective of informing better practices in Statistics’ teaching. By examining the emotional, cognitive, and behavioral aspects of these attitudes, the study aims to identify the factors that influence how teachers perceive and engage with statistics and its teaching. Understanding these factors is crucial for creating targeted professional development programs that can improve the teaching and learning of statistics in educational settings.

2. Theoretical Framework and Hypothesis

This study is substantiated in the multidimensional model of attitudes, which conceptualizes attitudes as integrated structures comprising affective, cognitive, and behavioral components (Ajzen, 1989; Di Martino & Zan, 2015; McLeod, 2006). This framework has been widely adopted in mathematics and statistics education research as the theoretical lens through which teachers’ orientations toward a subject—and the ways those orientations shape their instructional practice—can be systematically examined (Estrada et al., 2018; Gal & Ginsburg, 1994; Schau et al., 1995). Several theoretical perspectives have been proposed to explain how teachers relate to statistics and its teaching. Early cognitive frameworks focused on knowledge and beliefs as the primary drivers of teaching behavior (Shulman, 1986) but did not account for the role of emotion and motivation. More recent affective models emphasized anxiety, enjoyment, and self-efficacy (Onwuegbuzie & Wilson, 2003), but tend to treat affect in isolation from the cognitive appraisals that give it meaning. The multidimensional attitude framework addresses these limitations by integrating both dimensions into a unified construct that also captures behavioral intentions and has been validated in comparable contexts involving pre-service and in-service teachers (Dushimimana et al., 2024; Estrada et al., 2004; Ruz et al., 2022).
Attitudes are viewed as complex constructs that integrate emotional and cognitive elements, making them central to the educational experience. Ajzen (1989) describes attitudes as an individual’s predisposition to respond positively or negatively to various environmental elements. Thus, they determine personal intentions and influence behavior (Gómez-Chacón, 2000). This broad definition highlights the profound influence of attitudes on behavior and decision-making. McLeod (2006) described attitudes as moderate-intensity feelings that influence one’s affective responses. Several researchers offer definitions that expand on these foundational ideas. Gal et al. (1997) emphasize that attitudes are the cumulative result of emotions and feelings experienced over time in learning environments. Aiken (2002) describes attitudes as organized sets of beliefs that predispose individuals to respond in particular ways, aligning with Philipp’s perspective that attitudes represent habitual ways of acting, feeling, or thinking about specific topics (Philipp, 2007). Elaborating on the complexity of attitudes within the educational context, Estrada Roca (2003) describes attitudes as “the sum of emotions or feelings experienced during the period of learning a subject under study.” These definitions highlight the significance of attitudes in shaping learning experiences and behavioral outcomes. Teachers’ attitudes can facilitate or hinder teaching, influencing classroom actions (Zapata Cardona & Rocha Salamanca, 2011). Indeed, attitudinal elements can affect the results of academic training and potentially be transferred to the school system (Afamasaga-Fuata’i & Sooaemalelagi, 2014; Gamboa Araya & Moreira-Mora, 2016).
Attitudes act as a bridge between beliefs and emotions, encapsulating elements from both domains. Attitudes include beliefs about oneself and the subject matter, emotions related to these beliefs, and the interplay between these components (Di Martino & Zan, 2015). Attitude is a multidimensional construct comprising affective, cognitive, and behavioral components (Gal & Ginsburg, 1994; Gómez-Chacón, 2000; Ramírez Martínez et al., 2012; Schau et al., 1995). The Affective Component towards Statistics (AS) measures feelings such as pleasure, interest, and anxiety (Gal et al., 1997). The Cognitive Competence towards Statistics (CCS) assesses self-perception of competence, knowledge, and intellectual skills in statistics (Schau et al., 1995). The Behavioral Component towards Statistics (BS) captures inclinations to act towards statistics, including decision-making and helping others learn about it (Schau et al., 1995). These aspects collectively shape how students perceive and engage with academic subjects.
Attitudes toward a subject are built on prior experiences in educational settings: positive or negative interactions significantly shape their development (Gal et al., 1997). Veloo and Chairhany (2013) found that attitudes play a crucial role in shaping students’ orientation towards learning, emphasizing the importance of fostering positive attitudes early in educational journeys. Students in STEM fields tend to show more positive attitudes toward statistics than those outside STEM (Gundlach et al., 2015). Moreover, attitudes become relatively stable over time, incorporating more cognitive components and less emotional intensity than initial emotional reactions (Gal et al., 1997). Thus, this stability means that attitudes toward statistics developed over the years may be associated with teachers’ willingness to engage with the subject. Feelings such as pleasure, interest, or anxiety are therefore expected to be associated with inclinations to act on statistics—for example, by incorporating it into decision-making or by helping others learn it:
H1. 
Teachers’ affection towards statistics is positively associated with their behavior towards statistics.
Similarly, a favorable perception of one’s own competence, knowledge, and intellectual skills in statistics is expected to be associated with greater self-confidence and, consequently, with stronger inclinations to act toward statistics:
H2. 
Teachers’ perception of statistical competence is positively associated with their behavior towards statistics.
Following Estrada et al. (2005), a favorable perception of a teacher’s ability to teach statistics and help students (Cognitive Competence towards Teaching Statistics, CTS) may be positively associated with their willingness to teach statistics (Behavior towards Teaching Statistics, BTS). In addition to statistical understanding, positive learning experiences influence teachers’ attitudes (Estrada & Batanero, 2008). Therefore, we can expect that positive feelings towards teaching statistics (ATS) built over past experiences are expected to be positively associated with the willingness to teach statistics (BTS):
H3. 
Teachers’ affection toward teaching statistics is positively associated with their behavior toward teaching statistics.
H4. 
Teachers’ perception of competence in teaching statistics is positively associated with their behavior toward teaching statistics.
Many teachers view statistics positively, recognizing its value in addressing real-world problems and connecting cognitive and social education components (Martins et al., 2011, 2012). The appreciation of statistics’ usefulness, relevance, and importance in personal and professional life is expected to be associated with greater willingness to teach statistics:
H5. 
Teachers’ perceived value of statistics is positively associated with their behavior towards teaching statistics.
Teachers’ personal behavior towards statistics is also expected to play a significant role in how they approach their teaching. The engagement of those teachers who actively engage with statistical content in their own practice is expected to be carried over into the classroom:
H6. 
Behavior toward statistics is positively associated with behavior toward teaching statistics.
Similarly, good behavior towards statistics is expected to be associated with the teacher’s perception of statistics’ value:
H7. 
Behavior towards statistics is positively associated with the perceived value of statistics.
Previous research, however, suggests that other characteristics might moderate these relations. Specialization in STEM fields correlates with more positive attitudes toward statistics than does specialization in non-STEM fields (Gundlach et al., 2015), suggesting that familiarity with quantitative methods may enhance attitudes toward statistics. Other research shows that in-service teachers consistently show more positive attitudes than pre-service teachers (Estrada et al., 2004; Rodriguez-Alveal, 2017; Ruz et al., 2022). No significant gender differences have been reported (Salifu & Dokurugu, 2022).

3. Materials and Methods

3.1. Sample and Data Collection

This study used an adapted version of the Attitudes Toward Statistics and Probability and Its Teaching Scale (EAPE) for teachers, designed by (Estrada et al., 2018). In this adaptation, the word “probability” was replaced with “statistics,” resulting in the Attitudes Toward Statistics and Its Teaching Scale (EAEE). The instrument consists of 28 statements, with 14 written in a positive tone and 14 in a negative tone. Data were collected via a custom-designed questionnaire using a 5-point Likert scale, where 0 indicates total disagreement and 10 indicates total agreement. The questionnaire targeted in-service and pre-service teachers, selected through a non-probabilistic convenience sampling method (McMillan & Schumacher, 2001).
Table 1 presents the sample characteristics of the controlled variables, specifically gender and teaching experience, as indicated by the years a teacher has been involved in teaching statistics.
The sample closely mirrors the broader population of Chilean university-level statistics teachers. It comprises 30.8% men and 24.9% women, 46 pre-service teachers (41.4%), and 65 in-service teachers (58.6%). To evaluate differences by gender and professional experience in the study’s concepts, we calculated a composite variable as the average of the items included in the final model. To select the appropriate method for the comparison, we investigated the normality of the composite variables through Q-Q plots and Shapiro–Wilk tests. Due to failure to pass the normality test, we used the Kruskal–Wallis test on medians for the analysis. Table 1 summarizes the mean, standard deviation, median, Kruskal–Wallis H statistic (Ostertagová et al., 2014), and p-values for the paired comparisons (men vs. women and in-service vs. pre-service). The H statistic indicates that AS, BS, ATS, and VTS are significantly higher (p < 0.05) for in-service teachers than for teachers in their training period. In the comparison between men and women, we found only a significantly higher ATS in women. Then, for example, in-service teachers in the sample show more affection for statistics than those in their training period. Table 1 shows whether there are differences in the level of the concepts evaluated in the study. However, it does not show whether one concept is significantly associated with the other, the magnitude of this relation, or whether, combined, they result in a specific outcome. Thus, we require other methods to evaluate these aspects.

3.2. Measures

The measurement instrument is divided into seven components: (1) Affection towards statistics (AS); (2) Perceived cognitive competence in statistics (CCS); (3) Behavior towards statistics (BS); (4) Affection towards the teaching of statistics (ATS); (5) Perceived didactic competence in teaching statistics (CTS); (6) Behavior towards the teaching of statistics (BTS); (7) Value towards statistics and its teaching (VTS), that are derived from an extensive literature review (see literature review section).
The original measures presented some consistency issues, so we removed some items from the final model.

3.3. Data Analysis

We used PLS-SEM with SmartPLS (Hair et al., 2011; Ringle et al., 2024) and fsQCA (Ragin & Davey, 2022) for data analysis. PLS-SEM efficiently evaluates causal relationships within complex models that involve multiple constructs and dependencies (Hair et al., 2011). This method accommodates non-normal data distributions and simultaneously handles both reflective and formative measures, providing insights into the strength and significance of relationships among constructs. It helps understand direct, indirect, and total effects, making it useful for testing hypotheses about linear relationships and building predictive models.
We employed Fuzzy Set Qualitative Comparative Analysis (fsQCA) to complement our PLS-SEM analysis. While PLS-SEM is grounded in linear regression and assumes that relationships between variables are symmetrical and linear, fsQCA adopts a configurational approach. It examines how different combinations of causal conditions lead to a particular outcome, acknowledging equifinality, meaning that multiple pathways can lead to the same outcome. FsQCA identifies complex interaction effects and variable configurations that might not be detectable with linear methods such as PLS-SEM. This method allows us to identify the conditions or combinations sufficient for a desired outcome, addressing limitations related to linearity, symmetry, and variable interdependencies (Ragin, 2008; Schneider & Wagemann, 2010; Woodside, 2013).
The combined approach of PLS-SEM and fsQCA provides a more detailed and actionable understanding of how different elements interact to influence the outcome, offering a robust framework for analyzing complex data.

4. Results

4.1. Measurement Model

The measurement model analysis comprises several stages: evaluating the individual reliability of indicators, assessing construct reliability, and confirming convergent and discriminant validity. Indicator reliability was assessed using factor loadings, which ranged from 0.4 to 0.7 and exceeded 0.7 for most items, as Hair et al. (2011) recommended. The model retained 19-item scales (see Table 2).
Construct reliability was evaluated using the Composite Reliability (CR) index. Convergent validity was confirmed through the average variance extracted (AVE). Composite reliability values exceeded the critical threshold of 0.7 for all variables (Hair et al., 2009), and AVE values were above 0.5 (Fornell & Larcker, 1981), indicating satisfactory reliability and convergent validity (see Table 2).
Discriminant validity was assessed using the Fornell-Larcker criterion (Fornell & Larcker, 1981), which requires the square root of the AVE to be higher than the correlations between constructs, suggesting that all variables are empirically distinct and, therefore, confirming the discriminant validity of the scales (see Table 3).

4.2. Structural Model

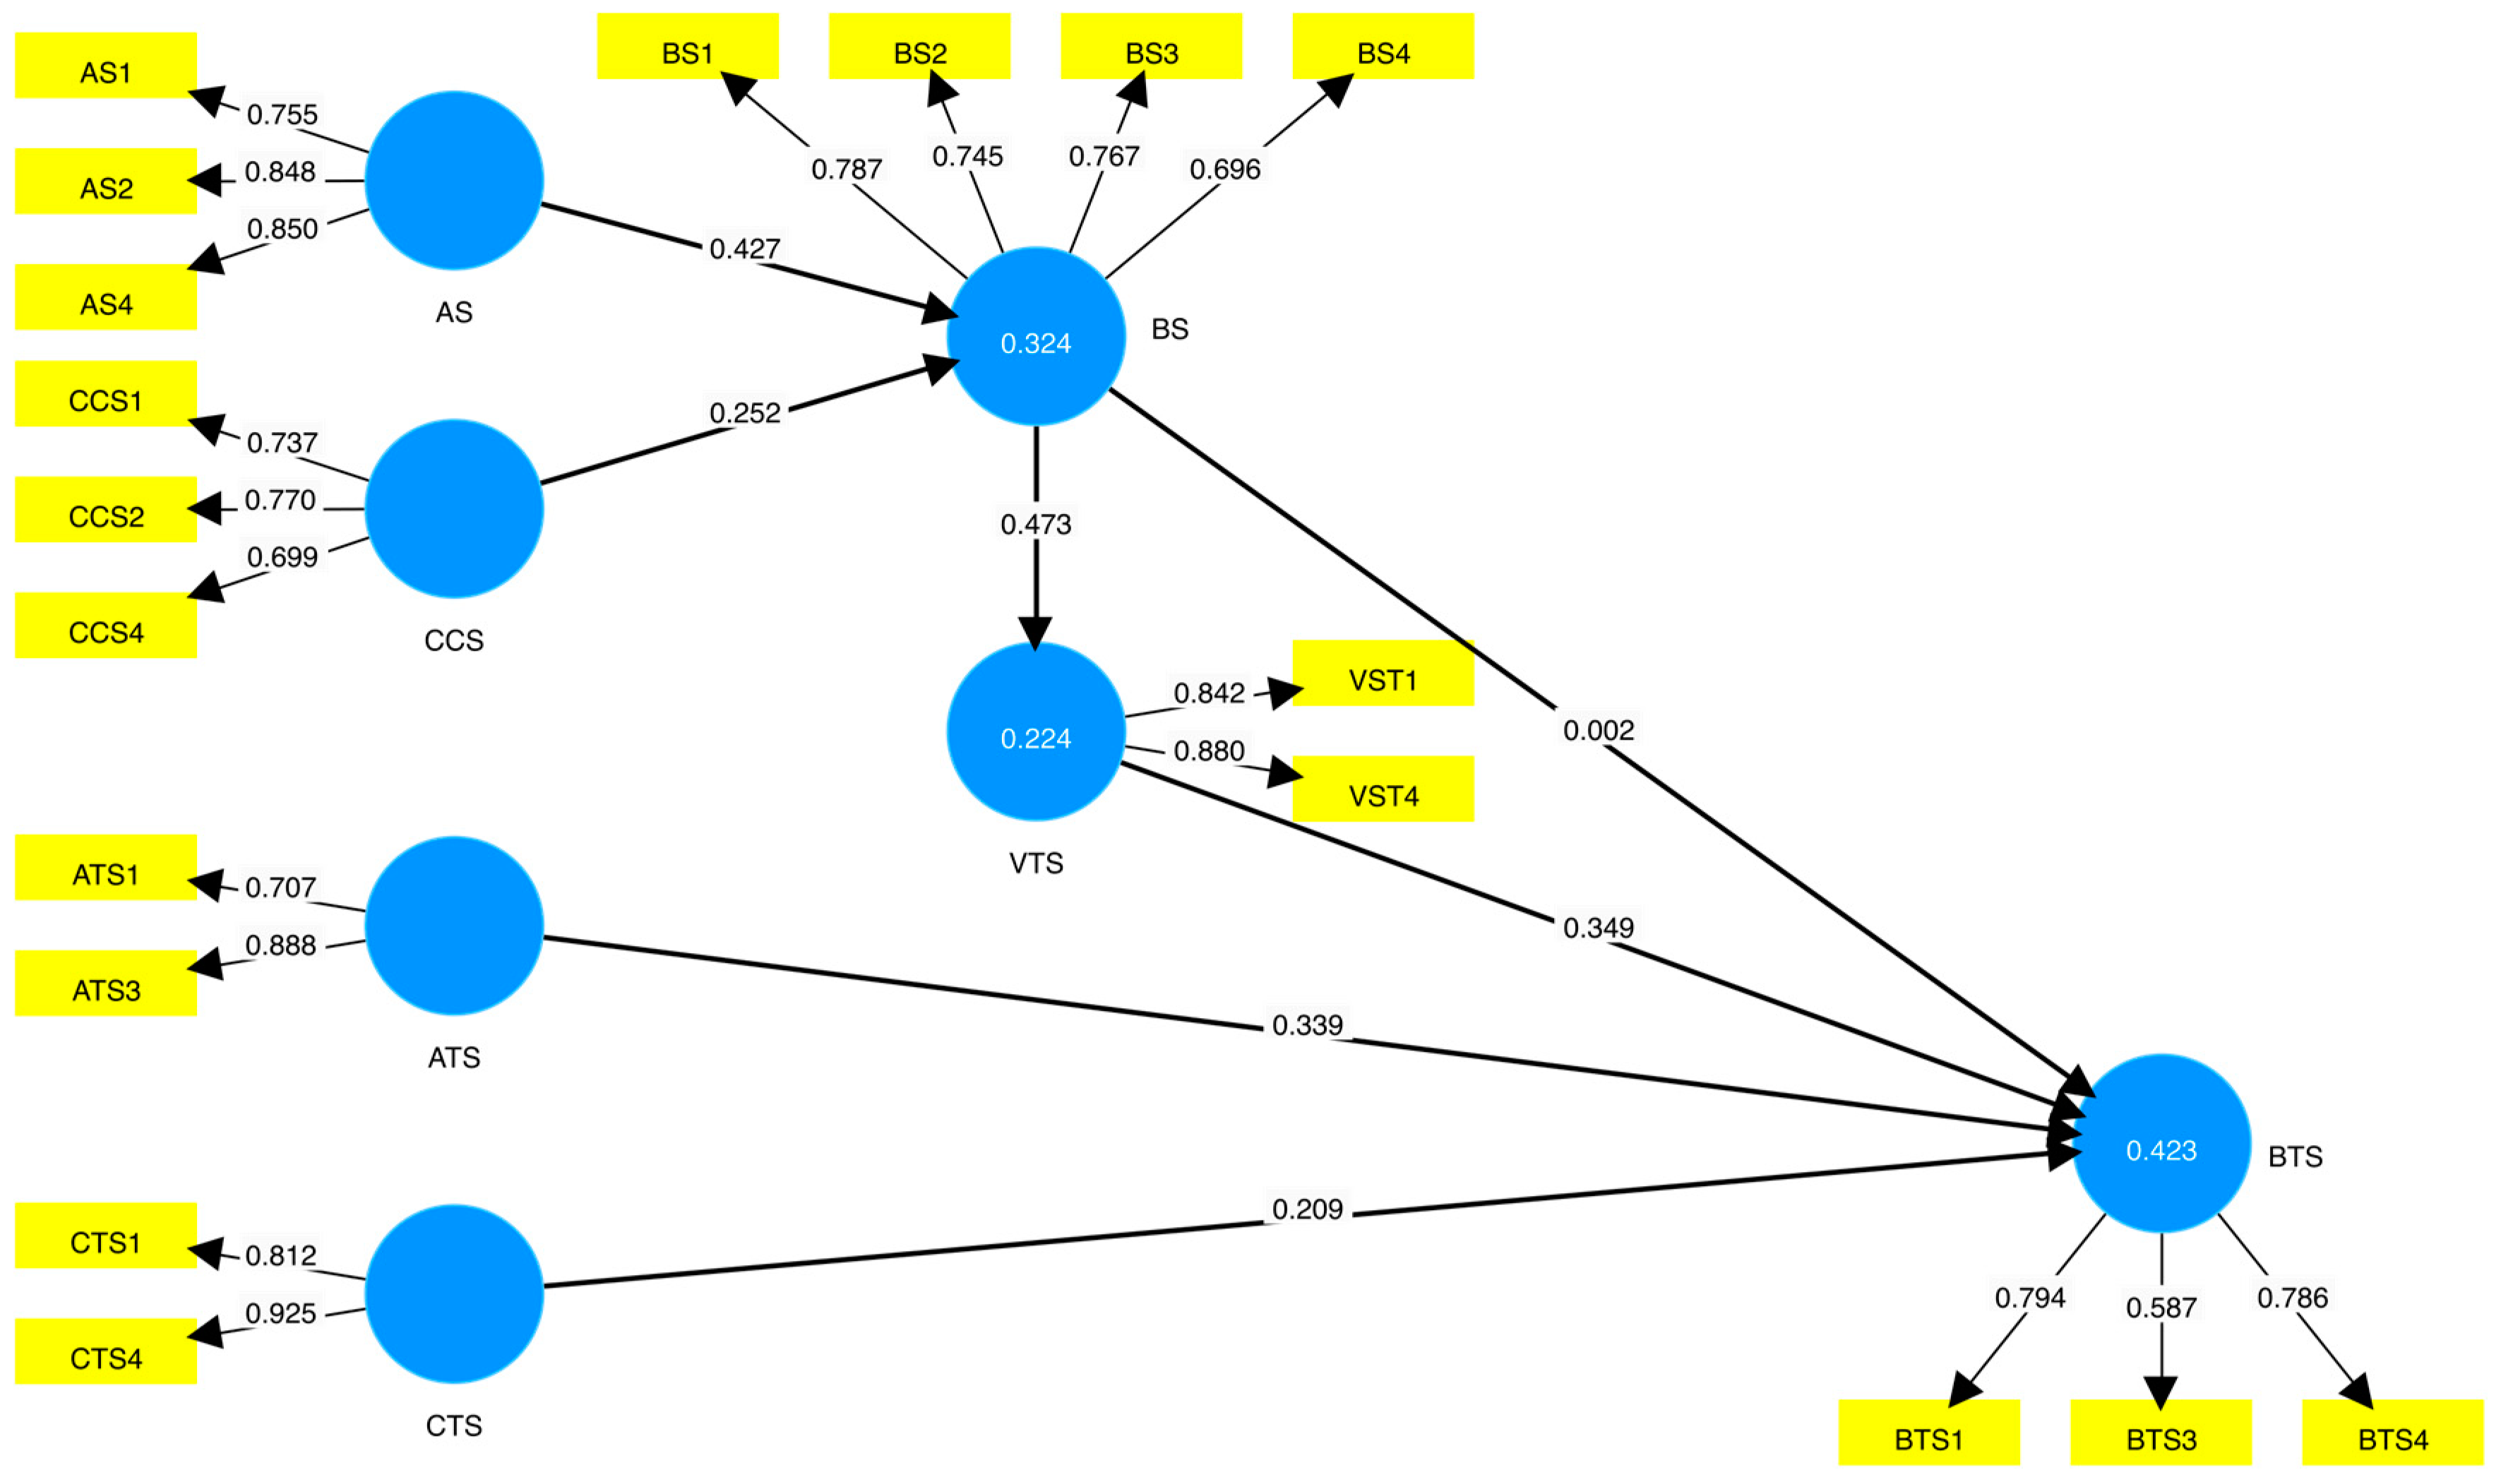
After evaluating the measurement model, we tested the hypothesized relationships within the model. The structural model evaluation involved analyzing path coefficients (β coefficients), coefficients of determination (R2), and predictive relevance (Q2). Table 4 presents the results of the proposed structural model for the total sample and the two subgroups analyzed—gender (male or female) and teacher type (pre-service or in-service). Figure 1 shows the model for the overall sample, with the partial regression coefficients (β or path coefficients), displayed next to the arrows and the R2 values for the corresponding regressions indicated inside the endogenous variables.
Path coefficients (standardized β) represented the strength of the associations between constructs. To determine the significance of these relationships, we estimated regression coefficients between latent factors, along with their t-statistics and p-values, using a bootstrapping procedure with 5000 samples (see Table 4). Effect sizes (f2) for relationships in the structural model are also reported by Hair et al. (2014). The coefficient of determination (R2) indicates the variance explained by the model, reflecting its explanatory power (Chin, 1998) (see Table 4). Additionally, the Q2 value measures the model’s ability to predict the reflective indicators of the endogenous latent variables.
As illustrated in Table 4, the results support H1 and H2, indicating a significant association of Affection towards statistics and Competence in Statistics (CS) on Behavior towards statistics (BS) (H1: β1 = 0.427, sig. at p < 0.001; H2: β2 = 0.252, sig. at p < 0.01). H3, showing the association between ATS on the BTS (H3: β3 = 0.339, sig. at p < 0.01), was also supported.
Following Cohen (2013), we see that these significant effects can be classified as moderate. Conversely, H4 examining the association between CTS and the BTS was not supported (H4: β4 = 0.05, not significant), indicating that BS and BTS follow different patterns. While regarding statistics, perceived competence is positively associated with behavior, the perceived competence in teaching statistics shows no significant association with Behavior towards teaching statistics.
Regarding the relation between BS and BTS, the non-significance of the direct path between the two constructs (H6: β6 = 0.002, not significant) and the significant positive relationships of BS on the VTS (H7: β7 = 0.473, sig. at p < 0.001), and the later on the BTS (H5: β3 = 0.349, sig. at p < 0.05) uncovers a complete mediation between the two behaviors (BS and BTS). In other words, Behavior toward statistics increases the Behavior toward teaching statistics if there is an increase in the perceived value of statistics for the teacher. Additionally, we can see that the variance in the BTS (42.3%) is explained at a similar level by the VTS (16.8%) and the ATS (17.19%). Results also indicate that AS is a stronger predictor (β1 = 0.427 and explained variance 22.2%) in BS than the CS (β2 = 0.252 and explained variance 10.3%).
Finally, we obtained Q2 values using a blindfolding procedure in the structural model. The values above zero (Table 3) suggest the model has satisfactory predictive relevance.
We assessed whether there are differences in the patterns governing these relationships concerning the gender and the experience of the teachers. To this end, we conducted a multigroup analysis (PLS-MGA). Bootstrapping results were retrieved for the total sample and the subgroups (see Table 4), and differences in path coefficients between these groups were tested using bias-corrected and accelerated (Bca) 95% confidence intervals. The results showed that Bca confidence intervals (not reported) between the comparison groups (men vs. women, In-service vs. Pre-service) overlapped, indicating no significant difference in the pair path coefficients. However, differences in the significance of certain paths were observed between segments. For example, it looks like BTS for men are driven by the BS and the VTS (H7: β7 = 0.527, sig. at p < 0.01 and H5: β5 = 0.737, sig. at p < 0.05) while, in women, it comes from the ATS (H3: β3 = 0.417, sig. at p < 0.01). Similarly, for pre-service teachers (H7: β7 = 0.498, sig. at p < 0.01 and. H5: β5 = 0.639, sig. at p < 0.01) and in-service teachers (H3: β3 = 0.43, sig. at p < 0.001 and H3: β3 = 0.329, sig. at p < 0.05). These results suggest that the patterns leading to the Behavior teaching statistics can differ for male and female teachers and pre-service and in-service teachers. However, the limited sample limits the ability to confirm the differences between the groups, and further research is needed.

4.3. FsQCA Analysis

FsQCA allows for evaluating causal conditions or combinations of conditions sufficient to achieve a desired outcome. This study’s desired outcome is high BTS. The conditions examined include the constructs in our PLS model, as well as gender and the teaching experience level.
The initial step in the fsQCA process is calibration, which involves transforming the conditions and outcome variables into fuzzy sets ranging from 0 (full non-membership) to 1 (full membership). We employed Ragin’s direct calibration method (Ragin, 2008). Gender and teaching experience were treated as crisp sets, with experience configured as a dummy variable: 1 indicating an in-service teacher and 0 indicating a teacher in his/her teaching training period. For the other variables measured on 5-point Likert scales, we calculated the average values for each construct and used percentiles to set thresholds for full membership, full non-membership, and the crossover point (Beynon et al., 2016; Dul, 2016). Total membership was defined at the 90th percentile, full non-membership at the 10th percentile, and the crossover point at the 50th percentile. Following Ordanini et al. (2014), we converted the original scores to odds ratios. We calculated the degree of membership using the formula exp log o d d s / ( 1 + e x p ( log o d d s ) , thereby transforming the construct values into fuzzy sets.
The next step is constructing a truth table. Consistent with (Ragin, 2008), we chose a consistency cut-off of 0.80 and a minimum frequency of 1 case for further analysis.
Finally, we conducted logical minimization, which yields three solutions—complex, parsimonious, and intermediate—based on how logical remainders (combinations in the truth table with no cases in the sample) are treated. Table 5 presents the intermediate solution, considered superior (Woodside, 2013) for both high and low levels of environmental orientation.
We identified three solutions for high BTS levels and three for low levels, as shown in Table 5. The overall solution consistency for high BTS is 0.902, exceeding the recommended threshold of 0.75. In this context, consistency is analogous to significance in statistical models (Woodside, 2013), which measures the extent to which a subset relationship is approximated. The overall solution coverage is 0.285, comparable to the R2 value in regression analysis (Ragin, 2006), indicating the empirical relevance of a consistent subset. Thus, the model accounts for only about 28.5% of the respondents who exhibit high BTS.
The model indicates that respondents with a high affection towards statistics (AS), a high affection towards teaching statistics (ATS), a high perceived competence towards teaching statistics (CTS), and a high perceived value of statistics (VTS) are conditions present in all the paths to high levels of Behavior towards teaching statistics. These conditions, and high levels of competence towards statistics (Solution 1) or high levels of Behavior towards statistics (Solution 2), in in-service women teachers are sufficient for high levels of BTS. Additionally, teachers in their training period who show high values in all the parameters also show high values in BTS (Solution 3). Although we did not find significant differences in the paths in the PLS model, having In-service women teachers and teachers in their training periods shows specific, consistent paths leading to high levels of BTS.
We found that, among In-service women, teachers’ low levels of Behavior towards statistics are a sufficient condition for low levels of BTS (solution 4). Alternatively, for this group (women In-service teachers), low levels are also observed when teachers show low levels of affection and perceive low competence in statistics and teaching statistics (solution 5). Finally, male teachers who show low levels of BTS also show low levels of affection, perceived competence, and perceived value (solution 6). This analysis shows differences in the paths for high and low levels of BTS among gender and teaching experience. However, the model’s relatively low coverage indicates that other attitudinal characteristics among teachers may be affecting their Behavior toward teaching statistics.

5. Discussion and Conclusions

Our findings show that teachers generally exhibit positive affective attitudes towards statistics, reflecting a willingness to engage with the subject. Similarly, the affective component of teaching statistics is positively associated with the teacher’s willingness to teach statistics. This aligns with previous studies indicating that positive emotional experiences in learning environments contribute to higher engagement and, therefore, better learning outcomes (Gal & Ginsburg, 1994). However, some participants reported feelings of anxiety and insecurity when dealing with statistical problems, highlighting a potential area for intervention. These findings align with the observations of Garfield and Ahlgren (1988), who noted that teacher apprehension regarding statistical content often limits their ability to deliver effective instruction. This anxiety can be mitigated through supportive instructional strategies that build confidence and reduce fear. For instance, providing real-world applications and collaborative learning opportunities can make statistics more relatable and less intimidating (Schau et al., 1995). Additionally, providing a supportive environment where teachers can share experiences and receive peer feedback can alleviate anxiety (Hannula, 2002).
The cognitive component, which involves beliefs about one’s competence in statistics, also plays an important role. Teachers who perceive themselves as competent are more likely to incorporate statistical concepts into their teaching. The lower scores indicate that while many teachers feel confident in their statistical abilities, a subset still doubts their competence. This lack of confidence can be addressed through targeted professional development programs that enhance statistical skills and knowledge (Estrada et al., 2011). Cognitive competence is essential for effective teaching, as it influences teachers’ instructional strategies, their ability to explain complex concepts to students, and their ability to design effective learning experiences, all of which are relevant to creating a proper learning environment. Enhancing cognitive competence can be achieved through hands-on training, workshops, and continuous professional development, providing teachers with the tools and knowledge to teach statistics effectively (Batanero et al., 2016). By improving their statistical competence, teachers can feel more confident and be better prepared to engage students in meaningful statistical learning. However, teachers’ perceptions of their competence in teaching statistics show no significant association with their Behavior toward teaching statistics.
Behavior toward statistics involves the actions and inclinations to engage with statistical tasks. Positive behaviors include the willingness to use statistics and data in decision-making. Our findings indicate that teachers with positive affective and cognitive attitudes toward statistics are more likely to exhibit positive behavioral intentions toward statistics. Similarly, positive attitudes toward teaching statistics are associated with the Behavior toward teaching statistics. All this is consistent with the hypothesis that attitudes are associated with behaviors (Ajzen, 1989). Therefore, effective teacher training programs should foster positive attitudes that translate into proactive teaching behaviors. Encouraging teachers to integrate statistics into various subjects and to use data-driven decision-making can enhance the learning environment and the overall quality of education (Garfield & Ben-Zvi, 2008). In addition, providing opportunities for teachers to practice these behaviors in a supportive setting can further reinforce positive attitudes and actions.
The perceived value of statistics emerges as an essential element driving the Behavior toward teaching statistics. Indeed, we found it to mediate the relationship between Behavior towards statistics and teaching statistics. A positive attitude towards statistics increases the attitude towards teaching statistics when teachers perceive greater value in statistics. Then, any action to increase teacher Behavior should reinforce the importance of statistics in various domains to enhance its perceived value (Pfannkuch, 2008).
Interestingly, our study found no significant gender differences in attitudes toward statistics and the paths relating to attitudes and behaviors, suggesting that both male and female teachers hold similar views. This finding contrasts with previous studies that reported gender disparities in attitudes toward mathematics and statistics (Gil-Flores, 1999). The absence of gender differences in our study may indicate a shift towards more significant gender equity in attitudes towards statistics, a positive development for fostering inclusive educational environments. Differences based on the teachers’ experience were more pronounced.
The findings highlight the importance of fostering positive attitudes towards statistics among teachers in shaping classroom environments. Teacher training programs should incorporate strategies to enhance both the affective and cognitive components of attitudes toward statistics and address common challenges and misconceptions about statistics. Providing teachers with a deeper understanding of statistical concepts, common misconceptions, and effective teaching strategies can help them feel more prepared and confident in teaching statistics (Flores López & Olivar Molina, 2017). Inquiry-based learning, problem-solving, and data analysis activities can enhance students’ engagement and understanding (Gal, 2004). Programs should include components that target affective factors, such as building confidence and reducing anxiety around statistics. Mentorship and professional development opportunities can help teachers develop positive attitudes (Ruz et al., 2022).
Additionally, designing a curriculum that integrates statistical concepts across various subjects and grade levels can help students develop a strong foundation in statistical literacy (Garfield & Ben-Zvi, 2008). However, our study suggests that the willingness to teach statistics is correlated with the value teachers place on statistics. Then, to foster positive Behavior in teaching statistics, it is essential to apply these concepts to real-world problems and contexts. Real-world applications and examples can make statistics more relevant and engaging for teachers and students (Gamboa Araya & Moreira-Mora, 2016).
This study has some limitations that could be addressed in the future. In particular, it would be advisable to use a larger sample and select participants through probabilistic sampling. It would also be interesting to compare it with studies on samples of pre-service and in-service teachers from other countries.
In conclusion, this study highlights that teachers’ attitudes toward statistics are associated with their Behavior toward teaching statistics, influencing students’ learning experiences. By fostering positive attitudes towards statistics and providing teachers with the necessary training and support, we can enhance the quality of statistics education and promote statistical literacy among students. Future research should continue to explore the factors that influence teachers’ attitudes toward statistics and develop targeted interventions to address these factors. By understanding and addressing teachers’ needs and concerns, we can ensure they are well-equipped to deliver high-quality statistical education and prepare students for a data-driven world.

Author Contributions

Conceptualization, F.R.-A. and A.P.-S.; methodology, F.R.-A. and A.P.-S.; software, A.P.-S. and O.T.; validation, F.R.-A., A.P.-S. and O.T.; formal analysis, F.R.-A. and A.P.-S.; investigation, F.R.-A., A.P.-S. and O.T.; writing—original draft preparation, F.R.-A., A.P.-S. and O.T.; writing—review and editing, O.T.; funding acquisition, F.R.-A. All authors have read and agreed to the published version of the manuscript.

Funding

This study was funded by the Fondecyt Initiation Project No 11220295.

Institutional Review Board Statement

This study was reviewed and approved by the Bioethics and Biosecurity Committee at the University of Bio- Bio (Comité de Bioética y Bioseguridad de la Universidad del Bío-Bío). All participants provided informed consent to participate in the study, and they also provided informed consent for the publication of their anonymized case details.

Informed Consent Statement

Informed consent was obtained from all subjects involved in the study.

Data Availability Statement

The data underlying this study cannot be made publicly available due to legal constraints on the collection of participants’ personal information.

Conflicts of Interest

The authors declare no conflicts of interest.

Abbreviations

The following abbreviations are used in this manuscript:
ASAffection towards Statistics
CCSCognitive Competence towards Statistics
BSBehavior towards Statistics
ATSAffection towards Teaching Statistics
CTSCognitive Competence towards Teaching Statistics
BTSBehavior towards Teaching Statistics
VTSValue towards Statistics (and its Teaching)
EAEEAttitudes Toward Statistics and Its Teaching Scale
EAPEAttitudes Toward Statistics and Probability and Its Teaching Scale
PLS-SEMPartial Least Squares Structural Equation Modeling
fsQCAFuzzy-set Qualitative Comparative Analysis
PLS-MGAPartial Least Squares Multigroup Analysis
CRComposite Reliability

References

  1. Afamasaga-Fuata’i, K., & Sooaemalelagi, L. (2014). Student teachers’ mathematics attitudes, authentic investigations and use of metacognitive tools. Journal of Mathematics Teacher Education, 17(4), 331–368. [Google Scholar] [CrossRef]
  2. Aiken, L. (2002). Attitudes and related psychosocial constructs: Theories, assessment, and research. Sage. [Google Scholar]
  3. Ajzen, I. (1989). Attitude structure and behavior. In Attitude structure and function (pp. 241–274). Psychology Press. [Google Scholar]
  4. Avsec, S., & Jagiełło-Kowalczyk, M. (2018). Pre-service teachers’ attitudes towards technology, engagement in active learning, and creativity as predictors of ability to innovate. International Journal of Engineering Education, 34(3), 1049–1059. [Google Scholar]
  5. Batanero, C., Chernoff, E. J., Engel, J., Lee, H. S., & Sánchez, E. (2016). Research on teaching and learning probability. In Research on teaching and learning probability (pp. 1–33). ICME-13 Topical Surveys. Springer. [Google Scholar] [CrossRef]
  6. Batanero, C., Contreras, J. M., Díaz, C., & Cañadas, G. R. (2014). Preparing teachers to teach conditional probability: A didactic situation based on the Monty Hall problem. In T. Wassong, D. Frischemeier, P. Fischer, R. Hochmuth, & P. Bender (Eds.), Mit werkzeugen mathematik und stochastik lernen—Using tools for learning mathematics and statistics (pp. 363–376). Springer Fachmedien. [Google Scholar] [CrossRef]
  7. Batanero, C., & Díaz, C. (2012). Training teachers to teach probability: Reflections and challenges. Chilean Journal of Statistics, 3, 3–13. [Google Scholar]
  8. Batanero, C., Godino, J. D., & Roa, R. (2004). Training teachers to teach probability. Journal of Statistics Education, 12(1). [Google Scholar] [CrossRef]
  9. Beynon, M., Jones, P., & Pickernell, D. (2016). Country-level investigation of innovation investment in manufacturing: Paired FsQCA of two models. Journal of Business Research, 69, 5401–5407. [Google Scholar]
  10. Borges, L. (2022). A complex dynamic model of autonomy development. Studies in Self-Access Learning Journal, 13(2), 200–223. [Google Scholar] [CrossRef] [PubMed]
  11. Carton, E., Woolard, A., Fitzgerald, K., & Martin, K. (2025). Pre-service teachers’ experiences with students impacted by trauma in the school setting. Social Psychology of Education, 28(1), 84. [Google Scholar] [CrossRef]
  12. Chin, W. W. (1998). The partial least squares approach to structural equation modeling. In Modern methods for business research. Lawrence Erlbaum Associates. [Google Scholar]
  13. Cimermanová, I. (2017). English language pre-service and in-service teachers’ self-efficacy and attitudes towards integration of students with learning difficulties. Journal of Language and Cultural Education, 5(1), 20–38. [Google Scholar] [CrossRef]
  14. Cohen, J. (2013). Statistical power analysis for the behavioral sciences (2nd ed.). Routledge. [Google Scholar]
  15. Debbag, M., & Fidan, M. (2022). Vlogs for enhancing trainee teachers’ motivational beliefs about school experience and teaching practice: They are on the factory floor for professional development. Journal of Research on Technology in Education, 54(5), 719–735. [Google Scholar] [CrossRef]
  16. Di Martino, P., & Zan, R. (2015). The construct of attitude in mathematics education. In From beliefs to dynamic affect systems in mathematics education: Exploring a mosaic of relationships and interactions (pp. 51–72). Springer. [Google Scholar] [CrossRef]
  17. Dul, J. (2016). Identifying single necessary conditions with NCA and fsQCA. Journal of Business Research, 69(4), 1516–1523. [Google Scholar] [CrossRef]
  18. Dushimimana, J. C., Urwibutso, A., & Uworwabayeho, A. (2024). Assessing the attitudes of pre-service primary mathematics teachers towards statistics and gender influence. Cogent Education, 11(1), 2315840. [Google Scholar] [CrossRef]
  19. Ertmer, P. A., & Ottenbreit-Leftwich, A. T. (2010). Teacher technology change. Journal of Research on Technology in Education, 42(3), 255–284. [Google Scholar] [CrossRef]
  20. Estrada, A., & Batanero, C. (2008). Explaining teachers’ attitudes towards statistics. In C. Batanero, G. Burrill, C. Reading, & A. Rossman (Eds.), Teaching statistics in school mathematics—Challenges for teaching and teacher education: A joint ICMI/IASE study. Springer. [Google Scholar]
  21. Estrada, A., Batanero, C., & Díaz, C. (2018). Exploring teachers’ attitudes towards probability and its teaching. In Teaching and learning stochastics: Advances in probability education research (pp. 313–332). Springer International Publishing. [Google Scholar] [CrossRef]
  22. Estrada, A., Batanero, C., Fortuny, J. M., & Díaz, C. (2005). A structural study of future teachers’ attitudes towards statistics. In M. Bosch (Ed.), Proceedings of the fourth congress of the european society for research in mathematics education (pp. 508–517). IQS Fundemi. [Google Scholar]
  23. Estrada, A., Batanero, C., & Lancaster, S. (2011). Teachers’ attitudes towards statistics. In Teaching statistics in school mathematics-challenges for teaching and teacher education: A joint ICMI/IASE study: The 18th ICMI study 2011 (pp. 163–174). Springer. [Google Scholar] [CrossRef]
  24. Estrada, A., Bernabeu, C. B., & Aymemí, J. M. F. (2004). Un estudio comparado de las actitudes hacia la estadística en profesores en formación y en ejercicio [A comparative study of attitudes towards statistics in teachers in training and in practice]. Enseñanza de Las Ciencias: Revista de Investigación y Experiencias Didácticas, 22, 263–273. [Google Scholar]
  25. Estrada Roca, M. A. (2003). Análisis de las actitudes y conocimientos estadísticos elementales en la formación del profesorado [Analysis of basic statistical attitudes and knowledge in teacher training] [Doctoral Thesis, Facultat de Ciències de l’Educació, Universitat Autònoma de Barcelona]. [Google Scholar]
  26. Fairhurst, N., Koul, R., & Sheffield, R. (2023). Students’ perceptions of their STEM learning environment. Learning Environments Research, 26(3), 977–998. [Google Scholar] [CrossRef] [PubMed]
  27. Flores López, W. O., & Olivar Molina, S. A. (2017). Actitudes hacia la estadística en la formación del profesorado para contextos multiculturales. Revista Universitaria del Caribe, 17(2), 27–37. [Google Scholar] [CrossRef]
  28. Fornell, C., & Larcker, D. F. (1981). Evaluating structural equation models with unobservable variables and measurement error. Journal of Marketing Research, 18(1), 39–50. [Google Scholar] [CrossRef]
  29. Gal, I. (2004). Statistical literacy. In D. Ben-Zvi, & J. Garfield (Eds.), The challenge of developing statistical literacy, reasoning and thinking (pp. 47–78). Springer. [Google Scholar] [CrossRef]
  30. Gal, I., & Ginsburg, L. (1994). The role of beliefs and attitudes in learning statistics: Towards an assessment framework. Journal of Statistics Education, 2(2). [Google Scholar] [CrossRef]
  31. Gal, I., Ginsburg, L., & Schau, C. (1997). Monitoring attitudes and beliefs in statistics education. In I. Gal, L. Ginsburg, & C. Schau (Eds.), The assessment challenge in statistics education (pp. 37–51). IOS Press. [Google Scholar]
  32. Gamboa Araya, R., & Moreira-Mora, T. E. (2016). Un modelo explicativo de las creencias y actitudes hacia las Matemáticas. Avances de Investigación En Educación Matemática, 10, 27–51. [Google Scholar] [CrossRef]
  33. Garfield, J., & Ahlgren, A. (1988). Difficulties in learning basic concepts in probability and statistics: Implications for research. Journal for Research in Mathematics Education, 19, 44–63. [Google Scholar] [CrossRef]
  34. Garfield, J., & Ben-Zvi, D. (2008). Developing students’ statistical reasoning: Connecting research and teaching practice. Springer. [Google Scholar]
  35. Gil-Flores, J. (1999). Actitudes hacia la estadística. Incidencia de las variables sexo y formación previa [Attitudes towards statistics. Incidence of the variables sex and previous training]. Revista Española de Pedagogía, 57, 567–589. [Google Scholar]
  36. Gómez-Chacón, I. M. (2000). Affective influences in the knowledge of mathematics. Educational Studies in Mathematics, 43(2), 149–168. [Google Scholar] [CrossRef]
  37. Groth, R., & Meletiou-Mavrotheris, M. (2018). Research on statistics teachers’ cognitive and affective characteristics. In D. Ben-Zvi, K. Makar, & J. Garfield (Eds.), International handbook of research in statistics education (pp. 327–355). Springer. [Google Scholar] [CrossRef]
  38. Gundlach, E., Richards, K. A. R., Nelson, D., & Levesque-Bristol, C. (2015). A comparison of student attitudes, statistical reasoning, performance, and perceptions for web-augmented traditional, fully online, and flipped sections of a statistical literacy class. Journal of Statistics Education, 23(1), 1–33. [Google Scholar] [CrossRef]
  39. Hair, J. F., Ringle, C. M., & Sarstedt, M. (2011). PLS-SEM: Indeed a silver bullet. Journal of Marketing Theory and Practice, 19(2), 139–152. [Google Scholar] [CrossRef]
  40. Hair, J. F., Jr., Black, W. C., Babin, B. J., & Anderson, R. E. (2009). Structural equation modeling basics. Multivariate Data Analysis, 1, 1–35. [Google Scholar]
  41. Hair, J. F., Jr., Sarstedt, M., Hopkins, L., & Kuppelwieser, V. G. (2014). Partial least squares structural equation modeling (PLS-SEM): An emerging tool in business research. European Business Review, 26(2), 106–121. [Google Scholar]
  42. Hannigan, A., Gill, O., & Leavy, A. M. (2013). An investigation of prospective secondary mathematics teachers’ conceptual knowledge of and attitudes towards statistics. Journal of Mathematics Teacher Education, 16(6), 427–449. [Google Scholar] [CrossRef]
  43. Hannula, M. S. (2002). Attitude towards mathematics: Emotions, expectations and values. Educational Studies in Mathematics, 49(1), 25–46. [Google Scholar] [CrossRef]
  44. Hollenstein, L., Rubie-Davies, C. M., & Brühwiler, C. (2024). Teacher expectations and their relations with primary school students’ achievement, self-concept, and anxiety in mathematics. Social Psychology of Education, 27(2), 567–586. [Google Scholar] [CrossRef]
  45. Ingvarson, L., Meiers, M., & Beavis, A. (2005). Factors affecting the impact of professional development programs on teachers’ knowledge, practice, student outcomes & efficacy. Education Policy Analysis Archives, 13, 10. [Google Scholar] [CrossRef]
  46. Ivars, P., Fernández, C., & Llinares, S. (2020). A learning trajectory as a scaffold for pre-service teachers’ noticing of students’ mathematical understanding. International Journal of Science and Mathematics Education, 18(3), 529–548. [Google Scholar] [CrossRef]
  47. Jong, C., & Hodges, T. E. (2015). Assessing attitudes toward mathematics across teacher education contexts. Journal of Mathematics Teacher Education, 18(5), 407–425. [Google Scholar] [CrossRef]
  48. Kvatinsky, T., & Even, R. (2002, July 7–12). Framework for teacher knowledge and understanding about probability. Sixth International Conference on Teaching Statistics (CD), Cape Town, South Africa. [Google Scholar]
  49. Leighton, J. P., Guo, Q., & Tang, W. (2022). Measuring preservice teachers’ attitudes towards mistakes in learning environments. Learning Environments Research, 25(1), 287–304. [Google Scholar] [CrossRef]
  50. Makar, K., & Fielding-Wells, J. (2011). Teaching teachers to teach statistical investigations. In Teaching statistics in school mathematics-challenges for teaching and teacher education (Vol. 14, pp. 347–358). Springer. [Google Scholar] [CrossRef]
  51. Martins, J. A., Nascimento, M. M., & Estrada, A. (2011). Attitudes of teachers towards statistics: A preliminary study with Portuguese teachers. In M. Pytlak, T. Rowland, & E. Swoboda (Eds.), 7th congress of the European society for research in mathematics education (pp. 828–837). University of Rzeszñw. [Google Scholar]
  52. Martins, J. A., Nascimento, M. M., & Estrada, A. (2012). Looking back over their shoulders: A qualitative analysis of Portuguese teachers’ attitudes towards statistics. Statistics Education Research Journal, 11(1), 26–44. [Google Scholar] [CrossRef]
  53. Marzano, R. J., & Marzano, J. S. (2003). The key to classroom management. Educational Leadership, 61(1), 6. [Google Scholar]
  54. McLeod, D. B. (2006). Research on affect in mathematics education: A reconceptualization. In Handbook of research on mathematics teaching and learning (pp. 575–596). Emerald Publishing Limited. [Google Scholar] [CrossRef]
  55. McMillan, J. H., & Schumacher, S. (2001). Research in education: A conceptual introduction. Longman. [Google Scholar]
  56. Mendes, R. A., Loxton, N. J., Stuart, J., O’Donnell, A. W., & Stainer, M. J. (2024). Statistics anxiety or statistics fear? A reinforcement sensitivity theory perspective on psychology students’ statistics anxiety, attitudes, and self-efficacy. European Journal of Psychology of Education, 39(3), 2461–2480. [Google Scholar] [CrossRef]
  57. Monsen, J. J., Ewing, D. L., & Kwoka, M. (2014). Teachers’ attitudes towards inclusion, perceived adequacy of support and classroom learning environment. Learning Environments Research, 17(1), 113–126. [Google Scholar] [CrossRef]
  58. Onwuegbuzie, A. J., & Wilson, V. A. (2003). Statistics anxiety: Nature, etiology, antecedents, effects, and treatments—A comprehensive review of the literature. Teaching in Higher Education, 8(2), 195–209. [Google Scholar] [CrossRef]
  59. Ordanini, A., Parasuraman, A., & Rubera, G. (2014). When the recipe is more important than the ingredients. Journal of Service Research, 17(2), 134–149. [Google Scholar] [CrossRef]
  60. Ostertagová, E., Ostertag, O., & Kováč, J. (2014). Methodology and application of the Kruskal-Wallis test. Applied Mechanics and Materials, 611, 115–120. [Google Scholar] [CrossRef]
  61. Pfannkuch, M. (2008, July 6–13). Building sampling concepts for statistical inference: A case study. International Congress on Mathematical Education, Monterrey, Mexico. [Google Scholar]
  62. Philipp, R. A. (2007). Mathematics teachers’ beliefs and affect. In F. J. Lester Jr. (Ed.), Second handbook of research on mathematics teaching and learning (Vol. 1, pp. 257–315). Age Publishing. [Google Scholar]
  63. Prodromou, T. (2014). GeoGebra in teaching and learning introductory statistics. The Electronic Journal of Mathematics and Technology, 8(5). [Google Scholar]
  64. Ragin, C. C. (2006). Set relations in social research: Evaluating their consistency and coverage. Political Analysis, 14(3), 291–310. [Google Scholar] [CrossRef]
  65. Ragin, C. C. (2008). Redesigning social inquiry. University of Chicago Press. [Google Scholar]
  66. Ragin, C. C., & Davey, S. (2022). Fuzzy-set/qualitative comparative analysis 4.0. Available online: https://sites.socsci.uci.edu/~cragin/fsQCA/ (accessed on 10 July 2025).
  67. Ramírez Martínez, D. C., Martínez Ruiz, L. C., & Castellanos Domínguez, O. F. (2012). Divulgación y difusión del conocimiento: Las revistas científicas [Dissemination and dissemination of knowledge: Scientific journals]. Biogestión 2012. Universidad Nacional de Colombia. [Google Scholar]
  68. Ringle, C. M., Wende, S., & Becker, J.-M. (2024). SmartPLS 4. Available online: https://www.smartpls.com (accessed on 10 July 2025).
  69. Rodriguez-Alveal, F. E. (2017). Alfabetización estadística en profesores de distintos niveles formativos [Statistical literacy in teachers of different training levels]. Educação & Realidade, 42(4), 1459–1477. [Google Scholar]
  70. Ruz, F., Molina-Portillo, E., & Contreras, J. M. (2022). Escala de actitudes hacia la estadística descriptiva y su enseñanza para profesores de matemáticas. Profesorado, Revista de Currículum y Formación Del Profesorado, 26(1), 107–126. [Google Scholar] [CrossRef]
  71. Salifu, A. S., & Dokurugu, M. E. (2022). The relationship between pre-service teachers’ attitude towards statistics and attitude towards probability. Infinity Journal, 11(1), 115. [Google Scholar] [CrossRef]
  72. Savolainen, H., Engelbrecht, P., Nel, M., & Malinen, O.-P. (2012). Understanding teachers’ attitudes and self-efficacy in inclusive education: Implications for pre-service and in-service teacher education. European Journal of Special Needs Education, 27(1), 51–68. [Google Scholar] [CrossRef]
  73. Schau, C., Stevens, J., Dauphinee, T. L., & Del Vecchio, A. (1995). The development and validation of the survey of attitudes toward statistics. Educational and Psychological Measurement, 55(5), 868–875. [Google Scholar] [CrossRef]
  74. Scheaffer, R. L., & Jacobbe, T. (2014). Statistics education in the K-12 schools of the United States: A brief history. Journal of Statistics Education, 22(2). [Google Scholar] [CrossRef]
  75. Schneider, C. Q., & Wagemann, C. (2010). Standards of good practice in qualitative comparative analysis (QCA) and fuzzy-sets. Comparative Sociology, 9(3), 397–418. [Google Scholar] [CrossRef]
  76. Schoen, R. C., Rhoads, C., Perez, A., Jacobbe, T., & Li, L. (2025). Improving the teaching and learning of statistics. Learning and Instruction, 95, 102018. [Google Scholar] [CrossRef]
  77. Shulman, L. S. (1986). Those who understand: Knowledge growth in teaching. Educational Researcher, 15(2), 4–14. [Google Scholar] [CrossRef]
  78. Steinberger, P. (2020). Assessing the statistical anxiety rating scale as applied to prospective teachers in an Israeli teacher-training college. Studies in Educational Evaluation, 64, 100829. [Google Scholar] [CrossRef]
  79. Stohl, H. (2005). Probability in teacher education and development. In Exploring probability in school: Challenges for teaching and learning (pp. 345–366). Springer. [Google Scholar]
  80. Tishkovskaya, S., & Lancaster, G. A. (2012). Statistical education in the 21st century: A review of challenges, teaching innovations and strategies for reform. Journal of Statistics Education, 20(2). [Google Scholar] [CrossRef]
  81. Unidad de Currículum y Evaluación [UCE]. (2016). Matemática [Second year study program]. MINEDU Ministerio de Educación.
  82. Van Petegem, P., Donche, V., & Vanhoof, J. (2005). Relating pre-service teachers’ approaches to learning and preferences for constructivist learning environments. Learning Environments Research, 8(3), 309–332. [Google Scholar] [CrossRef]
  83. Veloo, A., & Chairhany, S. (2013). Fostering students’ attitudes and achievement in probability using teams-games-tournaments. Procedia—Social and Behavioral Sciences, 93, 59–64. [Google Scholar] [CrossRef]
  84. Watson, J., & Smith, C. (2022). Statistics education at a time of global disruption and crises: A growing challenge for the curriculum, classroom and beyond. Curriculum Perspectives, 42(2), 171–179. [Google Scholar] [CrossRef]
  85. Woodside, A. G. (2013). Moving beyond multiple regression analysis to algorithms: Calling for adoption of a paradigm shift from symmetric to asymmetric thinking in data analysis and crafting theory. Journal of Business Research, 66(4), 463–472. [Google Scholar] [CrossRef]
  86. Zapata Cardona, L., & Rocha Salamanca, P. (2011, June 26–30). Actitudes de profesores hacia la es-tadística y su enseñanza [Teachers’ attitudes towards statistics and its teaching]. XIII Conferência Interamericana de Educação Matemática, Recife, Brazil. [Google Scholar]
  87. Zieffler, A., Garfield, J., & Fry, E. (2017). What is statistics education? In D. Ben-Zvi, K. Makar, & J. Garfield (Eds.), International handbook of research in statistics education (pp. 37–70). Springer International Publishing. [Google Scholar] [CrossRef]
Figure 1. Representation of the PLS-SEM model.
Education 16 01033 g001
Table 1. Sample characteristics and comparison.
VariableMeanStd. Dev.MedianKruskal–Wallis
H-Statistic
Kruskal–Wallis
p-Value
AS3.8450.7754
Women3.8650.81640.3310.565
Men3.8070.7004
Pre-service3.6450.7453.676.8760.009
In-service3.9870.7714
CCS3.2340.7623.33
Women3.1510.7683.332.1790.140
Men3.3950.7353.33
Pre-service3.1960.8333.330.2710.603
In-service3.2620.7133.33
BS3.6940.6523.75
Women3.7570.6823.752.8520.091
Men3.5720.5783.625
Pre-service3.4400.7093.511.2020.001
In-service3.8730.5453.75
ATS4.2300.5754.5
Women4.2950.6004.54.5680.033
Men4.1050.5094
Pre-service4.0540.58047.5570.006
In-service4.3540.5434.5
CTS3.0860.8943.5
Women3.0000.9543.51.1340.287
Men3.2500.7513.25
Pre-service3.1520.88730.1550.694
In-service3.0380.9033.5
VTS4.3240.5984.5
Women4.4110.5424.53.6910.055
Men4.1580.6694.25
Pre-service4.0870.608413.5820.000
In-service4.4920.5344.5
BTS4.0860.6794
Women4.1420.6964.3331.5890.207
Men3.9780.6394
Pre-service4.0690.6524.3330.0170.896
In-service4.0970.7014
Table 2. Measurement model reliability and validity.
LoadingsCRAVE
Affection towards statistics (AS) 0.8590.670
AS10.755
AS20.848
AS40.85
Affection towards teaching statistics (ATS) 0.7810.644
ATS10.707
ATS30.888
Behavior towards statistics (BS) 0.8370.562
BS10.787
BS20.745
BS30.767
BS40.696
Behavior towards teaching statistics (BTS) 0.7690.531
BTS10.794
BTS30.587
BTS40.786
Competence in statistics (CCS) 0.7800.542
CCS10.737
CCS20.770
CCS40.699
Perceived didactic competence in teaching statistics (CTS) 0.8620.758
CTS10.812
CTS40.925
Perceived value of statistics (VTS) 0.8510.741
VTS10.842
VTS40.880
Table 3. Discriminant validity measures.
ASATSBSBTSCCSCTSVTS
AS0.819
ATS0.6080.802
BS0.5190.4370.75
BTS0.4730.5280.4060.728
CCS0.3650.310.4080.2330.736
CTS0.5730.3520.4310.3610.5380.87
VTS0.2960.330.4730.4810.1790.0910.861
Table 4. Results of the structural model.
Effects onPathf2Variance ExplainedQ2MenWomenIn-ServicePre-Sevice
Behavior towards statistics 0.3240.282
H1: Affection towards statistics0.427 (5.487) ***0.2340.222 0.338 (2.497) *0.438 (4.76) ***0.346 (3.156) **0.448 (3.813) **
H2: Competence in statistics0.252 (3.037) **0.0820.103 0.275 (1.288) n.s.0.326 (3.415) **0.269 (1.822) n.s.0.282 (2.223) **
Behavior towards teaching statistics 0.4230.252
H3: Affection towards teaching statistics0.339 (2.874) **0.1490.179 0.16 (0.582) n.s.0.417 (3.367) **0.43 (3.82) ***0.349 (1.903) n.s.
H4: Perceived didactic competence in teaching statistics0.209 (1.907) n.s.0.0570.075 0.138 (0.799) n.s.0.265 (1.771) n.s.0.329 (2.431) *−0.028 (0.19) n.s.
H5: Perceived value of statistics0.349 (2.094) *0.1550.168 0.737 (2.071) *0.141 (1.155) n.s.0.106 (0.979) n.s.0.639 (2.796) **
H6: Behavior towards statistics 0.002 (0.023) n.s.0.0000.001 −0.131 (0.624) n.s.0.022 (0.169) n.s.0.108 (0.88) n.s.−0.04 (0.232) n.s.
Perceived value of statistics 0.2240.072
H7: Behavior towards statistics 0.473 (5.319) ***0.2880.224 0.527 (2.815) **0.45 (4.28) ***0.354 (3.055) **0.498 (3.444) **
*** significant at p < 0.001, ** significant at p < 0.01, * significant at p > 0.05, n.s. not significant.
Table 5. fsQCA results.
High Levels of BTS Low Levels of BTS
Configuration123456
AS
CCS
BS
ATS
CTS
VTS
Gender
Experience
Consistency0.8260.8830.9770.7440.8410.899
Raw Coverage0.1360.1760.1010.2890.2450.185
Unique Coverage0.0080.0480.1010.0750.0310.185
Overall Solution consistency0.902 0.792
Overall solution coverage0.285 0.510
Note: ● indicates a present condition (core or peripheral); ⊗ indicates an absent condition; blank cells indicate conditions not relevant to the configuration. Symbols follow Ragin’s (2006) fsQCA notation.
Disclaimer/Publisher’s Note: The statements, opinions and data contained in all publications are solely those of the individual author(s) and contributor(s) and not of MDPI and/or the editor(s). MDPI and/or the editor(s) disclaim responsibility for any injury to people or property resulting from any ideas, methods, instructions or products referred to in the content.