1. Introduction
The rapid expansion of information and communication technologies has significantly transformed contemporary educational ecosystems, particularly through the widespread integration of digital and adaptive learning environments. E-learning systems have become essential components of instructional practice, offering flexible access to learning resources, personalised support, and data-driven insights that inform pedagogical decision-making (
Durlach & Lesgold, 2012;
Tatoj et al., 2018;
Yaroshenko & Vapnyarchuk, 2021). As learner populations become increasingly heterogeneous with respect to prior knowledge, motivation, and learning trajectories, there is growing demand for systems capable of tailoring instructional processes to individual learner needs.
Adaptive e-learning systems (AES) address this challenge by monitoring learner performance in real time and delivering customised pathways, feedback, and scaffolding. Such environments dynamically adjust content difficulty, pacing, and representational modes, thereby aligning instructional support more closely with cognitive readiness and learner behaviour. Recent studies demonstrate that adaptive sequencing and data-driven feedback can enhance engagement, reduce cognitive load, and facilitate the acquisition of complex skills in digital learning contexts (
Amane et al., 2023;
Bilous, 2019;
Özyurt & Özyurt, 2015). These findings underscore the pedagogical value of adaptive systems, particularly in subjects requiring cumulative conceptual reasoning.
The design of the adaptive learning environment is grounded in established frameworks in mathematics education research, drawing on constructivist learning theory, mastery-oriented instructional principles, and design-based research approaches. Constructivist learning theory emphasises active knowledge construction and the role of feedback in resolving misconceptions, which is particularly relevant in cumulative and algorithmic domains such as number theory. Mastery-oriented instructional principles further highlight the importance of prerequisite understanding, formative feedback, and differentiated pacing, all of which are reflected in the system’s adaptive task sequencing and feedback mechanisms. In line with design-based research methodology, the learning environment was iteratively designed, implemented, and evaluated in authentic educational contexts, with adaptive mechanisms.
In the present study, adaptivity is operationalised through rule-based mechanisms that dynamically adjust the learning environment based on learner data. Specifically, the system adapts the following:
Task difficulty: by selecting subsequent tasks according to prior task success and error frequency;
Task sequencing: by redirecting learners to prerequisite or remedial content when persistent errors are detected;
Feedback intensity: by providing additional hints, worked examples, or explanatory scaffolds in response to repeated incorrect attempts;
Learning paths: by allowing learners to progress at individual paces rather than following a fixed linear sequence.
The adaptive mechanisms are implemented using rule-based decision logic derived from learner performance data, including task success rates, response patterns, and interaction frequency. These rules determine when learners receive additional practice, alternative explanations, or progression to more advanced tasks. Unlike conventional LMS-based implementations, the system does not merely present identical content to all learners but continuously modifies task selection and feedback based on individual learner behaviour captured through logfile analytics.
Number theory represents a mathematical domain in which learners often demonstrate persistent conceptual and procedural difficulties—particularly regarding factors and multiples, divisibility, prime numbers, prime factorisation, and related topics such as GCD/LCM—according to prior empirical research and classroom-based evidence (
Kurz & Garcia, 2012;
Kiss, 2020). International research consistently highlights persistent misconceptions, limited confidence, and challenges in applying number-theoretic algorithms among secondary and early tertiary learners (
Dabingaya, 2022). In number theory education, these challenges are often amplified by the cumulative and algorithmic nature of core topics, where insufficient opportunities for differentiated instruction and timely, personalised feedback may allow early misconceptions (e.g., in divisibility or factorisation) to persist and propagate across subsequent problem-solving tasks. Adaptive systems, through features such as real-time error detection, targeted remediation, interactive visualisations, and progressively structured tasks, offer mechanisms for addressing these pedagogical limitations.
Number theory constitutes a distinct mathematical domain characterised by high levels of abstraction, cumulative conceptual dependencies, and algorithmic reasoning processes, which frequently lead to persistent learner difficulties in areas such as divisibility, prime factorisation, and algorithmic procedures (e.g., the Euclidean algorithm) (
Tall, 2002;
Fischbein et al., 1995). Prior research in mathematics education has shown that these domain-specific challenges are closely related to gaps between procedural and conceptual understanding, making number theory particularly suitable for adaptive instructional approaches that provide differentiated task sequencing and targeted feedback.
Number theory coursework, particularly in early tertiary settings, presents specific learning challenges that can be addressed through structured strategies such as retrieval practice, which has been shown to help reduce performance gaps in first-year number theory students (
Muzsnay et al., 2025). This finding further justifies the need for adaptive e-learning systems tailored to number theory, as generic adaptive approaches may not fully capture the unique cognitive and procedural demands of this domain.
Number theory is particularly well suited to adaptive instructional approaches due to its discrete, algorithmic, and highly cumulative structure. Core topics such as divisibility, prime factorisation, and greatest common divisors rely on sequential procedural steps and prerequisite conceptual understanding. Learners often progress at markedly different rates, and errors tend to propagate if earlier misconceptions are not detected and addressed. These characteristics make static, one-size-fits-all instruction especially limiting in number theory, while creating clear opportunities for adaptive systems that adjust task sequencing, difficulty, and feedback based on individual learner performance.
In addition to benefits for learners, adaptive environments hold promise for teachers by supporting data-informed instruction, reducing workload through automated performance analysis, and enabling more nuanced differentiation across diverse learner groups. Within technology-enhanced learning research, usability represents a central determinant of system effectiveness. Jakob Nielsen’s framework—encompassing learnability, efficiency, error tolerance, memorability, and satisfaction—offers a robust basis for evaluating the user experience of e-learning tools and has been widely applied in international educational technology studies (
Sjaastad & Tømte, 2018;
Awang et al., 2024;
Du Plooy, 2024).
Despite the increasing prevalence of adaptive learning environments, empirical research specifically targeting number theory education remains limited. The majority of existing studies examine broad mathematics curricula rather than focusing on discrete domains characterised by conceptual complexity and cumulative reasoning. Furthermore, few investigations integrate multiple data sources—such as behavioural logfiles, needs assessments, and post-use evaluation surveys—to generate a comprehensive understanding of learner and teacher experiences within adaptive systems.
The present study addresses these gaps by conducting a mixed-methods evaluation of an adaptive e-learning environment designed for number theory instruction. The research integrates (1) student and teacher needs-assessment questionnaires, (2) large-scale logfile analytics comprising more than 825,000 recorded interactions, and (3) post-intervention usability and attitude assessments administered to both learners and educators. This methodological approach enables a multifaceted exploration of engagement patterns, usability perceptions, and the pedagogical descriptive framing of adaptive features across educational levels.
Building on the theoretical considerations of adaptive learning and the specific instructional challenges of number theory, this study seeks to investigate the effectiveness and usability of a newly developed adaptive e-learning environment. The following research questions guide the empirical analysis:
RQ1. How does the use of a newly developed adaptive learning environment influence students’ attitudes towards number theory topics?
RQ2. To what extent does the adaptive learning environment support students’ understanding of number theory problems and the effectiveness of problem solving through its content and methodological design?
RQ3. How do students and teachers evaluate their satisfaction with the adaptive learning system in terms of usability and instructional integration?
By synthesising behavioural analytics with self-reported measures, this study aims to advance understanding of how adaptive digital environments can support conceptual development, improve learner confidence and engagement, and provide teachers with actionable insights for differentiated instruction. The findings contribute to the international discourse on adaptive learning design and offer evidence-based implications for future developments in mathematics-focused educational technology.
2. Materials and Methods
In this study, learning-related outcomes were operationalised at two distinct levels: (1) perceived learning outcomes derived from post-use self-report questionnaires, and (2) objective behavioural indicators based on logfile-derived task success rates. These two outcome types were analysed and interpreted separately.
2.1. Research Design and Procedure
The study employed a mixed-methods research design conducted over an eleven-month period in authentic educational settings. The research procedure followed a clearly defined sequence of phases. In the first phase, the adaptive e-learning environment was introduced to participating secondary and early tertiary institutions. Mathematics teachers received a brief orientation on the instructional use of the system and integrated it into their regular number theory instruction. In the second phase, students used the adaptive learning environment during scheduled classroom and homework activities, completing number theory tasks assigned by their teachers. In the third phase, learner interaction data were continuously recorded through automated logfile collection throughout the entire implementation period. Finally, post-use questionnaires were administered to both students and teachers to collect data on usability, attitudes, satisfaction, and instructional integration. Qualitative feedback provided through open-ended questionnaire items complemented the quantitative data.
Methodological triangulation was employed by integrating multiple data sources and analytical approaches to examine the adaptive learning environment from complementary perspectives. Logfile analytics provided objective, longitudinal indicators of learner activity and task performance, questionnaire data offered quantitative measures of attitudes, usability, and satisfaction, and qualitative responses from open-ended items were used to contextualise and explain observed quantitative patterns. Triangulation was applied at the interpretation stage, where findings from these different sources were compared and combined to strengthen the validity of the conclusions. Specifically, trends identified in logfile-derived engagement and performance indicators were examined alongside questionnaire results, while qualitative feedback was analysed to explain discrepancies or reinforce convergent findings across data sources.
Within the design-based research cycle, iterative refinements were informed by both usage data and user feedback. Outcomes of the design cycle included the refinement of adaptive task sequencing rules, adjustments to feedback timing and granularity, and improvements to interface elements supporting learnability and error handling. These design outcomes were incorporated into subsequent system iterations and evaluated through logfile analytics and post-use questionnaires, ensuring that the final implementation reflected empirically informed design decisions rather than a fixed, one-off intervention.
2.2. Participants and Educational Context
The study involved 264 students and 52 mathematics teachers from secondary and early tertiary education contexts. Participants were recruited using a non-probability sampling approach based on institutional collaboration and voluntary participation within authentic educational settings.
Students used the adaptive system as part of their regular mathematics instruction, focusing on selected number theory topics aligned with the national curriculum, including divisibility, prime numbers, prime factorisation, and related problem-solving tasks.
Teachers determined how frequently the system was used within their instructional practice, while the adaptive mechanisms operated automatically within the system.
Although 264 students and 52 teachers initially participated in the study, not all collected data were included in the final analyses. Questionnaire responses with substantial missing data were excluded from the quantitative analyses. As a result, only participants who completed the relevant post-use questionnaires and generated sufficient logfile data were retained in the final analytic sample. Approximately 17% of the initially collected questionnaire responses were excluded due to incomplete data. These exclusions did not substantially affect the overall sample size or the distribution of participants across educational contexts, resulting in a final analytic sample that closely matched the initial participant pool in size and composition.
2.3. Setting and Context
The research was conducted in formal educational institutions where the adaptive system had been embedded into the mathematics curriculum. Students interacted with the platform during classroom activities and through autonomous study outside school hours. The platform was integrated into regular coursework and was also available for independent practice. The participating institutions provided stable technological infrastructure, while the online accessibility of the system enabled students to use it on personal devices, ensuring continuous learning opportunities in blended instructional contexts.
2.4. Interventions and Materials
The adaptive environment consisted of six modules aligned with fundamental number theory content, including the Euclidean algorithm, perfect numbers, prime numbers, square numbers, divisibility rules, and linear Diophantine equations. Each module offered theoretical explanations and diagnostic questions, followed by adaptively sequenced tasks organised across multiple difficulty levels. Personalised feedback and corrective hints were generated automatically, while progression pathways adjusted to learner performance. Gamified elements such as progress indicators and experience-point accumulation were incorporated to enhance engagement and sustain motivation throughout the learning process.
The system incorporated an experience-point (XP) accumulation mechanism combined with badge-based achievements as forms of individual progress feedback. Learners earned experience points and digital badges by completing tasks and reaching predefined milestones. The badge system was non-competitive in nature: no leaderboards, rankings, or peer-comparison features were implemented, and badges were visible only to individual learners. The primary function of the XP and badge mechanisms was to support self-monitoring of progress and sustained engagement rather than to introduce competitive gamification elements.
Adaptation in the learning environment was implemented through a set of predefined, rule-based decision mechanisms operating at the task and feedback levels. The adaptive logic relied on learners’ task performance, error frequency, and interaction history rather than on predictive machine-learning models. Task difficulty levels were determined during system design based on content complexity, number of required procedural steps, and conceptual prerequisites. For example, number theory tasks requiring single-step divisibility checks were classified as lower difficulty, while multi-step problems involving prime factorisation or greatest common divisors were assigned higher difficulty levels. Movement between difficulty levels was triggered by task success patterns. Learners who correctly solved a predefined proportion of tasks within a difficulty level progressed to more complex tasks, whereas repeated incorrect attempts resulted in redirection to tasks targeting prerequisite knowledge at a lower difficulty level.
Examples of adaptive rules included the following:
If a learner correctly solves multiple consecutive tasks at a given difficulty level, then subsequent tasks are selected from the next higher difficulty level.
If a learner repeatedly fails tasks involving the same concept (e.g., prime factorisation), then prerequisite tasks and explanatory content related to that concept are presented.
If task attempts exceed a predefined threshold without success, then additional hints or worked examples are provided.
Feedback was generated dynamically based on learner responses and error patterns. Rather than providing uniform, static feedback, the system adjusted feedback type and depth. Initial incorrect responses triggered brief hints, while repeated errors resulted in more detailed explanations or worked examples. Correct solutions were followed by confirmatory feedback reinforcing the applied strategy. In contrast to standard feedback, which typically provides identical responses to all learners, ersonalized feedback in the system was contingent on individual performance history, error frequency, and task progression, thereby supporting differentiated instructional support.
Personalisation was operationalised through individual learning paths, where task selection, difficulty progression, and feedback intensity were continuously adjusted based on each learner’s interaction data. As a result, learners following the same curricular topic could experience different sequences of tasks and feedback depending on their performance patterns.
2.5. Measures and Operational Definitions
Student attitudes were measured along the constructs of motivation, self-confidence, perceived difficulty, and engagement, using Likert-scale items consistent with established frameworks in mathematics education research, including constructivist learning theory, mastery-oriented instructional principles, and design-based research approaches. Teachers provided input through needs-assessment and usability questionnaires focusing on alignment with instructional objectives, perceived student benefit, and ease of classroom integration. Usability was assessed according to four operationalised dimensions based on Jakob Nielsen’s usability heuristics, including learnability, efficiency, error reduction, and user satisfaction (
Nielsen, 1994;
Nielsen & Molich, 1990). Memorability could not be evaluated due to the single-session nature of the post-intervention usability phase. Logfile indicators captured objective behavioural data, including the number of daily logins, the number of tasks completed per day, the success rate of task completion, the use of hints, and access patterns to learning materials. These operational variables collectively provided a multidimensional view of learner engagement.
2.6. Analysis Plan
Quantitative data were analysed using both descriptive and inferential statistical methods selected according to the scale of measurement and the research questions. Descriptive statistics (means, standard deviations, and frequencies) were used to summarise learner activity indicators, task success rates, and questionnaire responses.
Inferential analyses were applied to examine whether observed outcomes differed meaningfully from neutral reference values or exhibited systematic trends over time. Specifically, one-sample t-tests were conducted to compare post-use questionnaire mean scores against the midpoint of the Likert scale, which served as a neutral reference point for attitudes, motivation, and usability perceptions. This test was chosen because no pre-post comparison or control group was available, and the research focus was on evaluating whether post-use perceptions were significantly positive rather than on estimating change scores.
Longitudinal logfile data were analysed using time-based trend analyses to examine changes in learner activity (e.g., daily logins, tasks completed) and task success rates across the implementation period. These analyses were used to identify sustained patterns of engagement and performance rather than short-term fluctuations.
All statistical analyses were conducted using standard significance thresholds (p < 0.05), and confidence intervals were reported where appropriate to support interpretation of effect stability.
Although activity indicators were examined across different time periods, the analyses do not represent true pre-post comparisons at the individual level. The units of analysis differed across time windows, and therefore, inferential pre-post t-tests were not used to estimate individual-level change. Instead, login frequency and task completion were analysed as aggregated time-based indicators to examine overall trends in system use.
Given the number of statistical tests conducted, the potential inflation of the Type I error rate was considered. The analyses were primarily exploratory in nature, aiming to identify patterns across multiple outcome domains rather than to test a single confirmatory hypothesis. Therefore, results were interpreted with caution, with greater emphasis placed on effect direction, consistency across measures, and confidence intervals rather than on isolated p-values.
Pre-post comparisons were conducted using independent-samples t-tests comparing aggregated indicators from pre-implementation and post-implementation periods. The analyses did not involve repeated measurements of the same individuals; therefore, paired-samples tests were not applied. Negative t-values indicate higher mean values in the post-implementation period due to the direction of subtraction (pre minus post).
One-sample t-tests were conducted to examine whether post-use mean ratings differed from the neutral midpoint of the Likert scale. Given the large sample size and the descriptive purpose of these analyses, statistical significance was expected and should not be interpreted as evidence of large intervention effects. Accordingly, emphasis is placed on mean values and confidence intervals rather than on p-values alone.
For attitudinal and usability-related variables, no pre-test baseline measurements were available. Accordingly, one-sample t-tests were conducted solely to examine whether post-use mean ratings differed from the neutral midpoint of the Likert scale. These analyses do not assess pre-post improvement, but rather indicate the direction and magnitude of post-use perceptions.
Multiple regression analysis was conducted on the teacher sample to explore potential relationships between perceived usability dimensions and overall system evaluation. Given the limited sample size (N = 16), the analysis was intended to be exploratory, and results should be interpreted with caution due to limited statistical power and increased risk of overfitting.
Qualitative reflections from teachers and students were analysed thematically to provide explanatory context for the quantitative findings and to identify areas where the adaptive system supported or hindered learning. Logfile data were examined to describe engagement trajectories and persistence across the instructional period. Findings from all methodological strands were synthesised to address the overarching research questions regarding system usability, learner engagement, and instructional effectiveness.
2.7. Usability Evaluation Procedures
Participants evaluated the usability of the adaptive environment using a five-point Likert scale. Usability was operationalised using four of Nielsen’s heuristics—learnability, efficiency, error reduction, and satisfaction—each representing a core dimension of user experience in digital learning environments. These metrics served as the basis for analysing student and teacher perceptions of system usability and for modelling the relationship between usability factors and perceived instructional effectiveness.
Usability was assessed based on Jakob Nielsen’s usability framework. While the original framework comprises five dimensions (learnability, efficiency, memorability, errors, and satisfaction), the present study primarily operationalised usability using four dimensions: learnability, efficiency, error reduction, and user satisfaction. The memorability dimension was not included in the primary usability evaluation, as the study design did not involve repeated long-term interruptions in system use that would allow meaningful assessment of how easily users could re-establish proficiency after periods of non-use. However, selected memorability-related items were retained in the teacher questionnaire for exploratory purposes and were examined separately in regression analyses to explore potential associations with teachers’ overall system evaluations.
2.8. Logfile Dataset and Statistical Procedures
Logfile data were analysed for a total of 346 learners between 1 February 2024 and 10 January 2025. Across this period, the system recorded 825,442 events, including login actions, task completions, and access to instructional materials. The dataset was divided into a pre-study period (February–June 2024) and a post-test period (July 2024–January 2025). Three primary indicators were examined: the number of daily logins, the number of tasks completed per day, and the success rate of task completion. To assess changes between periods, two-sample t-tests were conducted for each indicator, while linear regression models were used to analyse temporal trends in system use. Statistical significance was set at α = 0.05. Data cleaning procedures—including the handling of missing values, the removal of duplicates, the treatment of outliers, the standardisation of variables where appropriate, the alignment of timestamps, and integrity checks—ensured that the dataset met the requirements for statistical analysis. All quantitative analyses were performed in SPSS (version 26), which was used for data structuring, transformation, and modelling.
2.9. Questionnaire Development
The questionnaires used in this study were developed specifically for the purposes of the present research and were informed by prior literature in mathematics education and educational technology.
The student and teacher questionnaires were designed by the research team to address the study’s research questions, with item content guided by established constructs in adaptive learning, learner engagement, usability, and digital pedagogy. While the instruments were not adopted verbatim from a single validated scale, several items were conceptually aligned with commonly used measures in the literature (e.g., motivation, perceived competence, usability dimensions). The questionnaires, therefore, represent theory-informed, context-specific instruments rather than standardised diagnostic tools.
Prior to large-scale deployment, the questionnaires were pilot tested with a small group of students and teachers to assess item clarity, wording, and completion time. Feedback from the pilot phase was used to refine item phrasing and to remove ambiguous or redundant questions. The pilot testing focused on usability and comprehensibility rather than on formal psychometric validation.
The instruments were not subjected to full-scale psychometric validation (e.g., confirmatory factor analysis) prior to use. As a result, findings derived from questionnaire data should be interpreted as exploratory and descriptive rather than as definitive measurements of latent constructs. Where internal consistency indicators were calculated, these are reported to provide an indication of reliability within the present sample.
The original questionnaires were developed in Hungarian. For reporting purposes and selected dissemination contexts, items were translated into English using a forward translation procedure by a bilingual member of the research team with expertise in mathematics education. To ensure conceptual equivalence, translated items were reviewed by an independent bilingual reviewer. No formal back-translation procedure was applied, and translated versions were used for reporting rather than for data collection.
Four online questionnaires were administered during the research. The needs-assessment instruments supported the initial design and development of the adaptive environment, while the outcome-focused attitude and usability questionnaires were used during the performance-evaluation phase. All instruments included both closed and open-ended items, were completed anonymously, and were analysed using SPSS 26.
Table 1 summarises the objectives, phases, sample sizes, and data-collection intervals associated with the questionnaire programme.
The study followed a design-based research approach spanning multiple years. An initial needs assessment phase was conducted between October and December 2020 (Q1 and Q2) to identify pedagogical challenges, learner needs, and usability expectations related to number theory instruction and digital learning environments. The findings from this early phase informed the conceptual design requirements of the adaptive learning environment.
Between 2021 and 2023, the system underwent iterative development and refinement cycles, including prototype implementation, internal testing, and gradual incorporation of adaptive rules and feedback mechanisms. The final, stable version of the system was deployed in 2024 and subjected to empirical evaluation. Post-use questionnaires (Q3 and Q4) were collected between October and December 2024, and logfile data were recorded between February 2024 and January 2025.
Accordingly, data collected in 2020 were not used to evaluate the effectiveness of the final system but served exclusively as formative input guiding system design decisions, whereas data collected in 2024–2025 were used for the empirical evaluation of the implemented adaptive environment.
The needs assessment data collected in 2020 were not combined with outcome data from 2024 to 2025 in statistical analyses.
Learner and teacher perceptions were assessed using post-use questionnaires comprising Likert-scale items. All items were rated on a five-point Likert scale ranging from 1 (“strongly disagree”) to 5 (“strongly agree”). Higher scores indicated more positive perceptions of the adaptive learning environment.
Learner motivation and attitudes were measured using items targeting interest, confidence, and perceived usefulness. Example items included: “I felt motivated to continue working with the system,” and “Using the system increased my confidence in solving number theory problems.”
Usability was assessed in alignment with Jakob Nielsen’s usability dimensions. Learnability was measured using items such as “I was able to learn how to use the system quickly,” while efficiency was assessed through items like “I could complete tasks efficiently using the system.” Error reduction was measured with items such as “The system helped me understand and correct my mistakes,” and user satisfaction was assessed using items including “Overall, I am satisfied with using the system.”
Teacher questionnaires included parallel usability items adapted to the instructional perspective, as well as exploratory memorability-related items such as “After a break, it was easy to resume effective use of the system.” These items were included for exploratory regression analyses rather than as part of the primary usability evaluation.
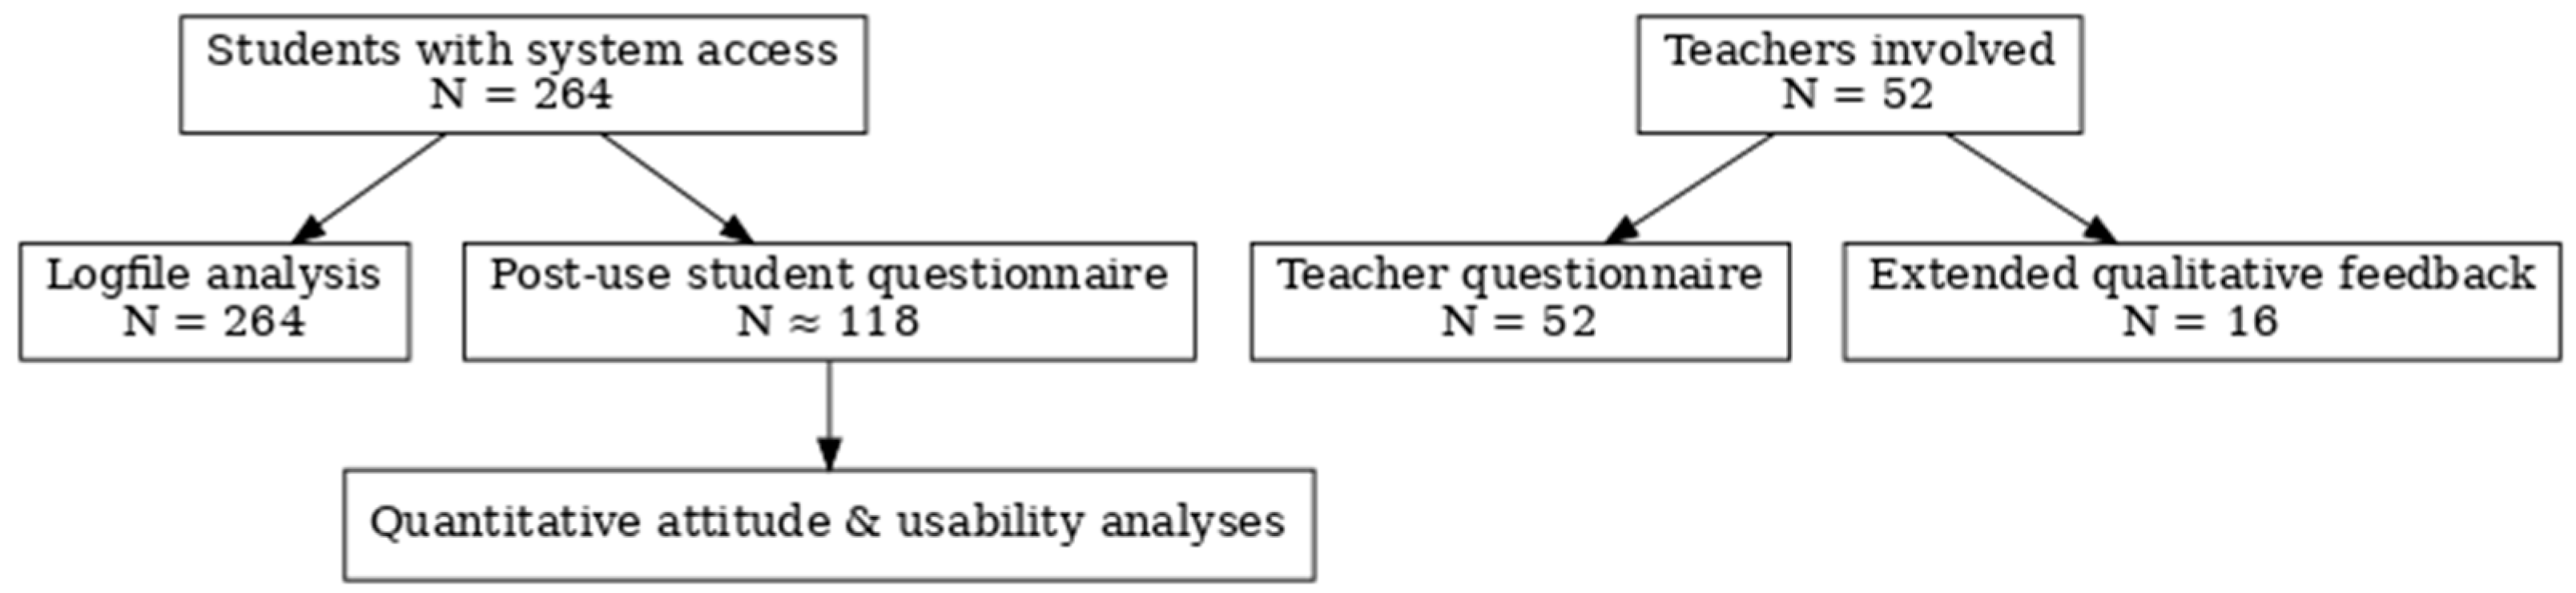
Figure 1 provides an overview of participant flow and analytic samples. Differences in sample sizes across analyses reflect the use of multiple data sources, including system logfiles, post-use questionnaires, and qualitative feedback. While logfile analyses included all students who accessed the system (N = 264), questionnaire-based analyses were conducted on subsets of participants who completed the relevant instruments.
2.10. Hypotheses
Given the absence of pre-test baseline measurements for several learner-related constructs, the hypotheses focus on post-use evaluations, observed associations, and system-level indicators rather than empirically measured improvement over time.
Hypotheses related to research question Q1:
H1: Students report motivation levels related to mathematics learning that are significantly above the neutral midpoint following the use of the new teaching tool.
H2: Students report positive levels of self-confidence in solving number theory problems following use of the learning tool.
H3: System usage data indicate increased learner activity during the post-implementation period compared to the pre-implementation period.
H7: Students report high levels of perceived independence in managing their learning activities within the adaptive environment.
Hypotheses related to research question Q2:
H4: Logfile-based task success indicators and post-use evaluations suggest effective problem-solving performance within the adaptive learning environment.
H5: Logfile data indicate lower error rates during system use compared to earlier usage periods.
H6: Students report positive evaluations of their time management during learning activities supported by the system.
Hypotheses related to research question Q3:
H8: According to Jakob Nielsen’s assessment of the five usability factors, the created adaptive e-learning system achieves an average score of at least 4 for each of the measured factors, from both the learner and student perspectives.
H9: The created adaptive e-learning system scores at least a four average on the Jakob Nielsen 5 usability factors for teachers and trainers for each of the measured factors.
H10: Feedback from teacher colleagues demonstrates the necessity of using an adaptive e-learning environment in the teaching process.
H11: The adaptive e-learning system will have significantly higher levels of student activity indicators after the study, indicating the effectiveness of the system.
2.11. Ethical Considerations
Formal approval from an institutional ethics committee was not required for this study under applicable national and institutional regulations. The research was conducted in an educational context using anonymised data, involved no experimental intervention beyond standard instructional practice, and did not include any minors, as all participants were adults at the time of data collection. Participation in the study and consent to the use of collected data for research purposes were voluntary. The study was conducted in accordance with institutional ethical guidelines and the principles of the Declaration of Helsinki.
3. Results
The analyses revealed converging patterns across four main data sources: the student and teacher needs-assessment questionnaires, the logfile analysis of the adaptive e-learning system, and the outcome-focused student and teacher attitude and usability surveys. Across these datasets, learners at different educational stages reported varying levels of difficulty with number-theoretic content, while both students and teachers expressed a strong demand for adaptive, personalised digital tools. Use of the implemented adaptive environment was associated with increased motivation, engagement, and positive usability evaluations. System usage data indicated higher levels of activity during later phases of the implementation period compared to earlier phases; however, these patterns should be interpreted as descriptive trends rather than causal effects. Group-level comparisons and regression analyses further indicated that digital tool usage and an emphasis on collaborative practices contributed positively to perceived lesson effectiveness and satisfaction with the system.
No objective pre-post performance tests were administered in this study. Learning-related outcomes were assessed through post-use self-report measures and logfile-based engagement indicators rather than direct measures of learning achievement.
The statistical analyses reported below were selected to address specific pedagogical questions related to learner engagement, perceived difficulty, and system usability. Inferential tests were used not to exhaustively compare all possible subgroups, but to explore theoretically motivated contrasts aligned with the research questions. Detailed descriptive statistics are provided in the corresponding tables to support transparency, while the narrative focuses on interpretable patterns and educationally meaningful differences. To ensure methodological transparency, the alignment between the research questions, outcome measures, and statistical analyses is explicitly presented in
Table 2.
Inferential analyses were selected to address theoretically and pedagogically motivated contrasts aligned with the research questions rather than to exhaustively test all possible subgroup comparisons.
The group-level differences reported in this section should be interpreted with caution. Observed variations across grade levels, educational contexts, or learner subgroups may reflect differences in curricular content, instructional sequencing, or assessment expectations rather than differences in perceived difficulty or system descriptive framing alone. Accordingly, inferential results are reported as contextual patterns rather than as direct indicators of underlying cognitive difficulty or causal effects.
Pre-post differences were estimated using mean differences and 95% confidence intervals. Inferential interpretation is therefore limited to interval-based estimates rather than full test statistics.
Post-use ratings were consistently above the neutral scale midpoint, indicating generally positive learner perceptions of the adaptive system. These results reflect favourable evaluations rather than measured improvements relative to a pre-intervention baseline.
In interpreting statistical results, emphasis is placed on the magnitude and educational relevance of observed effects rather than on statistical significance alone. Correlations and group differences are discussed only where they contribute to understanding instructional design or learner engagement.
3.1. Student Needs Assessment for Adaptive Number Theory Learning
The student needs assessment examined secondary and early tertiary learners’ expectations regarding an adaptive electronic learning environment for number theory. The questionnaire was completed by 12th- and 13th-grade high school students and first-year university students (N = 118, stratified probability sampling). The sample comprised 57.6% male and 42.4% female respondents. With respect to grade level, 44.9% were 12th graders, 20.3% were 13th graders, and 34.8% were university students. Their most recent semester or year-end mathematics grades were distributed across the full grading spectrum. Details regarding the composition of the student sample and the institutional context are presented in
Table 3.
Learning habits pointed to the predominance of individual preparation: 65.3% of respondents reported preparing for mathematics classes by studying individually, 25.4% preferred group learning, and 10.2% did not use group learning at all. A total of 70.3% indicated that they used digital devices for learning, suggesting substantial openness to electronic forms of study, while 39.8% still reported regular use of printed textbooks, underscoring the continued relevance of traditional materials alongside digital resources. The frequency of online resource use, measured on a five-point Likert scale (1 = not at all, 5 = very often), showed that 55.1% of students reported frequent use (ratings of 4 or 5), whereas 20.3% reported rare use (ratings of 1 or 2). Perceived usefulness of group learning followed a similar distribution: 60.2% regarded group learning as very useful (4 or 5), while 15.3% considered it not useful (1 or 2).
Use of digital teaching materials in mathematics was already widespread: 75.4% of students had used such resources, while 24.6% had not. Within this domain, several features emerged as particularly valued. Visual explanations were perceived as useful by 79.7% of respondents; personalised feedback was considered important by 70.3%; interactive tasks were regarded as useful by 65.3%; and video-based instructional materials were judged important by 60.2%. The importance of personalised learning materials, measured on a five-point scale, was rated as high (4 or 5) by 75.4% of respondents, while only 10.2% considered them unimportant (1 or 2). Visual explanations were rated as very important by 84.7% of students, highlighting the central role of visual representations in supporting understanding.
With regard to learning challenges, 54.2% of respondents identified problem solving as the greatest difficulty in number theory, 28.8% reported conceptual learning as difficult, and 16.9% regarded memorisation of formulas as particularly challenging. When asked to indicate the most difficult areas of number theory, 39.8% selected linear Diophantine equations, 25.4% identified the Euclidean algorithm, 20.3% reported prime numbers, 10.2% pointed to perfect numbers, and 4.3% selected square numbers and divisibility rules. These distributions delineate a clear profile of where students most urgently require targeted support. Feedback-related items underscored the importance of formative assessment and individualised guidance: regular feedback was rated as very important (4 or 5) by 79.7% of respondents, while 10.2% considered it unimportant (1 or 2), and personalised feedback was deemed very important by 84.7%, suggesting that learners place particular value on tailored information about their performance and progress.
Inferential analyses further clarified these relationships. A chi-square test was conducted to examine the association between the use of digital teaching materials (yes/no) and the perceived importance of personalised teaching materials (five-point Likert scale). This test yielded a nominally significant association (χ2(4, N = 118) = 12.56, p = 0.028). However, this result does not survive correction for multiple comparisons and should therefore be interpreted as exploratory rather than confirmatory. To explore differences in perceived difficulties with number theory across educational levels, a one-way analysis of variance (ANOVA) compared 12th-grade students, 13th graders, and university students. The analysis produced F(2, 115) = 8.34, p < 0.001, indicating a significant effect of educational level. Tukey post hoc tests showed significant differences between all pairs of groups (12th vs. 13th grade, p = 0.012; 12th grade vs. university, p = 0.0001; 13th grade vs. university, p = 0.023). University students reported significantly greater difficulties than both 12th and 13th graders, and 13th graders reported more difficulties than 12th graders. An independent-samples t-test comparing women and men on perceived number theory difficulty yielded t(116) = 1.23, p = 0.221, indicating no significant gender difference in this respect. Women reported a slightly higher mean perceived difficulty (M = 3.42, SD = 0.81) than men (M = 3.26, SD = 0.79), although this difference was not statistically significant.
Gender-related differences did emerge in learning preferences. Because the variables did not meet normality assumptions, Mann–Whitney U tests were applied. A significant difference was found for group learning preferences, U = 1456.5, Z = −1.85, p = 0.032, n1 = 68, n2 = 50, revealing that women more frequently preferred group learning. By contrast, no significant gender difference was observed in the use of digital devices, U = 1623.0, Z = −1.22, p = 0.112, suggesting broadly similar levels of access to and usage of digital tools.
Reliability and validity analyses supported the measurement quality of the student needs questionnaire. Cronbach’s alpha for the overall instrument was 0.87, indicating good internal consistency. Principal component analysis with varimax rotation was conducted to explore the instrument’s factor structure. Using the Kaiser criterion (eigenvalues > 1) and scree-plot inspection, three factors were retained. A learning preferences factor aggregated items related to learning methods and attitudes toward group learning, with factor loadings ranging from 0.65 to 0.82. A digital learning materials factor comprised items on prior use of digital resources and desired platform features, with loadings between 0.70 and 0.85. A number theory difficulties factor grouped items related to perceived challenges and problem areas, with loadings between 0.68 and 0.80. Interfactor correlations remained generally below 0.30, indicating that the three constructs are empirically distinct.
3.2. Teacher Needs Assessment
The teacher needs assessment aimed to map mathematics teachers’ requirements for adaptive e-learning systems and to describe current practices regarding digital tool use. The sample included secondary and university mathematics teachers (N = 52, stratified probability sampling). The participants’ gender distribution was 53.8% male (n = 28), 42.3% female (n = 22), and 3.8% preferring not to state their gender (n = 2). In terms of institutional setting, 61.5% taught in secondary schools (n = 32), 23.1% in vocational secondary schools (n = 12), and 15.4% in universities (n = 8). The mean number of years teaching mathematics was 14.2 (SD = 8.5), indicating a broad range of professional experience.
Perceptions of pedagogical practices reflected a combination of traditional and innovative methods. The importance of group work was rated at M = 4.1 (SD = 0.8) on a five-point scale (1 = not important at all, 5 = very important). Textbook use remained relatively frequent, with a mean of 3.6 (SD = 1.2). Digital tools were used by 57.7% of teachers (n = 30), while 42.3% (n = 22) reported not using such tools routinely. Among digital tool users, the most prevalent resources were digital teaching materials (73.3%, n = 22) and communication platforms (60%, n = 18). The perceived effectiveness of digital teaching materials yielded a mean of 3.8 (SD = 1.1), indicating moderate satisfaction.
Table 4 summarizes the results of the teacher needs assessment related to adaptive digital instruction, based on responses from N = 52 teachers.
The teacher usability evaluation results of the adaptive learning system are summarized in
Table 5, based on a sample of N = 16 teachers.
Teachers rated the importance of adaptive systems at M = 4.3 (SD = 0.9), signalling a strong perceived need for adaptivity. The most sought-after features of an adaptive platform included personalised learning materials (80.8%, n = 42), automatic assessment (73.1%, n = 38), learning statistics (67.3%, n = 35), visualised data (57.7%, n = 30), and individual progress reports (53.8%, n = 28). Respondents frequently emphasised that such systems could increase lesson efficiency, support differentiated instruction, and help maintain student motivation. At the same time, several obstacles to effective digital tool use were identified. Technical problems were reported by 83.3% of respondents (n = 25), poor quality of existing teaching materials by 60% (n = 18), and students’ lack of digital skills by 50% (n = 15). The most prominent challenges in teaching number theory included maintaining motivation (76.9%, n = 40), implementing differentiation (67.3%, n = 35), fostering logical thinking (57.7%, n = 30), and developing problem-solving skills (53.8%, n = 28).
Inferential analyses underlined the influence of teacher characteristics. A chi-square test examining the relationship between digital tool use and age groups yielded χ2(3, N = 52) = 12.34, p = 0.002, indicating that younger teachers (23–40 years) used digital tools more frequently than older colleagues (41+ years). A further chi-square test relating digital tool use to school type produced χ2(2, N = 52) = 9.87, p = 0.02, showing that university lecturers used digital tools significantly more often than secondary and vocational teachers. Pearson’s correlation between the importance attributed to group work and time spent preparing lessons was strongly positive, r = 0.82, N = 52, p < 0.001. This association should be interpreted cautiously, as both variables reflect closely related aspects of instructional engagement and may partly capture overlapping constructs rather than independent dimensions. An independent-samples t-test comparing evaluations of the effectiveness of digital teaching tools between younger (23–40 years) and older (41+ years) teachers yielded t(50) = 2.87, p = 0.006. Younger teachers rated digital tools more positively (M = 4.1, SD = 0.9) than older colleagues (M = 3.5, SD = 1.2). A one-way ANOVA examining differences between age groups in the perceived importance of adaptive systems produced F(3, 48) = 4.56, p = 0.008; Tukey post hoc tests showed that teachers aged 23–30 (M = 4.5, SD = 0.7) rated adaptive systems as significantly more important than teachers over 50 (M = 3.8, SD = 1.0).
Multiple regression analysis assessed how digital tool use and the importance of group work jointly predicted perceived lesson effectiveness. The standardised regression coefficient for digital tool use was β = 0.35,
p = 0.01, and for the importance of group work it was β = 0.28,
p = 0.03. The coefficient of determination was R
2 = 0.42, indicating that these two predictors together accounted for 42% of the variance in perceived lesson effectiveness. F statistics and confidence intervals were not reported. To examine predictors of perceived lesson effectiveness, a regression model was estimated; the results are presented in
Table 6.
Measurement quality was supported by Cronbach’s alpha of 0.83 for the overall teacher needs questionnaire, with scale-level alphas between 0.76 and 0.84. Shapiro–Wilk tests for the importance of group work, perceived effectiveness of digital materials, and importance of adaptive systems yielded p-values of 0.12, 0.08, and 0.10, respectively, all above 0.05, suggesting approximate normality. Levene’s tests indicated homogeneous variances across age and school-type groups (p = 0.31 and p = 0.42), justifying the use of parametric tests.
3.3. System Use and Logfile Indicators
Logfile analysis examined objective indicators of engagement with the adaptive learning environment across the pre-study and post-test periods. For daily logins, the mean increased from 120.5 in the pre-study interval to 145.3 in the post-test interval, with
p = 0.015 and a confidence interval for the change of [15.64, 30.12]. The mean number of tasks completed per day increased from 85.7 to 102.4,
p = 0.034, with a confidence interval of [10.35, 22.45]. Task success rates rose from 78% to 82%,
p = 0.041, with a confidence interval of [2%, 8%] (i.e., −0.08 to −0.02 on the proportional scale). Independent-samples
t-tests comparing pre-implementation and post-implementation periods indicated higher mean values in the post-implementation period. To examine changes in logfile indicators over time, a pre–post comparison was conducted; the results are summarized in
Table 7.
To examine overall trends in platform usage, a linear regression was conducted on aggregated daily activity data. The dependent variable (y) represented the mean number of recorded system interactions per day across all active learners, while the independent variable (x) represented time measured in days since system deployment. The analysis yielded the equation y = 0.45x + 120.12, with R2 = 0.78 and p = 0.001 for the slope, indicating a strong and statistically significant positive trend in average daily activity over time. The positive slope reflects steady growth in user activity, while the high R2 suggests that 78% of the variance in activity is explained by time. Together, the pre-post comparisons and the trend analysis provide robust evidence that the adaptive system contributed to sustained and increasing engagement, thereby confirming hypothesis H11 regarding activity indicators.
3.4. Student Attitudes, Learning Outcomes, and Usability
The student outcome and usability survey focused on learners who had used the adaptive environment as a performance support tool. Responses from 264 students were analysed to assess changes in motivation, self-confidence, problem-solving skills, error rates, time management, independent learning, overall activity, and usability. The age distribution was 33.4% aged 18 (n = 88), 34.8% aged 19 (n = 92), and 31.8% aged 20 (n = 84). In terms of institutional type, 45.5% attended high school (n = 120), 27.3% vocational high school (n = 72), and 27.3% university (n = 72); by grade level, 45.5% were 12th graders, 27.3% 13th graders, and 27.3% first-year university students.
Usability was evaluated on a five-point Likert scale according to Jakob Nielsen’s factors. One-sample
t-tests showed that mean ratings for all usability factors were significantly higher than the neutral midpoint of 3 (
p < 0.001 in all cases), indicating consistently positive evaluations of learnability, efficiency, error handling, and satisfaction. The descriptive framing of the adaptive system on attitudinal and performance-related constructs is summarised in
Table 2. Mean ratings ranged between 4.10 and 4.25, with standard deviations between 0.76 and 0.82, and all one-sample
t-tests indicated that post-use mean ratings were above the neutral scale midpoint (
p < 0.001). These results reflect consistently positive evaluations rather than evidence of uniformly large effects. These results support hypotheses H1–H7, according to which the new teaching tool improves students’ interest in mathematics, self-confidence, problem-solving skills, error rate, time management, independent learning, and activity. To contextualize student-reported experiences, a descriptive framing of the adaptive learning system in relation to motivation, confidence, and learning skills is provided in
Table 8.
Qualitative analyses of open-ended responses corroborated these findings. Immediate feedback was cited by 65% of students (n = 172) as a key motivator, allowing rapid correction of mistakes. Interactive tasks were mentioned positively by 50% (n = 132) as making learning more enjoyable, and level-based tasks were highlighted by 40% (n = 106) as facilitating gradual progression and boosting confidence. Willingness to recommend the system was high: 85% of students (n = 224) indicated that they would recommend it to peers. The mean rating for the recommendation item was 4.30 (SD = 0.72), and a one-sample t-test yielded t(264) = 18.23, p < 0.001, confirming that willingness to recommend was significantly above neutrality. Pearson’s correlation between motivation and willingness to recommend was r = 0.72, p < 0.001, indicating a strong positive relationship. A chi-square test indicated a significant association between self-reported motivation levels and system usage intensity (χ2(1) = 45.67, p < 0.001). This association should be interpreted descriptively, reflecting consistency between engagement behaviour and motivational self-reports, rather than as evidence of a causal effect of system use on motivation.
Accordingly, usability results are reported for the four Nielsen dimensions that were operationalised and measured within the scope of the present study. To document the psychometric properties of the instruments, descriptive statistics and reliability indices for the questionnaire scales are reported in
Table 9.
Student post-use attitudes indicated positive changes across motivation, confidence, problem solving, error reduction, time management, independent learning, and overall activity. Cronbach’s α for student instruments was 0.87. Teacher needs and usability instruments showed good to excellent internal consistency, with overall α = 0.83 for needs and α > 0.82 for usability factors; in a subset, usability α reached 0.92. Reliability analyses thus indicated that the questionnaires were psychometrically robust. Cronbach’s alpha exceeded 0.80 for all scales, and item-level analyses showed that Pearson correlations between items within scales were above 0.70, with item-total correlations also exceeding 0.70, supporting strong internal coherence.
3.5. Teacher Evaluations of Usability and Instructional Descriptive Framing
The teacher outcome and usability survey examined how the adaptive environment functioned in classroom practice from the teacher perspective. Responses from 16 teachers were analysed. Age distribution was 23–30 years (25%, n = 4), 31–40 years (37.5%, n = 6), 41–50 years (25%, n = 4), and over 50 years (12.5%, n = 2). Regarding gender, 62.5% were male (n = 10), 31.25% female (n = 5), and 6.25% preferred not to disclose (n = 1). In terms of school type, 50% taught in high schools (n = 8), 31.25% in vocational high schools (n = 5), and 18.75% in universities (n = 3).
Usability, again evaluated according to Jakob Nielsen’s factors, showed Cronbach’s alpha values above 0.82 for all dimensions, indicating reliable measurement. The Error Handling factor had slightly lower means and a somewhat lower alpha, though still in the good range, suggesting potential for improvement in this area. Overall, the results support hypothesis H9, which states that the system achieves an average score of at least 4 for all usability factors. Teachers rated the descriptive framing of the system on student motivation at M = 4.2 (on a scale from 1 to 5), indicating a substantial perceived positive effect. Responses regarding student performance highlighted improved arithmetic performance and greater independence in learning. The ease of integrating the system into teaching practice received a mean rating of 4.3, suggesting that incorporation into existing lesson structures was not perceived as burdensome and supporting hypothesis H10 concerning the pedagogical necessity and feasibility of integration.
Correlation analyses among usability factors revealed a strong positive relationship between learnability and satisfaction (r = 0.78, p < 0.01), as well as between efficiency and memorability (r = 0.68, p < 0.01). Error handling correlated positively but somewhat more weakly with the other factors (r = 0.55–0.62, p < 0.05). A multiple regression analysis examined the extent to which usability factors predicted overall teacher satisfaction. The model explained 72% of the variance in satisfaction (R2 = 0.72). Learnability emerged as the strongest predictor (β = 0.45, p < 0.01), followed by memorability (β = 0.32, p < 0.05). The effects of efficiency and error handling were smaller and not statistically significant (β = 0.18 and β = 0.15, p > 0.05), indicating that ease of learning and ease of later reuse play particularly central roles in shaping teacher satisfaction. Questionnaire responses were normally distributed (p > 0.05) and variances were homogeneous across relevant subgroups (p > 0.05), further supporting the exploratory nature of the analyses.
Given the small teacher sample size (N = 16), the regression analysis should be interpreted as exploratory. The results indicate tentative associations between usability dimensions and overall system evaluation rather than exploratory or generalisable effects.
3.6. Factor-Analytic Summary
Exploratory factor analysis (PCA with varimax; Kaiser rule, eigenvalue > 1; scree-plot inspection) supported a three-factor structure distinguishing learning preferences, digital learning materials, and number theory difficulties. Primary loadings ranged 0.65–0.82 (preferences), 0.70–0.85 (digital materials), and 0.68–0.80 (difficulties), with low inter-factor correlations (generally < 0.30). Item-level loading matrices, KMO, Bartlett’s test, and explained variance proportions were not reported. The results of the factor analysis are summarized in
Table 10.
3.7. Integrated Summary
Across student and teacher datasets, several key patterns emerge. Educational level is strongly associated with perceived difficulty in number theory; gender does not affect perceived difficulty but does influence collaborative preferences; and teacher age and institutional context are related to the adoption and positive evaluation of digital tools and adaptive systems. Digital tool use and emphasis on group work jointly predict perceived lesson effectiveness, and logfile indicators document a marked and sustained increase in learner activity and task success following implementation of the adaptive environment. Student and teacher evaluations alike point to substantial gains in motivation, confidence, problem solving, and perceived usability. Collectively, these findings depict a coherent interaction between demographic characteristics, pedagogical orientations, and engagement with the adaptive environment, forming a solid empirical foundation for the subsequent Discussion.
Accordingly, the trend is interpreted as a system-level usage pattern rather than direct evidence of intervention-induced engagement growth.
4. Discussion
This study suggests that adaptive e-learning environments are associated with positive student motivation and engagement patterns. These findings should be interpreted cautiously, as the study did not include a control group or pre-post performance-based measures. Features such as adaptive sequencing, real-time feedback, and gamification appear to support both cognitive development and sustained involvement. Usability evaluations suggest that the system is technically robust and appropriate for diverse educational contexts. Overall, the findings contribute to growing evidence supporting the use of adaptive technologies in mathematics education and underscore the importance of ongoing research and refinement of such systems.
The present study did not include objective pre- and post-performance assessments of learning outcomes. Accordingly, references to learning-related effects in this discussion should be interpreted as reflecting post-use engagement patterns, self-reported perceptions, and system-level activity indicators rather than demonstrable improvements in learning achievement. Claims regarding learning improvement are therefore avoided, and the findings are discussed in terms of perceived learning support and engagement within the adaptive environment.
The unusually high correlation observed between the importance attributed to group work and preparation time likely reflects conceptual proximity between these constructs. In instructional contexts where collaborative activities are emphasised, increased preparation time may be perceived as a necessary prerequisite for effective group interaction. At the same time, such high correlations may indicate partial construct overlap or shared method variance, suggesting that these variables should not be interpreted as fully independent predictors.
A critical distinction must be made between perceived learning outcomes and objectively measured performance indicators. While students reported high levels of perceived improvement in problem-solving skills, such self-evaluations do not provide direct evidence of cognitive learning gains. Logfile-based task success rates offer behavioural evidence of performance within the system, but cannot substitute for standardised pre-post performance assessments. Conclusions are therefore limited to perceived learning support and observed task performance rather than verified learning achievement.
Logfile analyses revealed a strong positive linear trend in aggregated daily system activity over time (R2 = 0.78). This trend reflects increasing system usage during the observation period but does not, in itself, establish a causal effect of the adaptive system on behavioural engagement.
4.1. Synthesis of Main Findings
The present study sought to examine the pedagogical value, usability, and behavioural effects of an adaptive e-learning environment designed for number theory across secondary and early tertiary levels. The findings obtained from student and teacher needs-assessment questionnaires, extensive logfile analytics encompassing more than 825,000 recorded events, and post-intervention usability and attitude surveys provide converging evidence that the adaptive environment supported meaningful improvements in learner engagement, motivation, and perceived learning effectiveness. The results indicate positive learner perceptions and engagement patterns associated with the use of the adaptive system. The adaptive environment was associated with favourable post-use evaluations related to learning processes in number theory.
Results from the student needs assessment demonstrated a substantial demand for personalised and visually supported digital learning tools. Students consistently highlighted difficulties in core areas of number theory—particularly problem solving, conceptual understanding, and specific topics such as linear Diophantine equations and the Euclidean algorithm—indicating that the domain poses substantial cognitive challenges. The clear preference for visual explanations, personalised feedback, interactive tasks, and adaptive progression underscores the alignment between student expectations and the design principles of the implemented adaptive system. Inferential analyses revealed that students with prior experience using digital learning materials placed greater emphasis on personalisation, suggesting that familiarity with digital pedagogy fosters expectations for advanced, learner-centred support.
The teacher needs assessment findings reinforced and complemented the student perspective, revealing that mathematics teachers likewise prioritise personalised learning pathways, automatic assessment mechanisms, learning analytics, visualised data, and progress monitoring. Younger teachers and university instructors exhibited higher levels of digital tool adoption and more positive evaluations of their effectiveness, indicating generational and institutional distinctions in readiness to employ adaptive systems. Notably, challenges such as technical limitations and heterogeneous student digital skills emerged as structural obstacles, highlighting the necessity for accessible, well-designed digital pedagogical environments.
Logfile analyses provided objective behavioural evidence that engagement increased significantly following the implementation of the adaptive environment. Daily logins, tasks completed per day, and task success rates all rose significantly between the pre-study and post-test periods. The strong linear trend across the eleven-month interval suggests that system use not only increased but did so consistently, reflecting sustained rather than transient motivational effects. Behavioural engagement indicators derived from logfile data showed higher levels of activity during system use.
Outcome evaluations further demonstrated the system’s descriptive framing on motivation, self-confidence, problem-solving abilities, time management, independent learning, and activity levels, with all constructs showing significant improvements. Usability ratings were consistently above the neutral midpoint for both students and teachers, confirming that the system’s interaction design, feedback mechanisms, and adaptive progression were accessible and effective. Teacher evaluations indicated that the system contributed to increased student motivation and greater independence in mathematical tasks while being relatively easy to integrate into existing instructional practices. Regression analyses highlighted that learnability and memorability were particularly strong predictors of overall teacher satisfaction.
Overall, the synthesis of results across all data sources presents a coherent picture: the adaptive environment addressed documented learner needs, aligned with teacher expectations, demonstrated strong usability, and the results indicated positive post-use engagement patterns and favourable self-reported learning-related perceptions.
4.2. Comparison with International Literature
International research on adaptive learning in mathematics education has increasingly emphasised the role of domain-specific adaptivity, particularly in mathematically cumulative and conceptually demanding areas. Prior studies have shown that adaptive task sequencing, prerequisite-based progression, and immediate feedback are especially relevant in mathematics, where conceptual dependencies strongly influence problem-solving success. Within the literature, adaptive systems have been applied primarily to algebraic reasoning, arithmetic fluency, and mathematical problem solving, while fewer studies have addressed more abstract domains such as number theory. Despite growing international interest in adaptive learning for mathematics, relatively few studies have examined adaptive approaches in number theory, a domain characterised by high levels of abstraction and cumulative conceptual structure. The present study addresses this gap by focusing on adaptive learning mechanisms tailored to number-theoretic problem solving.
These findings align with international research demonstrating that adaptive digital systems can enhance motivational and cognitive outcomes in mathematics education (
Wong & Wong, 2021). Prior studies highlight the importance of scaffolding and dynamic task sequencing—elements reflected in the positive evaluations of the present environment (
Bang et al., 2023). The system supports engagement and positive learning-related perceptions, although no direct measures of learning achievement were assessed.
Consistent with research emphasising the role of feedback immediacy in digital learning environments, students in the present study explicitly identified immediate feedback as a primary source of increased motivation. This supports international findings that real-time adaptive feedback reduces uncertainty, supports error correction, and enhances learners’ sense of progress. Similarly, the strong preference for visual explanations reflects global trends showing that multimodal representations improve comprehension and retention in mathematics, particularly for abstract constructs.
The observed generational differences In teacher digital tool adoption mirror international patterns indicating that younger educators tend to integrate technology more readily and perceive greater instructional value in digital environments. Likewise, the barriers identified—technical limitations, inconsistent digital skills, and insufficiently developed digital instructional materials—echo worldwide findings that successful integration requires both infrastructural and pedagogical support.
Logfile analyses in adaptive learning research frequently show that sustained engagement depends on user experience quality, task availability, and reward structures. The significant increases in daily logins, task completions, and success rates observed here corroborate these global trends, demonstrating that well-designed adaptivity fosters long-term behavioural engagement rather than short-lived interaction spikes.
Finally, consistent with international studies demonstrating the strong predictive value of usability factors for user satisfaction and learning outcomes, teacher regression analyses in this study revealed that learnability and memorability explained substantial variance in satisfaction. This aligns with research emphasising that ease of initial learning and ease of returning to the system are pivotal for technology acceptance in educational contexts. Students reported positive perceptions related to learning processes; however, no objective performance-based learning outcomes were assessed.
4.3. Practical Implications
These implications are derived from post-use perceptions and behavioural usage indicators and are therefore presented as practice-oriented interpretations rather than evidence of causal learning improvement. As the study did not include objective pre-post performance tests or a control group, the implications below are framed as context-specific and indicative rather than causal.
First, the reported student demand for personalisation, visual explanations, and adaptive feedback suggests that digital mathematics environments may benefit from incorporating these elements as core design features. In this study, topics associated with higher perceived difficulty—particularly those requiring abstract reasoning or algorithmic thinking in number theory—highlight the potential value of adaptive scaffolds that provide stepwise guidance, conceptual explanations, and targeted remediation. These points are grounded in learners’ post-use evaluations and should therefore be interpreted as perceived needs and preferences rather than verified learning gains.
Second, teacher responses indicate that professional development may need to prioritise capacity building in digital pedagogy, particularly for educators reporting lower confidence and more cautious attitudes toward digital tools. Support programmes could include training in interpreting adaptive system outputs, using learning analytics to inform instruction, and strategies for integrating adaptive modules into classroom practice. Given the small teacher subsample used for some analyses, these implications are offered as preliminary and require confirmation in larger teacher samples.
Third, logfile analysis showed an increasing trend in aggregated system usage over the observation period, suggesting sustained engagement with the platform at the system level. However, because calendar-related factors (e.g., assessment deadlines and examination periods) were not controlled, this usage increase cannot be attributed unambiguously to the adaptive features of the system. Accordingly, the pattern is interpreted as a promising usage dynamic that may complement traditional instruction by supporting opportunities for independent practice and continued engagement, contingent on local curricular and scheduling contexts.
Fourth, strong associations were observed between motivational ratings and learners’ willingness to recommend the system. This relationship indicates alignment between positive affective perceptions and acceptance of the platform, but it does not demonstrate motivational improvement over the baseline. While mathematical identity was not measured, the consistently positive post-use perceptions suggest a plausible link to broader constructs related to mathematical self-concept. Future research incorporating validated measures of mathematical identity and longitudinal designs would be required to evaluate this possibility explicitly.
Finally, usability evaluations point to the importance of intuitive interfaces, transparent progression mechanisms, efficient navigation, and error-tolerant design. Where memorability-related items were examined, they were treated as exploratory rather than part of the primary usability construct. Taken together, these results support continued attention to onboarding, consistent design logic, and accessible support features; nevertheless, claims of robustness or generalisability should be avoided given the study’s design limitations.
4.4. Limitations
The study is subject to several limitations that must be acknowledged when interpreting its findings. First, the scope of the sample was restricted, as the number of participating students and teachers was not representative of the broader Hungarian secondary and higher education population. Recruitment occurred primarily within a limited set of institutions, which constrains the generalisability of the results to the national context. Furthermore, the use of a non-probability sampling approach combined with voluntary participation may have introduced self-selection bias, as participants could have been more open to or positively inclined toward digital learning environments than the broader student and teacher population.
Second, the temporal frame of the research limited the extent to which long-term effects could be examined. Although development and testing of the adaptive e-learning system required a prolonged implementation period, the evaluation phases captured primarily short-term changes in motivation, problem-solving skills, and engagement. Consequently, the sustainability of the observed improvements, as well as the durability of behavioural and attitudinal changes, could not be assessed.
Third, while student and teacher feedback were essential for iterative system refinement, the subjective nature of these responses may have introduced bias. Students may have moderated their evaluations due to the testing environment or perceived expectations, whereas teachers’ assessments may have been influenced by their own digital competencies or pre-existing attitudes toward educational technology. Such factors may have shaped their perceptions of system usability and pedagogical value.
While the experience-point mechanism may have contributed to learner engagement by providing progress-related feedback, the absence of competitive elements such as leaderboards or badges limits its potential confounding effect on motivational outcomes. Nevertheless, the study does not allow for isolating the specific descriptive framing of the XP mechanism from other adaptive features of the system.
The exclusion of the memorability dimension represents a limitation, as usability was evaluated without explicitly examining users’ ability to re-establish proficiency after extended periods of non-use.
Interpretation of time-based activity patterns is subject to important limitations. Differences in login frequency across time periods may be confounded by semester-related factors such as assessment schedules, holidays, or workload fluctuations. As the study did not control for these contextual variables and did not track identical participants across defined pre-post intervals, activity trends should be interpreted descriptively rather than as evidence of causal impact.
The use of multiple statistical tests introduces an increased risk of Type I error. Although this study adopted an exploratory analytic approach, findings based on nominal significance levels should be interpreted cautiously and verified in future studies employing confirmatory designs and appropriate correction procedures.
Because system usage intensity and motivational self-reports are conceptually related, associations between these variables may be tautological. Therefore, the observed relationship should not be interpreted as indicating that increased system use caused higher motivation, but rather as descriptive alignment between behavioural engagement and self-perceived motivation.
Given the number of statistical tests conducted, results with p-values close to the nominal significance threshold should be interpreted cautiously, particularly where they do not remain significant under correction for multiple comparisons.
Several observed differences across learner groups may be confounded by curricular and contextual factors, including topic selection, depth of coverage, and grade-specific instructional goals. As a result, such differences should not be interpreted as reflecting pure variations in perceived difficulty or learning effectiveness. Future studies employing curriculum-aligned or longitudinal designs would be required to disentangle instructional context from learner perception.
Because the one-sample t-tests compared post-use ratings against a neutral scale midpoint, uniformly low p-values are partly attributable to the large sample size and the choice of reference value. These analyses should therefore be interpreted as descriptive indicators of overall evaluation tendencies rather than as evidence of strong causal effects of the intervention.
Because attitudinal and usability measures were collected only after system use, the present findings cannot be interpreted as evidence of improvement over baseline levels. Instead, they reflect post-use perceptions relative to a neutral reference point. Future studies employing pre-post designs would be required to assess changes in motivation or attitudes attributable to system use.
The small teacher sample size substantially limits statistical power and generalisability of the regression findings. As a result, claims regarding robustness or predictive strength are not warranted. The reported associations should be regarded as preliminary and hypothesis-generating, requiring validation in larger teacher samples.
Because the study did not include objective pre- and post-performance assessments, claims regarding learning improvement or gains in achievement cannot be made. The findings, therefore, reflect post-use engagement patterns and learner perceptions rather than demonstrable improvements in learning outcomes. Future research incorporating performance-based assessments is required to evaluate learning gains attributable to the system.
A key limitation of the study is the absence of objective learning outcome measures, such as pre- and post-performance tests. As a result, the study cannot provide evidence of learning improvement or achievement gains. Future research incorporating performance-based assessments is required to evaluate learning effects attributable to the system.
Without a control condition (e.g., non-adaptive system use or traditional instruction), observed engagement patterns, task success rates, and positive perceptions cannot be attributed unambiguously to the adaptive features of the system. The results, therefore, indicate associations and contextual patterns rather than causal effects of adaptivity.
Temporal trends in system usage may reflect contextual influences such as assessment deadlines, examination periods, or course scheduling rather than system-driven engagement alone. Because the analysis did not control for academic calendar effects or external instructional demands, increases in usage over time should be interpreted as system-level usage patterns rather than direct evidence of adaptive intervention effects.
The observed increase in system activity over time may be influenced by contextual factors such as the academic calendar, including assessment deadlines or examination periods. Because the study did not control for calendar-related effects, the linear usage trend cannot be unambiguously attributed to the adaptive system itself. Future studies should incorporate calendar-aligned controls or comparative baseline periods to disentangle system-driven engagement from seasonal usage patterns.
Different data sources were collected at different time points (e.g., needs assessment, post-use questionnaires, logfile data), and not all measures were temporally aligned at the individual level. As a result, relationships between perceptions, engagement, and system use cannot be interpreted as sequential or developmental processes.
For attitudinal, motivational, and usability-related variables, comparisons were made against a neutral scale midpoint rather than against individual or group-level baseline measurements. Such comparisons indicate the direction of post-use perceptions but do not constitute evidence of change over time.
Taken together, these limitations indicate that the present findings should be interpreted as descriptive and exploratory, providing insight into learner perceptions, system usage patterns, and contextual associations rather than causal evidence of learning improvement. Future research employing controlled designs, baseline and post-intervention performance measures, calendar-aligned analyses, and larger teacher samples is required to substantiate and extend these findings.