Article

Urban–Remote Disparities in Taiwanese Eighth-Grade Students’ Science Performance in Matter-Related Domains: Mixed-Methods Evidence from TIMSS 2019

1
Research Center for Testing and Assessment, National Academy for Educational Research, New Taipei City 23703, Taiwan
2
Science Education Center, National Taiwan Normal University, Taipei City 116059, Taiwan
3
Department of Education, National Taiwan Normal University, Taipei City 106308, Taiwan
*
Author to whom correspondence should be addressed.
Educ. Sci. 2025, 15(9), 1262; https://doi.org/10.3390/educsci15091262
Submission received: 12 August 2025 / Revised: 16 September 2025 / Accepted: 18 September 2025 / Published: 22 September 2025
(This article belongs to the Special Issue Inquiry-Based Learning and Student Engagement)

Abstract

This study investigates urban–remote disparities in the science performance of Taiwanese eighth-grade students, particularly in matter-related domains, using an explanatory–sequential mixed-methods design. For the quantitative phase, we applied differential item functioning (DIF) analysis with Mantel–Haenszel statistics and logistic regression to the TIMSS 2019 science assessment, while in the qualitative phase, we employed think-aloud interviews and the repertory grid technique (RGT) with 12 students (6 urban, 6 remote) to explore cognitive structures. The quantitative phase identified 26 items (12.3% of 211) disadvantaging remote students, with DIF most pronounced in constructed-response formats and matter-related domains: “Composition of Matter”, “Physical States and Changes in Matter”, and “Properties of Matter”. The follow-up qualitative analyses revealed fragmented, associative cognitive structures in remote learners, marked by reliance on observable (macroscopic) properties rather than microscopic explanations, terminological confusion, microscopic gaps, and misconceptions, contrasting with urban students’ hierarchical integration. Triangulation suggests that the observed disparities are linked to experiential constraints, potentially accounted for by hindered micro–macro connections. Our findings suggest that resource inequities may play a role in sustaining certain biases, indicating that targeted measures could help to make science education more inclusive. Based on these results, we tentatively outline possible educational interventions to improve equity in science education.

1. Introduction

In recent years, the need for educational equity has attracted increased attention from researchers and policymakers, and this trend is further evidenced in studies highlighting hidden rural barriers and attitude gaps in science education, underscoring the need for context-specific equity evaluations (Gkagkas et al., 2025; Graham, 2024). Within this global context, urban–remote disparities in educational outcomes represent a persistent challenge in Taiwan. Students in remote areas often exhibit lower average academic performance than their urban counterparts, as measured using standardized tests or large-scale educational survey studies such as Trends in International Mathematics and Science Study (TIMSS) and Programme for International Student Assessment (PISA). This phenomenon is linked to inequities in access to educational resources and experiential learning opportunities (Chen, 2012; Jen et al., 2020). However, the general performance gaps revealed through aggregate mean-score comparisons do not identify specific cognitive or knowledge-based discrepancies between subgroups. These gaps also overlook item-level biases and underlying mechanisms, such as those influenced by experiential differences. Key gaps in the literature include the limited research on differential item functioning (DIF) in science assessments across urban–remote contexts globally, with particular scarcity in Taiwan, where experiential constraints (e.g., limited laboratory access) may exacerbate disparities, especially in matter-related domains. Recent studies highlight how urban-centric biases in science education research perpetuate these inequities, calling for context-specific tools to address rural challenges (Buck et al., 2023). Few studies, such as that by Chai et al. (2023), address Taiwan’s remote settings, highlighting the need for localized investigation. Globally, there is also little integration of quantitative methods into qualitative cognitive explorations, a gap that is equally evident in the Taiwanese context. Moreover, domain-specific insights into how micro–macro connections hinder remote students’ performance remain insufficient (e.g., Hadenfeldt et al., 2014). To address these critical shortcomings, this study employs a novel mixed-methods strategy, integrating DIF analysis of TIMSS 2019—to identify item-level biases and performance disparities among students with comparable ability (Sandilands et al., 2013; Wu et al., 2016)—with think-aloud interviews and the repertory grid technique (RGT) among students from Taiwan’s urban (densely populated) and remote (resource-limited) schools (K-12 Education Administration, Ministry of Education, 2021) to explore cognitive structures and experiential influences. This approach allows us to clarify issues such as fragmented cognitive structures in remote learners and propose solutions such as resource-targeted interventions—for example, virtual laboratories and teacher training—to promote equitable science education.
Large-scale assessments, particularly international databases such as TIMSS and PISA, provide a valuable lens for this type of equity-focused research (Appels et al., 2024; Enchikova et al., 2024). TIMSS is particularly suitable for investigating equity in science education, as it is a nationally representative, curriculum-based assessment covering key science domains. The TIMSS assessment format, which includes both multiple-choice and constructed-response items, presents a natural context for investigating the effects of resource disparity. Specifically, constructed-response items often require extended reasoning and presuppose familiarity with hands-on activities (e.g., laboratory apparatus, data interpretation, or the connection between the microscopic and the macroscopic). Consequently, these items are hypothesized to represent plausible loci of locale-based DIF when access to such educational resources is unequal (Gess et al., 2017; Scheuneman & Gerritz, 1990).
Accordingly, the present study was designed to identify and explain the sources of urban–remote performance differences in science at the item level. An initial DIF screening was conducted across all science domains in the TIMSS 2019 Grade 8 assessment to empirically identify items that functioned differently among Taiwanese student subgroups of comparable ability. To avoid a priori assumptions about content areas, this approach treated any domain-specific clustering of DIF items as empirical evidence warranting deeper qualitative investigation. Two research questions guided the study:
(1)
Which TIMSS 2019 Grade 8 science items exhibit DIF that disadvantages students in remote areas of Taiwan, and what are the shared characteristics (e.g., item type, cognitive domain, content area) of these items?
(2)
What cognitive, experiential, or contextual factors explain the DIF patterns observed, particularly within the content domains where these patterns are most prevalent?
To address these research questions, we adopted an explanatory–sequential mixed-methods design (Edmonds & Kennedy, 2017). The initial quantitative phase involved DIF analyses to detect and characterize items exhibiting DIF, followed by a qualitative phase to elucidate the potential mechanisms underlying these items. By combining statistical precision with interpretive depth, this study aimed to inform feasible, item-level strategies for promoting equity in science education.

2. Literature Review

2.1. Urban–Remote Disparities in Science Education

Urban–remote disparities in science education represent a persistent challenge to global equity. They are rooted in systemic inequalities that shape learning opportunities and student outcomes. Schools in remote areas frequently lack critical infrastructure, including well-equipped laboratories, reliable digital connectivity, and a stable supply of qualified teachers. This deficiency restricts curriculum coverage, limits opportunities for hands-on scientific practice, and reduces access to expert guidance (Amini & Nivorozhkin, 2015; Cao & Huo, 2025; Huang, 2024; Kryst et al., 2015; Mullis et al., 2020; UNESCO & International Task Force on Teachers for Education 2030, 2024; Wang et al., 2024). Evidence from TIMSS 2019 reveals a correlation between school-reported shortages in science resources and lower Grade 8 science achievement, highlighting how resource deficits translate into measurable performance gaps (Mullis et al., 2020). The infrastructural shortfalls are compounded by challenges in human capital. Schools in non-metropolitan areas across many educational systems experience chronic teacher shortages and high turnover. This undermines the quality and continuity of science instruction, especially in laboratory-based learning (Ingersoll & Tran, 2023; Rhinesmith et al., 2023; UNESCO & International Task Force on Teachers for Education 2030, 2024). In Europe, structural barriers and unequal resource distribution have widened urban–remote achievement gap in science. Evidence from post-socialist countries, England, and Russia shows that poor infrastructure, high student–teacher ratios, and lower rates of teacher certification disadvantage remote students (Amini & Nivorozhkin, 2015; Cao & Huo, 2025; Kryst et al., 2015). Similarly, in Asia, rapid urbanization and socioeconomic divides intensify resource and staffing constraints. Remote students in China, for example, face limited access to well-equipped laboratories and qualified science teachers. They also have fewer informal learning opportunities, which further restricts engagement with scientific inquiry (Huang, 2024; Wang et al., 2024). Limited engagement in informal science learning has been associated with diminished interest and knowledge in science (Hill et al., 2018). Collectively, these findings illustrate a global pattern where inequities and limited opportunities sustain urban–remote disparities in science education. This highlights the need for targeted, system-level interventions.
The global landscape of educational inequity provides a critical framework for examining the situation in Taiwan. Early research by B.-S. Lin and Crawley (1987), based on data from 1269 junior high students, found that metropolitan students expressed more positive attitudes toward the social implications of science, scientific inquiry, and the adoption of scientific attitudes compared to rural students, highlighting persistent disparities linked to resource and socioeconomic differences. More recent studies, such as that by Chai et al. (2023), further demonstrate these disparities, showing improved science performance in remote areas with targeted resource interventions, aligning with the 0.54 standard deviation gap reported in TIMSS 2019 (Chang et al., 2021). This persistent disparity, evident in the 45-point performance difference favoring metropolitan over remote schools, signals substantial inequities in learning opportunities for students in remote areas. The magnitude of this gap indicates the importance of resource allocation, staffing stability, and access to inquiry-rich learning environments as policy priorities in reducing urban–remote inequities in science education.

2.2. DIF in Assessments and Science Education

DIF is a statistical indicator when test items exhibit differential difficulties for subgroups matched based on underlying ability, signaling potential construct-irrelevant variance or legitimate subgroup differences (Berk, 1982). Sources of DIF in educational testing include cultural and linguistic variation, where item interpretation diverges across sociocultural contexts or language groups (Liu & Bradley, 2021; Solano-Flores & Nelson-Barber, 2001). Experiential disparities also contribute, arising from unequal access to resources or curricula (Gess et al., 2017; Scheuneman & Gerritz, 1990). Recent research further argues that unaddressed DIF can perpetuate inequities in high-stakes settings, with urban students accruing unintended advantages (Opesemowo, 2025).
Within science education, DIF analysis can serve as a crucial tool in enhancing the fairness and validity of assessments across diverse populations. It supports test item validation by checking that demographic groups (e.g., gender) are assessed equivalently on scientific reasoning skills such as the control-of-variables strategy (Van Vo & Csapó, 2021). DIF analysis also identifies curriculum-related biases across regions. Such evidence informs the development of standardized content and enhances cross-cultural comparability in international large-scale assessments such as PISA (Joo et al., 2022). Additionally, DIF can help detect domain-specific misconceptions in physics, chemistry, and biology, enabling the design of targeted instructional interventions (Soeharto & Csapó, 2021). Cultural influences on item interpretation can likewise be diagnosed via DIF, guiding the construction of culturally fair tasks (Huang et al., 2016). Beyond item development, DIF informs test assembly, scaling, and linking choices; appropriate modeling and anchor selection help mitigate group-mean distortions and improve score comparability with global benchmarks (von Davier et al., 2020). Overall, DIF analysis not only detects potential sources of bias but also shapes the interactive development of equitable science assessments, thereby supporting more just educational decision-making across varied contexts.

2.3. Mixed-Methods Approaches in DIF Research

The mixed-methods frameworks in the current study combine quantitative DIF analysis with qualitative exploration to provide deeper insights. Explanatory–sequential designs utilize qualitative components to clarify and interpret quantitative findings (Creswell & Plano Clark, 2017; Edmonds & Kennedy, 2017). Within assessment contexts, techniques such as think-aloud protocols and repertory grids illuminate cognitive processes (Ericsson & Simon, 1984; Kelly, 1991).
Contemporary applications encompass the mixed-methods validation of instruments (Grand-Guillaume-Perrenoud et al., 2023) and outcome-based inquiries (Curry et al., 2009). In engineering education, quantitative artifacts serve as qualitative data sources (Wallwey & Kajfez, 2023). Standards for evaluating qualitative elements in mixed-methods research emphasize methodological rigor and cohesive integration (Hammersley, 2023).

2.4. Repertory Grid Technique

Kelly’s repertory grid technique (RGT), grounded in Personal Construct Psychology, elicits individuals’ personal constructs—bipolar dimensions that they use to interpret experiences (Kelly, 1991). Through comparisons of elements (e.g., concepts or objects), participants derive constructs, culminating in a grid that delineates cognitive architectures via ratings or rankings.
In science education, RGT can be used in a broad range of applications to reveal implicit knowledge, misconceptions, and conceptual schemas. It has been used to diagnose misconceptions and assess conceptual change in physics (Winer & Vazquez-abad, 1997). RGT has also been applied to explore students’ affective and cognitive perceptions of science-related roles and environments—such as “self”, “science teacher”, or “scientist”—thereby uncovering the interplay between conceptual understanding and attitudes toward science (Happs & Stead, 1989). Moreover, it has been employed to visualize and quantify how students mentally classify equid species, revealing the underlying structure of their biological concepts (McCloughlin, 2002). In addition, qualitative studies have applied RGT to assess educators’ meta-strategic knowledge structures as they plan argumentation lessons (Y.-R. Lin et al., 2017). RGT has also been used to determine biology teachers’ tacit views of the knowledge required for teaching, clarifying how they interrelate content knowledge and pedagogical content knowledge (Rozenszajn et al., 2021).
RGT proves especially advantageous in mixed-methods paradigms for interpreting quantitative outcomes, such as DIF, through visualizations of knowledge configurations and the detection of construct dissonances (Fransella et al., 2004; Jankowicz, 2004). Its adaptability accommodates diverse developmental stages, from early childhood to advanced education, rendering it suitable for investigating urban–remote cognitive variances in science.

2.5. Difficulties in Learning Matter-Related Concepts Among Middle School Students

The concept of matter is foundational in science education, with core areas including its composition (e.g., particles, atoms, molecules, elements, compounds, and mixtures), properties (physical and chemical), and physical states and changes (e.g., solid, liquid, gas, and phase transitions). Middle school students encounter significant challenges in understanding matter-related concepts, including its composition, properties, and physical states and changes. These difficulties often stem from reliance on sensory perceptions, the fragmented integration of microscopic models into macroscopic phenomena, and ineffective teaching strategies (Hadenfeldt et al., 2014; Nakhleh et al., 2005; Talanquer, 2009). A core difficulty lies in conceptualizing matter at the particulate level, where students frequently perceive it as a continuous substance rather than discrete atoms and molecules (Nakhleh, 1992; Nakhleh et al., 2005; Talanquer, 2009). This leads to prevalent misconceptions, such as attributing macroscopic properties such as color, rigidity, or size to individual particles mirroring the bulk material’s characteristics, for instance, believing atoms in solids are inherently hard or that they are visible under standard microscopes, conflating them with cells or microorganisms (Nakhleh et al., 2005; Talanquer, 2009). Students also exhibit anthropomorphic views, ascribing intentions to atoms (e.g., atoms “want” a full octet) or prioritizing atoms over molecules as fundamental entities, resulting in fragmented knowledge (Zarkadis et al., 2020).
In the domain of the composition of matter, terminological confusion exacerbates these issues, with students often using terms such as “element”, “compound”, and “mixture” interchangeably, without scientific precision (Johnson, 2000). Common examples include classifying distilled water as a “mixture” of hydrogen and oxygen or milk as a “compound” based on everyday utility rather than chemical composition, alongside anthropocentric descriptions such as viewing wood’s composition in terms of its utility (e.g., “useful for everyone”) instead of its particulate structure (Johnson, 2000). Additional misconceptions involve beliefs that atomic numbers can change through physical actions or that electrons move non-randomly. Conceptual progression typically begins with macroscopic, uniform perceptions in primary education, advancing to the acknowledgment of particles as fundamental units by middle school, though this understanding is often fragmented—students may recognize particles in familiar contexts such as water or gases but fail to apply the model consistently to solids such as wood or metal (Hadenfeldt et al., 2014; Talanquer, 2009).
Regarding the properties of matter, learners frequently overlook distinctions between physical properties (e.g., density, malleability) and chemical properties (e.g., reactivity), imputing macroscopic characteristics directly to solitary particles (Talanquer, 2009). Key misconceptions include assuming atoms or molecules expand when heated, rather than recognizing increased kinetic energy or spacing, or poorly understanding the conservation of mass, believing that it changes during dissolving or combustion by confusing it with density or visibility (Bar & Galili, 1994; Stavy & Stachel, 1985; Talanquer, 2009). For physical properties, they often give descriptive explanations devoid of particle-based rationale (e.g., “liquids flow because they’re wet”), while chemical properties are seen as innate transformations without atomic reorganization—for example, thinking gases inherently weigh less than solids or that solubility limits cause substances to “disappear” (Hadenfeldt et al., 2014; Nakhleh et al., 2005). Developmental advancement should shift from empirical classifications to particle-centric explanations, but middle school students commonly remain at intermediary stages, sporadically applying rudimentary particle models (Hadenfeldt et al., 2014; Talanquer, 2009).
Challenges in physical states and changes arise from imperceptibility (e.g., gases) and abstract phase alterations (Osborne & Cosgrove, 1983; Stavy & Stachel, 1985). Misconceptions include viewing bubbles in boiling water as air, oxygen, or heat rather than water vapor; believing that evaporated water “disappears” or turns into air/hydrogen–oxygen; theorizing that condensation permeates containers; or assuming that ice molecules are inherently “colder” than liquid water molecules, ignoring kinetic energy differences (Nakhleh et al., 2005; Osborne & Cosgrove, 1983; Talanquer, 2009). Distinguishing physical changes (e.g., melting) from chemical ones (e.g., burning) proves difficult, with students confusing freezing/boiling with chemical reactions, viewing the changes as irreversible, or ascribing state transitions to particle contraction/expansion or fragmentation rather than configuration or kinetics modifications (Bar & Galili, 1994; Talanquer, 2009). Progression should start with archetype-centric views (e.g., water as a liquid exemplar) and evolve toward particle interplay, yet middle schoolers often struggle with gases and conservation during transformations (Hadenfeldt et al., 2014; Talanquer, 2009).
These impediments generally originate from instructional approaches emphasizing memorization over connections to tangible examples (Yezierski & Birk, 2006). Pedagogical recommendations include simulations and multi-modal representations to bridge macroscopic observations and particulate models; conceptual transformation tactics such as analogy-driven exercises to facilitate micro–macro linkages; and formative evaluations with practical engagements, such as investigations into evaporation or condensation, to address fallacies (Nakhleh et al., 2005; Osborne & Cosgrove, 1983; Talanquer, 2009; Yezierski & Birk, 2006).

2.6. Research Purposes

Overall, middle school students’ comprehension of matter remains transitional and disjointed, with misconceptions anchored in sensory dependence and the partial assimilation of particle models (Hadenfeldt et al., 2014; Nakhleh et al., 2005; Talanquer, 2009). These endure across cultural and developmental boundaries, necessitating precise interventions such as conceptual reconfiguration approaches, visual aids, and sequential curricula to promote unified advancement (Hadenfeldt et al., 2014; Yezierski & Birk, 2006). The current study addresses these issues by employing a mixed-methods approach to examine urban–remote disparities in Taiwanese middle school students’ understanding of matter concepts, identifying specific DIF patterns and cognitive structures that can inform targeted interventions and equitable educational policies.

3. Materials and Methods

Guided by an explanatory–sequential mixed-methods design, this study comprised two phases: In Phase 1 (quantitative), we applied item response theory (IRT)-based DIF analysis to TIMSS 2019 Grade 8 science data to identify urban–remote item differences and select the focal content. In Phase 2 (qualitative), we employed repertory grid tasks with twelve students to illuminate the mechanisms underlying those differences.

3.1. Quantitative Phase

This phase involved the secondary analysis of existing TIMSS 2019 data to identify DIF patterns, allowing the efficient examination of equity issues without primary data collection (Johnston, 2014).

3.1.1. Data Source

This study analyzed the publicly available Grade 8 science data from TIMSS 2019 for Taiwan (n = 5711; Fishbein et al., 2021), which contain student responses (bsatwnm7.sav), background variables—most notably the student weight (TOTWGT) and jackknife replicate variables (JKZONE, JKREP) stored in bsgtwnm7.sav—and detailed item metadata (eT19_G8_Item Information.xlsx). The school locale was identified with BCBG05B in the school questionnaire file (bcgtwnm7.sav), where a value of 1 indicated densely populated (urban) areas and a value of 5 indicated remote rural settings.

3.1.2. Quantitative Data Analysis

An IRT-based DIF analysis—an extension of the Partial Credit Model (PCM)—was conducted to detect group differences (Masters, 1982; Wu et al., 2016). The PCM is suitable for polytomous items and assumes that the probability of a respondent n scoring x on item i is given by
Pr X n i = x θ n = exp k = 0 x θ n δ i + τ i k m = 0 M i exp k = 0 m θ n δ i + τ i k
where θ n is the respondent’s ability, δ i is the overall item difficulty, τ i k represents step difficulties for category k ( k = 1 to M i ), and M i is the maximum score for item i .
To detect DIF, the model was extended to include group-specific parameters for urban (reference) and remote (focal) groups:
τ i k g = τ i k + β g k
where g denotes the group, and β g k represents the DIF effect at step k . If β g k > 0 and is statistically significant ( p < 0.05 ), then the step is harder for the remote group.
Analysis was implemented in R using the TAM package (Robitzsch et al., 2024). Jackknife resampling was conducted to estimate standard errors (Kish & Frankel, 1974). Items with significant β g k were flagged, and distributions by type, cognitive domain, and content were tabulated.

3.2. Qualitative Phase

Guided by the quantitative results, this phase explored explanatory factors via in-depth interviews, focusing on the matter-related themes that predominated in terms of DIF proportions.

3.2.1. Participants

To explain the urban–remote disparities identified in the quantitative phase, the case study in the qualitative phase involved students selected from schools categorized under the TIMSS 2019 framework. “Urban schools” were defined as those located within population-dense districts of Taiwan’s six special municipalities (Taipei City, New Taipei City, Taoyuan City, Taichung City, Tainan City, and Kaohsiung City), corresponding to the “Urban—Densely populated” category (code 1). “Remote schools” were designated according to the Standards for Classification and Recognition of Schools in Remote Areas (K-12 Education Administration, Ministry of Education, 2021), aligning with the “Remote rural” category (code 5) in TIMSS 2019, and encompassed schools identified through adverse factors such as transportation challenges, limited educational resources, and socioeconomic disadvantages. Twelve Grade 8 students (six from an urban school and six from a remote school) were purposively sampled to ensure diversity in achievement and background, reflecting the range of performance observed in the TIMSS 2019 data. Triangulation was achieved through discussions with the two science teachers from the participating schools, enhancing the validity of the qualitative findings.

3.2.2. Procedures

This phase followed three sequential stages to elicit and validate students’ cognitive structures:
  • Card Sorting: This stage aimed to initiate the process of identifying students’ initial conceptual frameworks by presenting 39 cards featuring matter-related terminologies (listed as E1–E39 in Appendix A). For each iteration, three cards were randomly selected, and students identified two that were more similar or related, explaining their rationale for the grouping and the contrast with the third card, thereby eliciting initial constructs through triadic comparison. All classification rationales were subsequently categorized and synthesized by two science education experts and two junior high school science teachers to derive the cognitive constructs underlying the students’ understanding of the 39 terminologies, providing a foundation for subsequent analysis.
  • Kelly Grid Technique: This stage sought to formalize and more deeply assess the understanding of cognitive structures, drawing on Kelly’s RGT (Kelly, 1991), by (a) presenting elements derived from card sorting (E1–E39 in Appendix A) and eliciting bipolar constructs via triadic comparison (e.g., “These two are compounds” vs. “That one is a mixture”); (b) constructing a grid with 39 predefined elements (rows) and student-generated constructs (columns) used to explain their card-sorting results; (c) rating each element–construct intersection on a trichotomous scale (1 = match, 0 = irrelevant, −1 = mismatch); and (d) debriefing through brief interviews to verify their ratings and better understand their reasoning, ensuring the accuracy of the grid data.
  • Teacher Interviews: This stage aimed to validate the repertory grid findings and enhance triangulation by conducting semi-structured interviews with the two science teachers from the participating schools. These interviews confirmed our interpretations of the repertory grid analysis results, addressing potential biases in student responses and strengthening the reliability of the cognitive structural mappings across urban and remote groups.

3.2.3. Qualitative Data Analysis

The primary focus of the analysis was on interpreting the RGT results at the individual and group levels (urban vs. remote) to map cognitive structures and reveal disparities, as detailed below.
  • Individual Analysis
  • Data Matrix and Preprocessing: This step was designed to organize raw data by producing a rating matrix (elements × constructs) on a trichotomous scale, treating elements as observations and constructs—derived from students’ card-sorting rationales and aligned with an expert reference framework—as variables to establish a baseline for cognitive mapping (Slater, 1977).
  • Dimensionality Reduction: This step was designed to identify and map underlying cognitive dimensions in students’ understanding by using principal component analysis (PCA) to analyze z-scored constructs and report the eigenvalues, explained variance, and biplots of element scores and construct loadings, thereby visualizing correlations and cognitive organization (Fransella et al., 2004). Aggregated group matrices, derived from averaged ratings, enabled PCA comparisons across the urban and remote subgroups to highlight disparities in cognitive frameworks.
  • Hierarchical Clustering and Seriation: We employed this technique to group related concepts by applying agglomerative hierarchical clustering (Ward’s linkage) to one-mode similarities (Pearson correlations converted to distances), producing dendrograms and seriated heatmaps to reveal coherent conceptual blocks; robustness checks with alternative linkages and bootstrapping ensured stability (Jankowicz, 2004).
  • Bipartite Graphs: Designed to enhance visualization, two-mode clustering projected the matrix into weighted adjacency networks for community detection, creating bipartite and one-mode graphs to depict element–construct clusters and reduce clutter via thresholding (Borgatti & Everett, 1997; Csardi et al., 2025). Convergent validity was examined by triangulating PCA groupings, hierarchical cluster memberships, and bipartite graphs with teacher interviews.
2.
Group Comparisons
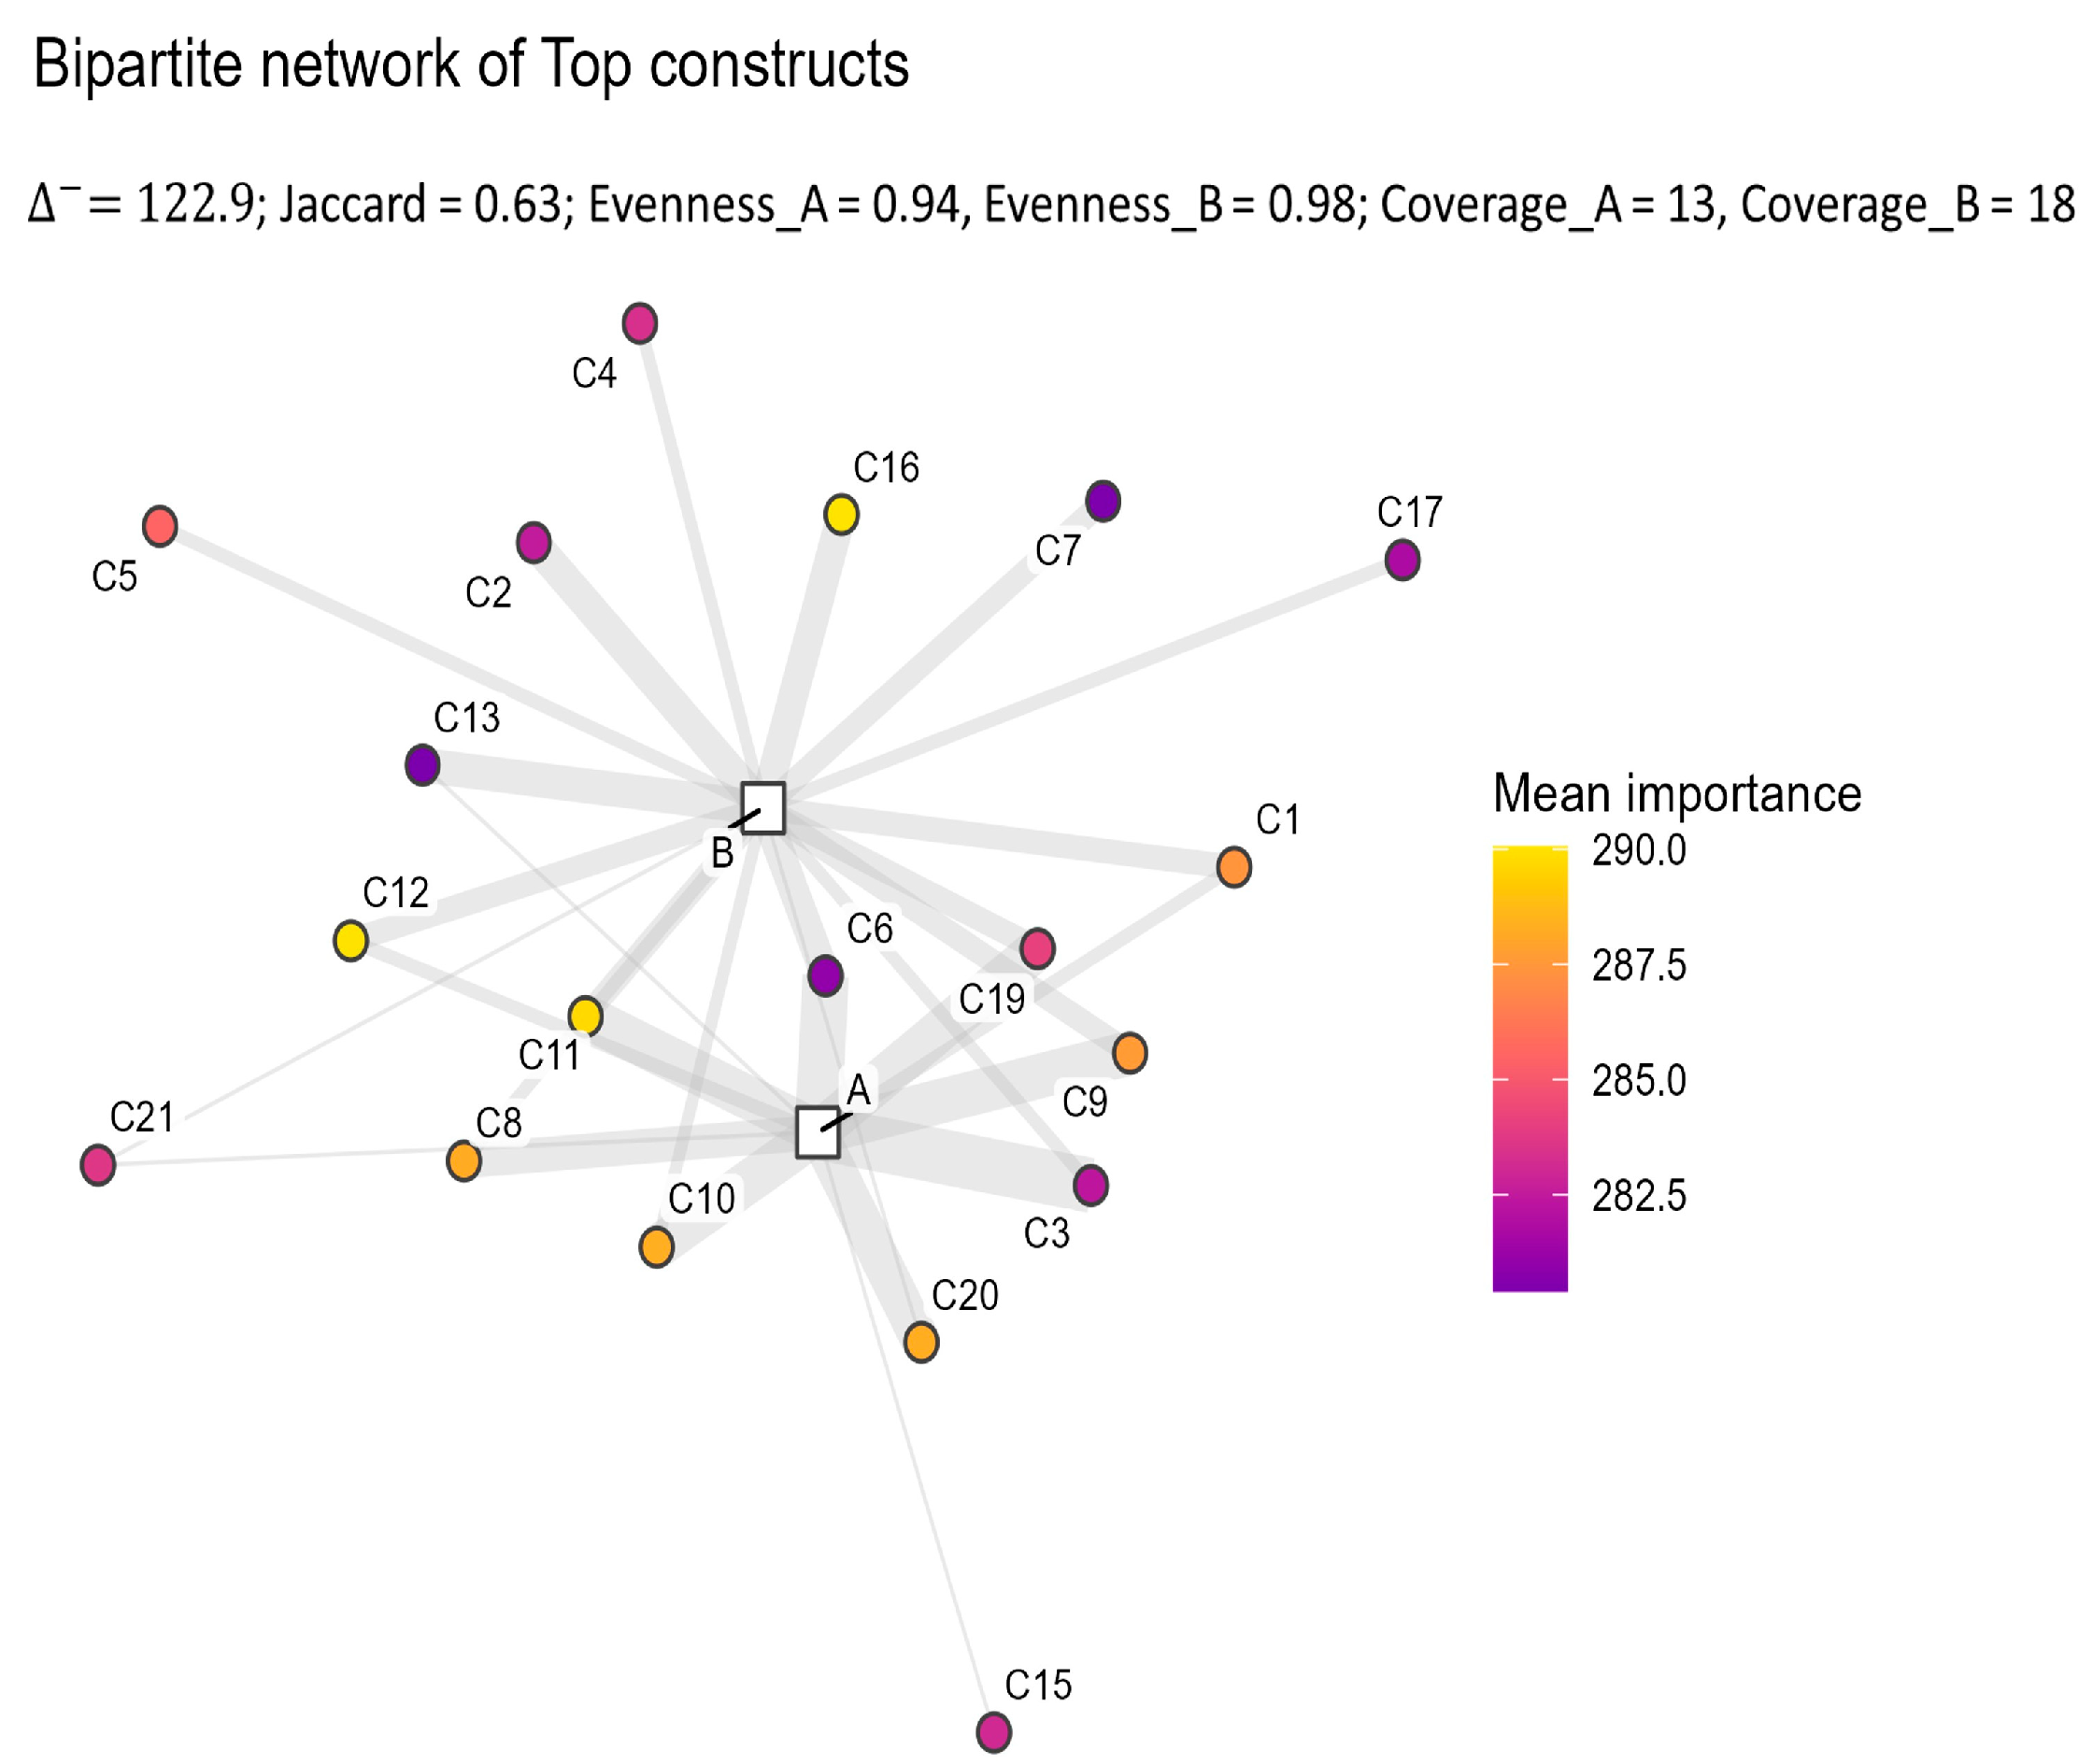
Through this analysis, we aimed to compare urban and remote cognitive frameworks by summarizing individual grids at the construct–cluster level using the positive-orientated Honey importance score, where larger values indicate greater importance, to quantify conceptual salience (Rojon et al., 2019). Two complementary data views were produced: (i) a heat map of mean importance by group × cluster to highlight group differences, and (ii) a group–cluster bipartite graph in which an edge connects a group to a cluster when at least one participant in that group nominated the cluster as Top (the edge weight equals the number of such nominations) to visualize shared priorities. Four indices were derived to assess disparities:
  • 1 (Mean A B Across Clusters): Let I ¯ g k denote the mean importance of cluster k in group g     A ,   B . The overall between-group salience difference is
    1 = 1 K k = 1 K I ¯ A k I ¯ B k .
    This provides a single magnitude of group difference corresponding to the heat-map.
  • Jaccard Overlap of Top Sets: With S A and S B as the sets of clusters receiving at least one Top nomination in groups A and B, respectively, the overlap is
    J a c c a r d = S A   S B S A   S B ,
    quantifying the shared core of clusters (Manning et al., 2008).
  • Evenness (Shannon Evenness of Top Weights): Top weights w k are normalized to p k = w k / k w k . Shannon entropy H = k p k l o g p k is converted to evenness J = H / l o g K (bounded in [0,1]); higher values indicate a more even spread of attention across clusters (Strong, 2016).
  • Coverage (Number of Top Clusters): This is the count of clusters with a non-zero Top weight in each group, indicating the breadth of concepts activated as Tops, which is comparable to two-mode coverage in bipartite networks (Latapy et al., 2008).
Cluster-wise differences were additionally screened for using Welch’s t-test or Wilcoxon’s rank-sum test when assumptions were limiting, with Benjamini–Hochberg FDR correction for multiple testing (Benjamini & Hochberg, 1995). Construct clustering across participants used Damerau–Levenshtein string distance with hierarchical clustering to reduce synonymy before group aggregation, enhancing comparability (Nyshchuk et al., 2023; Rojon et al., 2019).

4. Results

This section presents the results of a sequential mixed-methods analysis. The quantitative phase identifies DIF between urban and remote students in TIMSS 2019 Grade 8 science and isolates the matter-related domains with the largest disparities. The qualitative phase then examines students’ conceptual structures using repertory grids and complementary analyses to interpret these disparities—focusing on the composition of matter and states/changes—and culminates in a group-level comparison of cognitive organization in urban versus remote pupils.

4.1. Findings from the Quantitative Phase

The quantitative analysis revealed distinct DIF patterns in the 211 TIMSS 2019 Grade 8 science items. Twenty-six items were significantly more difficult for remote students; these appear as red triangles in Figure 1. DIF occurred far more often in constructed-response items (18.27%) than in multiple-choice items (6.54%) (Table 1). Because open-ended tasks typically demand higher-order reasoning and experiential knowledge—such as interpreting particle interactions or applying laboratory contexts—remote students may struggle due to limited access to hands-on resources. This pattern supports earlier findings that constructed-response items are especially sensitive to contextual biases tied to assumed laboratory experience (Sandilands et al., 2013).
Across cognitive domains, DIF was concentrated most in “Applying” tasks (13.75%), followed by “Knowing” (12.00%) and “Reasoning” (10.71%) (Table 2), implying that practical, application-orientated items challenge remote students most—likely because limited resources restrict their hands-on laboratory experience. The content-domain analysis (Table 3) revealed heightened DIF in matter-related domains that require abstract microscopic reasoning and laboratory-based knowledge. Notably, “Composition of Matter” exhibited the highest DIF proportion (36.36%), followed by “Physical States and Changes in Matter” (25.00%) and “Properties of Matter” (14.29%) as three of the top four domains, alongside “Human Health” (25.00%). This clustering of matter-related themes—encompassing particle composition, physical properties, and phase transitions—highlights their conceptual interconnectedness, where misunderstandings in one area (e.g., perceiving matter as continuous) can propagate to others (Hadenfeldt et al., 2014; Talanquer, 2009).
The prominence of these domains within the 26 items disadvantaging remote students provided a robust rationale for their selection in the qualitative phase, enabling a deeper investigation into how resource disparities contribute to cognitive fragmentation. Kelly Grid techniques were employed to probe students’ conceptual structures, with the qualitative findings triangulated against these quantitative results to validate the choice of these interconnected themes as critical areas for understanding the underlying mechanisms of DIF.

4.2. Findings from the Qualitative Phase

The qualitative phase provided in-depth insights into the mechanisms behind the DIF patterns. Below, the findings from each stage are detailed, supported by illustrative data and thematic analysis.

4.2.1. Card Sorting and Kelly Grid

In the first stage, the 12 students sorted 39 matter-related terms (E1–E39; Appendix A) and articulated reasons for each grouping during the card-sorting task. The justifications provided were compiled and coded, revealing two distinct types of rationales. The first type consisted of ambiguous associations, where students merely noted a relationship without specifying its nature, such as “Water vapor (E38) and ice (E39) are both related to water (S10)”; “Filtration (E24) and solubility (E5) are related (S3)”; and “No reason, just feel that filtration (E24) and precipitation (E22) are more alike, while melting (E14) is different (S8)”. These vague rationales were excluded to ensure interpretive reliability. The second type involved explicit rationales where students articulated shared attributes or superordinate concepts, including “Oxygen (E34) and copper (E28) are both composed of a single type of atom (S1)”; “Alloy (E32) and watermelon (E33) are both mixtures (S6)”; and “These two [boiling point (E3) and density (E1)] are both physical properties (S2)”. Following this exclusion, two science education experts and two junior high school science teachers collaboratively reviewed and synthesized the explicit rationales, deriving a set of 23 explanatory construct categories (C1–C23; Appendix A) that represented the cognitive frameworks used by the students to interpret the 39 terms. The preliminary mapping of these constructs to the DIF patterns from the quantitative phase suggests differences in cognitive integration, with urban students demonstrating hierarchical structures and remote students exhibiting more fragmented associations, particularly in matter-related domains.

4.2.2. Principal Component Analysis and Clustering on the Rating Matrix

To show how repertory grid techniques uncover individual concept maps before comparing groups, we first examined one urban (S1) and one remote (S7) case. These exemplars clarify how PCA and two-mode clustering expose composition-versus-change distinctions and reveal gaps that aggregate statistics can hide.
  • Example Analysis of an Urban Student’s Cognitive Structure (S1)
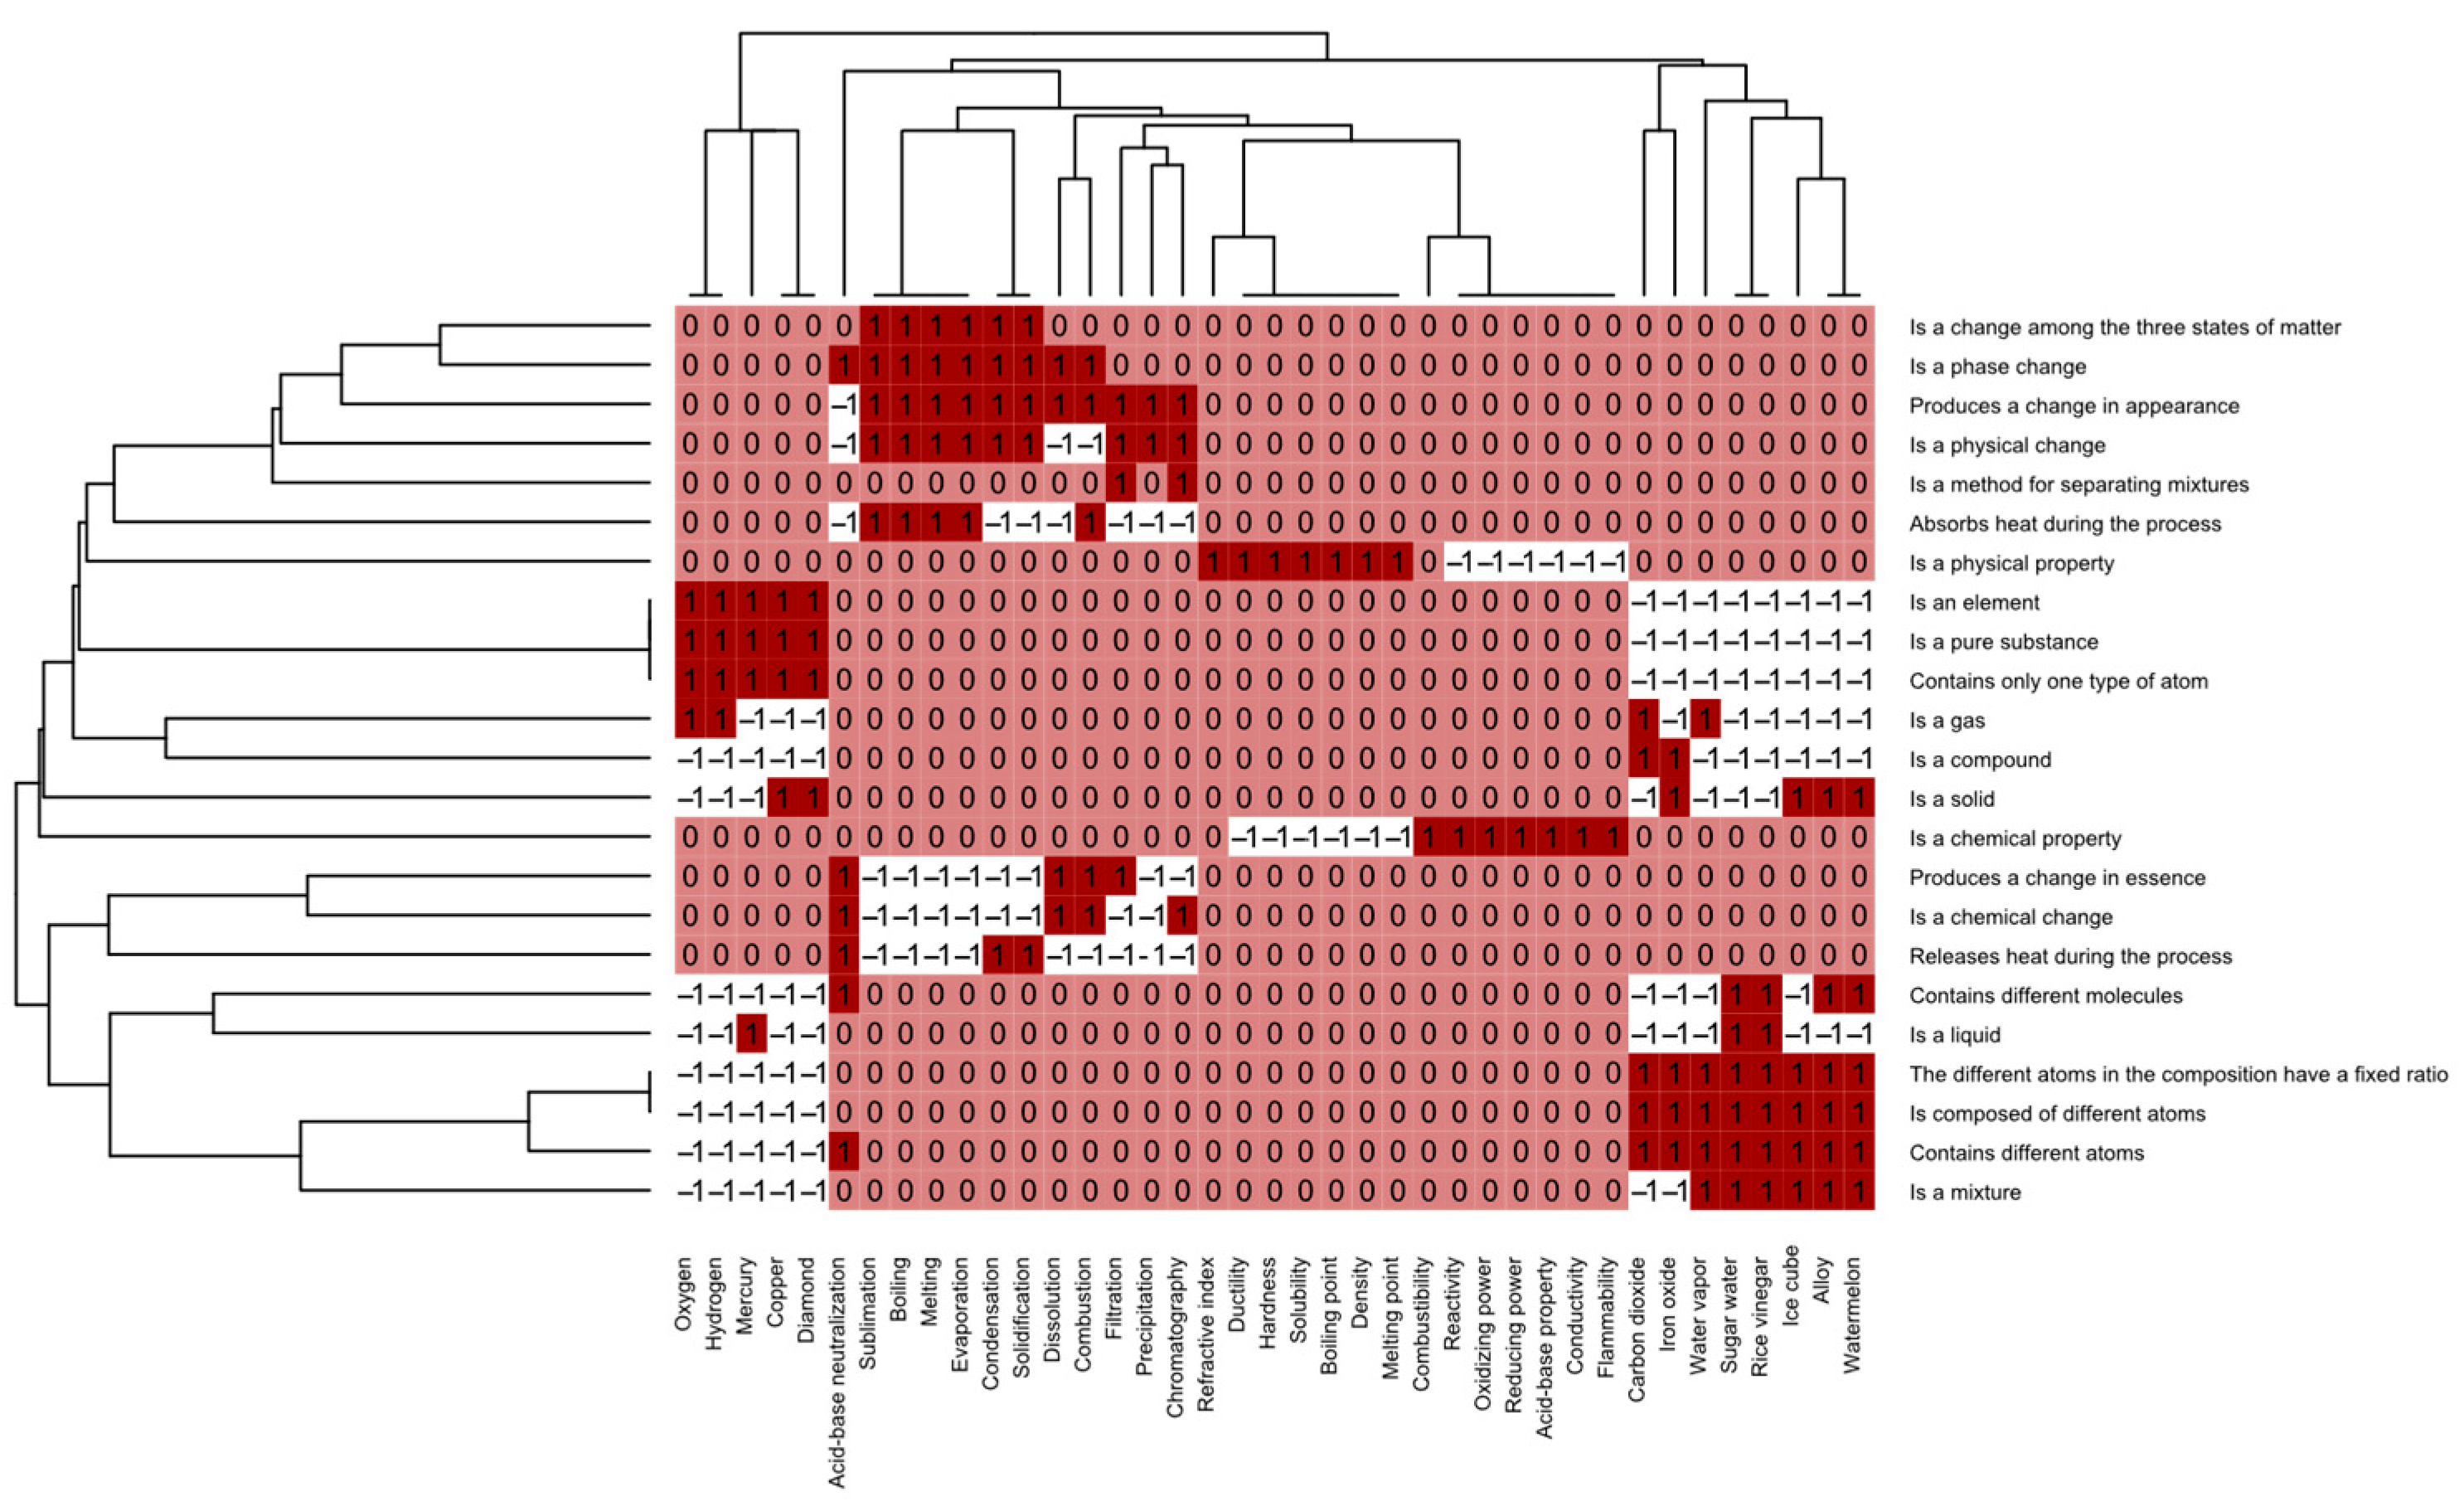
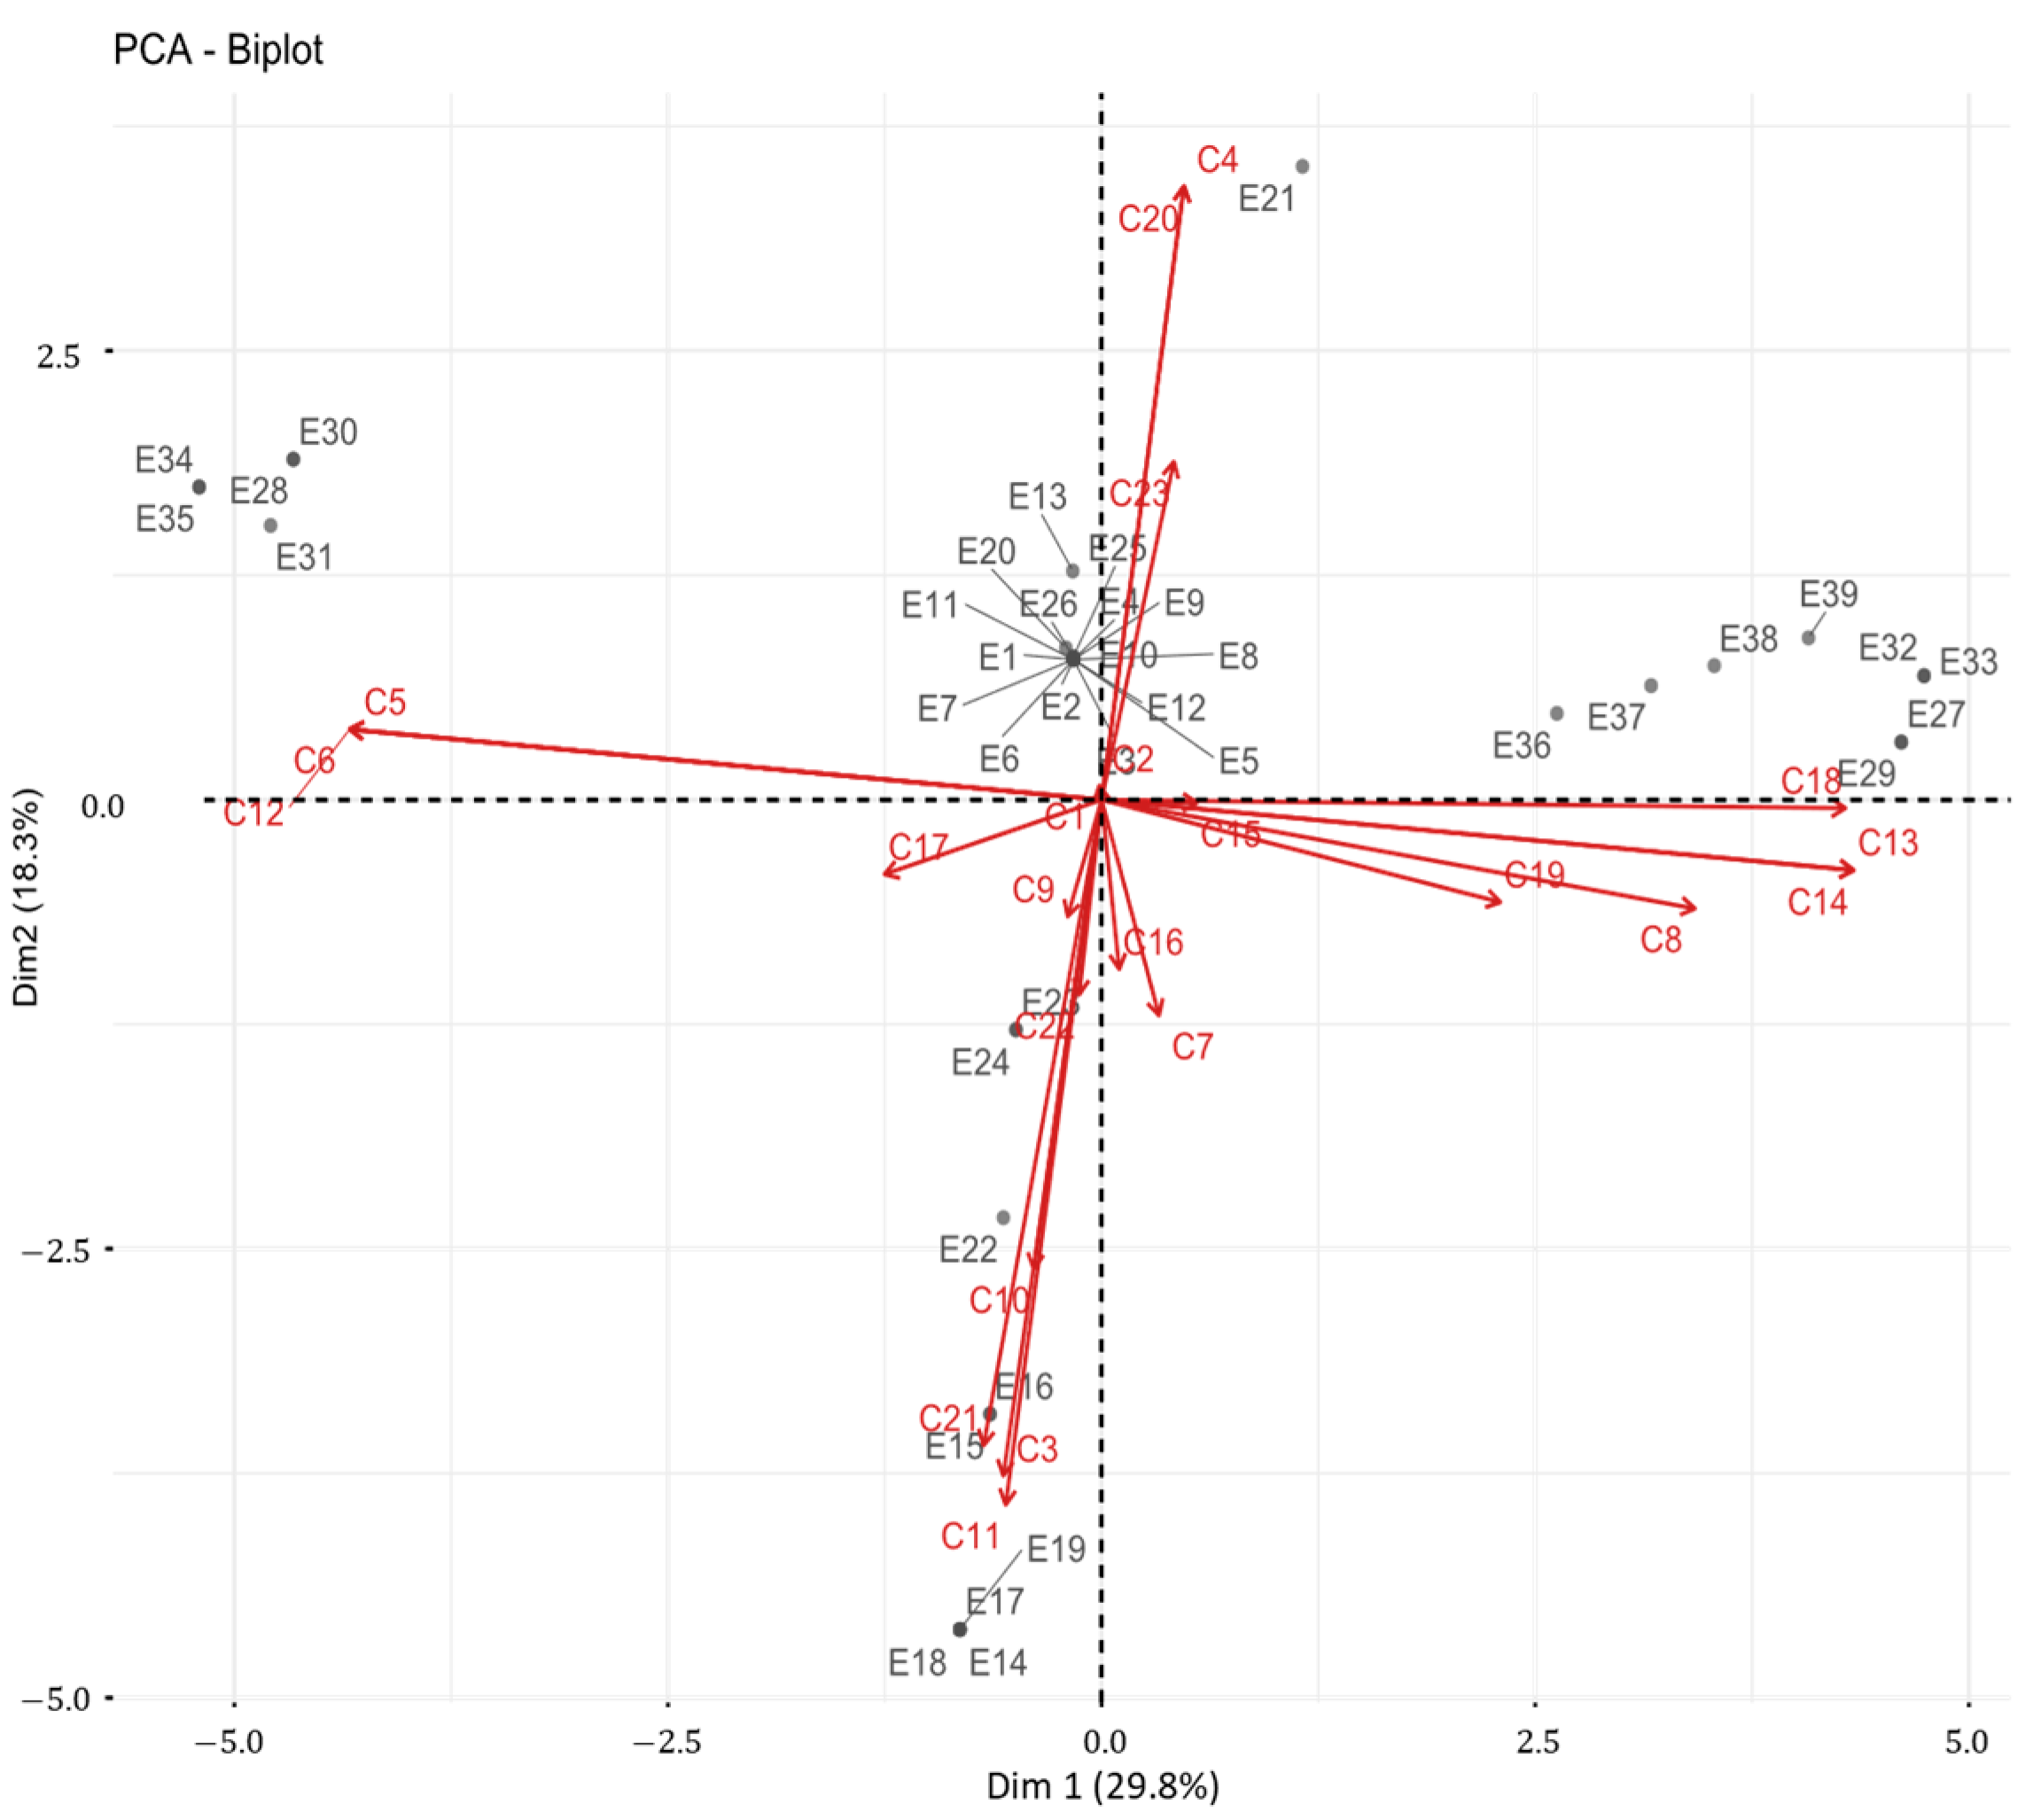
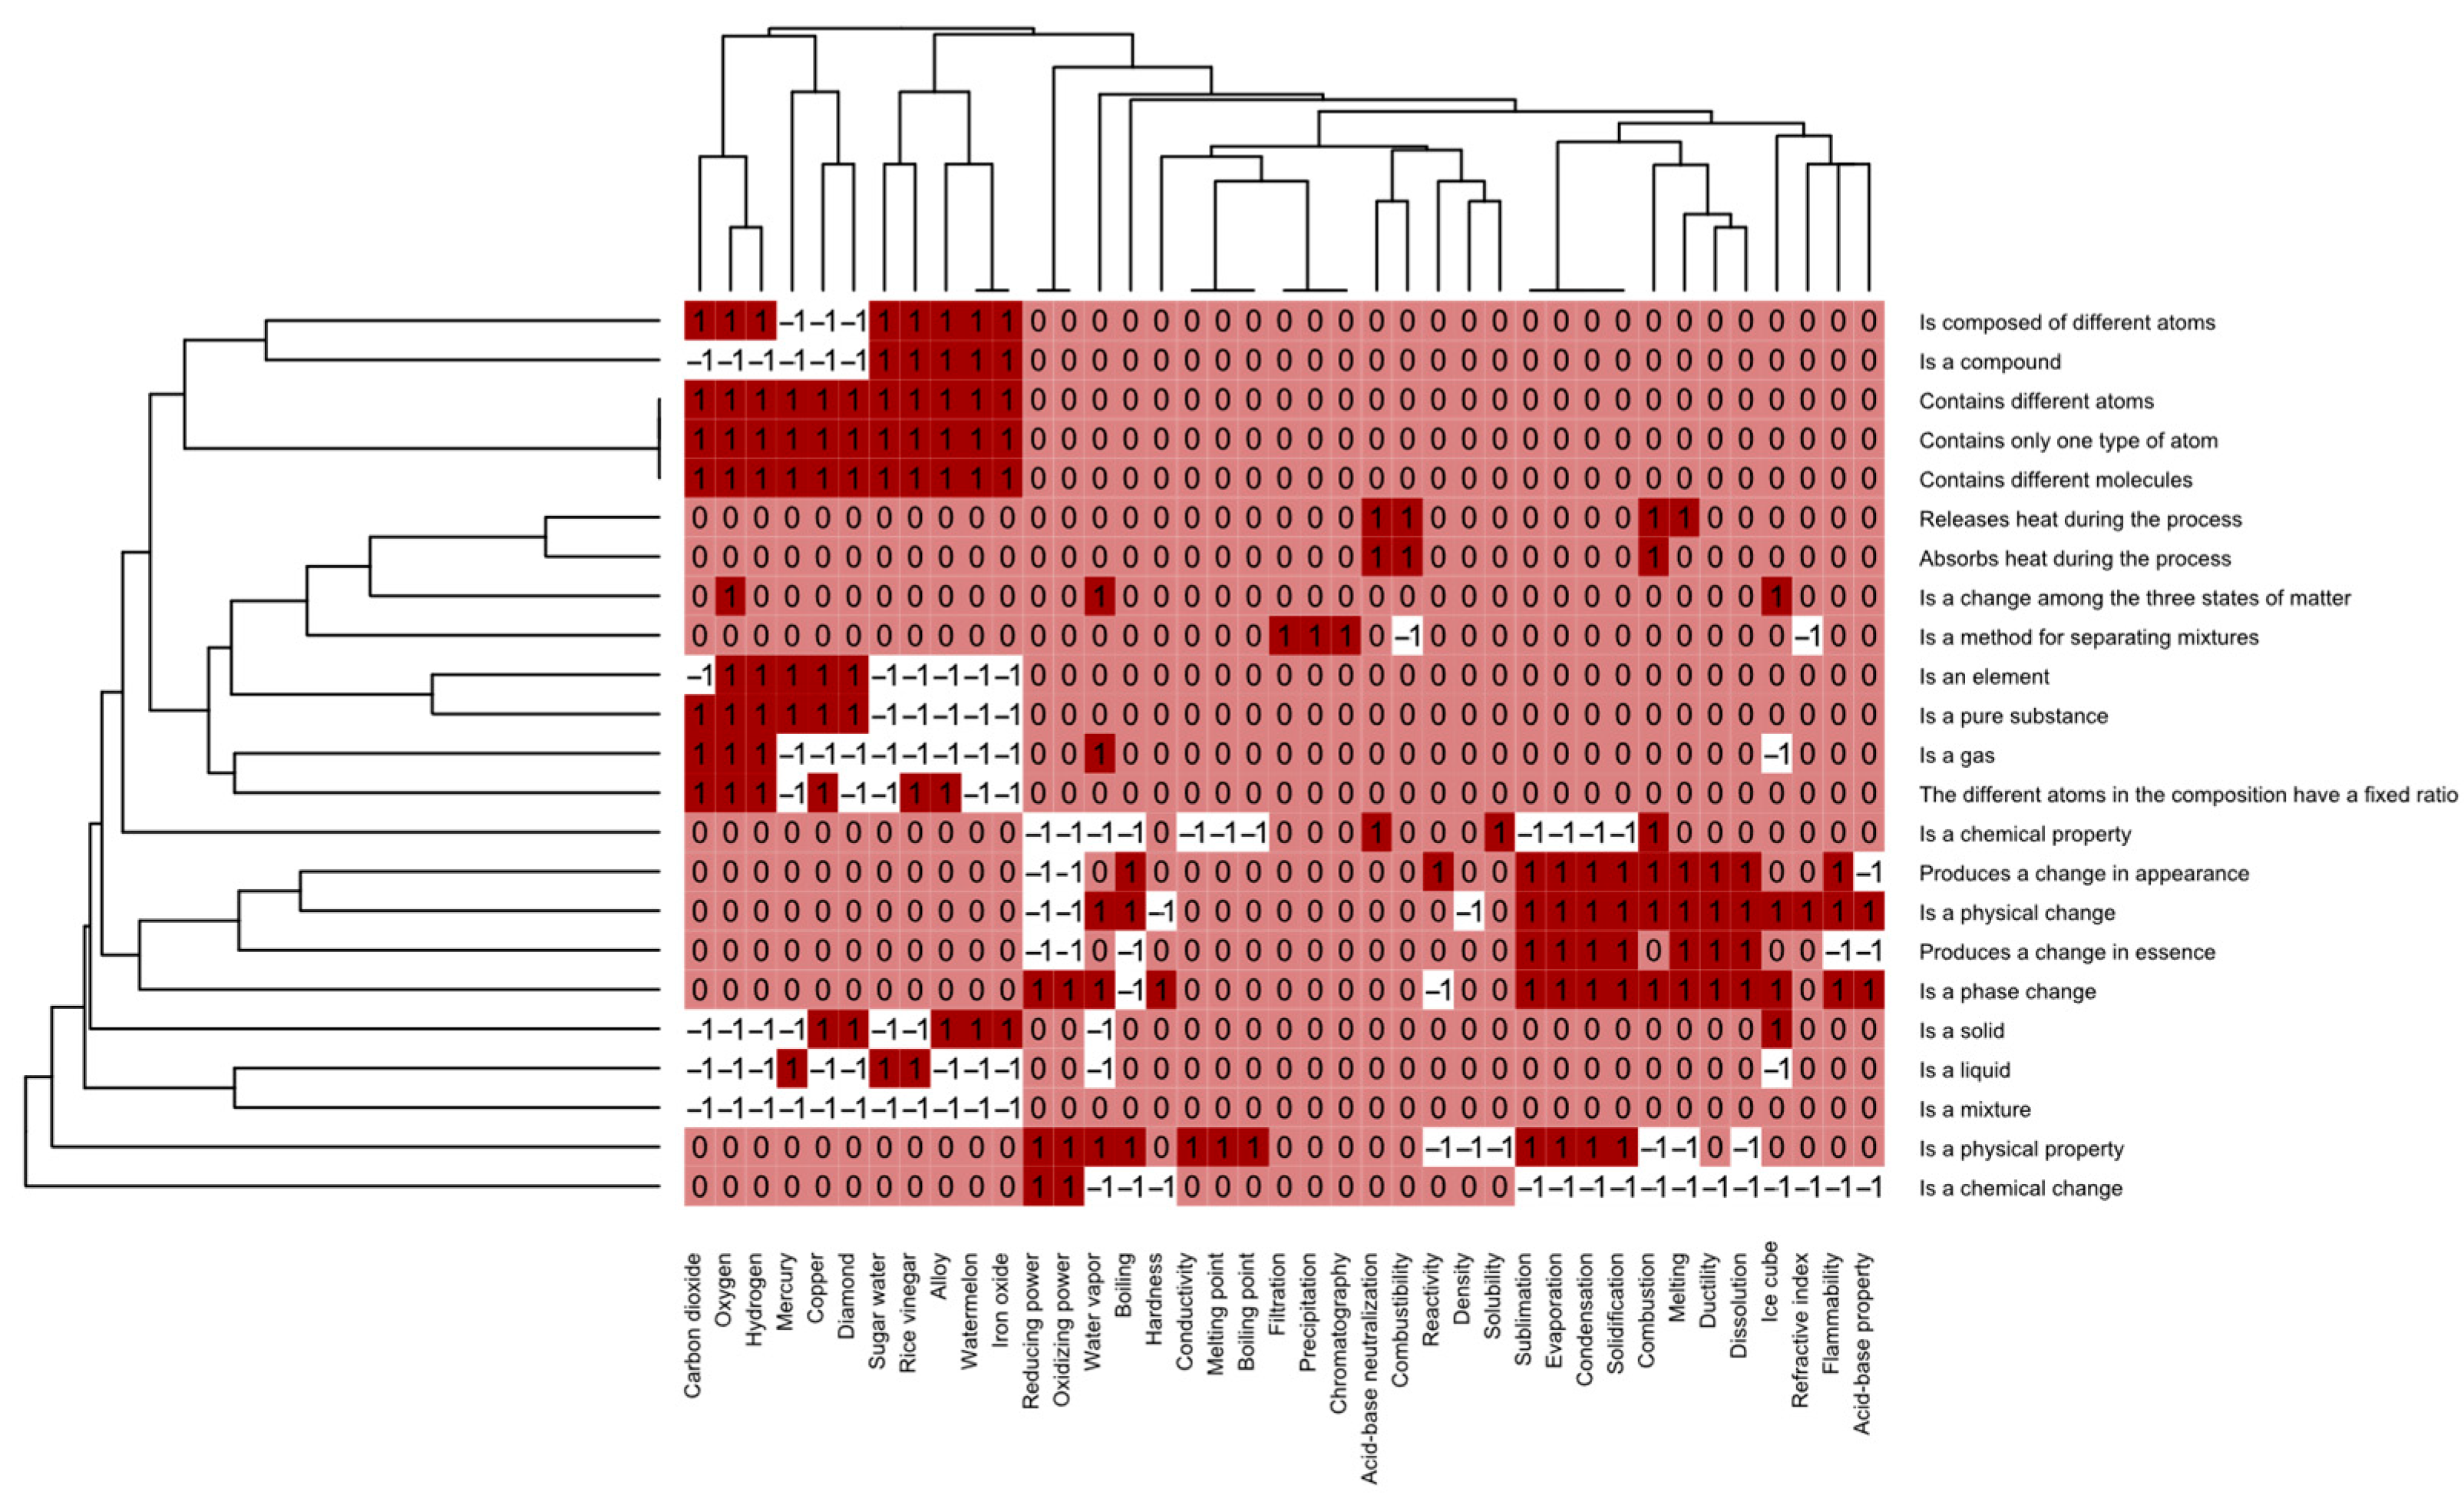
Figure 2 shows the rating matrix completed by urban student S1, which served as the basis for the principal component analysis (PCA) results displayed in Figure 3. The first two principal components accounted for 47.9% of the total variance (PC1 = 29.8%, PC2 = 18.1%; cumulative PC1–PC5 = 71.6%).
PC1 contrasts multi-type compositions—C8 (mixture), C13 (composed of different atoms), C14 (fixed ratio of different atoms), C18 (contains different atoms), C19 (contains different molecules)—with single-type or pure entities—C5 (pure substance), C6 (element), C12 (contains only one type of atom). Hence, mixtures such as sugar water (E27), rice vinegar (E29), alloy (E32), and watermelon (E33) score positively, whereas pure substances such as copper (E28), diamond (E30), oxygen (E34), and hydrogen (E35) score negatively.
PC2 separates chemical identity changes—C4 (chemical change), C20 (change in essence), C23 (releases heat)—from physical or phase changes—C11 (three-state change), C3 (physical change), C21 (change in appearance), C10 (phase change). Acid–base neutralization (E21) anchors the positive end (chemical), while melting (E14), evaporation (E17), boiling (E18), and sublimation (E19) anchor the negative end (physical).
Items near the origin load weakly on both axes and cluster with C1 (physical property) and C2 (chemical property); these include density (E1), melting point (E2), conductivity (E4), solubility (E5), and related traits—properties rather than compositions or changes.
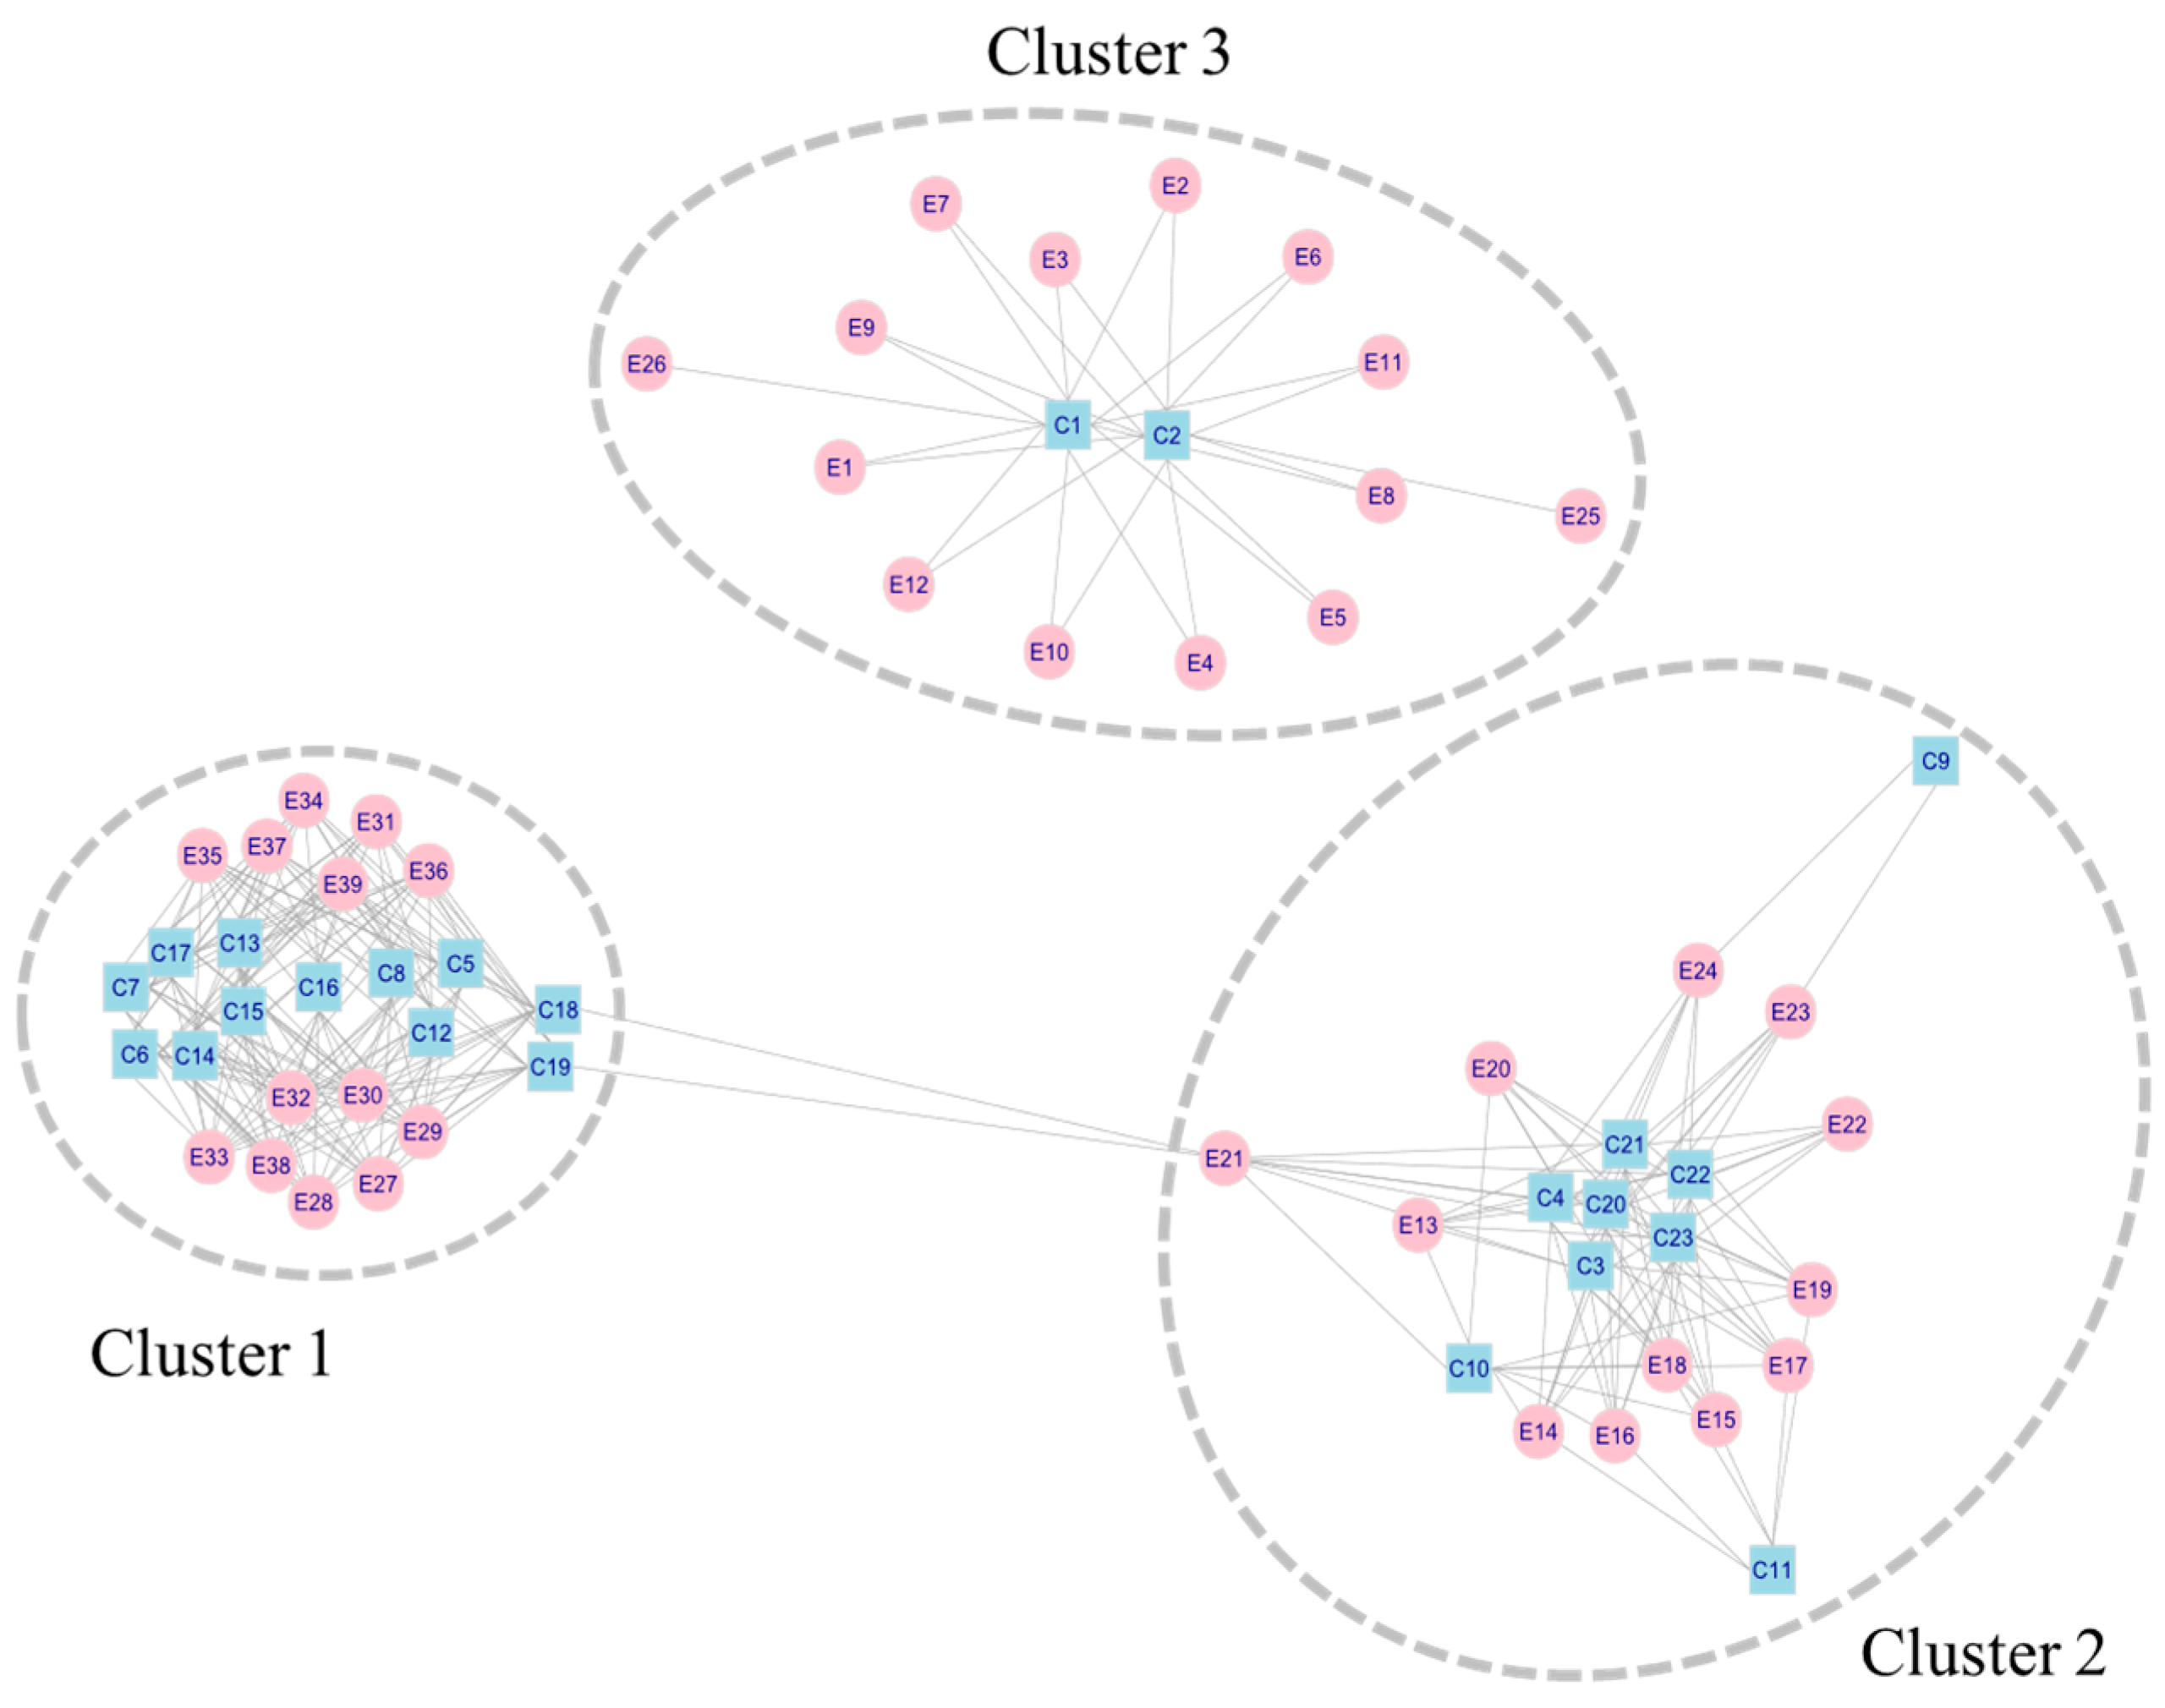
Complementing the PCA, the bipartite graph (as shown in Figure 4) facilitates a clearer visualization of this individual case’s cognitive structure regarding matter-related concepts by simultaneously grouping elements and constructs into interconnected clusters. This bipartite network approach reveals cohesive blocks of associations, making it easier to discern how the student organizes knowledge across domains. Specifically, Cluster 1 aligns with PC1, emphasizing the “Composition of Matter” dimension through groupings of constructs and elements related to multi-type versus single-type compositions (e.g., mixtures, compounds, and pure substances). Cluster 2 corresponds to PC2, capturing distinctions in “Physical States and Changes” via clusters focused on phase transitions versus chemical transformations (e.g., melting, evaporation, and acid–base neutralization). Finally, Cluster 3 represents the “Properties of Matter” that remain unexplained by PC1 and PC2, aggregating physical and chemical properties (e.g., density, conductivity, and reactivity) that the student perceives as somewhat orthogonal to compositional or change-orientated constructs. This clustering not only reinforces the PCA findings but also highlights potential areas of conceptual integration or fragmentation at the individual level.
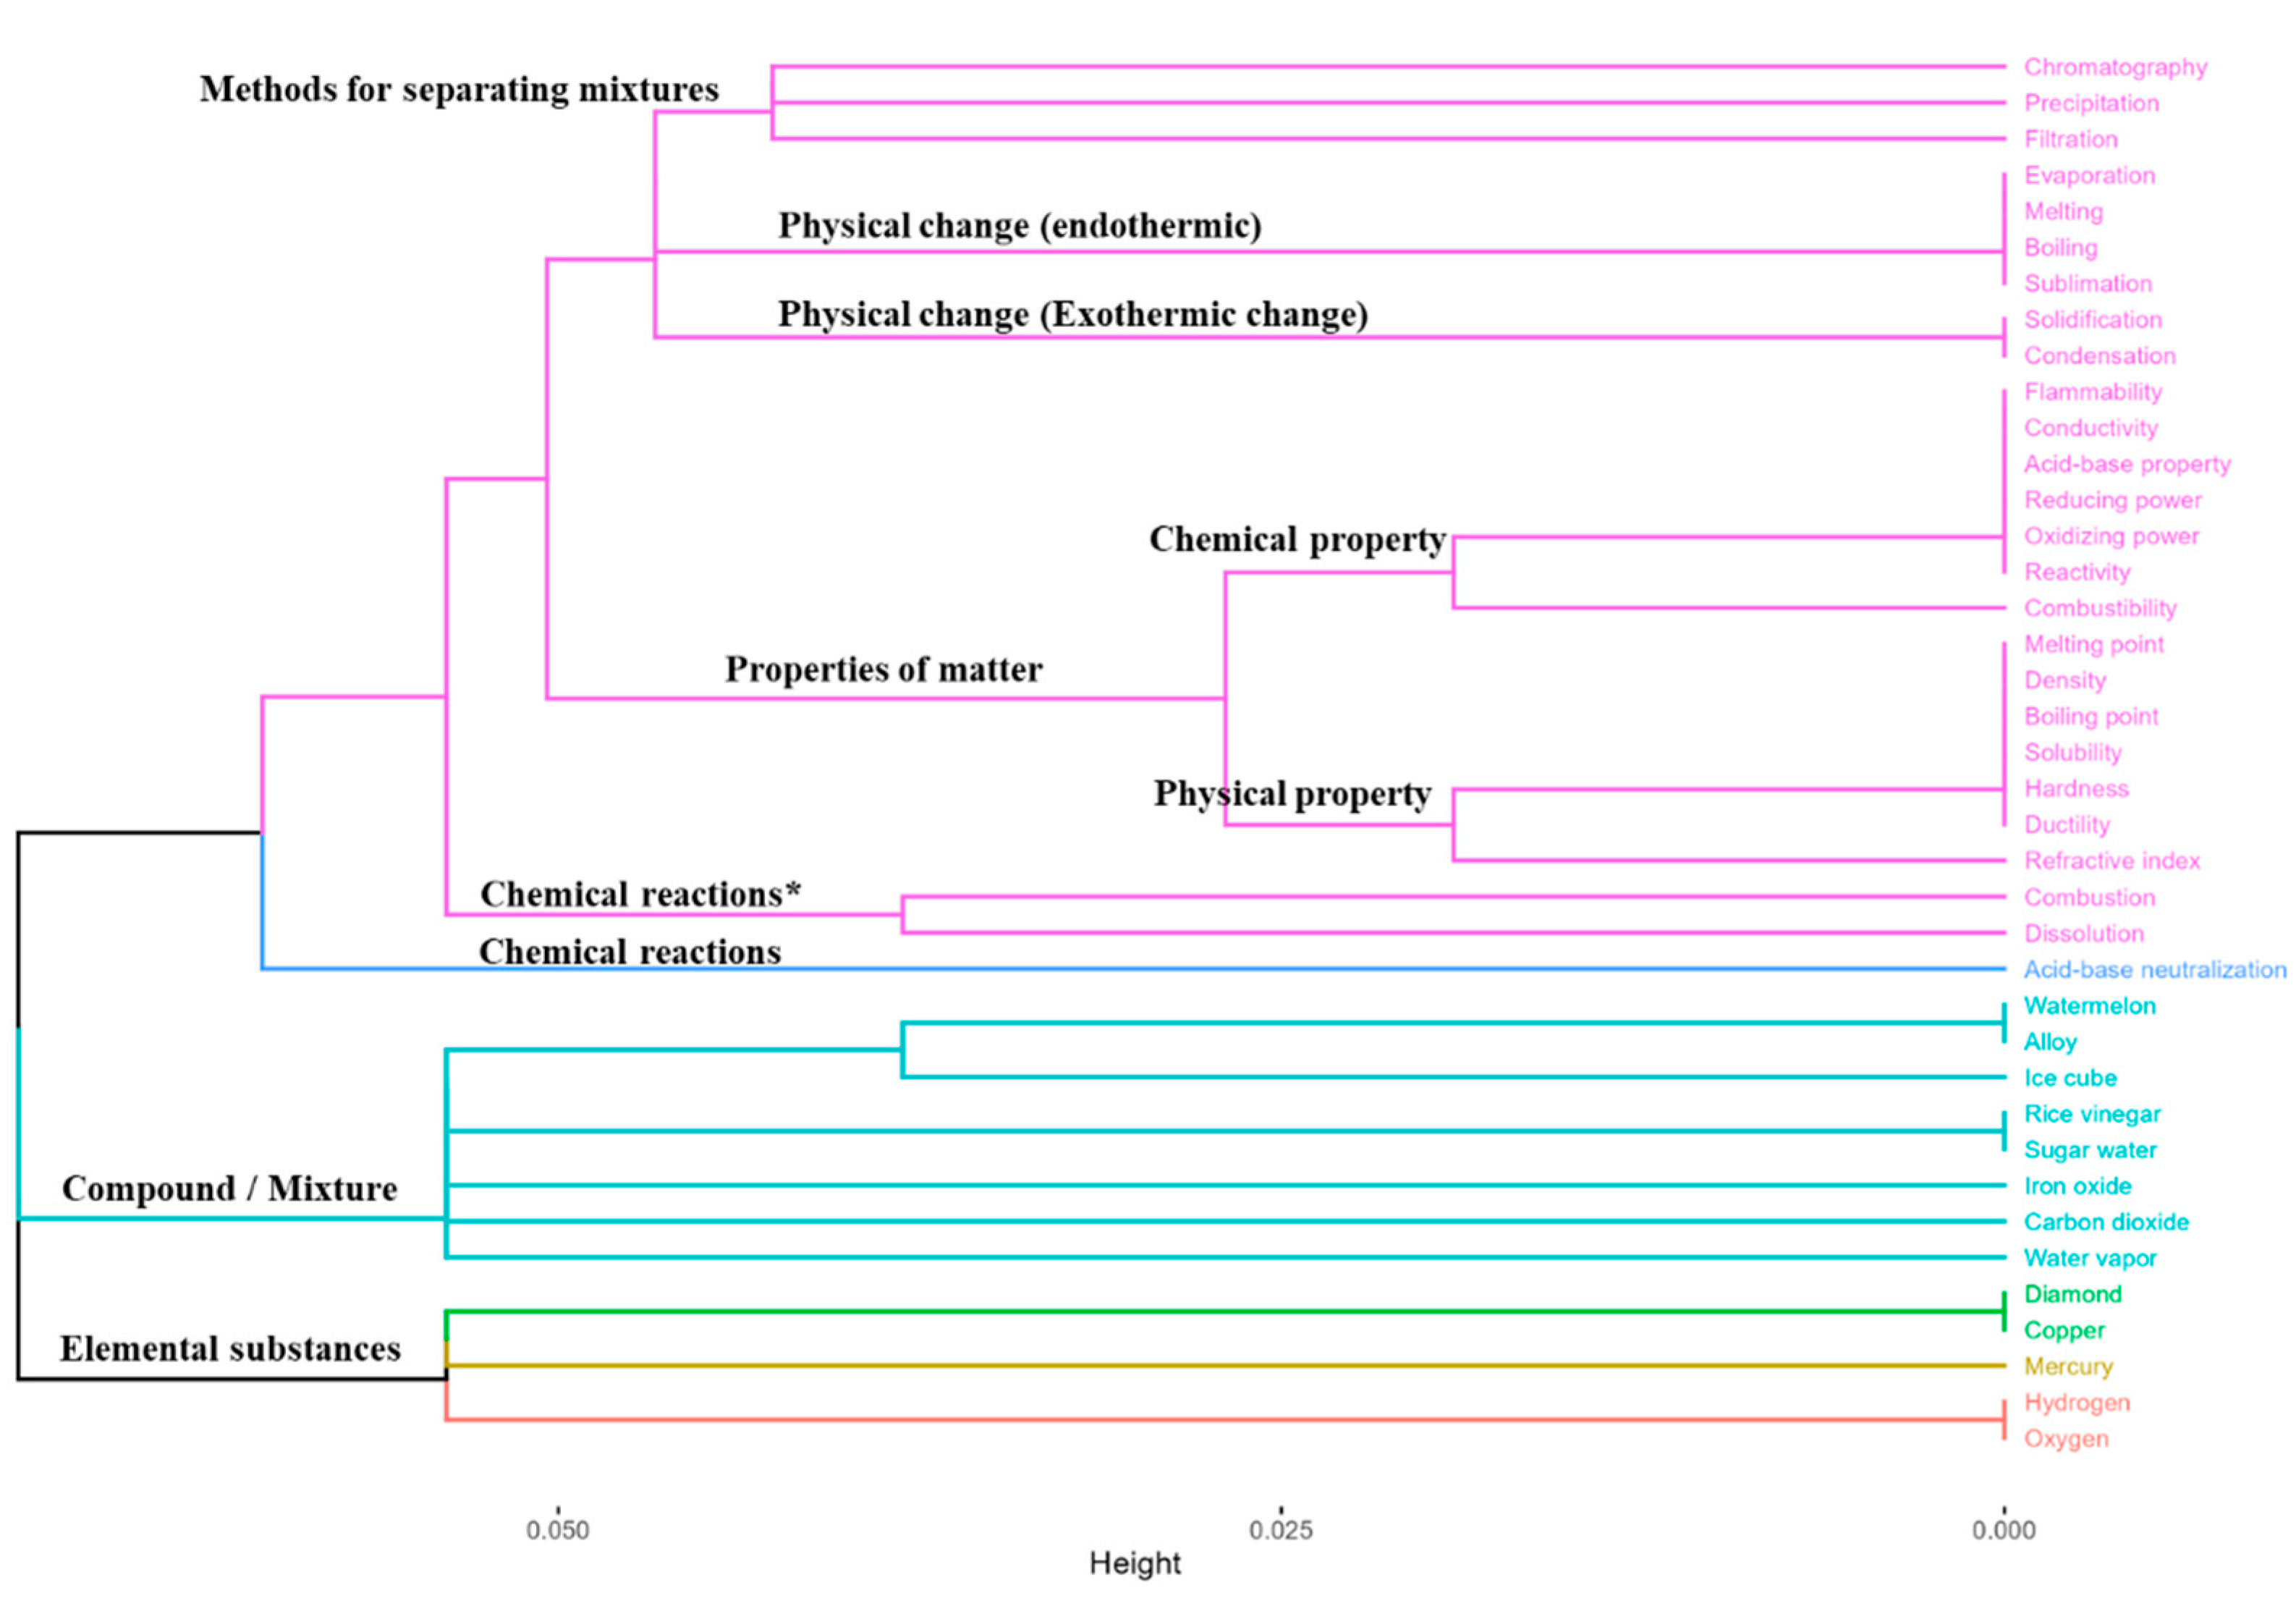
In addition, through follow-up interviews with S1 and the corresponding science teacher to label subclusters, the dendrogram in Figure 5 confirms a hierarchical, expert-like framework. For example, we asked S1 to explain the strong similarity among “chromatography”, “filtration”, and “precipitation”, which appeared in close proximity within the hierarchical clustering. After some thought, S1 responded that “they are all used to separate substances (mixtures).” From the overall interview data, S1 neatly partitions (a) elemental versus compound/mixture, (b) physical versus chemical properties, and (c) energy-based physical versus chemical processes—though minor slips (e.g., labeling “ice cube” a mixture) hint at sensory oversimplifications. Overall, S1’s structure shows strong macro-to-micro integration, likely supported by rich urban laboratory experiences.
2.
Example Analysis of a Remote Student’s Cognitive Structure (S7)
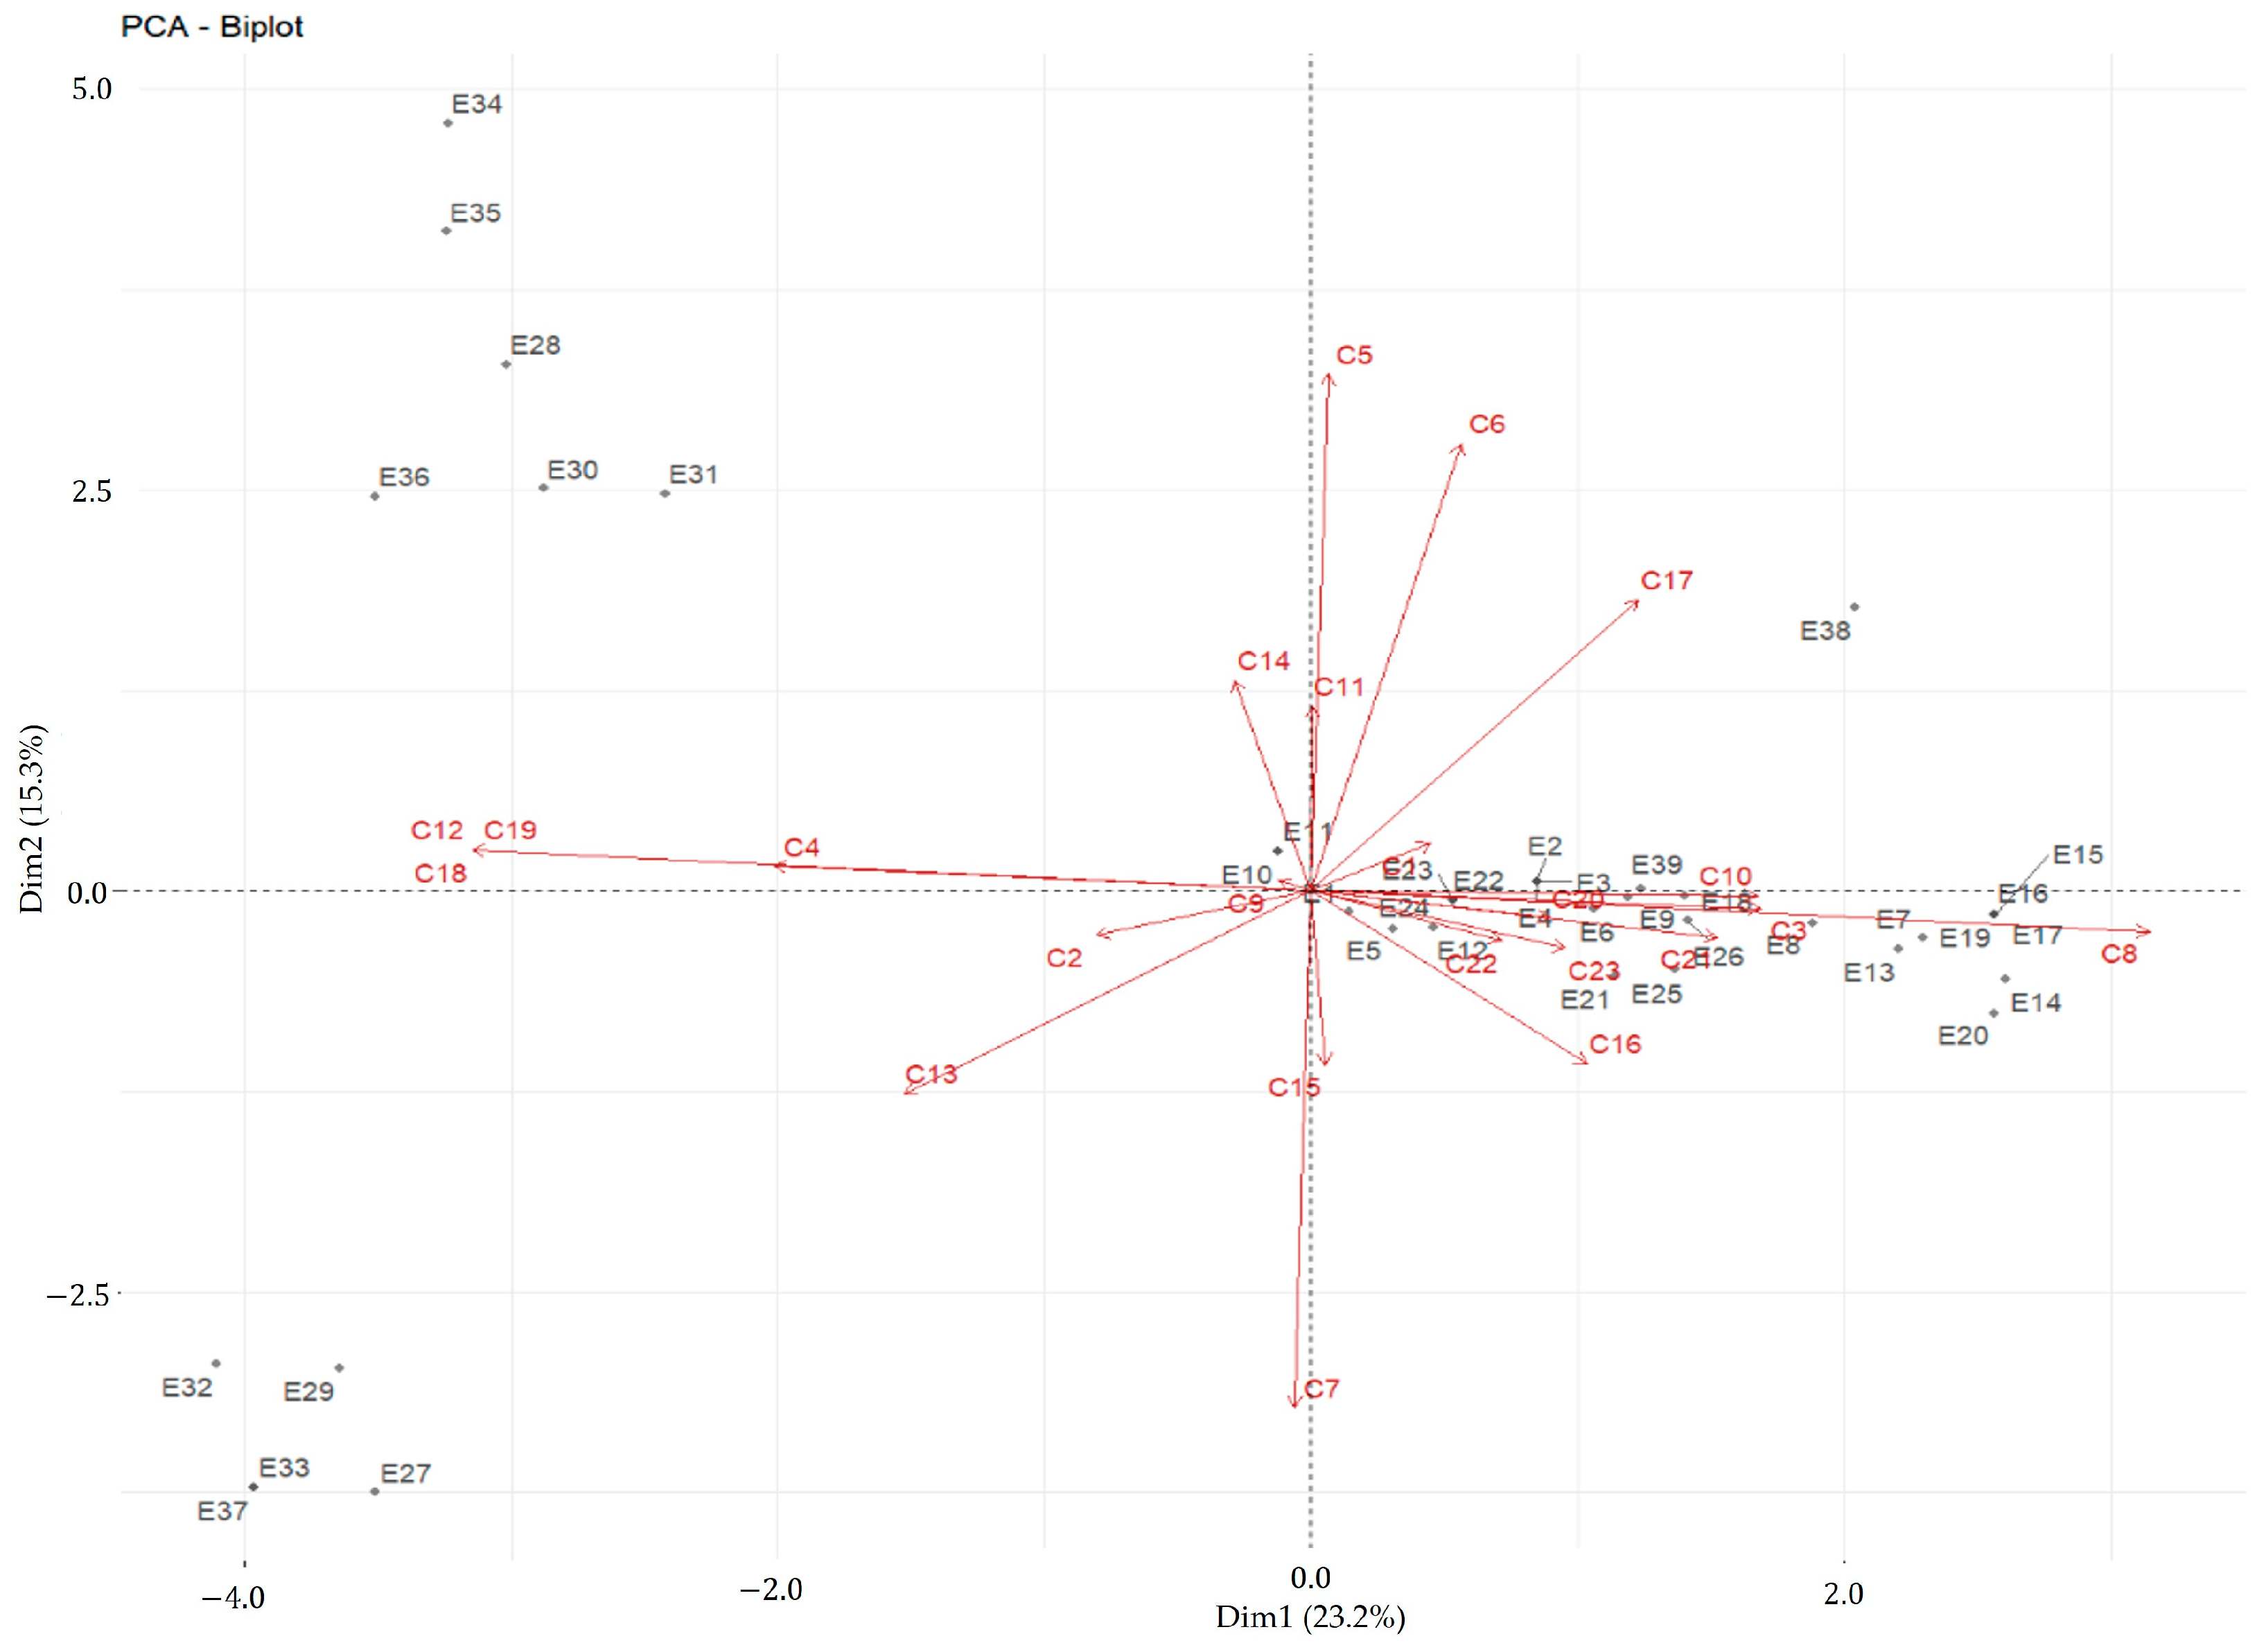
Figure 6 shows the rating matrix completed by remote student S7, which served as the basis for the principal component analysis (PCA) results displayed in Figure 7. The first two principal components accounted for 38.5% of the total variance (PC1 = 23.2%, PC2 = 15.3%; cumulative PC1–PC5 = 69.5%), indicating a looser, higher-dimensional map than that of urban student S1.
PC1, the first principal component, sets apart ideas that emphasize observable mixtures and physical state changes from those that emphasize pure, single-type substances and chemical reactions. Positive loadings gather constructs such as C8 (is a mixture), C3 (is a physical change), C10 (is a phase change), C21 (produces a change in appearance), and C17 (is a gas). Correspondingly, items such as melting, condensation, solidification, evaporation, and sublimation plot on the positive side, showing that student S7 thinks of these phase-transition events as being closely related. On the negative side, the component pulls together constructs that signal a single, pure composition or an underlying chemical transformation—for example, C12 (contains only one type of atom), C18 (contains different atoms), C19 (contains different molecules), C4 (is a chemical change), and C13 (is composed of different atoms). Substances such as copper, diamond, oxygen, and hydrogen therefore receive negative PC1 scores. In summary, this axis shows that S7 organizes knowledge primarily around readily visible processes, placing less emphasis on the microscopic criteria that separate mixtures from pure substances.
PC2, the second component, separates concepts that describe chemically pure or elemental materials from those that describe compounds or properties tied to a specific physical state. High positive loadings include C5 (is a pure substance), C6 (is an element), C17 (is a gas), C14 (the different atoms in the composition have a fixed ratio), and C11 (is a change among the three states of matter). Items at this positive extreme—such as oxygen, hydrogen, copper, diamond, and mercury—represent elemental gases or solids that S7 apparently regards as archetypes of purity. In contrast, negative loadings include constructs such as C7 (is a compound), C13 (is composed of different atoms), C15 (is a solid), C16 (is a liquid), and C23 (releases heat during the process). Examples with large negative scores, therefore, are composite or state-entangled substances whose identity depends on their specific phase or on bond-breaking reactions. The combination of these two ends of the scale suggests that S7 sees a divide between chemically simple, ‘pure’ entities and more complex materials with a composition or behavior that changes with state—yet the presence of overlaps (for instance, the gas construct loading on both axes) signals lingering confusion about how purity, elemental status, and physical state are related.
Compared to the urban student S1, whose PCA results demonstrated a more integrated cognitive structure, with the first two components explaining 47.9% of variance (PC1: 29.8%; PC2: 18.1%), and clear dichotomies—PC1 emphasizing multi-type vs. single-type compositions and PC2 distinguishing chemical/identity vs. physical/phase changes—the remote student S7 exhibited a less cohesive framework, with only 38.5% variance explained (PC1: 23.2%; PC2: 15.3%). S7’s PC1 blended mixtures/physical changes (positive loadings on C8, C3, C10, etc.) with single-type/chemical transformations (negative on C12, C18, C19, etc.), prioritizing dynamic, observable processes (e.g., positive elements such as E14–E19 for phase transitions) over precise microscopic distinctions, contrasting with S1’s focused compositional continuum. Similarly, S7’s PC2 opposed pure/elemental status (positive for C5, C6, C17, etc., with elements such as E34 and E35 at the extreme) and compound/state traits (negative on C7, C13, C15, etc.), but with overlaps (e.g., C17 loading positively on both axes), indicating conceptual fragmentation and inconsistent gas-related perceptions, unlike S1’s sharper perceptual divides. This disparity underscores potential urban–remote differences in experiential resources, fostering greater conceptual integration in S1 while yielding more sensory-driven, fragmented mappings in S7.
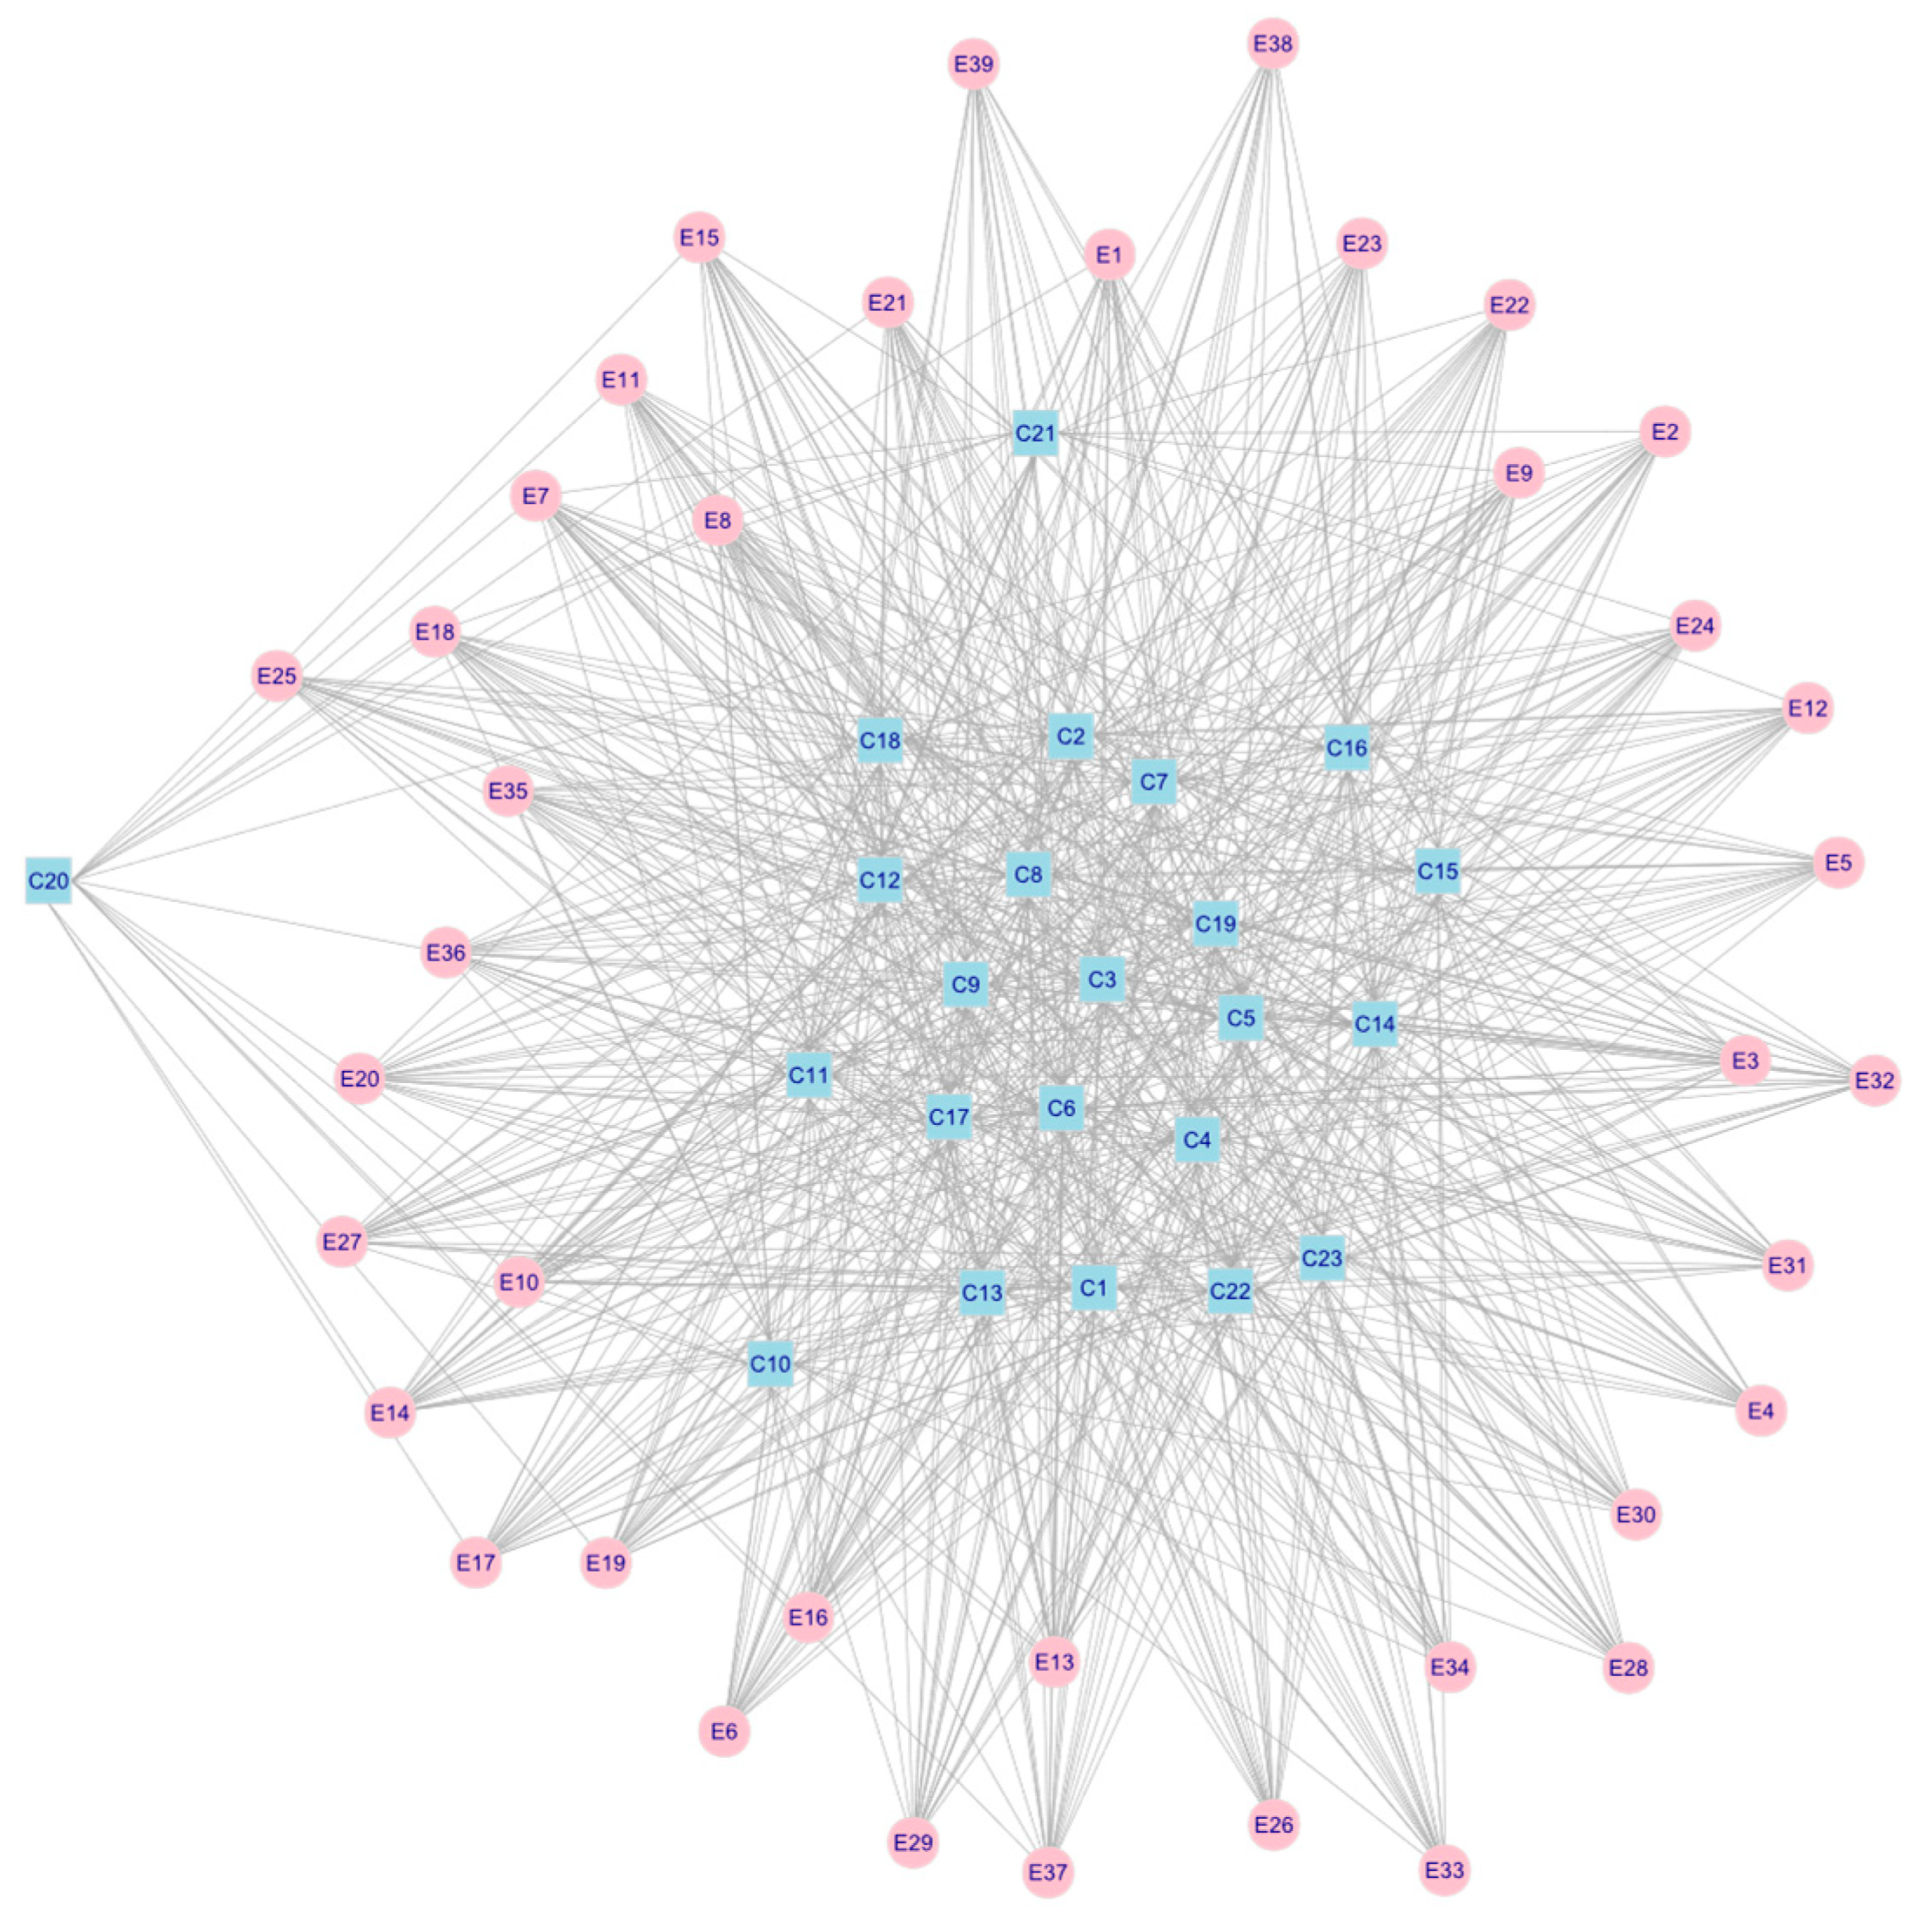
Complementing the PCA, the two-mode clustering results (as shown in Figure 8) provide a visualization of this remote student’s (S7) cognitive structure regarding matter-related concepts by simultaneously grouping elements and constructs into interconnected clusters. However, unlike more integrated profiles—such as the urban case of S1, where matter-related concepts are systematically organized into three distinct clusters—this bipartite network reveals a fragmented pattern with no clear major clusters; instead, it displays multiple small, dispersed subgroups, indicating loose associations and limited cohesion across domains. This dispersed structure not only echoes the PCA findings of perceptual overlaps but also underscores pronounced conceptual fragmentation at the individual level, potentially stemming from constrained experiential opportunities in remote environments, resulting in rural students demonstrating a less unified organization of knowledge compared to their urban counterparts.
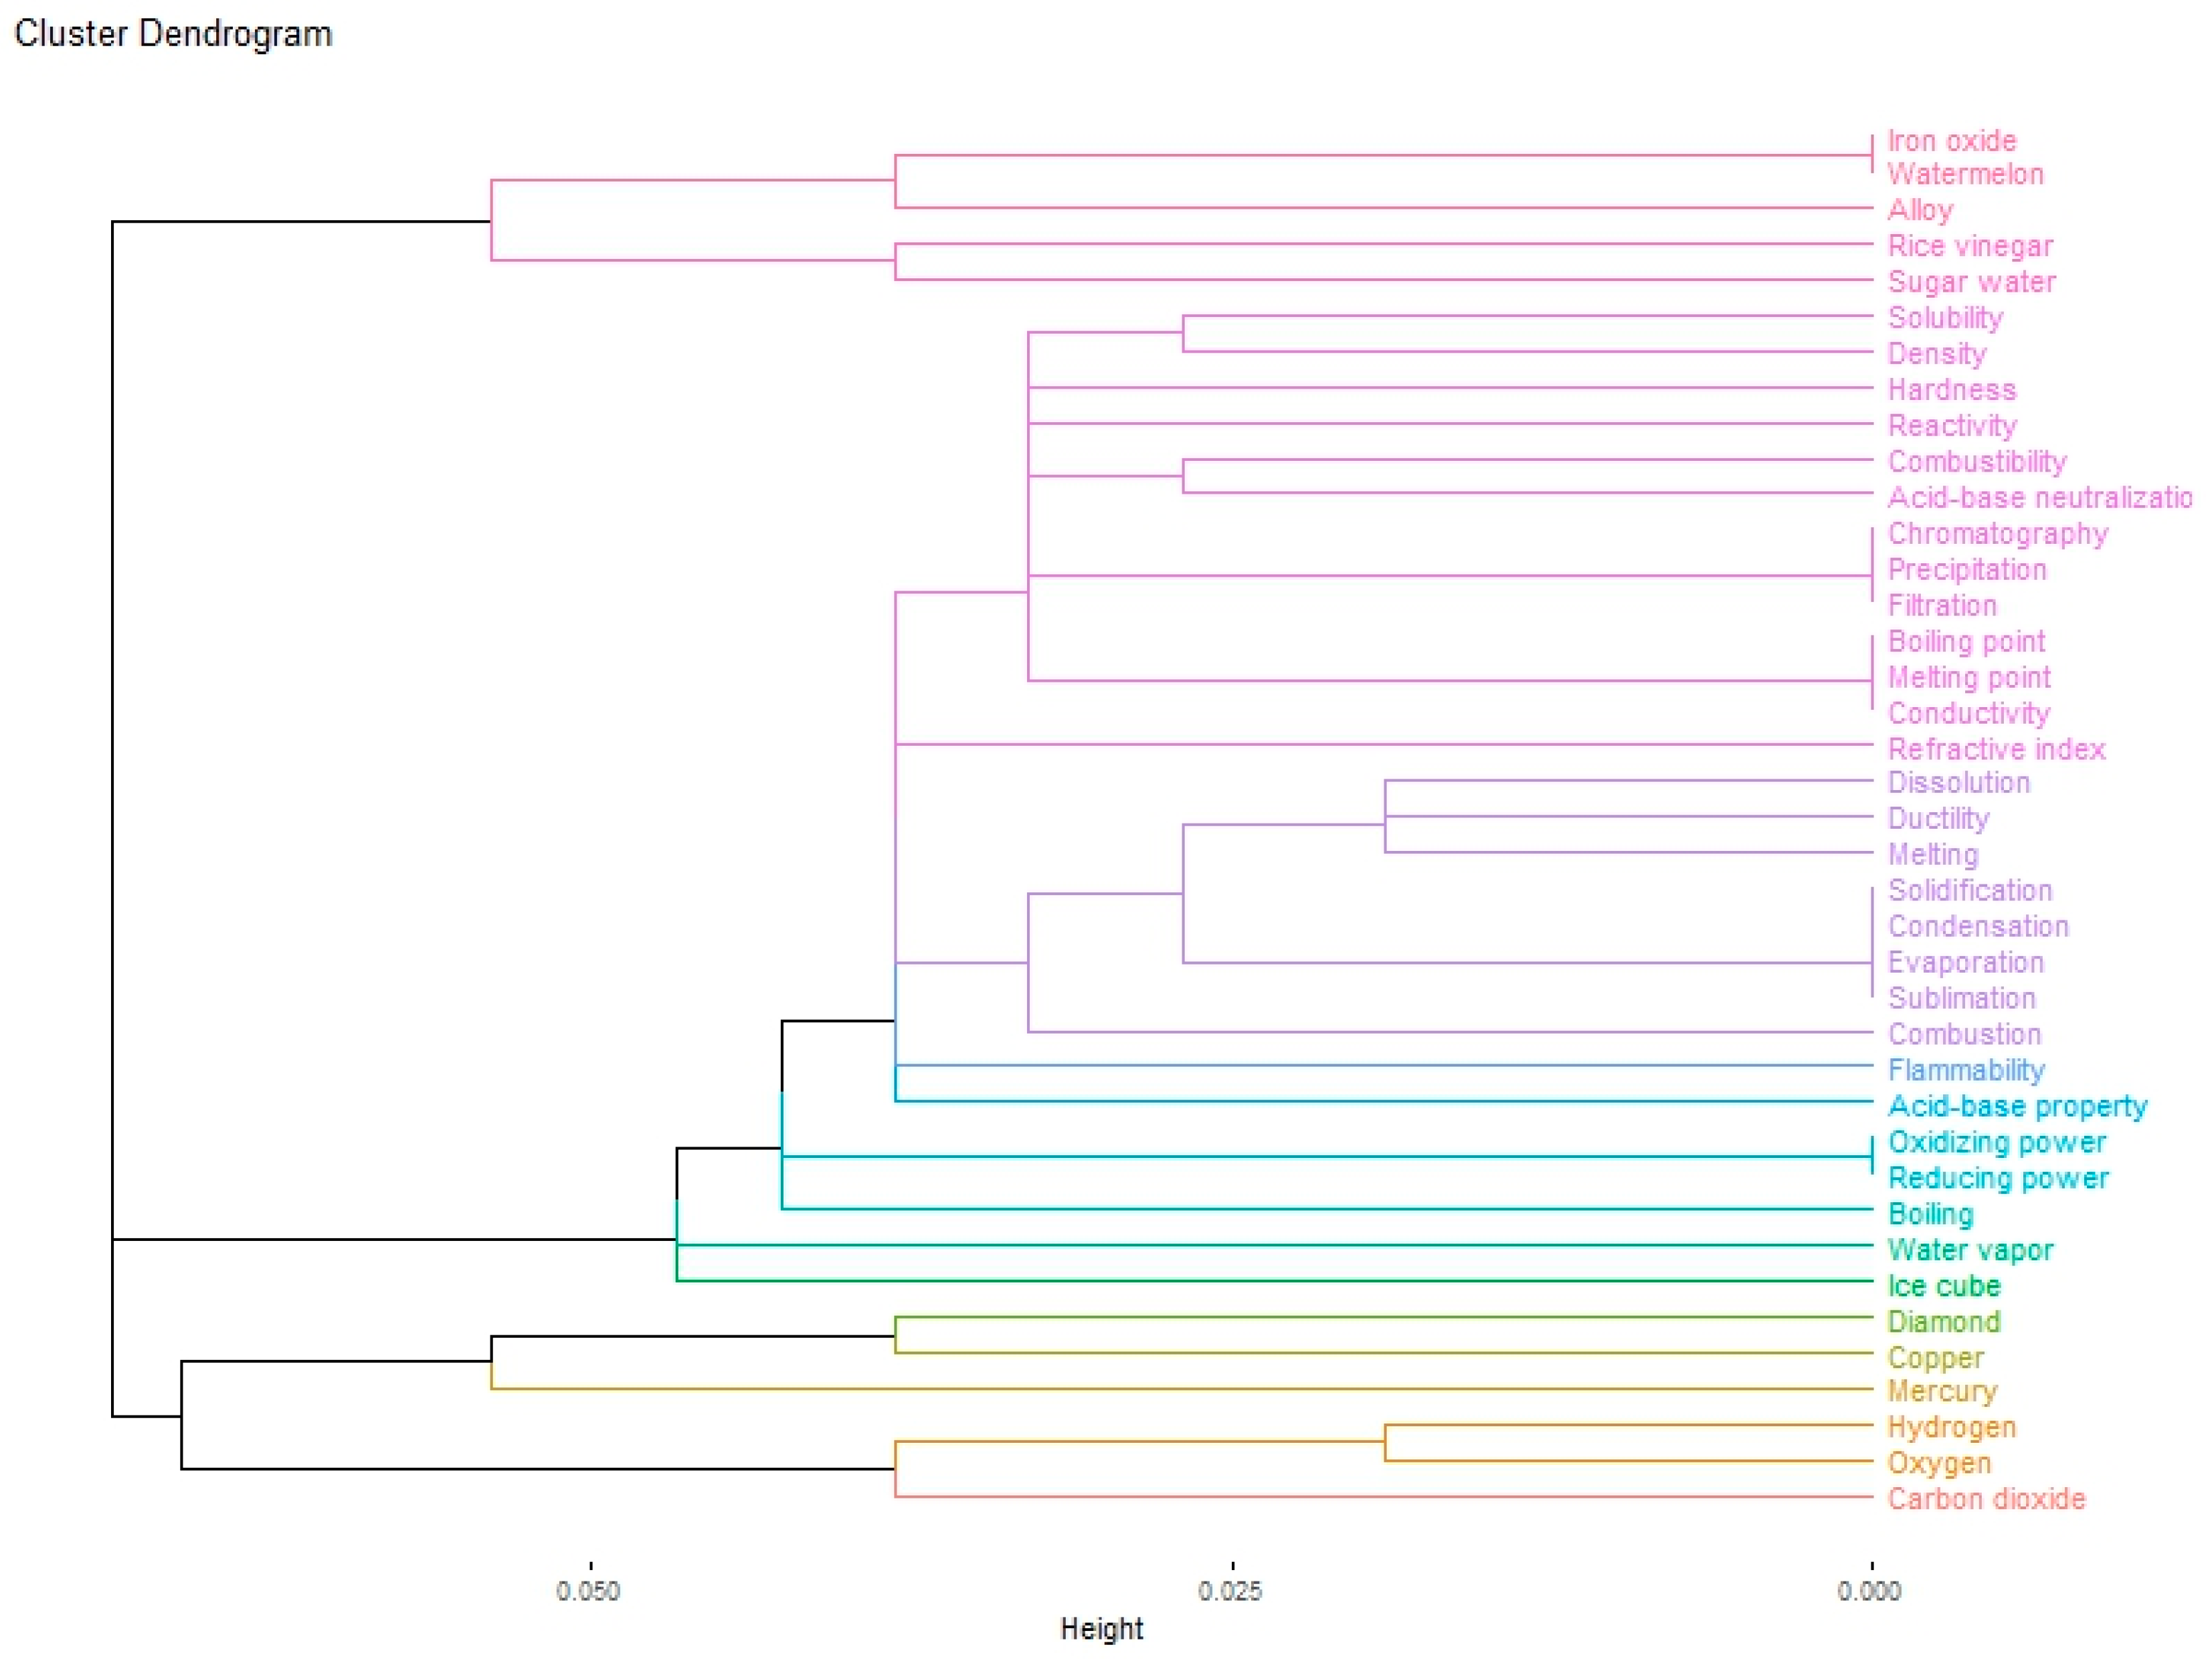
In addition, based on follow-up interviews with S7 and the corresponding science teacher to interpret subclusters, the dendrogram in Figure 9 portrays S7’s matter knowledge as partly expert-like yet notably fragmented. Below, we synthesize the dendrogram evidence to highlight three key features of S7’s knowledge organization: fragmentation, associative (non-hierarchical) categorization, and embedded misconceptions.
  • Fragmentation. Similarity structures derived from the rating matrix yield three broad—but dispersed—blocks, with branch heights (dissimilarity) remaining high between putative modules; this is visible in multiple isolated branches and weak cross-links—for example, iron oxide sits scattered near mixtures without tight cohesion—contrasting with the more unified, hierarchical organization seen in the urban profile S1.
  • Associative (non-hierarchical) categorization. The cluster content suggests associative linkages driven by surface/sensory cues rather than rule-governed taxonomies: the upper purple block loosely ties mixtures/solutions (e.g., watermelon, alloy, rice vinegar, sugar water) to laboratory properties and separation methods (solubility, density, hardness, reactivity, conductivity, refractive index, dissolution, ductility, filtration, chromatography, precipitation, boiling/melting point), implying a heuristic of “multi-component items identified via properties/separations” and not composition-first classification. A mid-level blue–green block aggregates processes/changes (melting, solidification, condensation, evaporation, sublimation, combustion) alongside reactivity cues (acid–base, oxidizing/reducing power, flammability), indicating a clean but associative separation of “process” from “property”, often organized based on visible energy or appearance. A bottom yellow–green block groups single/pure substances and states (e.g., ice cube, water vapor, diamond, copper, mercury, hydrogen, oxygen, carbon dioxide), frequently near boiling, hinting at a state/single-substance perspective with subgroups (e.g., diamond–copper–mercury) that resemble contextual affinities rather than superordinate categories in a hierarchy.
  • Misconceptions. The structure exposes mixture–compound confusion—e.g., iron oxide drawn toward alloys/solutions, consistent with a “contains different atoms ⇒ multi-component” rule that overrides criteria such as fixed composition or physical separability (Johnson, 2000). Processes are prioritized over substance identity—e.g., combustion intermingled with phase changes—reflecting sensory-driven errors in distinguishing physical vs. chemical change (Stavy & Stachel, 1985; Talanquer, 2009). Finally, representational heuristics appear to overshadow particulate reasoning, e.g., regarding H2O forms (ice cube, steam) as “not pure” because they “contain different atoms”, rather than as the same pure substance across states (Nakhleh et al., 2005).
Overall, S7’s organization aligns partially with scientific taxonomies but maintains scattered macro–micro links, a pattern plausibly shaped by curriculum sequencing (composition/separation → properties/detection → phase changes → reactivity) and experiential constraints that amplify transitional comprehension difficulties (Hadenfeldt et al., 2014). Relative to urban peers (e.g., S1), the result is a less hierarchical, more association-driven structure, which likely impedes equitable progression toward integrated, rule-based scientific categorization.
3.
Reappraising RGT and Aggregation
For the aggregated group comparisons, we used consensus matrices—formed by averaging repertory grid ratings across students within each subgroup—to generate two-mode (construct–element) clustering results. These are visualized as bipartite networks in Figure 10 (urban school) and Figure 11 (remote school). In each network, blue squares represent construct clusters (C1–C20), pink circles represent elements (E1–E36), and lines (edges) indicate strong co-occurrence between a construct and an element in students’ top ratings. The spatial arrangement of nodes and the density of connections provide a visual representation of how concepts are organized at the group level.
In the urban school’s network (Figure 10), a prominent and highly interconnected central cluster links together constructs and elements from multiple conceptual domains, including composition (e.g., C5–C8, C12–C14 connected to E27–E30, E32–E35), properties (e.g., C1–C2 linked with E1–E12, E25–E26), and states/changes (e.g., C3–C4, C10–C11 linked with E13–E21). Peripheral sub-clusters remain strongly tied to this central hub, forming a compact, modular structure. Such a configuration indicates high cohesion and hierarchical integration, meaning that students can connect micro-level composition ideas with macro-level observations through shared conceptual anchors. This pattern parallels the structured and rule-based profile seen in the representative urban case (S1) and is consistent with the idea that resource-rich environments—such as well-equipped laboratories and guided inquiry opportunities—support coherent micro–macro linkages (Hadenfeldt et al., 2014).
In the remote school’s network (Figure 11), the structure is noticeably different. Multiple small sub-clusters are scattered across the layout with fewer and weaker interconnections. Some groupings appear based on surface associations rather than integrated principles—for example, phase change constructs (C3, C10) link to E14–E19 but remain disconnected from key composition constructs, composition-related constructs (C13–C19) connect only to a limited subset of elements (e.g., E27, E32), and properties (C1–C2) appear in isolated pairs with a few elements (e.g., E1, E4). This fragmented structure suggests a reliance on sensory heuristics (Talanquer, 2009) rather than abstract, integrated models, echoing the dispersed profile seen in the remote case (S7). The weaker cross-links limit opportunities to coordinate micro-level particle models with macro-level behaviors, potentially reinforcing misconceptions such as confusing mixtures with compounds or misclassifying physical changes as chemical.
These interpretations are drawn directly from the visible topology of the networks—specifically, the density, centrality, and cross-linking patterns—rather than from separately computed network statistics. Taken together, the visual evidence indicates that the urban group organizes concepts into a unified, interconnected framework, while the remote group exhibits fragmented, loosely associated clusters. The contrast highlights the likely influence of differential learning opportunities: urban students’ broader access to experimental activities and teacher-guided model-based reasoning supports conceptual coherence, whereas remote students’ more limited experiential base may reinforce definition lists and surface associations.
4.
Group-level comparison: urban vs. remote cognitive structures
For the aggregated data, group-level cognitive structures are further quantified by calculating the average “importance” rating for each construct cluster using the Honey index (Rojon et al., 2019). Figure 12 presents these mean values as a heatmap, in which darker shades and larger numbers represent greater perceived importance. Examining the heatmap row by row shows that both Group A (urban) and Group B (remote) assign their highest ratings to two thematic areas: composition/ratio (e.g., C12: contains only one type of atom; C13: composed of different atoms; C14: fixed ratio of different atoms; C18: contains different atoms) and states/changes (e.g., C10: phase change; C11: change among the three states of matter). For instance, while both groups rate C12 and C14 highly, these constructs receive substantially higher scores in Group B (C12: 346.6 vs. 220.7; C14: 349.4 vs. 220.7). Such patterns indicate the presence of a common conceptual “core” across groups but also suggest differences in how strongly each group emphasizes particular constructs.
However, the heatmap also reveals systematic differences in how these themes are weighted. Group B’s ratings are consistently higher than Group A’s across most clusters (overall Δ= 122.9), with especially pronounced peaks for purity/fixed-ratio constructs (C12, C14) and higher values for phase-change constructs (e.g., C10: 344.7 vs. 226.9; C11: 349.7 vs. 225.7). In contrast, Group A shows a broader coverage of clusters but distributes its weights less evenly (Coverage_A = 13 vs. Coverage_B = 8; Evenness_B = 0.98 > Evenness_A = 0.94). In other words, the remote group concentrates uniformly high salience on a narrower set of clusters, whereas the urban group spreads attention across more clusters with a greater differentiation of weights. This pattern is consistent with a narrower and less integrated use of concepts for Group B and with greater integration between compositional criteria and reasoning regarding physical and chemical changes for Group A.
Figure 13 translates these same data into a bipartite network, where square nodes represent groups and circle nodes represent construct clusters. The thickness of each connecting line (edge) reflects how often a cluster appeared among the group’s most important (“Top”) constructs, while the color intensity of each circle indicates its average importance rating. Both groups connect to a largely overlapping set of clusters (Jaccard = 0.63), consistent with the shared thematic core observed in the heatmap. However, the network layout shows that Group B’s connections are concentrated in a smaller number of clusters (Coverage = 8) with a highly uniform edge thickness (Evenness = 0.98), while Group A connects to a larger set (Coverage = 13) with more variation in edge thickness, reflecting broader—but less even—emphasis across clusters.
These quantitative patterns align with the qualitative evidence from individual and aggregated network readings: the remote group concentrates uniformly high salience on fewer clusters and shows limited variation in connections—indicative of narrower, less integrated use of concepts—whereas the urban group exhibits broader coverage and more differentiated weights, consistent with greater integration between compositional knowledge and process-oriented reasoning.

5. Discussion

This explanatory–sequential mixed-methods study identified substantial urban–remote disparities in the science performance of Taiwanese eighth-grade students, with 26 items (12.3% of 211) from the TIMSS 2019 science assessment exhibiting DIF that disadvantaged remote learners. The quantitative phase, using Mantel–Haenszel statistics and logistic regression, showed that these biases were most pronounced in constructed-response formats (18.27% of 104 constructed-response items) and the applying cognitive domain (13.75% of 80 items), with a significant concentration among the 26 DIF items in matter-related topics: 36.36% in Composition of Matter, 25.00% in Physical States and Changes in Matter, and 14.29% in Properties of Matter. This concentration suggests that remote students, despite comparable underlying ability, face item-level barriers due to experiential limitations, such as limited laboratory access, which impair their ability to apply abstract concepts such as particle behavior to practical scenarios. For example, constructed-response items in matter-related domains—such as explaining phase changes, for example, melting—often correlate with familiarity from hands-on experiments, which are more common in urban settings, reflecting resource shortages in remote schools, as noted by Huang (2024). This underscores how a lack of practical exposure hinders performance, particularly in matter-related topics requiring micro–macro integration, aligning with prior research showing that limited laboratory resources, fewer qualified teachers, and reduced informal science experiences in remote areas hinder conceptual integration (Hill et al., 2018; Ingersoll & Tran, 2023). These results extend this literature by pinpointing cognitive fragmentation as a mechanism through which such resource gaps manifest at the item level.
Our qualitative analysis of think-aloud interviews and repertory grids with 12 students (6 urban, 6 remote) provided deeper insights into these disparities. Remote learners exhibited fragmented, associative cognitive structures, characterized by reliance on macroscopic observations (e.g., “Ice melts because it gets wetter, like water spreading”), terminological confusion (e.g., conflating “mixture” with “compound”), microscopic gaps (e.g., an inability to invoke particle models), and persistent misconceptions (e.g., attributing properties such as color to individual atoms). In contrast, urban students displayed hierarchical integration, linking observable phenomena to particulate explanations (e.g., “Melting involves particles gaining energy and spacing out”). Triangulation across methods indicates that experiential constraints—limited exposure to laboratories and inquiry-based activities—impede remote students’ development of cohesive conceptual frameworks, perpetuating the 45-point aggregate gap observed in TIMSS 2019 (Chang et al., 2021). This interpretation aligns with the quantitative DIF patterns, where matter-domain items demand the very micro–macro that connections remote students lack, as remote grids showed lower clustering coherence. The mixed-methods design effectively combined quantitative precision with qualitative depth (Creswell & Plano Clark, 2017), using repertory grids, PCA, and bipartite network visualizations to reveal urban students’ hierarchical integration versus remote students’ sensory-driven associations. This associative organization, reinforced by memorization-based instruction and limited opportunities to connect microscopic models with macroscopic phenomena, reflects incomplete conceptual progression (Hadenfeldt et al., 2014; Talanquer, 2009).
These findings connect directly to established theories in science education and cognitive psychology. Drawing on Personal Construct Psychology (Kelly, 1991), the repertory grids reveal how remote students’ bipolar constructs (e.g., “visible vs. invisible” over “stable vs. reactive”) form associative rather than hierarchical networks, reflecting constrained personal experiences. This is supported by experiential learning theory (Kolb, 2014), where concrete experiences (e.g., laboratory manipulations) drive abstract conceptualization, a cycle facilitated for urban students but disrupted for their remote peers by resource gaps. Observed misconceptions—such as conflating mixtures with compounds, viewing dissolution as a chemical change, or attributing macroscopic properties directly to particles—parallel the DIF patterns and are well documented in the science education literature (Johnson, 2000; Zarkadis et al., 2020). The domain-specific nature of the DIF also mirrors studies using DIF to identify science misconceptions (Joo et al., 2022; Soeharto & Csapó, 2021), but here, cognitive-structural differences, rather than cultural or linguistic factors, emerge as primary drivers in Taiwan’s homogeneous language context. Bias in constructed-response items supports earlier findings that these formats often assume experiential contexts more common in urban settings (Gess et al., 2017; Scheuneman & Gerritz, 1990).
Practically, the findings have implications for equitable science education policy and pedagogy in Taiwan and in similar contexts. The 26 disadvantaging items highlight the need for item redesign in assessments such as TIMSS to minimize locale-based biases, such as incorporating culturally neutral prompts for matter concepts. For remote schools, targeted interventions could include digital simulations and virtual laboratories to simulate hands-on experiences, bridging the micro–macro gap (Yezierski & Birk, 2006), alongside sequential scaffolding from macroscopic to microscopic concepts and analogy-driven exercises to promote hierarchical thinking (Novak, 1990). Teacher professional development in inquiry-based teaching, emphasizing construct elicitation techniques such as RGT, could foster integration, as recommended by UNESCO & International Task Force on Teachers for Education 2030 (2024), to address teacher shortages. Policy-wise, reallocating resources—such as subsidized mobile laboratories, as implemented in rural China (Wang et al., 2024)—could reduce the TIMSS gap, supported by Chi’s ICAP framework (Chi & Wylie, 2014) for designing interactive activities to restructure fragmented knowledge. These measures promote inclusivity and align with Sustainable Development Goal 4.
Overall, the study advances understanding by linking DIF in matter-related domains directly with cognitive fragmentation, highlighting the need for targeted, evidence-based interventions to address systemic inequities in science learning.

6. Conclusions

Our analysis of the TIMSS 2019 Grade 8 science assessment identified 26 items exhibiting DIF that disproportionately disadvantaged remote Taiwanese students, particularly in matter-related domains (“Composition of Matter” at 36.36%, “Physical States and Changes in Matter” at 25.00%, and “Properties of Matter” at 14.29%) and in applying cognitive domain (13.75%) and constructed-response formats (18.27%). This pattern underscores that remote students, despite possessing comparable underlying ability, face item-level challenges rooted in experiential limitations, such as limited laboratory access and fewer qualified teachers, which impair their ability to apply abstract concepts. Qualitative evidence from think-aloud interviews and repertory grids revealed that remote students’ fragmented, associative cognitive structures—unlike the hierarchical integration of their urban peers—impede connections between micro- and macro-level concepts, explaining the DIF patterns observed. This cognitive disparity, perpetuating the 45-point aggregate performance gap (Chang et al., 2021), stems from systemic resource inequities, including fewer qualified teachers and reduced informal science exposure, as noted by Huang (2024) and Hill et al. (2018). The inability to bridge micro and macro connections, essential in mastering matter concepts such as phase changes or particle behavior, exacerbates their struggle with constructed-response items that assume practical familiarity, which is more prevalent in urban settings.
These findings highlight the critical role of equitable resource allocation in mitigating such disadvantages. Targeted interventions—such as virtual laboratories to simulate hands-on experiences, teacher training in inquiry-based methods, and policy reforms to deploy mobile science units (Wang et al., 2024)—could address these barriers, potentially reducing DIF-related disparities by enhancing remote students’ conceptual frameworks. This study’s mixed-methods approach, combining DIF analysis with cognitive mapping, offers a robust foundation for identifying and addressing these inequities, advancing science education equity in Taiwan and beyond. Future efforts should build on this by exploring longitudinal impacts and cross-cultural comparisons to refine these strategies further.

6.1. Implications

International large-scale assessment databases (e.g., TIMSS), when integrated into DIF analysis, can effectively diagnose issues in educational equity. Methodologically, combining repertory grids with analytics (e.g., PCA, clustering, bipartite graphs) objectifies cognitive structures, revealing remote learners’ fragmentation and strengthening mixed-methods bias analysis (Borgatti, 2009; Borgatti & Everett, 1997). Policy and practice implications include virtual laboratories/simulations for hands-on approximation and micro–macro bridging (Yezierski & Birk, 2006); place-based pedagogy for local relevance (Mullis et al., 2020); assessment recalibration via diversified formats, glossaries, and diagnostics (Osborne & Cosgrove, 1983; Nakhleh et al., 2005); Chi’s ICAP framework for the active reorganization of structures (Chi, 2009; Chi & Wylie, 2014); and Novak’s concept mapping for hierarchical scaffolding and misconception correction (Novak, 1990; Novak & Gowin, 1984). These adaptable strategies mitigate DIF and promote equitable science education.

6.2. Limitations and Future Suggestions

Despite its contributions, this study is subject to several limitations that warrant consideration. The qualitative sample size of 12 students, while sufficient for in-depth exploration, is nonetheless small, which may limit generalizability, particularly given the purposive sampling approach focused on urban–remote contrasts. The reliance on secondary TIMSS data, although advantageous for accessing large-scale insights, restricts the analysis to pre-existing variables and may overlook contextual nuances specific to Taiwan’s evolving curriculum. Moreover, the study’s Taiwan-specific focus, while providing targeted policy relevance, restricts broader applicability to other cultural or educational contexts, potentially missing global patterns.
Future research could address these limitations by adopting longitudinal mixed-methods designs that track student progress across multiple domains and grade levels, enabling a more dynamic understanding of how DIF evolves over time. Expanding the scope to include comparative analyses with other countries would enhance cross-cultural insights, while incorporating primary data collection—such as direct classroom observations—could enrich interpretations of experiential factors. Such extensions could further refine strategies for mitigating urban–remote disparities in science education, potentially targeting specific DIF reductions based on the outcomes of this pilot study.

Author Contributions

Conceptualization, K.-M.C. and T.-H.J.; methodology, K.-M.C. and T.-H.J.; software, T.-H.J.; validation, K.-M.C., T.-H.J. and Y.-W.S.; formal analysis, T.-H.J. and K.-M.C.; investigation, K.-M.C. and T.-H.J.; data curation, K.-M.C., T.-H.J.; writing—original draft preparation, K.-M.C., T.-H.J.; writing—review and editing, K.-M.C., T.-H.J. and Y.-W.S.; visualization, T.-H.J. and K.-M.C.; project administration, K.-M.C.; funding acquisition, K.-M.C. All authors have read and agreed to the published version of the manuscript.

Funding

This research was funded by the National Academy for Educational Research, Taiwan R.O.C. [grant number NAER-2022-022-E-2-1-C2-01].

Institutional Review Board Statement

The study protocol was approved by the National Taiwan Normal University Research Ethics Committee (REC Number 202208ES011; approval date: 30 August 2022).

Informed Consent Statement

All participants and their legal guardians provided written informed consent prior to participation.

Data Availability Statement

At this stage, the datasets underlying this article cannot be shared because the research is still in progress. Upon completion of the study, the dataset will be centrally managed or publicly released in accordance with the policies of the National Academy for Educational Research (NAER).

Acknowledgments

The authors gratefully acknowledge support from the NAER project “Exploring Equity in Educational Practices for Socioculturally Disadvantaged Students Based on DIF of Large-Scale Competency-Based Assessments”.

Conflicts of Interest

The authors declare no conflicts of interest. The funders had no role in the design of the study; in the collection, analyses, or interpretation of data; in the writing of the manuscript; or in the decision to publish the results.

Abbreviations

The following abbreviations are used in this manuscript:
DIFdifferential item functioning
RGTrepertory grid technique
IRTitem response theory
PCMpartial credit model
PCAprinciple component analysis
UNESCOUnited Nations Education Scientific and Cultural Organization
TIMSSTrends in International Mathematics and Science Study

Appendix A

Table A1 provides the full list of constructs and elements referenced in tables and figures. Constructs are denoted with codes starting with C, and elements are denoted with codes starting with E.
Table A1. Codebook of elements and constructs used in the RGT.
Elements (E)Constructs (C)
E1—density
E2—melting point
E3—boiling point
E4—conductivity
E5—solubility
E6—hardness
E7—ductility
E8—flammability
E9—acid-base property
E10—reducing power
E11—oxidizing power
E12—reactivity
E13—dissolution
E14—melting
E15—condensation
E16—solidification
E17—evaporation
E18—boiling
E19—sublimation
E20—combustion
E21—acid-base neutralization
E22—precipitation
E23—chromatography
E24—filtration
E25—combustibility
E26—refractive index
E27—sugar water
E28—copper
E29—rice vinegar
E30—diamond
E31—mercury
E32—alloy
E33—watermelon
E34—oxygen
E35—hydrogen
E36—carbon dioxide
E37—iron oxide
E38—water vapor
E39—ice cube
C1—is a physical property
C2—is a chemical property
C3—is a physical change
C4—is a chemical change
C5—is a pure substance
C6—is an element
C7—is a compound
C8—is a mixture
C9—is a method for separating mixtures
C10—is a phase change
C11—is a change among the three states of matter
C12—contains only one type of atom
C13—is composed of different atoms
C14—The different atoms in the composition have a fixed ratio
C15—is a solid
C16—is a liquid
C17—is a gas
C18—contains different atoms
C19—contains different molecules
C20—produces a change in essence
C21—produces a change in appearance
C22—absorbs heat during the process
C23—releases heat during the process

References

  1. Amini, C., & Nivorozhkin, E. (2015). The urban–rural divide in educational outcomes: Evidence from Russia. International Journal of Educational Development, 44, 118–133. [Google Scholar] [CrossRef]
  2. Appels, L., De Maeyer, S., & Van Petegem, P. (2024). Re-thinking equity: The need for a multidimensional approach in evaluating educational equity through TIMSS data. Large-Scale Assessments in Education, 12(1), 38. [Google Scholar] [CrossRef]
  3. Bar, V., & Galili, I. (1994). Stages of children’s views about evaporation. International Journal of Science Education, 16(2), 157–174. [Google Scholar] [CrossRef]
  4. Benjamini, Y., & Hochberg, Y. (1995). Controlling the false discovery rate: A practical and powerful approach to multiple testing. Journal of the Royal Statistical Society: Series B (Methodological), 57(1), 289–300. [Google Scholar] [CrossRef]
  5. Berk, R. A. (1982). Handbook of methods for detecting test bias. Johns Hopkins University Press. [Google Scholar]
  6. Borgatti, S. P. (2009). Social network analysis, two-mode concepts in. In R. A. Meyers (Ed.), Encyclopedia of complexity and systems science (pp. 8279–8291). Springer. [Google Scholar] [CrossRef]
  7. Borgatti, S. P., & Everett, M. G. (1997). Network analysis of 2-mode data. Social Networks, 19(3), 243–269. [Google Scholar] [CrossRef]
  8. Buck, G. A., Chinn, P. W. U., & Upadhyay, B. (2023). Science education in urban and rural contexts: Expanding on conceptual tools for urban-centric research. In N. G. Lederman, D. L. Zeidler, & J. S. Lederman (Eds.), Handbook of research on science education: Volume III (1st ed.). Routledge. [Google Scholar] [CrossRef]
  9. Cao, G., & Huo, G. (2025). Reassessing urban-rural education disparities: Evidence from England. Educational Studies, 1–20. [Google Scholar] [CrossRef]
  10. Chai, C.-W., Hung, M.-K., & Lin, T.-C. (2023). The impact of external resources on the development of an indigenous school in rural areas: Taking a junior high school in Taiwan as an example. Heliyon, 9(12), e22073. [Google Scholar] [CrossRef] [PubMed]
  11. Chang, C.-Y., Lee, C.-D., Lin, P.-J., Chang, M.-Y., Tsao, P.-S., Yang, W.-J., Hsiao, J.-T., & Chang, W.-N. (2021). Taiwan’s mathematics and science education in TIMSS 2019: Executive summary of the national report for Taiwan. Available online: http://www.sec.ntnu.edu.tw/timss2019/downloads/T19TWNexecutive.pdf (accessed on 1 July 2025).
  12. Chen, Y.-H. (2012). Cognitive diagnosis of mathematics performance between rural and urban students in Taiwan. Assessment in Education: Principles, Policy & Practice, 19(2), 193–209. [Google Scholar] [CrossRef]
  13. Chi, M. T. H. (2009). Active-Constructive-Interactive: A conceptual framework for differentiating learning activities. Topics in Cognitive Science, 1(1), 73–105. [Google Scholar] [CrossRef] [PubMed]
  14. Chi, M. T. H., & Wylie, R. (2014). The ICAP framework: Linking cognitive engagement to active learning outcomes. Educational Psychologist, 49(4), 219–243. [Google Scholar] [CrossRef]
  15. Creswell, J. W., & Plano Clark, V. L. (2017). Designing and conducting mixed methods research (3rd ed.). Sage. [Google Scholar]
  16. Csárdi, G., Nepusz, T., Müller, K., Horvát, S., Traag, V., Zanini, F., & Noom, D. (2025). igraph for R: R interface of the igraph library for graph theory and network analysis (v2.1.4). Zenodo. [Google Scholar] [CrossRef]
  17. Curry, L. A., Nembhard, I. M., & Bradley, E. H. (2009). Qualitative and mixed methods provide unique contributions to outcomes research. Circulation, 119(10), 1442–1452. [Google Scholar] [CrossRef]
  18. Edmonds, W. A., & Kennedy, T. D. (2017). An applied guide to research designs: Quantitative, qualitative, and mixed methods (2nd ed.). SAGE. [Google Scholar] [CrossRef]
  19. Enchikova, E., Neves, T., Toledo, C., & Nata, G. (2024). Change in socioeconomic educational equity after 20 years of PISA: A systematic literature review. International Journal of Educational Research Open, 7, 100359. [Google Scholar] [CrossRef]
  20. Ericsson, K. A., & Simon, H. A. (1984). Protocol analysis: Verbal reports as data. The MIT Press. [Google Scholar]
  21. Fishbein, B., Foy, P., & Yin, L. (2021). TIMSS 2019 user guide for the international database (2nd ed.). TIMSS & PIRLS International Study Center, Lynch School of Education and Human Development, Boston College and International Association for the Evaluation of Educational Achievement. [Google Scholar]
  22. Fransella, F., Bell, R., & Bannister, D. (2004). A manual for repertory grid technique (2nd ed.). Wiley. [Google Scholar]
  23. Gess, C., Wessels, I., & Blömeke, S. (2017). Domain-specificity of research competencies in the social sciences: Evidence from differential item functioning. Journal for Educational Research Online, 9(2), 11–36. [Google Scholar] [CrossRef]
  24. Gkagkas, V., Petridou, E., & Hatzikraniotis, E. (2025). Attitudes and interest of Greek students towards science. Education Sciences, 15(9), 1171. [Google Scholar] [CrossRef]
  25. Graham, L. (2024). The grass ceiling: Hidden educational barriers in rural England. Education Sciences, 14(2), 165. [Google Scholar] [CrossRef]
  26. Grand-Guillaume-Perrenoud, J. A., Geese, F., Uhlmann, K., Blasimann, A., Wagner, F. L., Neubauer, F. B., Huwendiek, S., Hahn, S., & Schmitt, K.-U. (2023). Mixed methods instrument validation: Evaluation procedures for practitioners developed from the validation of the Swiss Instrument for Evaluating Interprofessional Collaboration. BMC Health Services Research, 23(1), 83. [Google Scholar] [CrossRef] [PubMed]
  27. Hadenfeldt, J. C., Liu, X., & Neumann, K. (2014). Framing students’ progression in understanding matter: A review of previous research. Studies in Science Education, 50(2), 181–208. [Google Scholar] [CrossRef]
  28. Hammersley, M. (2023). Are there assessment criteria for qualitative findings? A challenge facing mixed methods research. Forum Qualitative Sozialforschung/Forum: Qualitative Social Research, 24(1), 1–15. [Google Scholar] [CrossRef]
  29. Happs, J. C., & Stead, K. (1989). Using the repertory grid as a complementary probe in eliciting student understanding and attitudes towards science. Research in Science & Technological Education, 7(2), 207–220. [Google Scholar] [CrossRef]
  30. Hill, P. W., McQuillan, J., Hebets, E. A., Spiegel, A. N., & Diamond, J. (2018). Informal science experiences among urban and rural youth: Exploring differences at the intersections of socioeconomic status, gender and ethnicity. Journal of STEM Outreach, 1(1), 1–12. [Google Scholar] [CrossRef]
  31. Huang, X. (2024). Research on the formation and evolution mechanism of the urban-rural education gap in China. Academic Journal of Humanities & Social Sciences, 7(7), 152–157. [Google Scholar] [CrossRef]
  32. Huang, X., Wilson, M., & Wang, L. (2016). Exploring plausible causes of differential item functioning in the PISA science assessment: Language, curriculum or culture. Educational Psychology, 36(2), 378–390. [Google Scholar] [CrossRef]
  33. Ingersoll, R. M., & Tran, H. (2023). Teacher shortages and turnover in rural schools in the U.S.: An organizational analysis. Educational Administration Quarterly, 59(2), 396–431. [Google Scholar] [CrossRef]
  34. Jankowicz, D. (2004). The easy guide to repertory grids. Wiley. [Google Scholar]
  35. Jen, T.-H., Lee, C.-D., Lo, P.-H., Chang, W.-N., & Chang, C.-Y. (2020). Chinese Taipei. In D. L. Kelly, V. A. S. Centurino, M. O. Martin, & I. V. S. Mullis (Eds.), TIMSS 2019 encyclopedia: Education policy and curriculum in mathematics and science. TIMSS & PIRLS International Study Center, Boston College. Available online: https://timssandpirls.bc.edu/timss2019/encyclopedia/chinese-taipei.html (accessed on 9 June 2025).
  36. Johnson, P. (2000). Children’s understanding of substances, part 1: Recognizing chemical change. International Journal of Science Education, 22(7), 719–737. [Google Scholar] [CrossRef]
  37. Johnston, M. P. (2014). Secondary data analysis: A method of which the time has come. Qualitative and Quantitative Methods in Libraries, 3(3), 619–626. [Google Scholar]
  38. Joo, S., Ali, U., Robin, F., & Shin, H. J. (2022). Impact of differential item functioning on group score reporting in the context of large-scale assessments. Large-scale Assessments in Education, 10(1), 18. [Google Scholar] [CrossRef]
  39. K-12 Education Administration, Ministry of Education. (2021). Standards for classification and recognition of schools in remote areas (Amended 11 March 2021). Ministry of Education, Taiwan. Available online: https://edu.law.moe.gov.tw/LawContent.aspx?id=GL001771 (accessed on 9 July 2025).
  40. Kelly, G. (1991). The psychology of personal constructs: Volume one: Theory and personality (1st ed.). Routledge. [Google Scholar] [CrossRef]
  41. Kish, L., & Frankel, M. R. (1974). Inference from complex samples. Journal of the Royal Statistical Society. Series B (Methodological), 36(1), 1–37. Available online: http://www.jstor.org/stable/2984767 (accessed on 9 July 2025). [CrossRef]
  42. Kolb, D. A. (2014). Experiential learning: Experience as the source of learning and development (2nd ed.). Pearson FT Press. [Google Scholar]
  43. Kryst, E. L., Kotok, S., & Bodovski, K. (2015). Rural/urban disparities in science achievement in post-socialist countries: The evolving influence of socioeconomic status. A Global View of Rural Education: Issues, Challenges and Solutions Part I, 2(4), 60–77. [Google Scholar]
  44. Latapy, M., Magnien, C., & Vecchio, N. D. (2008). Basic notions for the analysis of large two-mode networks. Social Networks, 30(1), 31–48. [Google Scholar] [CrossRef]
  45. Lin, B.-S., & Crawley, F. E., III. (1987). Classroom climate and science-related attitudes of junior high school students in Taiwan. Journal of Research in Science Teaching, 24(6), 579–591. [Google Scholar] [CrossRef]
  46. Lin, Y.-R., Hung, C.-Y., & Hung, J.-F. (2017). Exploring teachers’ meta-strategic knowledge of science argumentation teaching with the repertory grid technique. International Journal of Science Education, 39(2), 105–134. [Google Scholar] [CrossRef]
  47. Liu, R., & Bradley, K. D. (2021). Differential item functioning among English language learners on a large-scale mathematics assessment. Frontiers in Psychology, 12, 657335. [Google Scholar] [CrossRef] [PubMed]
  48. Manning, C., Raghavan, P., & Schütze, H. (2008). Introduction to information retrieval. Cambridge University Press. [Google Scholar] [CrossRef]
  49. Masters, G. N. (1982). A rasch model for partial credit scoring. Psychometrika, 47(2), 149–174. [Google Scholar] [CrossRef]
  50. McCloughlin, T. (2002). Repertory grid analysis as a form of concept mapping in science education research. Irish Educational Studies, 21(2), 25–32. [Google Scholar] [CrossRef]
  51. Mullis, I. V. S., Martin, M. O., Foy, P., Kelly, D. L., & Fishbein, B. (2020). TIMSS 2019 international results in mathematics and science. Available online: https://timssandpirls.bc.edu/timss2019/international-results/ (accessed on 12 December 2024).
  52. Nakhleh, M. B. (1992). Why some students don’t learn chemistry: Chemical misconceptions. Journal of Chemical Education, 69(3), 191. [Google Scholar] [CrossRef]
  53. Nakhleh, M. B., Samarapungavan, A., & Saglam, Y. (2005). Middle school students’ beliefs about matter. Journal of Research in Science Teaching, 42(5), 581–612. [Google Scholar] [CrossRef]
  54. Novak, J. D. (1990). Concept mapping: A useful tool for science education. Journal of Research in Science Teaching, 27(10), 937–949. [Google Scholar] [CrossRef]
  55. Novak, J. D., & Gowin, D. B. (1984). Learning how to learn. Cambridge University Press. [Google Scholar] [CrossRef]
  56. Nyshchuk, A., Nikolaev, S., & Romanov, O. (2023). Methodology for analyzing bitstreams based on the use of the Damerau–Levenshtein distance and other metrics. Cybernetics and Systems Analysis, 59(6), 919–927. [Google Scholar] [CrossRef]
  57. Opesemowo, O. A. G. (2025). Exploring undue advantage of differential item functioning in high-stakes assessments: Implications on sustainable development goal 4. Social Sciences & Humanities Open, 11, 101257. [Google Scholar] [CrossRef]
  58. Osborne, R. J., & Cosgrove, M. M. (1983). Children’s conceptions of the changes of state of water. Journal of Research in Science Teaching, 20(9), 825–838. [Google Scholar] [CrossRef]
  59. Rhinesmith, E., Anglum, J. C., Park, A., & Burrola, A. (2023). Recruiting and retaining teachers in rural schools: A systematic review of the literature. Peabody Journal of Education, 98(4), 347–363. [Google Scholar] [CrossRef]
  60. Robitzsch, A., Kiefer, T., & Wu, M. (2024). TAM: Test analysis modules (R package version 4.2-21). Available online: https://cran.r-project.org/web/packages/TAM (accessed on 3 August 2024).
  61. Rojon, C., McDowall, A., & Saunders, M. N. K. (2019). A novel use of honey’s aggregation approach to the analysis of repertory grids. Field Methods, 31(2), 150–166. [Google Scholar] [CrossRef]
  62. Rozenszajn, R., Kavod, G. Z., & Machluf, Y. (2021). What do they really think? the repertory grid technique as an educational research tool for revealing tacit cognitive structures. International Journal of Science Education, 43(6), 906–927. [Google Scholar] [CrossRef]
  63. Sandilands, D., Oliveri, M. E., Zumbo, B. D., & Ercikan, K. (2013). Investigating sources of differential item functioning in international large-scale assessments using a confirmatory approach. International Journal of Testing, 13(2), 152–174. [Google Scholar] [CrossRef]
  64. Scheuneman, J. D., & Gerritz, K. (1990). Using differential item functioning procedures to explore sources of item difficulty and group performance characteristics. Journal of Educational Measurement, 27(2), 109–131. [Google Scholar] [CrossRef]
  65. Slater, P. (1977). The measurement of intrapersonal space by grid technique (Volume 2): Dimensions of intrapersonal space. Wiley. [Google Scholar]
  66. Soeharto, S., & Csapó, B. (2021). Evaluating item difficulty patterns for assessing student misconceptions in science across physics, chemistry, and biology concepts. Heliyon, 7(11), e08352. [Google Scholar] [CrossRef]
  67. Solano-Flores, G., & Nelson-Barber, S. (2001). On the cultural validity of science assessments. Journal of Research in Science Teaching, 38(5), 553–573. [Google Scholar] [CrossRef]
  68. Stavy, R., & Stachel, D. (1985). Children’s ideas about ‘solid’ and ‘liquid’. European Journal of Science Education, 7(4), 407–421. [Google Scholar] [CrossRef]
  69. Strong, W. L. (2016). Biased richness and evenness relationships within Shannon–Wiener index values. Ecological Indicators, 67, 703–713. [Google Scholar] [CrossRef]
  70. Talanquer, V. (2009). On cognitive constraints and learning progressions: The case of “structure of matter”. International Journal of Science Education, 31(15), 2123–2136. [Google Scholar] [CrossRef]
  71. UNESCO & International Task Force on Teachers for Education 2030. (2024). Global report on teachers: Addressing teacher shortages and transforming the profession. UNESCO. [Google Scholar] [CrossRef]
  72. Van Vo, D., & Csapó, B. (2021). Development of scientific reasoning test measuring control of variables strategy in physics for high school students: Evidence of validity and latent predictors of item difficulty. International Journal of Science Education, 43(13), 2185–2205. [Google Scholar] [CrossRef]
  73. von Davier, M., Foy, P., Martin, M. O., & Mullis, I. V. S. (2020). Examining eTIMSS country differences between eTIMSS data and bridge data: A look at country-level mode of administration effects. In M. O. Martin, M. v. Davier, & I. V. S. Mullis (Eds.), Methods and procedures: TIMSS 2019 technical report (pp. 13.11–13.24). TIMSS & PIRLS International Study Center, Lynch School of Education, Boston College and International Association for the Evaluation of Educational Achievement. [Google Scholar]
  74. Wallwey, C., & Kajfez, R. L. (2023). Quantitative research artifacts as qualitative data collection techniques in a mixed methods research study. Methods in Psychology, 8, 100115. [Google Scholar] [CrossRef]
  75. Wang, L., Yuan, Y., & Wang, G. (2024). The construction of civil scientific literacy in China from the perspective of science education. Science & Education, 33(1), 249–269. [Google Scholar] [CrossRef]
  76. Winer, L. R., & Vazquez-abad, J. (1997). Repertory grid technique in the diagnosis of learner difficulties and the assessment of conceptual change in physics. Journal of Constructivist Psychology, 10(4), 363–386. [Google Scholar] [CrossRef]
  77. Wu, M., Tam, H. P., & Jen, T.-H. (2016). Educational measurement for applied researchers: Theory into practice. Springer. [Google Scholar] [CrossRef]
  78. Yezierski, E. J., & Birk, J. P. (2006). Misconceptions about the particulate nature of matter. Using animations to close the gender gap. Journal of Chemical Education, 83(6), 954. [Google Scholar] [CrossRef]
  79. Zarkadis, N., Stamovlasis, D., & Papageorgiou, G. (2020). Student ideas and misconceptions for the atom: A latent class analysis with covariates. International Journal of Physics and Chemistry Education, 12(3), 41–47. [Google Scholar] [CrossRef]
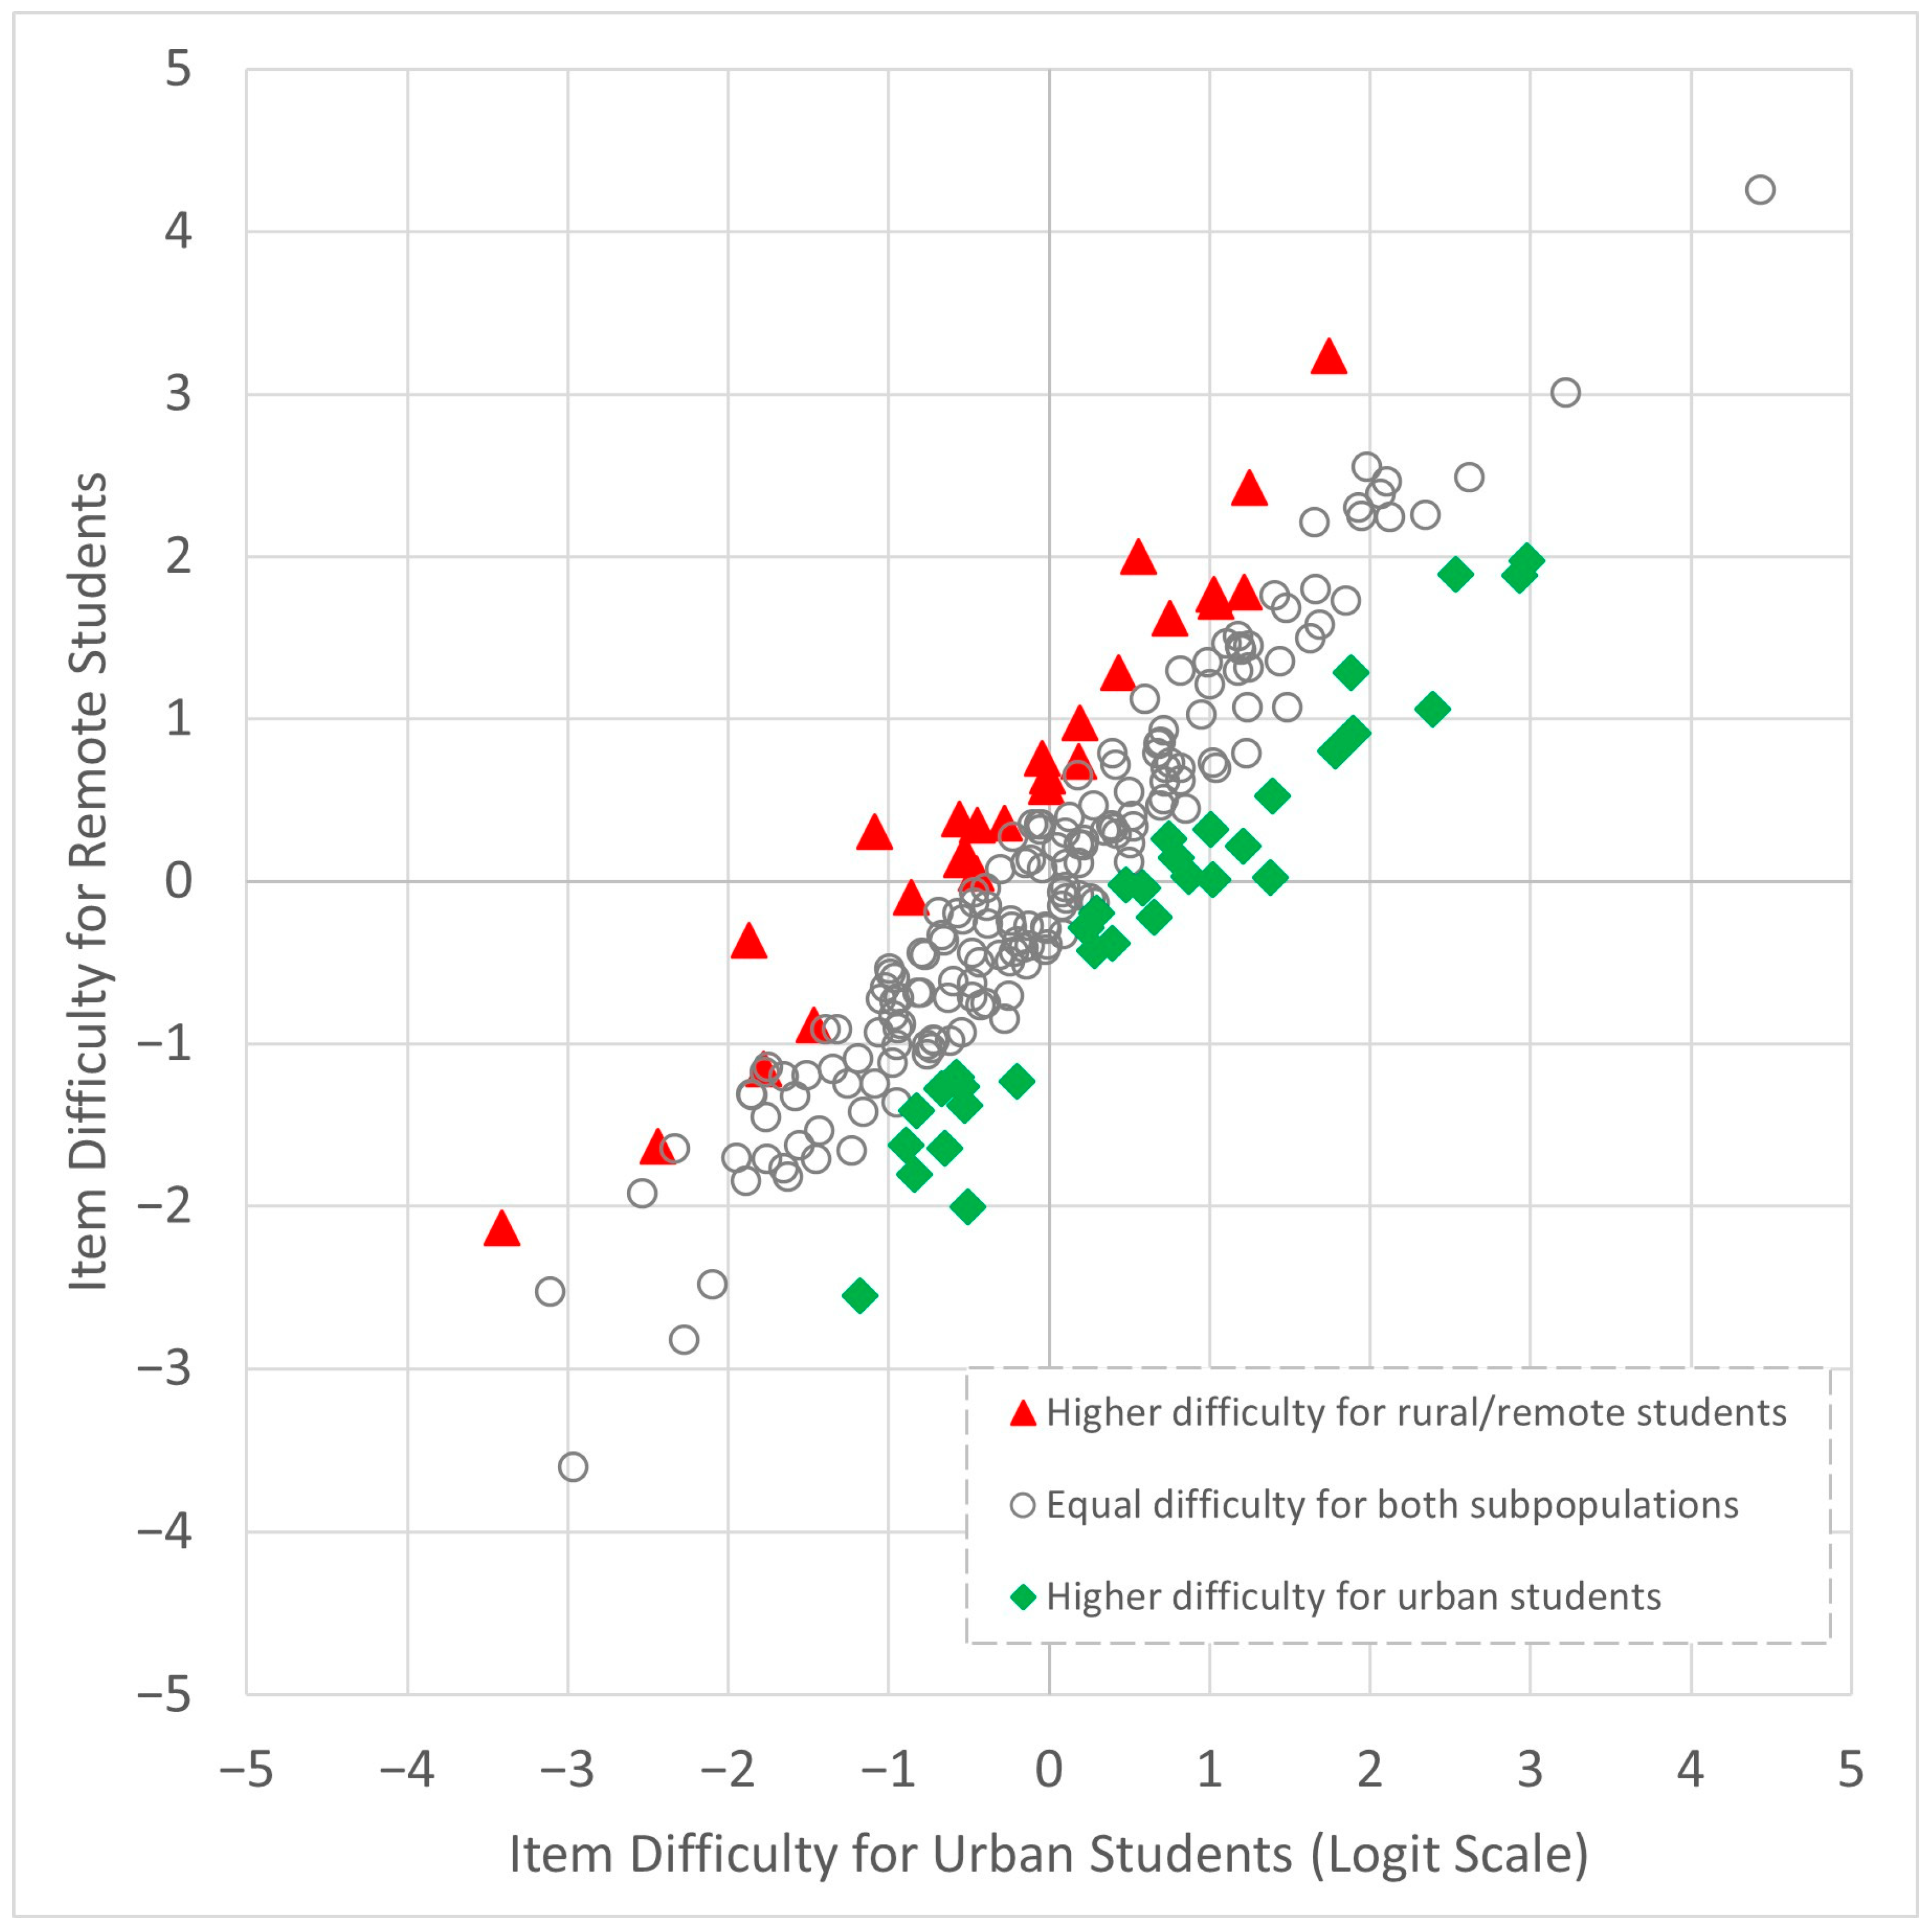
Figure 1. Scatter plot of item difficulties for urban and remote students in TIMSS 2019 Grade 8 science.
Education 15 01262 g001
Figure 2. Heatmap visualization of the trichotomous rating matrix for student S1 from a metropolis. The heatmap displays the student’s ratings on a trichotomous scale: dark red (1 = match), light pink (0 = irrelevant), and white (−1 = mismatch).
Education 15 01262 g002
Figure 3. Biplot showing the results of the principal component analysis for the repertory grid of student S1 from a metropolis. The biplot displays construct loadings (red arrows) and element scores (gray points) on the first two principal components (PC1 horizontal, PC2 vertical). For the full definitions of codes, see Appendix A.
Education 15 01262 g003
Figure 4. Two-mode clustering network for the repertory grid of student S1 from the metropolis. The bipartite network shows clusters of elements (E codes) and constructs (C codes), with the edges indicating strong associations with the rating matrix. See Appendix A for code definitions.
Education 15 01262 g004
Figure 5. Dendrogram based on hierarchical clustering of elements in the repertory grid for urban student S1.
Education 15 01262 g005
Figure 6. Heatmap visualization of the trichotomous rating matrix for remote student S7. The heatmap displays the student’s ratings on a trichotomous scale: dark red (1 = match), light pink (0 = irrelevant), and white (−1 = mismatch).
Education 15 01262 g006
Figure 7. Biplot showing principal component analysis results for the repertory grid of student S7 from a remote area. The biplot displays construct loadings (red arrows) and element scores (gray points) for the first two principal components (PC1 horizontal, PC2 vertical). For full definitions of codes, see Appendix A.
Education 15 01262 g007
Figure 8. Two-mode clustering network for the repertory grid of student S7 from a remote area. The bipartite network shows clusters of elements (E codes) and constructs (C codes), with the edges indicating strong associations with the rating matrix. See Appendix A for code definitions.
Education 15 01262 g008
Figure 9. Dendrogram based on the hierarchical clustering of elements in the repertory grid for remote student S7.
Education 15 01262 g009
Figure 10. Results of two-mode clustering for aggregation across the six students (S1–S6) from the urban school. The bipartite network shows clusters of elements (E codes) and constructs (C codes), with edges indicating strong associations with the rating matrix. See Appendix A for code definitions.
Education 15 01262 g010
Figure 11. Results of two-mode clustering for aggregation across the six students (S7–S12) from the remote school. The bipartite network shows clusters of elements (E codes) and constructs (C codes), with edges indicating strong associations with the rating matrix. See Appendix A for code definitions.
Education 15 01262 g011
Figure 12. Heat map of mean (positive-orientated) Honey importance by construct cluster for Group A (urban) and Group B (remote), ordered based on the A–B difference. Caption reports Δ, Jaccard overlap of Top clusters, Evenness (1 = perfectly even), and Coverage (number of Top clusters per group). Construct codes (C1–C23) are defined in Appendix A.
Education 15 01262 g012
Figure 13. Bipartite network linking groups (squares) with construct clusters (circles). The edge width indicates the number of Top nominations; the fill color of nodes indicates the cluster mean importance. The caption reports the same indices as in Figure 12. Construct codes are in Appendix A.
Education 15 01262 g013
Table 1. Distribution of the 26 DIF items disadvantaging remote students by item type in the TIMSS 2019 Grade 8 science assessment.
Item TypeNumber of ItemProportion
TotalDIF Items
Multiple-Choice10776.54%
Constructed-Response1041918.27%
Table 2. Distribution of the 26 DIF items disadvantaging remote students by cognitive domain in the TIMSS 2019 Grade 8 science assessment.
Cognitive Domain Number of Item Proportion
Total DIF Items
Knowing75912.00%
Applying801113.75%
Reasoning56610.71%
Table 3. Distribution of the 26 DIF items disadvantaging remote students by content domain in the TIMSS 2019 Grade 8 science assessment.
Content Domain Number of Item Proportion
Total DIF Items
Cells and Their Functions14214.29%
Characteristics and Life Processes of Organisms14214.29%
Chemical Change10110.00%
Composition of Matter11436.36%
Diversity, Adaptation, and Natural Selection8112.50%
Earth’s Processes, Cycles, and History17211.76%
Earth’s Structure and Physical Features8112.50%
Ecosystems2428.33%
Electricity and Magnetism1119.09%
Energy Transformation and Transfer8112.50%
Human Health8225.00%
Motion and Forces1417.14%
Physical States and Changes in Matter12325.00%
Properties of Matter21314.29%
Disclaimer/Publisher’s Note: The statements, opinions and data contained in all publications are solely those of the individual author(s) and contributor(s) and not of MDPI and/or the editor(s). MDPI and/or the editor(s) disclaim responsibility for any injury to people or property resulting from any ideas, methods, instructions or products referred to in the content.