Abstract
Various admission procedures are available for higher education programs with limited capacity, yet their impact on student diversity and academic performance remains underexplored. We compared weighted lottery and selection (a selective admissions process) in a Dutch biomedical sciences bachelor’s program, focusing on gender diversity (i.e., the women-to-men ratio, n = 2132) and study success (n = 1032). We found that men applied and were admitted to the program less frequently during selection compared to weighted lottery, indicating a gender imbalance already present in the applicant pool. Students admitted through selection were more likely to obtain positive binding study advice (45 or more out of 60 European credits) in the first year, and to complete the program within four years. However, these differences in study success were explained by student characteristics (e.g., gender, age, pre-university GPA and self-reported study choice) rather than by the admission procedure itself. Our findings suggest that weighted lottery supports gender diversity due to greater gender balance among applicants, while selection is associated with improved academic outcomes. This study highlights the tension between diversity and performance and provides guidance for more equitable and effective admission practices in higher education.
1. Introduction
In many European higher education institutions (HEIs), including those in the Netherlands, there is a surplus of applicants for study places, posing a complex and politically sensitive challenge. Central to this issue is the “merit–equity dilemma”. The merit-based perspective argues that admissions should prioritize the most academically capable students (Mountford Zimdars, 2016). Conversely, proponents of the equity-based approaches emphasize that fostering diversity in student populations is not only essential for preparing professionals for a diverse society (Saha, 2008; Smith & Schonfeld, 2000), but more fundamentally, is grounded in the normative principle that equitable access to education is a matter of social justice. Additionally, societal expectations for fair and inclusive access to publicly funded higher education remain high, compelling HEIs to balance academic excellence with accessibility (Aithal et al., 2015).
Compounding this challenge is the growing number of students. Since 2008, enrollment in bachelor’s programs in Dutch research universities has increased by 1.5 times, despite a slight decrease since 2020 (Universiteiten van Nederland, 2025). This surge in student numbers has put pressure on limited resources, such as personnel, lecture halls, thesis supervisors, and internship placements. Moreover, the issue is further complicated by the influx of international students. The current right-leaning government in the Netherlands has introduced strict measures to limit the influx of international students to Dutch universities (Myklebust, 2024a, 2024b), while simultaneously implementing significant funding cuts to the higher education sector (NWO, 2025).
As a result, admissions models are under constant scrutiny and revision, making it increasingly difficult to establish a system that consistently meets the standards of fairness, objectivity, and transparency. By examining this issue, we aim to provide insights that can contribute to improving the admissions process. Any solution should consider the position of the applicant, societal and political demands for equal opportunities and diversity, and the financial sustainability of higher education, while ensuring that the most suitable candidates receive the best possible training.
2. Theoretical Background
2.1. Different Types of Admissions Models in Higher Education
HEIs use various admissions models. The open admissions model allows any student with a qualifying secondary certificate to enroll (Williams & Wendler, 2020) but is not suitable for programs with limited spots (numerus fixus). Matching aims to align student interests with program content (Soppe, 2022), improving retention and success; however, since students make the final enrollment decision, it is not ideal for oversubscribed programs.
The lottery model, used in Dutch higher education from 1975 to 2016 (ten Cate, 2021) for fields like medical education, addressed oversubscription through pure or weighted lotteries, where higher pre-university Grade Point Average (puGPA) increased admission chances (Schripsema, 2017). Some versions included a high school GPA cut-off for direct admission to university studies (Kaiser & Vossensteyn, 2005, 2009). Selection (a selective admissions process) relies on specific criteria, like prior academic success (e.g., GPA) or admissions tests, to select students (Kurysheva, 2022).
Overall, these models aim to balance multiple goals, including managing oversubscription, promoting academic success and retention, enhancing accessibility and diversity, and aligning students’ interests with program demands. This paper focuses on weighted lottery and selection in oversubscribed programs.
We explore whether different admissions procedures (weighted lottery vs. selection) are associated with variations in (1) gender diversity and (2) undergraduate study success. Below, we delineate the concepts of gender diversity and study success, present theoretical explanations for anticipated differences (if any), summarize pertinent findings from previous research, and outline our hypotheses.
2.2. Theoretical and Empirical Underpinnings, and Hypotheses
2.2.1. Differences in Gender Diversity Between Selection and Weighted Lottery
Selection procedures, such as those relying on GPA, tests, and interviews, are often designed to identify high-potential students. However, these procedures inherently favor certain individual characteristics over others, such as academic self-regulation, persistence, and planning, despite efforts to ensure fair and transparent selection (ten Cate, 2021). According to the Person–Environment Fit Theory (Kristof-Brown et al., 2005), individuals perform best when their personal attributes align with the demands and values of the environment–academic settings in this case. Selection acts as a filtering mechanism for this fit: students who already exhibit traits aligned with the educational environment (e.g., conscientiousness) are more likely to be selected. Conscientiousness, a trait associated with self-discipline, planning, and goal persistence is a well-documented predictor of academic study success (O’Connor & Paunonen, 2007). On average, women score slightly higher in conscientiousness than men. Although individual variation within each gender is larger than the difference between them, these average differences can lead to substantial disparities in large applicant pools. Therefore, the use of direct (e.g., conscientiousness questionnaires) and indirect conscientiousness measures (e.g., GPA) in admissions procedures may decrease the odds of admission for male students (Verbree et al., 2023). In line, a multi-cohort study at the national level in the Netherlands revealed that women had higher odds of admission in medical programs, compared to male peers and to the eligible secondary school population (Mulder et al., 2022). The odds of admission for females were higher during selection than (hybrid) lottery and might indicate systemic differences in selection outcomes.
Although diversity encompasses a wide range of dimensions, this study focuses specifically on gender diversity, defined as the ratio of women to men. This focus is mainly because of legal constraints: the recently introduced General Data Protection Regulation (EU GDPR) imposes limitations on researchers’ access to certain types of personal data. As a result, we were unable to obtain institutional information on other aspects of diversity, such as migration background or socioeconomic status.
We hypothesize that gender distribution is more balanced in student cohorts admitted through a weighted lottery than in those admitted through selection (Hypothesis 1), due to reduced reliance on criteria that indirectly reward traits with known gender differences.
2.2.2. Differences in Study Success Between Selection and Weighted Lottery
The theory suggests that students admitted through selection tend to achieve higher scores on various dimensions of study success compared to those admitted through a weighted lottery system (Stegers-Jager, 2018). This phenomenon can be attributed to the perception that their unique qualities played a significant role in their selection, subsequently fostering feelings of autonomy, competence, and relatedness (Wouters et al., 2016). Furthermore, this can also be linked to higher levels of engagement in learning in the later years of studies (e.g., year 4; Wouters et al., 2017). Students who undergo selection invest considerable time and effort in preparing their application documents, in contrast to some weighted lottery-admitted students who may have applied merely to test their luck (Schripsema et al., 2014).
In this study, we focused on three interrelated dimensions of study success: (1) completion of the first year of undergraduate studies; (2) timely completion of an undergraduate program within the expected timeframe of three years; (3) completion of an undergraduate program in four years, involving a delay.
We regarded these dimensions as the core indicators of study success, as they directly pertain to degree attainment, which is the foremost higher education outcome expected by all stakeholders, including students, teachers, and university administrators, from a student enrolled in a higher education program.
Obtaining a Positive Binding Study Advice (BSA, in Dutch) After the First Year
The Dutch law (Higher Education and Scientific Research Act of the Netherlands, 1998) introduced the Binding Study Advice (BSA) after the first year of studies. The BSA is based on the number of European Credits (ECs) a student earns. The Dutch universities are permitted to set their own EC threshold for first-year students. For instance, Utrecht University has set the threshold at 45 ECs. Students who obtain 45 or more ECs out of 60 ECs during their first year receive a positive BSA. Those who do not receive a positive BSA are not allowed to proceed with their studies after the first year (Gijbels et al., 2004). Therefore, BSA is related to the concept of completion rates after the first year (which usually would be completed with 60 ECs).
Empirical results indicate that first-year completion rates are higher among selected students compared to non-selected students (Stegers-Jager, 2018). Similarly, the first-year dropout rate (i.e., termination of studies) is lower for selected students compared to weighted lottery-admitted students (De Visser et al., 2016; Lucieer et al., 2016; Urlings-Strop et al., 2009, 2011, 2013). This can be attributed to general cognitive ability, competency, motivation, autonomy, and belonging to a special group of selected students (De Visser et al., 2016; Verbree et al., 2023; Wouters et al., 2016), as selected students may experience higher levels of these personal attributes because they perceive their admission as a result of their own merits and choices, whereas weighted lottery-admitted students may feel that their admission was due to chance, which reduces their sense of self-determination. In another study, dropout was also higher among weighted lottery-admitted students (11.3%) as compared to students admitted through selection (5.8%), although this difference did not show statistical significance (Schripsema et al., 2014). In summary, we anticipate that the BSA rate will be higher for students admitted through selection compared to weighted lottery (Hypothesis 2).
Timely Completion of Undergraduate Program or with a Delay of One Year
Selected students appear to complete their bachelor’s degrees within the expected timeframe more frequently than weighted lottery-admitted students (De Visser et al., 2016), although some studies do not observe this distinction (Lucieer et al., 2016; Stegers-Jager, 2018). Additionally, limited evidence suggests that autonomous motivation for studying medicine is temporarily enhanced among selected students but does not persist until the end of the program (Wouters et al., 2016). We assumed that non-study-related factors that contribute to dropout, such as health problems, are evenly distributed between the two groups. However, it is evident that an elevated dropout rate during the first year in the weighted lottery group has an impact on the degree completion rate. Therefore, we hypothesize that the degree completion rate is higher (and the dropout rate is lower) for selected students compared to weighted lottery-admitted students (Hypothesis 3 for nominal duration of a program and Hypothesis 4 for program completion with a delay of one year).
Bachelor’s programs in BMS usually consist of a study duration of three years (nominal study duration). An important aspect to consider when investigating study completion is the sample selection: whether to analyze the student population that started in the first year or the student population that successfully completed the first year. Some students discontinue their studies during the first year because of a mismatch between the students and their interests, motivation, capability, or personal reasons. These students, having withdrawn in the first year, will not complete the program. We therefore investigated both the proportions of students that completed the study among all students that started the study and among re-enrollees (students that finished the first year and re-enrolled in the second year of the program, in Dutch, ‘herinschrijvers’). Due to a lack of prior research, we considered the question of whether these proportions vary after the first year (once most dropouts occurred) as exploratory.
3. Theoretical Contributions
This study examines how weighted lottery-based or selection procedures are associated with gender diversity and study success in biomedical sciences (BMS) education. In the prior literature, this question was researched mostly in medical education. Comparing weighted lottery with selection helps understand whether their respective advantages and disadvantages hold for students studying science. This investigation in the biomedical context is important because, while medical curricula train a specific set of cognitive (e.g., extensive memorization) and noncognitive (e.g., empathetic patient communication) skills, biomedical education may prioritize other cognitive (e.g., analytical reasoning) and noncognitive (e.g., creativity) skills. Second, our study is one of the few studies that investigated the effects of the two admissions procedures on study success at the end of the undergraduate program (whereas most research focuses on early study success). Finally, we refined the operationalization of study success by distinguishing between study completion among all enrolled students and those who re-enrolled for the second year, thereby contributing to the existing literature.
4. Methods
The current study aims to reveal whether one of the admissions procedures (weighted lottery or selection) is associated with indicators of gender diversity (i.e., the ratio of male to female students) and study success in an undergraduate BMS program. Specifically, it addresses two key questions: (1) Does gender diversity differ between these two admissions procedures? and (2) Do completion rates differ between students admitted through a weighted lottery and those admitted through selection?
4.1. Context
We chose to perform comparisons between weighted lottery and selection within the context of biomedical sciences. Biomedical sciences constitute an essential part in medical and technological innovation (Juanes et al., 2018). The appropriate training in these educational programs involves participation in academic research laboratories and the use of costly materials. Both factors limit the number of study places available in biomedical programs (Kurysheva, 2022), necessitating the use of either selection or weighted lottery. Conducting this study within a biomedical undergraduate program also allows us to account for the literature on medical education in the formulation of our hypotheses because the biomedical curriculum shares some content with medical curricula. At the same time, since the students of BMS programs primarily aim to become researchers (and not physicians), it is important to determine whether the differences observed in the medical curriculum hold (or not) for a research-oriented curriculum.
To examine study success and gender diversity, we used data from students admitted to the BMS bachelor’s program at Utrecht University, the Netherlands. Yearly, a maximum of 175 students are admitted to the BMS program. From 2013 to 2015, admissions were based on a weighted lottery system, supplemented by a voluntary pre-lottery matching procedure (see details in Section 4.3.1). In 2016, the program transitioned to selection, and at the national level, selection became mandatory in 2017.
4.2. Participants
In this study, we included data from students who applied and were admitted to the BMS program through a matching procedure and subsequent weighted lottery in 2013, 2014, and 2015 (762 applicants, 509 admitted students) or through selection in 2016, 2017, and 2018 (1370 applicants, 520 admitted students). The study was approved by the Ethical Review Board of the Dutch Association for Medical Education (Nederlandse Vereniging voor Medisch Onderwijs; NVMO), dossier number (2024.2.9).
To answer our research questions, two datasets were analyzed. The first dataset included the total number of candidates who applied for the BMS program at Utrecht University. The second dataset consisted of candidates who were admitted to the program. During the weighted lottery-based admissions period (2013–2015), 762 candidates applied. During the selection period (2016–2018), 1370 candidates applied (See descriptives in Table 1). Until 2016, candidates could apply to only one numerus fixus program. Starting in 2017, they could apply to two, allowing greater flexibility in program selection. Additionally, the selection process enabled candidates to influence their chances of admission, potentially contributing to the increase in applications in 2017 and 2018. In total, data from 1029 admitted students have been included, of which 509 were admitted via a matching procedure and subsequent weighted lottery (2013–2015), and 520 were admitted via selection (2016–2018). The main characteristics of the participants are summarized in Table 2.

Table 1.
Gender characteristics of candidates and admitted students.
Table 2.
Student characteristics for weighted lottery and selection.
4.3. Admissions Procedures
4.3.1. Weighted Lottery Procedure with Matching Activities
Students from the 2013, 2014, and 2015 cohorts were admitted through a weighted lottery procedure. In this procedure, candidates with a puGPA for all subjects of 8 or higher, on a scale from 1 (poor) to 10 (excellent), were offered direct admission. The remaining applicants were grouped into four puGPA categories (8 < GPA ≤ 7.5, 7.5 < GPA ≤ 7, 7 < GPA ≤ 6.5, and GPA < 6.5). The admission ratio for these categories was 9:6:4:3, respectively. Before entering this procedure, a significant portion of the students (83%) participated in voluntary matching activities in 2013, 2014, and 2015. Matching activities included representative lectures and work groups, the completion of a test on first-year biomedical subjects, filling out a questionnaire assessing motivation and personality characteristics, and the submission of their secondary school grades. The purpose of these matching activities was to enable students to properly orient themselves towards their chosen field of study. In addition, these matching activities were designed to assess their predictive value for study success and to inform policymakers on future selection criteria to be used in the selection process starting from 2016.
4.3.2. Selection Activities
From 2016 onward, students were selected based on multiple criteria: high school science grades (40%), a test grade assessing first-year subjects (45%), open-ended responses regarding their motivation for the BMS program (10%), and a personality test (John et al., 2008), which specifically measured openness and conscientiousness (5%). The high school science grades included the scores for mathematics, physics, chemistry, and biology obtained during the penultimate year of pre-university education. These grades served as a proxy for puGPAs because puGPAs were not yet available during the selection process. These subjects were mandatory for admission to the program. Candidates were ranked based on the scores across these parameters, and candidates were admitted based on this ranking, where the candidates with the highest score (lowest rank) were admitted first. Admission continued in order of ranking until the maximum of 175 students was reached. For the 2016 cohort, only students who indicated BMS as their first choice (plan A) were admitted, while for the 2017 and 2018 cohorts, students for whom BMS was not their primary choice (plan B) were also admitted. This change occurred because, starting in 2017, students were lawfully permitted to apply to two programs with selection.
4.4. Outcome Measures
We chose to include primary outcome measures that, in our opinion, represent the most important indicators of study success. These measures are commonly used, enabling comparisons with other higher education programs and the previous literature. Other outcome measures were also evaluated to explore these characteristics of study success, which we refer to as secondary outcome measures.
4.4.1. Primary Outcome Measures
There were six primary outcome measures. First, gender diversity, defined as the women-to-men ratio among students at the start of the bachelor’s program (binary outcome). Gender diversity was based on the sex registered in the personal records database (Basisregistratie Personen). Second, a positive binding study advice (in Dutch: positief bindend studieadvies—BSA), defined as obtaining 45 or more ECs out of 60 ECs during the first year. A positive advice allows students to continue their studies throughout the rest of the program (binary outcome). Third, nominal study completion, that is, obtaining 180 ECs for the whole bachelor’s program within the standard three years (binary outcome). Fourth, study completion within four years (binary outcome). Study completion was also measured for only those students that re-enrolled in the second year (re-enrollees); these are the fifth outcome (nominal completion) and the sixth outcome (bachelor’s completion in four years).
4.4.2. Secondary Outcome Measures
The included secondary outcome measures for the first year are nominal first-year study success, that is, obtaining 60 ECs (the maximum number of credits for the first year, binary outcome), and first-year GPA (on a 0–10 scale, with a higher score indicating a higher grade). To obtain a reliable average, this outcome measure was calculated only for students that completed at least five out of eight obligatory subjects in the first year (continuous outcome).
There were three included secondary outcome measures for the degree. First, bachelor’s GPA (on a 0–10 scale), calculated for all grades obtained for the different subjects in the BMS program (continuous outcome). The bachelor’s GPA was weighted based on the number of ECs obtained per course, ensuring that courses with higher credit loads had a proportionally greater influence. Additionally, only students who had obtained at least 180 ECs were included in the analysis. Second, the grade for the Research Project (on a 0–10 scale), an obligatory internship, consisting of literature research and (often) laboratory work, conducted at the end of the bachelor’s program. This project is equivalent to 15 or 22.5 ECs (continuous outcome). Third, time to degree (measured in years, continuous outcome).
4.5. Statistical Analyses
Data were collected both from the admissions procedure and from the university management system Osiris. Data analyses were performed in R (version 4.4.1) with RStudio (version 2025.05.1). Figures were produced with R (R Core Team, 2024) in RStudio (RStudio Team, 2020) and Excel (Microsoft Corporation, 2018). Associations between study variables were examined using Pearson’s correlation coefficients. Categorical variables were analyzed with the chi-squared test for categorical variables. To evaluate determinants of study success, we used different statistical models. Initially, we aimed to run all analyses using hierarchical modeling with the lme4 package (version 1.1-37, Bates et al., 2015), given the nested data structure, where students are clustered within academic cohorts. Model assumptions were assessed using simulation-based residuals via the DHARMa package (version 0.4.7, Hartig, 2024) and multicollinearity was assessed using variance inflation factors. For two analyses, we encountered singularity issues, indicating that the random effect variance was estimated at or near zero. Therefore, in these specific cases we replaced the hierarchical modeling approach with generalized logistic regression (for the outcome bachelor’s completion in three or four years) or multiple linear regression (for the outcome first year grade) models. In these cases, fitting a simpler model without random effects ensures model stability and reliable convergence while avoiding overparameterization. We selected covariates for this hierarchical modeling approach based on the previous literature (De Visser et al., 2016; Lucieer et al., 2016; Stegers-Jager, 2018; Urlings-Strop et al., 2009, 2011, 2013): age, gender, and the average pre-university grade (puGPA, average school exam grade based on Dutch, English, Biology, Math, Science, and Chemistry). We also included the self-reported study choice (plan A or plan B) for their study program of primary choice as a covariate, as it may influence students’ motivation and academic performance. Specifically, if admitted students designated the BMS program at (place anonymized for peer review) University as their plan B, indicating a preference for another field, such as (veterinary) medicine, this could impact their level of engagement and study success.
To evaluate the difference in study success measures between students admitted through weighted lottery or selection, we used a series of models that demonstrated incremental validity of the predictors. Model 0 included only the admissions method as a predictor. In Model 1, we added age and gender to ensure that the effects of our main independent variables in the next steps are not just reflecting age- or gender-related differences. Model 2 added pre-university GPA (puGPA), a well-established predictor of study success. Finally, Model 3 added also study choice as a covariate to assess whether initial preference explains additional variance over age, gender, and puGPA. We added this covariate only in the final model because study choice data are missing for the 2013 cohort, and to avoid unnecessary case exclusion and the resulting reduction in statistical power in the other models.
To account for multiple comparisons, we applied a Bonferroni correction to control for Type I error inflation. We adjusted for four independent comparisons rather than six, given the correlation between bachelor’s completion in three or four years among all students and re-enrollees. Accordingly, the original p-values were multiplied by 4 to ensure a more stringent criterion for statistical significance while accounting for the dependency among the specific outcomes. Additionally, we adjusted the confidence intervals by applying the same Bonferroni correction to maintain consistency in statistical inference.
Missing values occurred for several reasons. Age data was missing for approximately 10% of the students, as this variable was introduced later. Based on institutional GDPR regulations, data for students who completed their studies more than five years ago were excluded. Additionally, data on self-reported study choice was unavailable for the 2013 cohort because it was not included in the questionnaire. First-year GPA was calculated only for students with grades in at least five subjects, leading to missing data for others. Research project grades were incomplete due to GDPR regulations and because some students did not complete a Research Project. Final bachelor’s GPA was calculated only for students with at least 180 ECs. To ensure transparency, we detailed the extent of missing data in Table 2 and used all available data in our analyses. For example, study choice data were missing for the 2013 cohort; these students and any others with incomplete data were excluded via listwise deletion.
5. Results
5.1. Primary Outcome Measures
The correlations of the study variables are presented in Table 3. Age, gender, and reported study choice exhibit negligible to weak to moderate negative correlations with measures of study success. However, puGPA exhibits moderate to strong correlations with first-year grades (r = 0.69) and bachelor’s GPA (r = 0.69). Additionally, different indicators of study success are moderately to strongly correlated with each other. For instance, nominal completion of the first year is strongly associated with obtaining a degree within three (r = 0.46) or four years (r = 0.54). The strongest correlation was observed between bachelor’s GPA and first-year grades (r = 0.90), indicating a strong association between early academic performance and final degree outcomes.
Table 3.
Intercorrelations between study variables.
5.1.1. Gender Ratio
The women-to-men ratio was higher in the group of students admitted through selection (73–27%) as compared to those admitted via weighted lottery (64–36%, χ2 = 8.8, unadjusted p = 0.003, Bonferroni-adjusted p = 0.01, based on four comparisons); see Table 1 and Figure 1. To explore whether this difference originated before or during the admissions procedure, we also compared the gender ratio among program applicants. The women-to-men ratio was higher among applicants for selection (70–30%) than for weighted lottery (63–37%, χ2 = 12.4, adjusted p = 0.002); see Table 1 and Figure 1A. Further investigation of gender ratios before and after the admissions process revealed no significant differences. For the weighted lottery, the women-to-men ratio remained nearly unchanged, shifting from 63–37% before admissions to 64–36% after admissions (χ2 = 0.35, p = 1). Similarly, for selection, the women-to-men ratio changed slightly from 70–30% before admissions to 73–27% after admissions (χ2 = 1.49, p = 0.88). These findings indicate that the observed differences in gender ratios result primarily from a lower proportion of male applicants during the selection process, rather than any bias introduced by the admissions procedure itself.
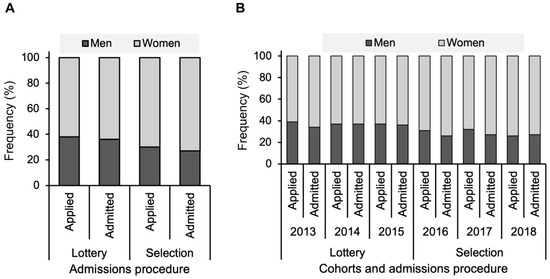
Figure 1.
Gender diversity among admissions procedures. (A) The women-to-men ratio was higher in the cohorts admitted through selection than in cohorts admitted through weighted lottery. In addition, the women-to-men ratio among applicants was higher in cohorts admitted through selection than in cohorts admitted through weighted lottery. (B) The women-to-men ratio was consistently higher in students admitted through selection (2016–2018) in comparison to cohorts admitted through weighted lottery (2013–2015). Although the gender ratio of applicants and admitted students fluctuated over the years, the primary distinction between admissions procedure was visible in the gender ratio among candidates that apply for the program, subsequently influencing the composition of admitted male and female students.
5.1.2. Obtaining Positive Binding Study Advice After the First Year
The percentage of students who attained a positive BSA, which is defined as the acquisition of 45 or more ECs out of 60 ECs in their first year, was higher among students admitted through selection in comparison to students admitted through weighted lottery (89% [462 students] vs. 73% [372 students]; see Table 4 and Figure 2A). To account for temporal fluctuations in positive BSA rates in the different cohorts, a hierarchical modeling approach was employed. In Model 0, students admitted through selection were significantly more likely to achieve a positive BSA in comparison to students admitted via weighted lottery (OR = 2.96, 95% CI [1.59–5.83], adjusted p = 0.003; Figure 2B and Table 4). However, after adjusting for age, gender, puGPA, and study choice as covariates in the analyses (Model 1–3), the effect was no longer statistically significant (e.g., Model 3 OR = 2.09, 95% CI [0.48–9.88], Table 4). These findings suggest that the initial effect observed among selected students may be attributed to other factors, such as prior academic performance. In Model 3, puGPA was significantly associated with the likelihood of obtaining a positive BSA (OR = 5.02, 95% CI [2.82–9.41], p < 0.001, Table 4). Although the mean puGPA was comparable between students admitted via weighted lottery and selection (M (SD) = 6.99 (0.69) vs. 7.05 (0.60), Table 2), a small but notable difference was observed. The median puGPA was lower and the interquartile range was wider among weighted lottery-admitted students compared to selected students (median [IQR] 6.83 [6.50–7.50] vs. 7.00 [6.67–7.50], p = 0.039, Wilcoxon rank sum test). This suggests that greater variation in prior academic performance among weighted lottery-admitted students may partly explain why they were less likely to obtain a positive BSA. The positive relationship between puGPA and obtaining a positive BSA is illustrated for male and female students in Figure 2C (weighted lottery) and Figure 2D (selection).
Table 4.
Odds ratios for obtaining a positive Binding Study Advice in the first year of the bachelor’s program.
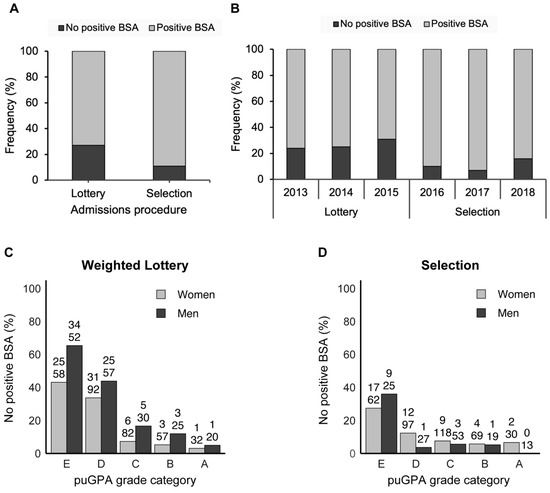
Figure 2.
Binding Study Advice during the first year. (A) The proportion of students who achieved a positive Binding Study Advice (BSA), defined as obtaining at least 45 European Credits (EC) out of 60 ECs in their first year, was significantly higher among students admitted through selection compared to those admitted through weighted lottery. (B) Across all cohorts, students admitted through selection (2016–2018) consistently showed higher rates of positive BSA than those admitted through weighted lottery (2013–2015). (C) Among lottery-admitted students, a strong association was observed between pre-university GPA (puGPA) and the likelihood of obtaining a positive BSA, for both male and female students. (D) This association was less pronounced among selected students, although most students who did not achieve a positive BSA were still in the lowest puGPA category. The depicted puGPA-categories are A, puGPA > 8; B, 7.5 ≤ puGPA < 8; C, 7.5 < puGPA ≤ 7; D, 7 < GPA ≤ 6.5; and E, puGPA < 6.5. The numbers above the bars indicate the number of male or female students with a negative BSA (top number) and the total number of male or female students in that category.
5.1.3. Study Completion Rate in Three and Four Years
We investigated both the proportions of students that completed the study among all students that started the study (Section Study Completion Among All Started Students) and re-enrollees (students that finished the first year and re-enrolled in the second year of the program, in Dutch, ‘herinschrijvers’ (Section Study Completion Among Re-Enrollees)).
Study Completion Among All Started Students
The percentage of students who successfully completed their studies within three years was similar for students admitted through weighted lottery and students admitted through selection (37% vs. 37%, Figure 3A). In line, using a hierarchical modeling approach, we found that students admitted through selection exhibited similar odds to complete their studies in comparison to students admitted through weighted lottery (OR = 1.02 [95% CI: 0.73–1.42], adjusted p = 1, Figure 3B and Table 5). These results regarding the effect of being admitted via weighted lottery or selection did not substantially change when adding other variables to the model (Table 5). However, students with higher puGPA were more likely to have a nominal study duration as compared to students with lower puGPA (OR = 1.68 [95% CI: 1.23–2.30], adjusted p < 0.001). In addition, older students and those admitted to their second-choice program (plan B) had lower odds for nominal study duration (OR = 0.83 [95% CI: 0.64–1.00], adjusted p = 0.04 and OR = 0.39 [95% CI: 0.17–0.82], p = 0.006, respectively).
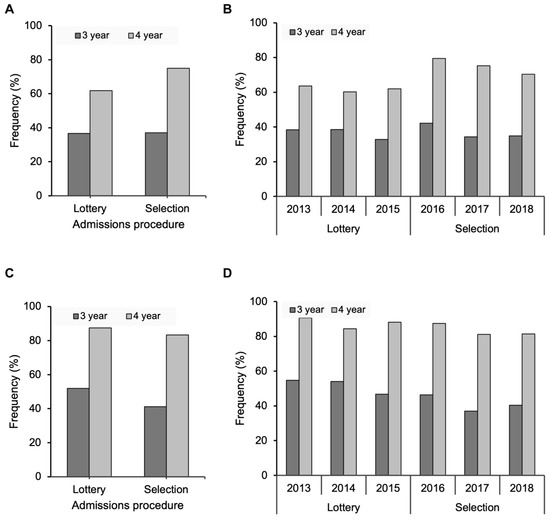
Figure 3.
Study completion rates among all students and re-enrollees. (A) Students admitted via weighted lottery (2013–2015) and students admitted via selection (2016–2018) have comparable nominal bachelor’s completion rates. The completion rate within four years is higher among students admitted via selection as compared to students admitted via weighted lottery. (B) The four-year completion rate is increased in all cohorts with selection as compared to cohorts with weighted lottery. (C,D) When considering only the students that re-enroll in the second year of the program, three- and four-year bachelor’s completion rates are comparable between admissions procedures and over the years.
Table 5.
Odds ratios for bachelor’s completion for all students in three and four years.
When investigating the number of students that completed the bachelor’s program within four years from the start, a higher percentage of students admitted through selection achieved their degree compared to those admitted via weighted lottery (75% vs. 62%). Consistently, students admitted through selection were more likely to complete their bachelor’s program within four years compared to those admitted through weighted lottery (OR = 1.86, 95% CI [1.31–2.64], adjusted p < 0.001; Figure 3, Table 5). However, after adjusting for age, gender, puGPA, and the reported study choice using a hierarchical modeling approach, this effect was largely explained by these variables. Specifically, older students, male students, and those enrolled in their second-choice program (plan B) had lower odds of completing their bachelor’s degree within four years, whereas a higher puGPA increased the likelihood of timely completion (Table 5).
Study Completion Among Re-Enrollees
Interestingly, in contrast to what we hypothesized, the proportion of re-enrollees that successfully completed their studies in three years was lower among students admitted through selection as compared to weighted lottery-admitted students (41% vs. 52%, Figure 3C,D). In line, the odds for nominal bachelor’s completion were lower for selected students than for weighted lottery-admitted students (OR = 0.65, 95% CI [0.45–0.93], adjusted p = 0.012; Table 6). This observed effect of lower bachelor’s completion rates among selected students as compared to students admitted via weighted lottery was no longer statistically significant after adjustment for age, gender, puGPA, and reported study choice (OR = 0.68, 95% CI [0.45–1.04], adjusted p = 0.09, Table 6). These findings suggest that the likelihood of bachelor’s completion among re-enrolled students is more strongly influenced by puGPA and study choice rather than the admissions procedure.
Table 6.
Odds ratios for bachelor’s completion by re-enrollees in three and four years.
A similar trend was observed for four-year completion rates, with a slightly lower percentage of selected students finishing their degrees compared to those admitted through weighted lottery (83% vs. 88%; Figure 3C). However, hierarchical modeling did not reveal statistically significant differences (Table 6). Notably, in Model 3, only age and reported study choice were statistically significant predictors of bachelor’s completion (OR = 0.75, 95% CI [0.57–0.91], p < 0.001 and OR = 0.40, 95% CI [0.18–0.92], adjusted p = 0.026). Unlike in previous models, puGPA was no longer significantly associated with four-year bachelor’s completion (OR = 1.16, 95% CI [0.73–1.87], adjusted p > 0.99, Table 6).
5.2. Secondary Outcome Measures
Among the secondary outcome measures, we explored the nominal completion of the first year, the average GPA in the first year, the overall GPA, the grade for their Research Project, and the time to degree.
5.2.1. Nominal Completion of First Year
The percentage of students that completed the first year of their studies obtaining the maximal amount of 60 ECs was higher in selected students than in students admitted via weighted lottery (68% vs. 51%). The odds of obtaining the total amount of 60 ECs in the first year was higher in students admitted through selection as compared to students admitted via weighted lottery (OR = 2.06, 95% CI [1.44–2.97], p < 0.001, Table A1). Even after adding puGPA as a covariate to the model, the effect of the admission procedure remained significant. Students admitted via selection more often obtained 60 ECs in the first year compared to those admitted via weighted lottery (OR = 2.01, 95% CI [1.21–3.50], p = 0.002, Table A1). The effect of the admissions procedure disappeared when the variables age, gender, and reported study choice were added to the model (OR = 1.15, 95% CI [0.71–1.87], p = 0.48), indicating that the observed effect of the admissions procedure was explained by these variables.
5.2.2. Average GPA in the First Year
The estimated effects for first-year grade based on different models are presented in Table A2. Students admitted through selection showed a positive, weak increase in first-year grade compared to students admitted through weighted lottery (B = 0.11, 95% CI [0.03–0.19], r = 0.09, p = 0.010). After further adjustments for age, gender, PuGPA, and self-reported study choice, students admitted through a selection procedure had a slight but significantly higher grade after the first year of study as compared to those admitted through weighted lottery (B = 0.13, 95% CI [0.07–0.19], p < 0.001). The strongest predictor for the first-year grade was puGPA (B = 0.67, 95% CI [0.62–0.71], r = 0.69, p < 0.001).
5.2.3. Research Project Grade
Students’ admissions through selection as compared to weighted lottery was not related to the obtained grades for the Research Project grade (B = 0.05, 95% CI [−0.08–0.18], p = 0.49, Table A3). The results remained consistent after adjusting for other covariates. In Model 2, male students had a slightly lower Research Project grade than female students (B = −0.09, 95% CI [−0.18–−0.00], p = 0.041). In Model 3, the only significant predictor of the Research Project grade was the puGPA (B = 0.24, 95% CI [0.21–0.33], r = 0.29, p < 0.001).
5.2.4. Overall Bachelor’s GPA
The results of the analyses assessing the impact of various predictors on bachelor’s GPA are presented in Table A4. There was no significant effect of the admissions procedure on the obtained bachelor’s grade (B = 0.06, 95% CI [−0.01–0.12]), p = 0.23). Male students had a lower bachelor’s grade than female students (B = −0.19, 95% CI [−0.24–−0.13], p < 0.001) across all models. An increasing puGPA had a strong positive effect on bachelor’s grade (B = 0.52, 95% CI [0.48–0.56], p < 0.001).
5.2.5. Time to Degree
There was no significant effect of the admissions procedure on the observed time to degree (B = 0.05, 95% CI [−0.05–0.15], p = 0.46, Table A5). However, on average, older students had a slightly longer time to degree. For each additional year increase in age, the time to degree was estimated to increase by 0.04 years (about two weeks) in Models 2 and 3 (95% CI [0.01–0.07], p < 0.01). Male students took approximately seven weeks longer to complete their degree than female students (Model 2: B = 0.14, (95% CI [0.03–0.26], p = 0.004). Students with a higher puGPA completed their bachelor’s program slightly faster than students with lower puGPA: approximately 0.11 years (about six weeks), 95% CI [0.03, –0.19] faster per 1 point increase in puGPA (1–10 scale), p = 0.005, Table A5).
6. Discussion
In this study, we investigated potential disparities in gender ratios and study success among undergraduate biomedical students admitted through either weighted lottery or selection, and three important findings emerged. First, a higher proportion of male candidates were admitted during weighted lottery compared to selection, mainly because they applied less frequently for the selection-based program. The second key finding is that students admitted through selection are more likely to acquire positive BSAs during their first year of studies compared to weighted lottery-admitted students. This effect could (at least partially) be attributed to the differences in students’ puGPA between the admissions procedures. The third key finding is that the biomedical degree completion rates are comparable when considering only the students who re-entered the program in the second year. In other words, during selection, applicants are selected based on the admissions criteria before the start of the studies, while in weighted lottery-based admissions, students are “selected” for further studies by the teaching staff or their own study choices (“self-selection” effect) during the first year of their studies: selectie voor of na de poort, in Dutch. We explain the detected differences below.
6.1. Implications for Theory
The theoretical contributions of this study are twofold. First, we demonstrated that the type of admissions model is associated with differences in gender ratios within the BMS program, possibly due to a self-selection effect among male candidates that occurs before the application stage. This insight underscores how an emphasis on academic excellence and unwavering confidence in the selection procedure’s predictive power can result in gender imbalances in higher education, potentially limiting opportunities for male students right at the onset of their academic journey. Secondly, we showed that selected students are more likely to complete their degree than weighted lottery-admitted students.
6.1.1. Weighted Lottery vs. Selection in Relation to Gender Diversity
During selection, fewer male candidates enrolled in the program compared to weighted lottery. Further analysis revealed that this gender disparity already existed in the applicant pool, suggesting that the difference did not arise from the selection process itself. This finding aligns with our hypothesis and corroborates previous research showing that men, on average, are less likely to apply for selective undergraduate programs than women (Delaney & Devereux, 2021). Several factors may explain the lower proportion of male applicants during selection.
First, demographic shifts in secondary education have led to an increasing proportion of women among those eligible for biomedical programs. Between 2013 and 2018, the gender ratio among eligible candidates shifted from an even 50–50% to 54–46% in favor of women (CBS Statlline, 2022).
Second, differences in the ability to convert cultural capital into educational advantage may play a role. Research suggests that men are less effective than women at mobilizing support from their social environment, such as parents and peers, to navigate educational challenges (Lechien et al., 2017; Valadez, 1998). In the context of a demanding and time-intensive selection process, this may discourage men from applying. In contrast, a simpler, more accessible procedure such as a weighted lottery may be perceived as less intimidating and more attainable, thereby encouraging greater male participation.
Third, gender differences in personality development, particularly the slower development of conscientiousness in adolescent males, may further contribute to this trend (Brandes et al., 2021). Conscientiousness is a known predictor of task persistence, and lower levels in men have been linked to lower academic performance and engagement (Keiser et al., 2016; Verbree et al., 2023; Voyer & Voyer, 2014). As such, men may be less inclined to invest the effort required for selective applications.
In summary, our findings provide no evidence that the selection procedure itself systematically affects male applicants. Instead, the lower male representation appears to stem from pre-existing differences in application behavior. Therefore, implementing a weighted lottery system may be a more effective approach to fostering a gender-balanced student population.
6.1.2. Weighted Lottery vs. Selection in the Prediction of Binding Study Advice
We hypothesized that students admitted through selection are more likely to obtain a positive BSA after the first year compared to those admitted via weighted lottery, which is supported by our findings. This result is in line with the existing literature that showed that selected students tend to outperform their weighted lottery-admitted peers during the first year (De Visser et al., 2016; Lucieer et al., 2016; Stegers-Jager, 2018; Urlings-Strop et al., 2009, 2011, 2013). We were curious about the reasons to which this difference could be attributed. We found that a higher puGPA increases the likelihood of obtaining a positive BSA, while being male student and older reduces those chances.
6.1.3. Weighted Lottery vs. Selection in the Prediction of Third-Year and Fourth-Year Completion
All Started Students: Weighted Lottery vs. Selection in the Prediction of Third-Year and Fourth-Year Completion
Our overarching assumption was that selected students would have higher completion rates compared to weighted lottery-admitted students. Our results generally support this assumption, as completion rates after four years were indeed higher for selected students, aligning with Hypothesis 4. The absence of a statistically significant difference after three years (Hypothesis 3) may be explained by the unforeseen challenges of the COVID-19 pandemic, which disrupted timelines, wellbeing, and academic performance, particularly for cohorts 2017 and 2018. Laboratory closures forced many students to postpone Research Projects, lowering three-year completion rates. The differences in completion rates only became visible by the fourth year.
Other factors may also play a role. The “sunk cost fallacy” (Arkes & Ayton, 1999; Kahneman, 2012) suggests that individuals, having invested more effort in a particular endeavor, are more likely to persist, even if it is not the optimal path. In the context of student selection, the substantial investment in the selection process might drive students to continue, regardless of the program’s alignment with their academic or personal aspirations. Another factor influencing completion rates could be the different significance attached to matching procedures. For selected students, the high-stakes nature of the selection process places greater importance on the matching test results, influencing their commitment to the program. In contrast, students admitted through weighted lottery may perceive the matching process as low stakes, leading to a lower level of commitment and potentially a realization later on that the program may not be the right fit for them. Another explanation could be that selected students might be more conscientious or perfectionistic and therefore might take more time to complete the bachelor’s program than the students admitted through weighted lottery.
When additional variables were added to the model, the effect of the admissions procedure itself was no longer statistically significant. Instead, younger students, students with a higher puGPA, and those who indicated biomedical sciences as their first choice were significantly more likely to complete their bachelor’s degree within three or four years. Older students may face external responsibilities such as jobs or families, delaying their graduation. Students who initially preferred to study medicine more often transfer once admitted to medical school, leading to extended timelines or discontinuation of the biomedical sciences program.
In conclusion, selected students are more likely to graduate within four years. This effect can be mainly attributed to age, puGPA, and preferred study choice. Completion rates are shaped by a complex interplay of admissions processes, student characteristics, and external circumstances.
Re-Enrolled Students: Weighted Lottery vs. Selection in the Prediction of Third-Year and Fourth-Year Completion
We explored whether students admitted through a weighted lottery or selective procedure differed in how often they completed their degrees, focusing only on those who re-enrolled in the second year. Our assumption was that, by the second year, the motivation levels of students in both groups would be comparable, since less motivated students likely dropped out during the first year. Among those who did re-enroll, the proportion of weighted lottery-admitted and selected students who completed their degree in four years was similar. Surprisingly, for completion within three years, weighted lottery-admitted students were more likely to finish on time than selected students. This unexpected outcome may be related to the disruptions caused by the COVID-19 pandemic, which mainly affected the selected students in cohorts 2017 and 2018.
6.2. Implications for Practice
In this section, we outline several considerations that admissions practitioners should contemplate when choosing an admissions model, as many of them strive to achieve diversity in students’ backgrounds while at the same time upholding excellence. Based on our results, both weighted lottery and selection yield student groups that can be successful and diverse, albeit in distinct manners.
The points that the practitioners may want to consider are as follows: (1) The fact that study motivation is affected by being in the program of one’s first choice; (2) The ethical considerations such as equity and equal access to higher education opportunities for citizens accounting for barriers which certain student groups encounter in obtaining access to higher education; (3) Desired level of transparency of an admissions procedure: It is more challenging to make selection fully transparent compared to a lottery system; and (4) Cost-effectiveness: A selection process typically demands time from multiple committee members across several days, incurring costs for the institution. In contrast, a lottery-based admissions process is inexpensive and can be executed by one or two admissions officers in a single day. On the other hand, our findings indicate that many students who drop out after being admitted through the lottery would likely have been eliminated in a program with a selection procedure, saving the institution financial resources.
In navigating the complexities of admissions models, it is crucial to differentiate between societal needs and institutional interests. Societal needs often prioritize broader objectives such as fostering diversity and inclusion within educational institutions. On the other hand, institutional interests may focus on efficiency, cost-effectiveness, and ensuring that the selected students align well with the academic rigor of the institution. Research emphasizes that selection processes tend to be more costly for the school but deliver more economic benefits, which makes it more cost-beneficial as compared to lottery-based admissions (Schreurs et al., 2018). The researchers identified two key financial advantages that emerge over time, rather than during the admissions process itself: (1) an increase in net income because more selected students complete their programs as compared to lottery-admitted students, and (2) a decrease in costs of remediation and resits as selected students tend to fail examinations less frequently (Schreurs et al., 2018). Considering cost-efficiency necessitates policymakers to meticulously assess all facets affected by the selection process, rather than solely focusing on factors like the time commitments of admissions committees, which is frequently highlighted as a primary cost concern.
If the priorities of a program are higher gender diversity and minimizing the costs of the admissions process, the lottery model may be preferable because it allows for male applicants to become enrolled as well as saves time for the admissions committees. In addition, it eliminates the problem of selection among students with similar academic achievements and motivation whose future performance the admissions committees cannot differentially predict with a high extent of certainty. Delegating this decision to fate makes the admissions process more transparent and justifiable. However, a major drawback is that those students who were admitted via lottery and will eventually drop out during the first year (either due to a lack of motivation or academic capabilities) take the places of (more motivated or academically capable) applicants who could have made it to the second year and eventually to the end of a program. The time and costs invested in those dropped out lottery students are ultimately lost by their program and teachers. In addition, the capable students who did not receive a chance to study because of the lottery system miss out on valuable educational opportunities.
If the priorities of a program are ensuring that the most capable students receive educational opportunities, the highest possible percentage of students achieves a positive BSA, and there are long-term financial benefits because of fewer dropouts, then selection is the preferred choice. However, there could be potentially several cons of this choice. First, selection may jeopardize gender diversity and, possibly, other dimensions of diversity not covered in this study. For example, a recent study on selective programs in the Netherlands showed that out of ten most prominent background characteristics, migration background was most often negatively associated with the odds of being admitted to a higher education program (Mulder et al., 2022). Second, there are difficulties in reliable distinction between students with similar academic achievements and motivation, and time, efforts, and financial costs that have to be invested in selecting students during an admission period. We align with scholars who argue that “society’s needs should drive admissions policies rather than institutional gains” (Wouters et al., 2018, p. 1). The mission statements of the programs, faculties, schools, or universities are usually a good point of departure as a guiding tool in choosing between the two models, as they are usually based on societal needs and expectations towards the academy.
6.3. Limitations
6.3.1. Contextual Limitations
First, our findings must be considered within the evolving landscape of Dutch higher education admissions policies. The shift from weighted lottery-based admissions to selection-based admissions in 2016, and the reinstatement of lottery as a legal option in 2023, reflects broader policy discussions about fairness and access to academia. These changes do not directly affect our results but may limit their applicability to future policy contexts.
Second, an external policy factor, the discontinuation of the student grant (basisbeurs, in Dutch) in 2015, may have influenced study success rates. For some students who entered our BMS program from 2015 (the third study cohort in the weighted lottery group), it may have become more difficult to meet their study and living expenses, delaying their studies. At the same time, the absence of governmental support may have acted as a motivational factor, encouraging students to complete their studies in a timely manner. Because the direction of this effect is mixed and cannot be precisely estimated, its impact on our findings is uncertain but likely small.
6.3.2. Methodological Limitations
First, this study was confined to a single undergraduate BMS program, which may limit the generalizability of our findings. Additionally, our retrospective study design does not reflect a double-blind, randomized clinical trial, where treatment effects can be isolated and causally attributed. Instead, our study deals with limited generalization and “the power of context”—issues typical for “the hardest science of all”—educational research (Berliner, 2002). However, given the program’s substantial size and its curricular similarities with other Dutch biomedical programs, our results may be reasonably extrapolated to similar programs in the Netherlands, and possibly across Europe.
Second, students in our sample underwent a matching process before both admissions procedures (weighted lottery and selection). The matching procedure during selection implied more time investment and had more impact on admissions decisions, as the selection test contributed to candidate rankings. If no matching had taken place before the lottery, we might have observed larger effect sizes in the differences between admissions procedures. For example, the matching procedure during the weighted lottery might have already introduced a degree of self-selection, which would not be the case in a “pure” lottery system. Consequently, our study’s effect sizes might be somewhat larger than reported, although the overall direction of differences and conclusions would likely remain unchanged.
Third, some variables were missing, such as study choice in the 2013 cohort. We handled this using listwise deletion, which reduced the sample size for this model but did not affect earlier models. This approach may slightly reduce statistical power but is unlikely to introduce systematic bias.
6.4. Directions for Future Research
In light of our findings, several directions for future research can be identified to further refine our understanding of admissions models. First, expanding the scope of research to include broader, comparative studies at national and international levels would allow for a more comprehensive understanding of different admissions models. Comparative research across universities and countries could highlight best practices, reveal systemic differences, and provide insights into the effects on student diversity and study success of these admissions models in various contexts. Second, including other measures of student diversity, such as the socioeconomic status, migration background, first-generation students’ status, and other gender identities, could provide broader insights. Notably, a random lottery can be less effective when minorities comprise 10% or less of the population, as their probability of selection is inherently influenced by chance. This highlights the need for additional mechanisms to ensure equal access in such situations. Third, the factors influencing study choices and self-selection deserve further attention. Conducting qualitative research through interviews could yield valuable insights into the motivations, preferences, and challenges faced by students when choosing their studies at HEIs. Fourth, as from 2023, the Dutch law allowed HEIs to select students through various combinations of admissions models. Therefore, investigation of combined models of lottery and selection could provide new insights into their impact on student diversity and study success.
7. Conclusions
We compared two distinct admissions procedures, weighted lottery and selection, within the specific context of the BMS bachelor’s program in the Netherlands. We explored their relation to gender diversity of the student body and study success in terms of positive Binding Study Advice (BSA) and degree completion rates. We show that during selection, a lower proportion of male applicants and students was observed as compared to weighted lottery. Additionally, selected students have a higher likelihood of achieving a positive BSA and are more inclined to successfully complete their bachelor’s degree within four years as compared to those admitted via weighted lottery, which could mainly be attributed to puGPA. We discussed these findings within the broader context of higher education admissions practices and provided a view on the pros and cons associated with both admissions procedures, which could be considered by professionals engaged in the field of higher education admissions.
Author Contributions
Conceptualization, J.A.L.M. and A.F.; methodology, J.A.L.M. and A.K.; formal analysis, J.A.L.M.; data curation, J.A.L.M. and A.F.; writing—original draft preparation, J.A.L.M. and A.K.; writing—review and editing, J.A.L.M., A.K., G.D. and A.F.; visualization, J.A.L.M.; supervision, G.D. and A.F.; project administration, J.A.L.M. All authors have read and agreed to the published version of the manuscript.
Funding
This research received no external funding.
Institutional Review Board Statement
The study was approved by Ethical Review Board of the Dutch Association for Medical Education (Nederlandse Vereniging voor Medisch Onderwijs; NVMO), dossier number 2024.2.9. Approved on 26 March 2024.
Informed Consent Statement
The data used in this study were pre-existing and collected as part of regular program administration and evaluation. Informed consent was not required.
Data Availability Statement
The original contributions presented in this study are included in the article. Further inquiries can be directed to the corresponding author.
Conflicts of Interest
Gönül Dilaver is the director, John Meeuwsen is the program coordinator, and Astrid Freriksen is member of the selection committee of the BMS program. These professionals initiated this study because they are interested in making admissions more objective, fair, efficient and the student population more diverse.
Abbreviations
The following abbreviations are used in this manuscript:
| BMS | Biomedical sciences program |
| BSA | Binding study advice. A positive Binding Study Advice (BSA) indicates that students who obtain 45 or more ECs out of 60 ECs during their first year are allowed to proceed to the second year of their studies after the first year. |
| puGPA | Pre-university GPA |
Appendix A
Table A1.
Odds ratios for nominal first year completion.
Table A1.
Odds ratios for nominal first year completion.
| Model 0 | Model 1 | Model 2 | Model 3 a | |||||
|---|---|---|---|---|---|---|---|---|
| Nominal Completion of First Year (n = 1029) | OR | 95% CI | OR | 95% CI | OR | 95% CI | OR | 95% CI |
| Selection vs. Lottery (Lottery = 0) | 2.06 | 1.44–2.97 *** | 1.57 | 1.10–2.24 * | 1.66 | 1.01–2.73 * | 1.74 | 1.01–3.01 * |
| Age (per year increase) | 0.63 | 0.53–0.75 *** | 0.77 | 0.64–0.91 ** | 0.76 | 0.63–0.92 ** | ||
| Gender (Female = 0) | 0.60 | 0.44–0.81 *** | 0.52 | 0.37–0.73 *** | 0.53 | 0.37–0.77 *** | ||
| PuGPA (per 1 increase) | 5.83 | 4.29–7.94 *** | 5.03 | 3.61–6.99 *** | ||||
| Study choice (Plan A = 0) | 0.79 | 0.46–1.36 | ||||||
| Random variance of the model | 0.01 | 0.02 | 0.06 | 0.05 | ||||
| AIC of the model | 1361 | 1152 | 975 | 836 | ||||
Note. a Model 3 contains no information from cohort 2013, as no reported study choice was available for these students. Statistically significant differences are indicated with * p < 0.05; ** p < 0.01 and *** p < 0.001 (hierarchical modeling).
Table A2.
Estimated effects for first-year grade.
Table A2.
Estimated effects for first-year grade.
| Model 0 | Model 1 | Model 2 | Model 3 a | |||||
|---|---|---|---|---|---|---|---|---|
| First Year Grade (n = 855) | Beta | 95% CI | Beta | 95% CI | Beta | 95% CI | Beta | 95% CI |
| Selection vs. Lottery (Lottery = 0) | 0.11 | 0.03–0.19 ** | 0.09 | 0.01–0.17 * | 0.13 | 0.07–0.19 *** | 0.12 | 0.05–0.19 *** |
| Age (per year increase) | −0.02 | −0.04–0.00 | 0.01 | −0.00–0.03 | 0.01 | −0.00–0.03 | ||
| Gender (Women = 0) | −0.16 | −0.25–−0.07 *** | −0.16 | −0.23–−0.10 *** | −0.16 | −0.23–−0.09 *** | ||
| PuGPA (per 1 increase) | 0.67 | 0.62–0.71 *** | 0.66 | 0.60–0.71 *** | ||||
| Study choice (Plan A = 0) | −0.05 | −0.16–0.06 | ||||||
| R2 of the model | 0.01 | 0.03 | 0.50 | 0.49 | ||||
Note. a Model 3 contains no information from cohort 2013, as no reported study choice was available for these students. Statistically significant differences are indicated with * p < 0.05; ** p < 0.01 and *** p < 0.001 (hierarchical modeling). Because of singularity issues, the hierarchical modeling approach was replaced by multiple linear regression analyses. Hence, R2 of the model was reported instead of REML.
Table A3.
Estimated effects for Research Project grade.
Table A3.
Estimated effects for Research Project grade.
| Model 0 | Model 1 | Model 2 | Model 3 a | |||||
|---|---|---|---|---|---|---|---|---|
| Research Project Grade (n = 752) | Beta | 95% CI | Beta | 95% CI | Beta | 95% CI | Beta | 95% CI |
| Selection vs. Lottery (Lottery = 0) | 0.05 | −0.08–0.18 | 0.05 | −0.09–0.19 | 0.07 | −0.03–0.16 | 0.03 | −0.06–0.12 |
| Age (per year increase) | −0.01 | −0.03–0.02 | 0.01 | −0.02–0.03 | 0.01 | −0.01–0.04 | ||
| Gender (Women = 0) | −0.09 | −0.18–−0.00 * | −0.09 | −0.18–−0.00 * | −0.09 | −0.18–0.00 | ||
| PuGPA (per 1 increase) | 0.27 | 0.21–0.33 *** | 0.24 | 0.18–0.32 *** | ||||
| Study choice (Plan A = 0) | 0.13 | −0.02–0.30 | ||||||
| Random variance of the model | 0.00 | 0.00 | 0.00 | 0.00 | ||||
| REML of the model | 1293 | 1296 | 1222 | 1039 | ||||
Note. a Model 3 contains no information from cohort 2013, as no reported study choice was available for these students. Statistically significant differences are indicated with * p < 0.05 and *** p < 0.001 (hierarchical modeling).
Table A4.
Estimated effects for bachelor’s grade.
Table A4.
Estimated effects for bachelor’s grade.
| Model 0 | Model 1 | Model 2 | Model 3 a | |||||
|---|---|---|---|---|---|---|---|---|
| Bachelor’s Grade (n = 868) | Beta | 95% CI | Beta | 95% CI | Beta | 95% CI | Beta | 95% CI |
| Selection vs. Lottery (Lottery = 0) | 0.06 | −0.01–0.12 | 0.04 | −0.04–0.12 | 0.05 | −0.01–0.11 | 0.04 | −0.03–0.11 |
| Age (per year increase) | −0.02 | −0.03–0.00 | 0.01 | −0.00–0.02 | 0.01 | −0.00–0.03 | ||
| Gender (Women = 0) | −0.20 | −0.28–−0.13 *** | −0.19 | −0.24–−0.13 *** | −0.19 | −0.24–−0.13 *** | ||
| PuGPA (per 1 increase) | 0.52 | 0.48–0.56 *** | 0.52 | 0.48–0.56 *** | ||||
| Study choice (Plan A = 0) | −0.03 | −0.12–0.06 | ||||||
| Random variance of the model | 0.00 | 0.00 | 0.00 | 0.00 | ||||
| REML of the model | 1243 | 1221 | 689 | 599 | ||||
Note. a Model 3 contains no information from cohort 2013, as no reported study choice was available for these students. Statistically significant differences are indicated with *** p < 0.001 (hierarchical modeling).
Table A5.
Linear regression analyses for bachelor’s time to degree.
Table A5.
Linear regression analyses for bachelor’s time to degree.
| Model 0 | Model 1 | Model 2 | Model 3 a | |||||
|---|---|---|---|---|---|---|---|---|
| Bachelor’s Time to Degree (n = 747) | Beta | 95% CI | Beta | 95% CI | Beta | 95% CI | Beta | 95% CI |
| Selection vs. Lottery (Lottery = 0) | 0.05 | −0.05–0.15 | 0.05 | −0.05–0.15 | 0.04 | −0.05–0.14 | 0.04 | −0.07–0.15 |
| Age (per year increase) | 0.05 | 0.02–0.08 ** | 0.04 | 0.01–0.07 ** | 0.04 | 0.01–0.07 ** | ||
| Gender (Women = 0) | 0.16 | 0.05–0.27 ** | 0.15 | 0.05–0.27 ** | 0.14 | 0.03–0.26 * | ||
| PuGPA (per 1 increase) | −0.11 | −0.19–−0.03 ** | −0.10 | −0.18–−0.01 * | ||||
| Study choice (Plan A = 0) | 0.12 | −0.07–0.32 | ||||||
| Random variance of the model | 0.00 | 0.00 | 0.00 | 0.00 | ||||
| REML of the model | 1550 | 1542 | 1529 | 1273 | ||||
Note. a Model 3 contains no information from cohort 2013, as no reported study choice was available for these students. Statistically significant differences are indicated with * p < 0.05 and ** p < 0.01 (hierarchical modeling).
References
- Aithal, D. P. S., Kumar, P. M. S., & Deekshitha, K. (2015). Societal expectation and institutional accountability in Higher Education. International Journal of Management, 5(7), 361–373. [Google Scholar]
- Arkes, H. R., & Ayton, P. (1999). The sunk cost and concorde effects: Are humans less rational than lower animals? Psychological Bulletin, 125(5), 591–600. [Google Scholar] [CrossRef]
- Bates, D., Mächler, M., Bolker, B., & Walker, S. (2015). Fitting linear mixed-effects models using lme4. Journal of Statistical Software, 67(1), 1–48. [Google Scholar] [CrossRef]
- Berliner, D. C. (2002). Comment: Educational research: The hardest science of all. Educational Researcher, 31(8), 18–20. [Google Scholar] [CrossRef]
- Brandes, C. M., Herzhoff, K., Kushner, S. C., & Tackett, J. L. (2021). Facet-level personality development in the transition to adolescence: Maturity, disruption, and gender differences. Journal of Personality and Social Psychology: Personality Processes and Individual Differences, 121(5), 1095–1111. [Google Scholar] [CrossRef]
- CBS Statlline. (2022). Higher education at research universities. Exam candidates and graduates, education type in the period 2005/’06-2020/’21: [Vo; examenkandidaten en gediplomeerden, onderwijssoort 2005/’06-2020/’21]. CBS Statlline. Available online: https://opendata.cbs.nl/statline/#/CBS/nl/dataset/80119ned/table?dl=24D0B (accessed on 6 June 2024).
- Delaney, J. M., & Devereux, P. J. (2021). Gender differences in college applications: Aspiration and risk management. Economics of Education Review, 80, 102077. [Google Scholar] [CrossRef]
- De Visser, M., Fluit, C., Fransen, J., Latijnhouwers, M., Cohen-Schotanus, J., & Laan, R. (2016). The effect of curriculum sample selection for medical school. Advances in Health Sciences Education, 22(1), 43–56. [Google Scholar] [CrossRef]
- Gijbels, D., Van der Rijt, J., & Van der Watering, G. (2004). Het bindend studieadvies in het wetenschappelijk onderwijs: Worden de juiste studenten geselecteerd? Tijdschrift voor Hoger Onderwijs, 22(2), 62–72. [Google Scholar]
- Hartig, F. (2024). DHARMa: Residual diagnostics for hierarchical (multi-level/mixed) regression models (R Package Version 0.4.7). Comprehensive R Archive Network (CRAN). Available online: https://CRAN.R-project.org/package=DHARMa (accessed on 5 September 2025).
- Higher Education and Scientific Research Act of the Netherlands [Wet op het hogeronderwijs en wetenschappelijk onderzoek]. (1998). Pub. L. No. 33519. Available online: https://zoek.officielebekendmakingen.nl/stb-1998-216.pdf (accessed on 6 June 2024).
- John, O. P., Naumann, L. P., & Soto, C. J. (2008). Paradigm shift to the integrative big five trait taxonomy: History, measurement, and conceptual issues. In O. P. John, R. W. Robins, & L. A. Pervin (Eds.), Handbook of personality: Theory and research (3rd ed., pp. 114–158). The Guilford Press. [Google Scholar]
- Juanes, J. A., Ruisoto, P., & Barros, P. (2018, October 24–26). Technological innovations in biomedical training and practice. Sixth International Conference on Technological Ecosystems for Enhancing Multiculturality (pp. 348–350), Salamanca, Spain. [Google Scholar] [CrossRef]
- Kahneman, D. (2012). Thinking, fast and slow. Penguin Books. [Google Scholar]
- Kaiser, F., & Vossensteyn, H. (2005). Access to Dutch higher education. In T. Tapper, & D. Palfreyman (Eds.), Understanding mass higher education. Comparative perspectives on access (pp. 92–120). Routledge. [Google Scholar]
- Kaiser, F., & Vossensteyn, H. (2009). Excellence in Dutch higher education: Handle with care. In D. Palfreyman, & T. Tapper (Eds.), Structuring mass higher education. The role of elite institutions (pp. 169–181). Routledge. [Google Scholar]
- Keiser, H. N., Sackett, P. R., Kuncel, N. R., & Brothen, T. (2016). Why women perform better in college than admission scores would predict: Exploring the roles of conscientiousness and course-taking patterns. Journal of Applied Psychology, 101(4), 569–581. [Google Scholar] [CrossRef]
- Kristof-Brown, A. L., Zimmerman, R. D., & Johnson, E. C. (2005). Consequences of individuals’ fit at work: A meta-analysis of person–job, person–organization, person–group, and person–supervisor fit. Personnel Psychology, 58(2), 281–342. [Google Scholar] [CrossRef]
- Kurysheva, A. (2022). Admissions to graduate studies: Selection methods for life and natural sciences masters’ programs at a European research university [Master’s thesis, Utrecht University]. [Google Scholar] [CrossRef]
- Lechien, J. R., Kempenaers, C., Dramaix, M., & Linkowski, P. (2017). Can an early selection system accelerate the maturity of candidates of both genders in medical school? International Journal of Medical Education, 8, 13–15. [Google Scholar] [CrossRef][Green Version]
- Lucieer, S. M., Stegers-Jager, K. M., Rikers, R. M. J. P., & Themmen, A. P. N. (2016). Non-cognitive selected students do not outperform lottery-admitted students in the pre-clinical stage of medical school. Advances in Health Sciences Education, 21(1), 51–61. [Google Scholar] [CrossRef] [PubMed]
- Microsoft Corporation. (2018). Microsoft Excel (Version 16.100.3) [Computer software]. Microsoft Corporation. Available online: https://office.microsoft.com/excel (accessed on 6 June 2024).
- Mountford Zimdars, A. (2016). Meritocracy and the university: Selective admission in England and the United States. Bloomsbury Academic. [Google Scholar]
- Mulder, L., Wouters, A., Twisk, J. W. R., Koster, A. S., Akwiwu, E. U., Ravesloot, J. H., Croiset, G., & Kusurkar, R. A. (2022). Selection for health professions education leads to increased inequality of opportunity and decreased student diversity in The Netherlands, but lottery is no solution: A retrospective multi-cohort study. Medical Teacher, 44(7), 790–799. [Google Scholar] [CrossRef] [PubMed]
- Myklebust, J. P. (2024a, May 29). Foreign students and research funding face ‘shocking’ cuts. University World News. Available online: https://www.universityworldnews.com/post.php?story=20240529163410981 (accessed on 6 June 2024).
- Myklebust, J. P. (2024b, October 25). Discord over planned cuts to international student numbers. University World News. Available online: https://www.universityworldnews.com/post.php?story=2024102513252391 (accessed on 6 June 2024).
- NWO. (2025, January 20). Knowledge for the Netherlands is falling behind due to budget cuts in higher education and research. Netherlands Organization for Scientific Research (NWO). Available online: https://www.nwo.nl/en/news/knowledge-for-the-netherlands-is-falling-behind-due-to-budget-cuts-in-higher-education-and-research (accessed on 6 June 2024).
- O’Connor, M. C., & Paunonen, S. V. (2007). Big five personality predictors of post-secondary academic performance. Personality and Individual Differences, 43(5), 971–990. [Google Scholar] [CrossRef]
- R Core Team. (2024). R: A language and environment for statistical computing (Version 4.4.1). R Foundation for Statistical Computing. Available online: https://www.R-project.org/ (accessed on 5 September 2025).
- RStudio Team. (2020). RStudio: Integrated development for R (4.2.2) [Computer software]. PBC. Available online: http://www.rstudio.com/ (accessed on 5 September 2025).
- Saha, S. (2008). Student body racial and ethnic composition and diversity-related outcomes in US medical schools. JAMA, 300(10), 1135–1145. [Google Scholar] [CrossRef]
- Schreurs, S., Cleland, J., Muijtjens, A. M. M., Oude Egbrink, M. G. A., & Cleutjens, K. (2018). Does selection pay off? A cost–benefit comparison of medical school selection and lottery systems. Medical Education, 52(12), 1240–1248. [Google Scholar] [CrossRef] [PubMed]
- Schripsema, N. R. (2017). Medical student selection: Effects of different admissions processes [Ph.D. thesis, University of Groningen]. Available online: https://research.rug.nl/en/publications/medical-student-selection-effects-of-different-admissions-process (accessed on 6 June 2024).
- Schripsema, N. R., Van Trigt, A. M., Borleffs, J. C. C., & Cohen-Schotanus, J. (2014). Selection and study performance: Comparing three admission processes within one medical school. Medical Education, 48(12), 1201–1210. [Google Scholar] [CrossRef]
- Smith, D. G., & Schonfeld, N. B. (2000). The benefits of diversity what the research tells us. About Campus: Enriching the Student Learning Experience, 5(5), 16–23. [Google Scholar] [CrossRef]
- Soppe, K. F. B. (2022). To match or not to match?: Improving student-program fit in Dutch higher education [Ph.D. dissertation, Utrecht University]. [Google Scholar] [CrossRef]
- Stegers-Jager, K. M. (2018). Lessons learned from 15 years of non-grades-based selection for medical school. Medical Education, 52(1), 86–95. [Google Scholar] [CrossRef]
- ten Cate, O. (2021). Rationales for a lottery among the qualified to select medical trainees: Decades of Dutch experience. Journal of Graduate Medical Education, 13(5), 612–615. [Google Scholar] [CrossRef]
- Universiteiten van Nederland. (2025). Instroom bachelorstudenten. Available online: https://www.universiteitenvannederland.nl/onderwerpen/onderwijs/instroom-bachelorstudenten (accessed on 6 June 2024).
- Urlings-Strop, L. C., Stegers-Jager, K. M., Stijnen, T., & Themmen, A. P. N. (2013). Academic and non-academic selection criteria in predicting medical school performance. Medical Teacher, 35(6), 497–502. [Google Scholar] [CrossRef]
- Urlings-Strop, L. C., Stijnen, T., Themmen, A. P. N., & Splinter, T. A. W. (2009). Selection of medical students: A controlled experiment. Medical Education, 43(2), 175–183. [Google Scholar] [CrossRef]
- Urlings-Strop, L. C., Themmen, A. P. N., Stijnen, T., & Splinter, T. A. W. (2011). Selected medical students achieve better than lottery-admitted students during clerkships: Achievement of selected and lottery-admitted medical students. Medical Education, 45(10), 1032–1040. [Google Scholar] [CrossRef]
- Valadez, J. R. (1998). Applying to college: Race, class, and gender differences. Professional School Counseling, 1(5), 14–20. [Google Scholar]
- Verbree, A.-R., Hornstra, L., Maas, L., & Wijngaards-de Meij, L. (2023). Conscientiousness as a predictor of the gender gap in academic achievement. Research in Higher Education, 64(3), 451–472. [Google Scholar] [CrossRef] [PubMed]
- Voyer, D., & Voyer, S. D. (2014). Gender differences in scholastic achievement: A meta-analysis. Psychological Bulletin, 140(4), 1174–1204. [Google Scholar] [CrossRef] [PubMed]
- Williams, K. M., & Wendler, C. (2020). The open admissions model: An example from the United States. In Higher education admission practices: An international perspective. Cambridge University Press. [Google Scholar]
- Wouters, A., Croiset, G., Galindo-Garre, F., & Kusurkar, R. A. (2016). Motivation of medical students: Selection by motivation or motivation by selection. BMC Medical Education, 16(1), 37. [Google Scholar] [CrossRef]
- Wouters, A., Croiset, G., & Kusurkar, R. A. (2018). Selection and lottery in medical school admissions: Who gains and who loses? MedEdPublish, 7, 271. [Google Scholar] [CrossRef]
- Wouters, A., Croiset, G., Schripsema, N. R., Cohen-Schotanus, J., Spaai, G. W. G., Hulsman, R. L., & Kusurkar, R. A. (2017). A multi-site study on medical school selection, performance, motivation and engagement. Advances in Health Sciences Education: Theory and Practice, 22(2), 447–462. [Google Scholar] [CrossRef]
Disclaimer/Publisher’s Note: The statements, opinions and data contained in all publications are solely those of the individual author(s) and contributor(s) and not of MDPI and/or the editor(s). MDPI and/or the editor(s) disclaim responsibility for any injury to people or property resulting from any ideas, methods, instructions or products referred to in the content. |
© 2025 by the authors. Licensee MDPI, Basel, Switzerland. This article is an open access article distributed under the terms and conditions of the Creative Commons Attribution (CC BY) license (https://creativecommons.org/licenses/by/4.0/).