Article

Digital Resources in Support of Students with Mathematical Modelling in a Challenge-Based Environment

by
Ulises Salinas-Hernández
1,2,*,
Zeger-jan Kock
1,3,
Birgit Pepin
1,
Alessandro Gabbana
4,
Federico Toschi
4 and
Jasmina Lazendic-Galloway
5
1
Eindhoven School of Education, Eindhoven University of Technology, 5600 MB Eindhoven, The Netherlands
2
National School College of Sciences and Humanities, National Autonomous University of Mexico, Mexico City 04500, Mexico
3
Fontys Engineering, Fontys University of Applied Sciences, 5612 MA Eindhoven, The Netherlands
4
Department of Applied Physics and Science Education, Eindhoven University of Technology, 5600 MB Eindhoven, The Netherlands
5
TU/e Innovation Space, Eindhoven University of Technology, 5600 MB Eindhoven, The Netherlands
*
Author to whom correspondence should be addressed.
Educ. Sci. 2025, 15(9), 1123; https://doi.org/10.3390/educsci15091123 (registering DOI)
Submission received: 30 June 2025 / Revised: 15 August 2025 / Accepted: 25 August 2025 / Published: 28 August 2025
(This article belongs to the Special Issue Mathematics in Engineering Education)

Abstract

In this paper, we report how digital resources support engineering students in the early stages of mathematical modelling within a Challenge-Based Education (CBE) course. The study was conducted in a second-year engineering course involving mathematics, physics, and ethics. Through a case study of two student teams, we analyze how a digital curriculum resource—specifically, a dashboard designed for feedback and progress monitoring—helped students identify, define, and begin modelling a real-world problem related to crowd flow on train platforms. Using the instrumental approach, we examined the dual processes of instrumentation (integration of resources) and instrumentalization (adaptation and repurposing of tools). Results show that the Dashboard played a central role in fostering self-regulated learning, interdisciplinary collaboration, and the iterative refinement of guiding questions. Students used data analysis, simulations, and modelling techniques to build and validate mathematical representations in answer to the guiding questions. Our findings contribute to ongoing discussions on how mathematics education in engineering can be enhanced through activity-based learning and targeted use of digital tools. We argue that digital feedback systems like dashboards can bridge the gap between abstract mathematical content and its meaningful application in engineering contexts, thus fostering engagement, autonomy, and authentic learning.

1. Introduction

This study is framed in the context of the development and implementation of new student-centered educational approaches by an increasing number of technological universities that specialize in engineering, technology, applied science, and natural sciences; approaches which reflect the need for the development of innovative teaching-learning environments mediated by digital resources (Pepin & Kock, 2021; van Uum & Pepin, 2022). These educational approaches are driven by the need to prepare new engineers to face the current major global challenges (e.g., climate change, sustainability, energy renewal, transport efficiency) and they often follow an interdisciplinary approach in which students acquire both professional and disciplinary competences (Pepin et al., 2021). Mathematical modeling plays a crucial role in this educational transformation, as it bridges theoretical knowledge with real-world applications by enabling students to translate complex problems into mathematical formulations that can be then analyzed and solved (Niss & Blum, 2020). Recent reviews in the field (see, e.g., Abassian et al., 2019), highlight the importance for students developing of mathematical modeling skills to enhance their problem-solving capabilities, especially in interdisciplinary contexts. In our research we focus on one such approach: Challenge-Based Education (CBE), which in their literature review on CBE, Gallagher and Savage (2020) describe as:
a growing approach in higher education and has been promoted as a means for students to align the acquisition of disciplinary knowledge with the development of transversal competencies while working on authentic and socio-technical societal problems. (…) This flexible approach frames learning with challenges using multidisciplinary actors, technology enhanced learning, multi-stakeholder collaboration and an authentic, real-world focus.
(p. 1135)
In addition, Membrillo-Hernández et al. (2019) point out that the approach is inspired by 21st century work environments, where students work collaboratively (sometimes with industry and business) in real and open-ended situations that demand a solution for which there is not a pre-made response. Therefore, the results are expected to lead to concrete actions. van den Beemt et al. (2022) highlight that “the goal of these challenges is to learn to define and address the problem and to learn what it takes to work towards a solution, rather than to solve the problem itself” (p. 24). In this pursuit of CBE, we highlight two issues that are important to address when fundamental subjects are involved, such as mathematics and physics: (1) CBE teaching and learning practices are not obvious for these subjects (Dahl, 2018), even though in practice CBE often involves significant physical-mathematical thinking and work (e.g., learning how to abstract a real-world problem in mathematical terms through the construction and application of models inspired by physics, and the use of theoretical concepts and techniques); (2) it is often difficult for students to identify and define a mathematical modelling problem from a given broad real-life challenge.
Hence, students need to be provided with appropriate guidance and support (which includes effective feedback), to help them in their self-identified projects to make sense of the mathematical activity involved, that is, in the process of modelling and mathematizing the reality. At the same time, mathematics and physics need to be approached in a way that is in line with CBE, in the context of the acquisition and development of knowledge, competencies, and skills (professional and mathematical) and the use of different resources which mediate the students’ and tutors’ activity. In this vein, Niss and Højgaard (2019) point out that mathematical competence “is someone’s insightful readiness to act appropriately in response to all kinds of mathematical challenges pertaining to given situations.” (p. 12). To successfully help students, learning environments may be enhanced with digital resources that: (1) allow students to investigate mathematical content in a different and autonomous way; and (2) support students’ self-regulated learning by providing feedback.
In this study we focus on analyzing the use by students and teachers of a digital curriculum resource (DCR) in conjunction with other resources, in a CBE course at a Dutch university of technology involving mathematics, physics, and ethics. The DCR, called the “Dashboard-monitoring and challenge management”, was designed by two academics involved in the course (also co-authors of this paper) to effectively support students in their work with the CBE task. Our aim is to understand how a digital resource, such as an in-house developed DCR, hereafter referred as “the Dashboard”, can support university teachers and students working together on CBE tasks that include problem-solving and the development of mathematical competences in a CBE learning environment.
After this Introduction, we present the theoretical frames used in Section 2. In Section 3, we describe the context of the study and the methodological choices taken. The findings are presented in Section 4, and our conclusions are presented in Section 5.

2. Theoretical Framework

With this study we seek to contribute to the research agenda in CBE, in which different research questions can be formulated, such as: “How do students learn in CBL contexts? What is the efficacy of CBL teaching?” (van den Beemt et al., 2022, p. 34). To this end, in the following subsections, we consider three theoretical frameworks. (1) CBE frames the study by positioning student-centered, interdisciplinary learning at the forefront. This approach underpins our investigation into how students engage with real-world challenges, with the use of digital resources as an important element of analysis. (2) We use the instrumental approach as a theoretical framework that allows us to focus on the role of these resources for learning and competence development. (3) To focus the disciplinary content, the modelling perspective integrates the use of digital tools in mathematical modelling, emphasizing their role in bridging real-world problems and mathematical content.

2.1. Challenge-Based Education (CBE)

CBE is one of the student-centered approaches where students work with teachers and experts in order to develop a deeper knowledge of the subjects they are studying. Vreman-de Olde et al. (2021) state that “CBE builds on the foundation of experiential learning (learning by doing, surprises, and set-backs). In CBE the learning process is more important than the outcome (solutions)” (p. 3). In CBE students have to test theory by addressing real problems in collaboration with actors in society (Leijon et al., 2021), hence with relevance outside academia. Membrillo-Hernández et al. (2019) point out that it is important to differentiate CBE from Problem-Based Learning (PrBL) and Project-Based Learning (PBL), even though all three approaches are based on active learning. These authors report the differences extensively; among them are the differences in the methodologies, which we highlight here: in PrBL and PBL, there is a path to follow, and the uncertainty is low. In addition, “the focus of PBL is based on predefined, controlled situations; while PrBL confronts students with problem situations that are sometimes fictitious, not real, and in many cases already solved in advance.” (Membrillo-Hernández et al., 2019, p. 1104). Thus, Malmqvist et al. (2015) state that problems in the context of CBE, being social challenges, involve a greater complexity than those structured, for example, in PrBL. Regarding the learning experience, they point out that besides being typically multidisciplinary it “takes place through the identification, analysis and design of a solution to a sociotechnical problem.” (p. 87). In many CBE courses, student groups are given a broad challenge, in which they identify a particular problem they want to address. As van den Beemt et al. (2022) state: “CBL can be considered an educational evolution, rather than a revolution. However, this evolutionary character might hinder conceptualizations of CBL, because of the risk of educators and researchers drawing on their perception of PBL when working on CBL” (p. 34).
CBE learning environments can be described by means of a set of criteria that each learning environment fulfils to a greater or lesser extent. Gallagher and Savage (2020) describe a set of eight characteristics: global themes, real-world challenges, collaboration, technology, flexibility, multidisciplinary, innovation and creativity, and challenge definition. In addition, van den Beemt et al. (2022) distinguish three dimensions of CBE, particularly in engineering education: (1) Vision/Challenge, (2) Teaching and Learning, and (3) Support, each with different “indicators”.
Regarding the role of teachers, who are seen as coaches, co-researchers, and designers (as opposed to PrBL and PBL where they are seen as facilitators or project managers), in CBE, teachers have two main responsibilities: (1) They must develop a productive and streamlined learning environment for the students, aligning it with the principles of CBE. (2) They need to employ effective teaching strategies and support to facilitate the learning process of the students within the CBE framework. In CBE, these responsibilities are often addressed by following a scaffolding process that helps students in their moments of confusion, particularly in the initial weeks of a course, while promoting a sense of empowerment and agency in their learning process (Doulougeri et al., 2022).
In scaffolding the learning processes, the teachers provide the combined roles of an expert in the subject matter and of a coach. The role of expert is essential in providing students with foundational knowledge and essential components to begin exploring the subject. The role of coach is crucial in allowing students to have the freedom to choose their learning direction while receiving guidance and support. It is important to highlight that the CBE teacher may not be the only expert/coach expected to provide guidance and insights. While working on the different challenges, students could interact with and receive guidance from others: e.g., professors; experts in the area of the challenge; researchers; or stakeholders from industry and the community. Students are also expected to consult the existing literature.
Technology is said to be ‘infused’ in CBE projects (e.g., Gaskins et al., 2015). For students, technological tools have been used to support communication with project stakeholders, access and research information, and publish outcomes. For teachers, technology has been used to track student interactions, evaluate their performance, and provide collaborative space for sharing materials (Gallagher & Savage, 2020). Case studies have described online platforms for communication, process implementation, and student engagement. In addition, virtual learning environments such as Moodle or Blackboard have been used to host module resources and online communication, or to track student activity data (Conde et al. 2017). In many cases, technology used in the daily lives of students has been employed, formally or informally, in CBE courses: e.g., Facebook, WhatsApp, Skype, Google Drive (e.g., Conde et al., 2017), and more recently ChatGPT-3.5. It has been claimed that technology provides options for students (Gallagher & Savage, 2020).
CBE challenges are generally addressed from a multidisciplinary perspective, mostly within science, technology, engineering, and mathematics (STEM), but also including other domains (in this study: ethics and psychology). Often students from different disciplines work together on an engineering challenge. The STEM field has been considered particularly suitable for CBE, as STEM curricula can be complex, real-world, and multidisciplinary.

2.2. Use of Resources and Instrumental Approach

Our study is located in a CBE course related to the subjects of applied mathematics and applied physics in university engineering education. The use of technology for the mathematization of real-world problems is a central aspect of this course. To analyze how technology supports the students we follow a cognitive approach oriented to the analysis of knowledge in practice in different situations. Based on Vergnaud (1998), we conceive of mathematics (1) as both a practical activity and a theoretical body, and (2) as part of the competences that form our knowledge. Thus, the development of mathematical competences is related to the way in which mathematical concepts are put into practice. As Kynigos (2022) points out in relation to the way in which learning should be analyzed: “We should not be thinking of whether students learn how to factorize or learn how to solve a quadratic equation, but rather of situations resolvable by dense sets of concepts around a central one.” (p. 15). In the field of mathematics education, several research studies have addressed the analysis of mathematical competences in relation to the use of technology and computational thinking (e.g., Misfeldt et al., 2020; Elicer & Tamborg, 2022; Smith et al., 2020). From these works, particular competences have been established, such as: digital empowerment, digital design and design processes, technological knowledge, and programming.
For the analysis of the use of technology and resources, we draw on the instrumental approach (IA) (Rabardel & Bourmaud, 2003; Trouche, 2004), which considers both the relevance of technology in the context of the development of cognitive processes and the fact that essentially every human activity is mediated by the use of cultural artifacts. This in turn leads to two considerations: (1) Human beings are born and develop in an environment that is partly artificial and structured by institutional and technological systems (where artifacts are embedded), and (2) these systems will influence the way our cognitive structures develop (Vérillon & Rabardel, 1995).
The IA characterizes the interaction with an artifact or group of artifacts as the conjunction of two processes: instrumentation and instrumentalization. Both processes account for the process of appropriation of an artifact or group of artifacts, produced in a cultural context, by a user and its subsequent development as an instrument (evolution of the artifact from its mobilization by the user). For the purposes of this study, we understand that an artifact can consist of a set of resources. We take the notion of resources as “anything (digital, cognitive or material) likely to resource the students’ mathematical practice such as a textbook or discussions with other students.” (Gueudet & Pepin, 2018, p. 58). In particular, we consider digital curriculum resources (DCRs) as “organized systems of digital resources in electronic formats that articulate a scope and sequence of curricular content” (Pepin et al., 2017a, p. 647). Thus, interaction with a resource gives rise to: (1) the instrumentation process, where the affordances of resources influence student practice and knowledge; and (2) the instrumentalization process, where students adapt the resources to their own needs:
Instrumentalization process can go through different stages: a stage of discovery and selection of the relevant functions, a stage of personalization (one fits the artifact to one’s hand) and a stage of transformation of the artifact, sometimes in directions un-planned by the designer: modification of the task bar, creation of keyboard shortcuts, storage of game programs, automatic execution of some tasks.

2.3. Modelling and Digital Technology

The mathematical modelling process commences with a real-world problem situated in the extra-mathematical domain (often referred to as “reality”), which is then simplified to create a representation in the mathematical domain. This mathematical model undergoes refinement, interpretation, and validation in relation to the original scenario, constituting a modelling cycle. Various representations of this modelling conception exist, with differences in emphasis on student actions. Notably, the modeling cycle proposed by Blum and Leiss (2007) serves as a foundation for exploring the impact of technology on modeling processes.
Modelling and the use of digital technologies are typically seen as two fields of research in education, with specific emphases and purpose. When integrating the two fields, this can be approached in two different ways (Molina-Toro et al., 2019): the first is related to the analyses of methodological and theoretical aspects of the modelling processes (e.g., when students construct mathematical models to solve problems, validate them with digital tools, etc.) (e.g., Villa-Ochoa et al., 2018). The second, more fundamentally assumes that technology has the potential to reorganize how modelling takes place (e.g., Borba & Villarreal, 2005). Hence, in the first, technology is used (and integrated) as a resource in which multiple tools are included that are part of the study (i.e., a conventional way of viewing modelling as a process), whereas in the second, technology is an instrument that influences and potentially reorganizes the processes of investigation and the development of (mathematical) understanding of modelling.
In addition, there are many different positions regarding impact of modelling with digital technologies on student learning. Cognitive approaches (e.g., Blum & Borromeo Ferri, 2009) address the learning when it is oriented towards the development of skills and understanding of mathematical objects. In critical approaches, the learning is oriented towards students’ needs to develop mathematical views associated with phenomena and contexts of their environments (e.g., Soares & Borba, 2014). At the same time, new digital tools generate new roles for technology in modelling processes.
From the above, in this study, we aim to analyze the role of digital resources in solving complex challenges; particularly, in the initial stages related to the identification of the problem to be solved, stages which have been identified as difficult for students, both in the context of CBE and mathematical modelling.
We ask the following research question:
  • How can digital resources support students in the early stages of mathematical modelling in a CBE environment?

3. Methodology

The integration the three parts of the theoretical framework shapes the methods for comprehensively understanding the impact of digital resources in a CBE course involving mathematical modelling. Our methods involve observing and analyzing students’ interactions with digital resources, assessing how these resources can reorganize cognitive processes and understanding in different situations, and how they support students practically during mathematical and interdisciplinary challenges.

3.1. Context

The study was conducted at Eindhoven University of Technology in the Netherlands, in a second-year bachelor course, “Sociophysics 1”. This course was part of a learning line of three courses which, as a whole, followed the CBE approach and incorporated Scrum (Deemer et al., 2013) as a project management framework to help students develop and organize their collaborative work in an efficient and agile way. Scrum promotes experiential learning, self-organization while tackling problems, and encourages teams to reflect on both successes and setbacks to continuously improve. The main student learning goals of this course were to gain experience in observing, describing, characterizing, and measuring a social system. The stakeholder in this course was the organization responsible for the railways and railway station infrastructure in the Netherlands. This organization is interested in the general safety of the crowd flow on railway platforms and in the efficient boarding and onboarding of trains. From a general challenge given by this organization, student teams had to identify and determine a problem they were going to address through a combination of subject-theoretical approaches (physics, mathematics, and machine learning-inspired modeling). Students also had to consider the psychological aspects necessary to describe the behavior of the social system and the ethical implications of conducting a challenge with human subjects.
A total of 65 students, divided into teams of five, had to conduct the following processes: (1) Identifying a Big Idea inspired by stakeholders, relevant to both students and stakeholders, broad enough to be approached from different perspectives and related to the course content: understanding the behavior of human crowds by developing mathematical knowledge while working with big real data. Stakeholders were invited to provide inspiration for big ideas to students (e.g., human crowd dynamics on train platforms). (2) Phrasing an Essential Question that reflected the interests and needs of the students and that could be used to understand the complexity of the Big Idea. In the CBE approach of this course, the Essential Question provided a framework for defining the challenge; it could only be answered through research. (3) Translating the Essential Question into a challenge for the development of actions regarding the Big Idea. (4) Formulating a set of Guiding Questions and identifying Guiding Activities and Guiding Resources to guide the students through the investigation of the challenge. The set of Guiding Questions needed to point towards the advanced knowledge students needed to develop a solution to the challenge. The Guiding Activities and Guiding Resources included the methods, resources, and tools that helped students acquire the knowledge needed to answer the Guiding Questions. The aim of the research process (corresponding to point 4) was for students to examine the contents in depth. Hence, this was the phase where students learned most of the concepts and theories related to the course and the challenge. The different processes are represented in Figure 1.
The course lasted for eight weeks. The teams gave an intermediate presentation and at the end presented a poster summarizing their results and submitted a written report.

3.2. Description of the Challenge/Task and the Dashboard

Following the CBE approach, students were not given a pre-defined question for their challenge. Instead, the two teams in the study took one of the general interests of the stakeholders: “the efficiency of crowd flow on railway platforms”. Then, each team (1) identified a Big Idea, (2) formulated an Essential Question, (3) translated their Essential Question into a specific Challenge, and (4) formulated a set of Guiding Questions, Guiding Activities, and Guiding Resources for the challenge investigation. The first three points are related to the identification of the real-world situation. Table 1 shows the real-world situation that the two team of the study had to translate into a mathematical form related to crowd flow on railway platforms.
The Guiding Questions, Guiding Activities, and Guiding Resources of step (4) were essential for a successful translation of the real-world situation into a mathematical form for investigation. The lecturers were aware that students would need feedback on their Guiding Questions, Guiding Activities, and Guiding Resources and would need to formulate several versions before they would have clearly identified a specific problem that could be successfully solved.
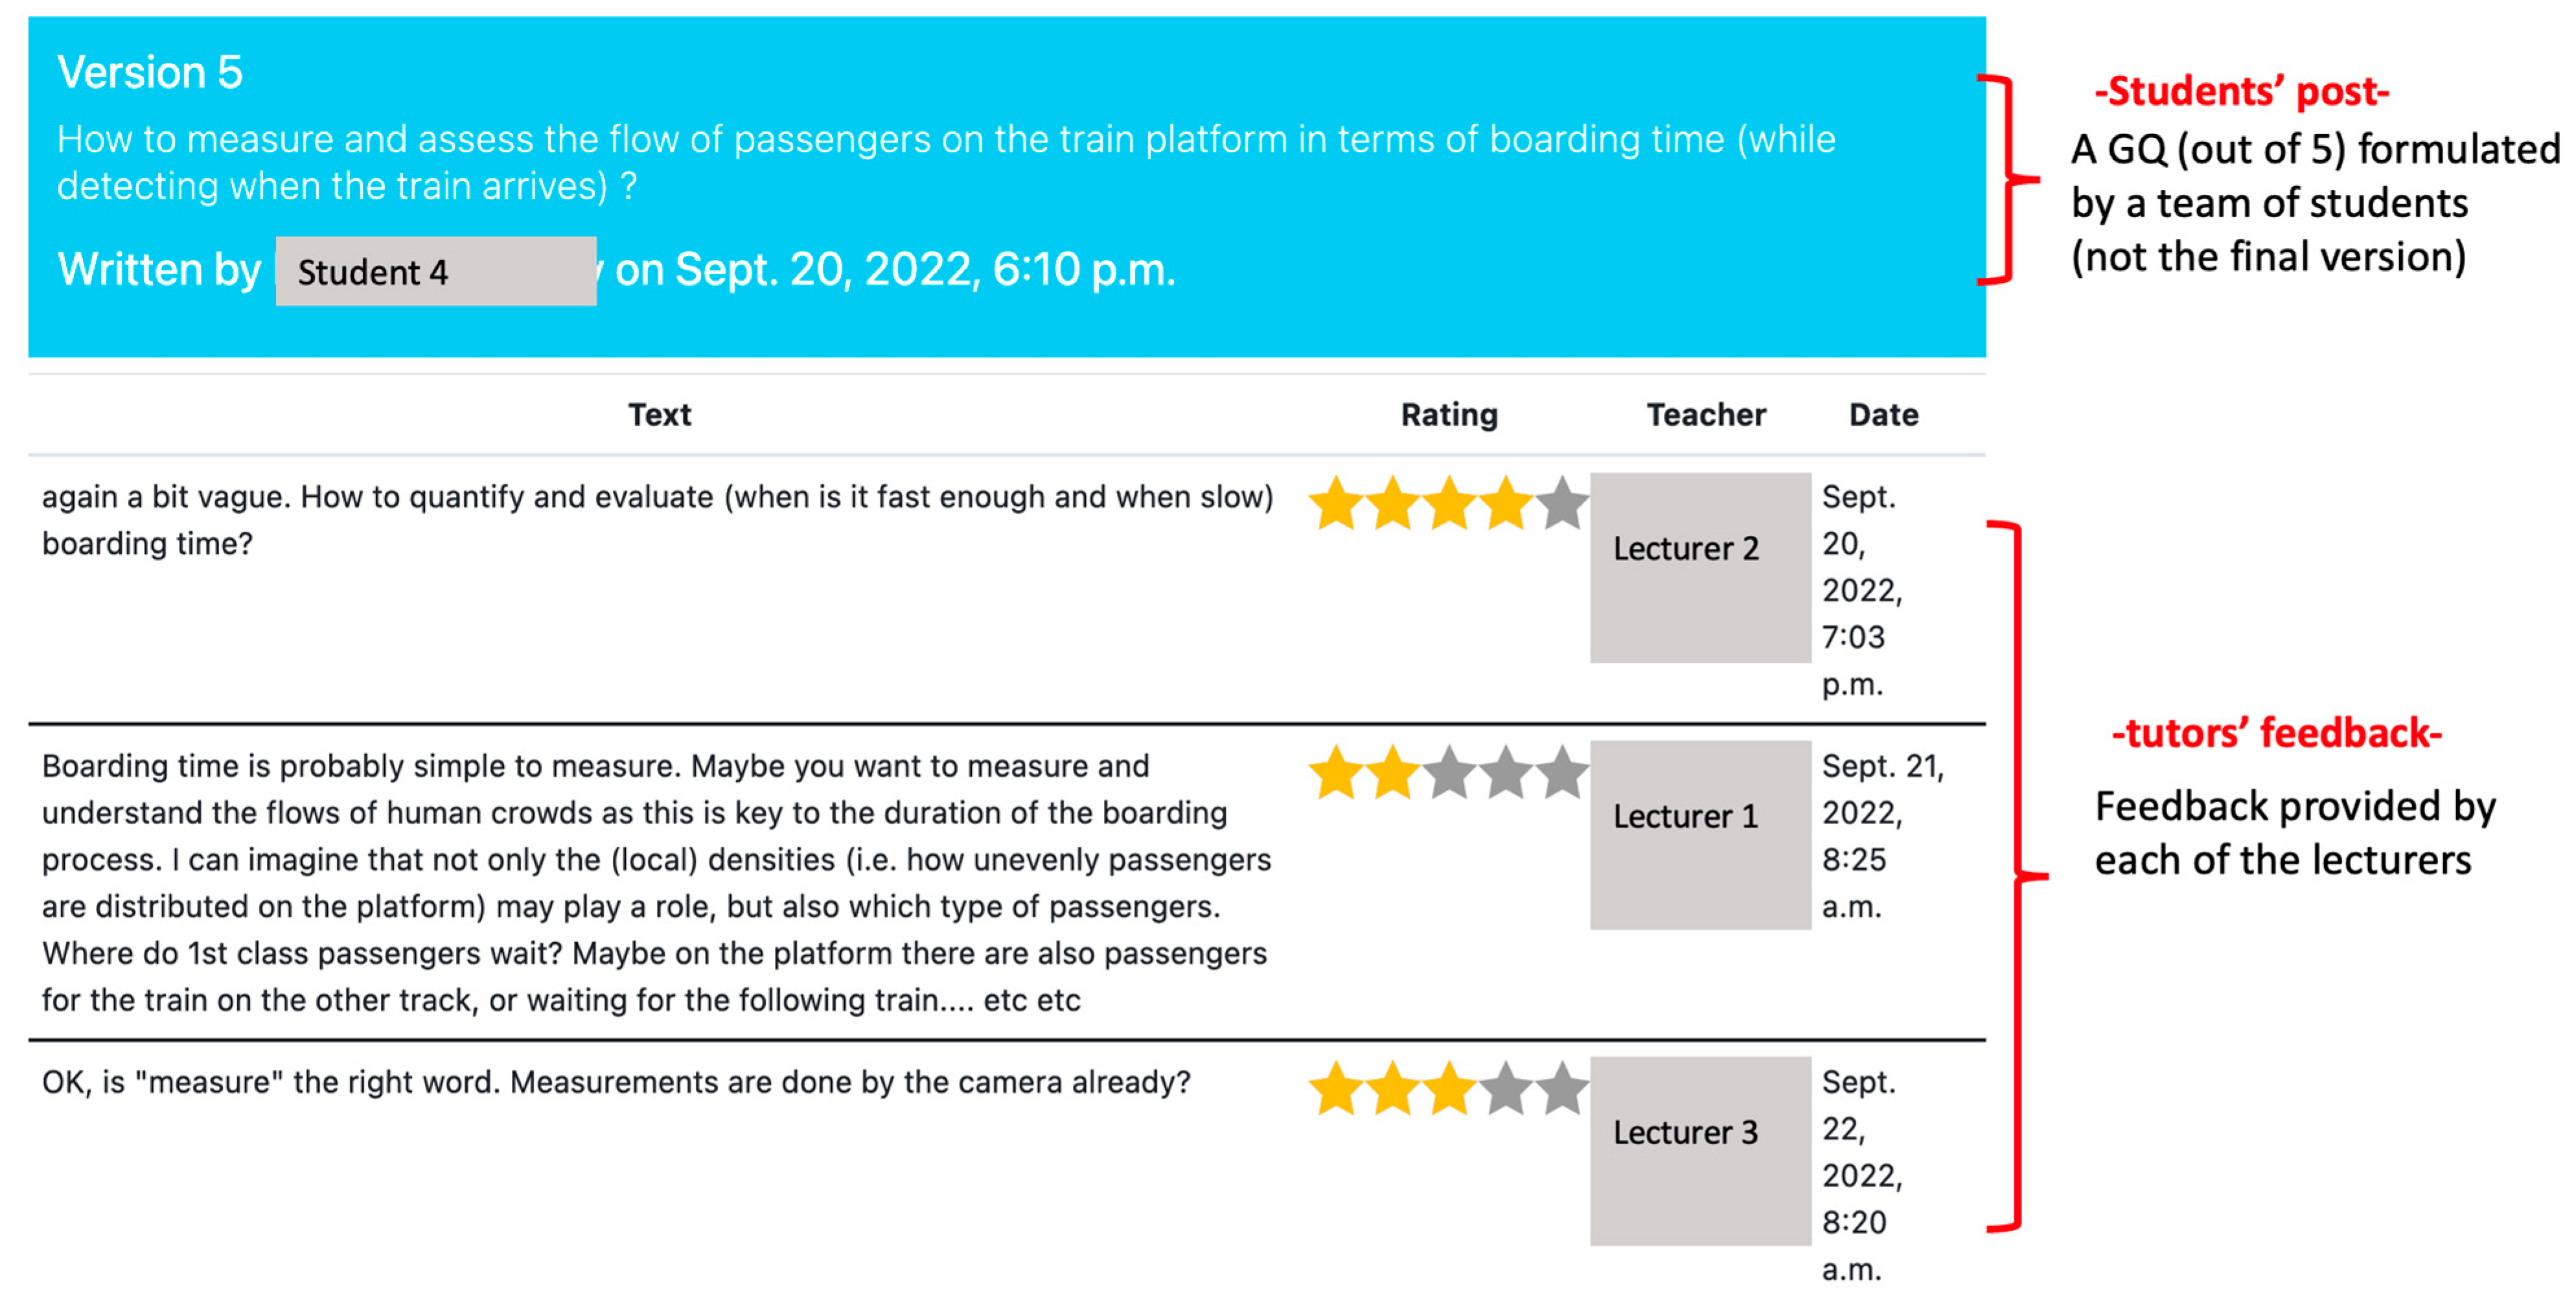
With the aim of speeding up the feedback process, two academics involved in the course designed a DCR: the Dashboard (Toschi et al., 2023). The Dashboard has been designed to address the limitations of traditional feedback methods by ensuring prompt responses from the tutors, continuous progress monitoring, and structured teamwork management. Traditional feedback methods, such as face-to-face interactions in student group work or direct teacher–student consultations, are limited by time and place constraints. The Dashboard allows for continuous feedback outside scheduled class times, enabling students to receive timely responses. This immediacy is critical in teaching approaches such as CBE, where students define their guiding questions within a constrained timeframe. The Dashboard enables them to upload these questions as often as needed and receive rapid feedback within the first two weeks of each eight-week-long quartile. The lecturers can review and rate the questions quickly, providing concise feedback that helps students refine their inquiries effectively (Figure 2). Therefore, the feedback is not restricted just to face-to-face consultations twice a week. Furthermore, the Dashboard aids in the construction of students’ interdisciplinary knowledge through this inquiry process by synthesizing the feedback from lecturers who come from different disciplines, thereby getting a sense of how different disciplines view the same problem they are solving. Another feature of the Dashboard is its real-time monitoring capability. Lecturers can track student teams’ progress by viewing average rating scores and discuss any issues with tutors of individual student teams if need be. Teamwork, often a challenging aspect of student projects, is made transparent through the Dashboard. It introduces tools like Trello boards and Scrum-like project management, coupled with a peer-review feature. Students rate each other on various aspects of teamwork, enhancing accountability and awareness. This transparency in teamwork encourages accountability and awareness of team dynamics, enabling students to understand and improve their collaborative skills, as well as fostering ownership and active participation in learning.
Figure 2 shows one case of how the interaction between the students and the three lecturers of the course developed through the Dashboard. This case shows that after the students’ posts, the team received quick feedback on their Guiding Question from each lecturer (one of them even responded in less than an hour).

3.3. Data Collection and Data Analysis Strategies

The participants in the study were two teams (out of 13) of 5 students, and tutors (the 3 lecturers of the course: physics, psychology and ethics; and one teaching assistant (TA) per team). This study employs an embedded multiple-case design (Yin, 2002; Yazan, 2015), where the two student teams serve as primary units of analysis within the broader context of the CBE mathematics course. The case study approach is instrumental in exploring the situated use of digital resources and the variations in modeling practices between teams. Following Yin’s analytical framework, the data analysis was conducted through three systematic phases: (1) within-case analysis to develop comprehensive descriptions of each team’s resource utilization and mathematical modeling processes; (2) cross-case pattern analysis using replication logic to identify similarities and differences between teams; and (3) theoretical integration to synthesize findings with the instrumental approach framework. The analysis strategy combined Stake’s (1995) interpretive approach for understanding the unique context of each case with Yin’s systematic cross-case synthesis to enhance the reliability and validity of findings.
The data collection strategies are summarized in Table 2.
The interviews were conducted at the end of the course. During the group interviews, each student was asked to draw a free-form diagram of how they used the different resources during the course. These drawings (Schematic Representation of Resource System-SRRS, Pepin et al., 2017b) provided schematic representations, for the authors to conduct the analysis using the instrumental approach, of how students used and integrated different resources throughout the course. To carry out the content analysis (Mayring, 2015) based on the RQ, first, from the observations and the SRRSs, we identified the different digital and other resources used by students and tutors during the course. We analyzed this part mainly with the instrumentation process. Second, we coded the data to delve into the use of the Dashboard to analyze how the students, working on the Guiding Questions, faced the early stages of mathematical modelling. This part is analyzed through the instrumentalization process.

4. Results and Findings

We present results focusing on how the use of digital resources is integrated with other resources to support the two teams in the early stages of mathematical modelling, when they face a challenge related to the efficiency of crowd flow on railway platforms.

4.1. Team 1

Team 1 worked on the challenge to “Improve efficiency on the platforms by influencing pedestrians’ routing decisions” (Table 1).

4.1.1. Instrumentation Process Related to the Use of Digital and Other Resources

From the observations and the SRRSs the following resources were identified as being used by Team 1: stakeholder lecture, discussion with professors and peers, Dashboard feedback, knowledge from onboarding week, internet, knowledge from previous courses, MS Teams, Trello, library, Google scholar, databases, Jupyter notebook, Python 3, Github, PowerPoint, Matlab, Latex, WhatsApp, and psychology and ethics articles.
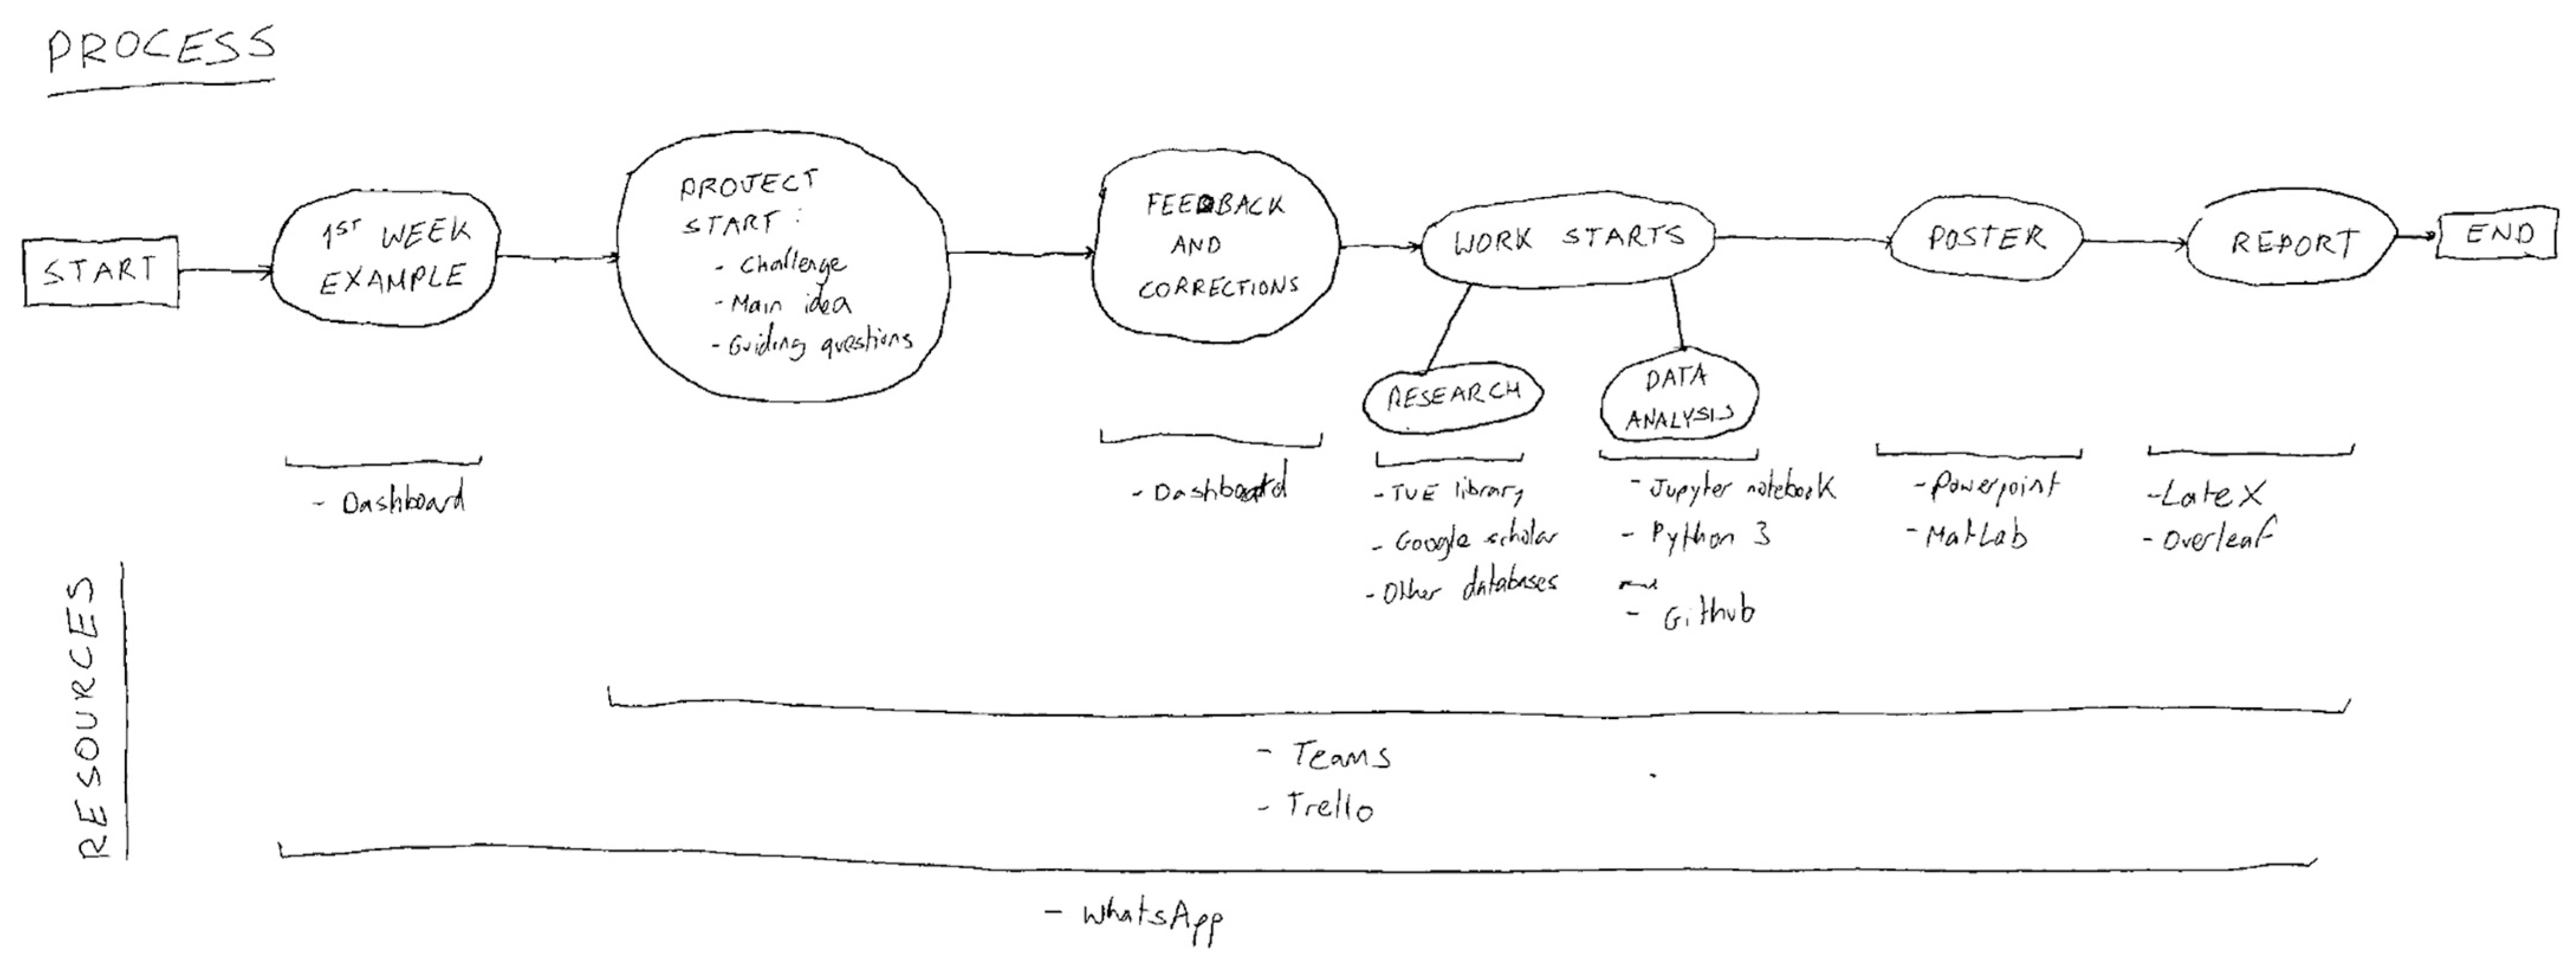
In relation to how the students structured and developed their activity, Team 1 indicated in their report that they learned “that we have to watch out for assumptions that might not be true. On the other hand, we also learned that it is good to keep reflecting on the progress of the project and to not be afraid to change things if necessary.” For this, the use of the Dashboard played a central role in supporting the reflection of the Guiding Questions. This can be observed in the drawing made by one of the students during the interview (Figure 3).
The instrumentation process involves the identification of resources used by the team, which includes both digital and non-digital resources. The diverse range of resources highlights the multidimensional nature of the instrumentation process, where students draw on a variety of resources to support their learning and activity. For example, the students acknowledged the importance of avoiding assumptions that may not be true and emphasized the value of continuous reflection on project progress. In this aspect, the use of the Dashboard played a central role in supporting reflection on the Guiding Questions, indicating that digital tools, like the Dashboard, can be instrumental in facilitating the reflective aspect of the instrumentation process. The integration of various digital resources (MS Teams, Trello, Jupyter notebook, Python 3, Github) into the activity shows the role of digital resources as an integral part of the instrumentation process.

4.1.2. Dashboard-Related Instrumentalization Process

From Figure 3 and interviews, we observed that the use of the Dashboard supported the identification of the challenge and the Guiding Questions, before the students proceeded with the research and the data analysis (Figure 3: “work starts”). Team 1 formulated five Guiding Questions, ten Guiding Activities and ten Guiding Resources for the investigation of their challenge. The five Guiding Questions for the investigation of this challenge were:
(1)
How do we quantitatively define efficiency?
This Guiding Question had seven previous versions. Version 6 of this question had two questions: “How do we define efficiency on the train platform?” and “How do we quantify efficiency and what is the current efficiency?” One of the lecturers suggested rephrasing the question in the following way: “How do we quantitatively define efficiency and what are its current values?
To answer this question, the students pointed out in their final report that: “As the research deals with a complex system, efficiency will be defined in a few different terms so that wider and deeper scope of the research can be covered.” Then, they defined: (1) the term “Crowd flux” as C r o w d   f l u x = δ n δ t , where n = n u m b e r   o f   p e o p l e and t = t i m e . This term was used to describe the crowd dynamics on a macroscopic level. (2) The term s p e e d = d i s t a n c e   t a k e n t i m e   t a k e n to describe the crowd dynamics on a microscopic level.
(2)
To what extent do present spatial factors (such as columns, fences, etc.) influence the way crowds choose their routes?
This Guiding Question had three previous versions. In its first version, “What is the natural behaviour of individual pedestrians deciding their routes?”, one of the lecturers said: “A bit vague. Natural behavior of people deciding their routes seems like a complicated way of saying what? It could be: what routes do people take, and/or why?
Some of the results that Team 1 found when working with the real data to solve this question, are shown in Figure 4 below.
The graphs in Figure 4, show how Team 1 determined that “when something is placed in between the two flows, the efficiency is much higher” and that “a line of columns works best”. They did this by relating the density of people per square meter to the average speed of those people depending on the obstacles they encountered.
(3)
What processes are currently a bottleneck to the efficiency at platform 2.1?
This Guiding Question had two previous versions. The feedback received on the Dashboard was aimed at pointing out that it was a good question.
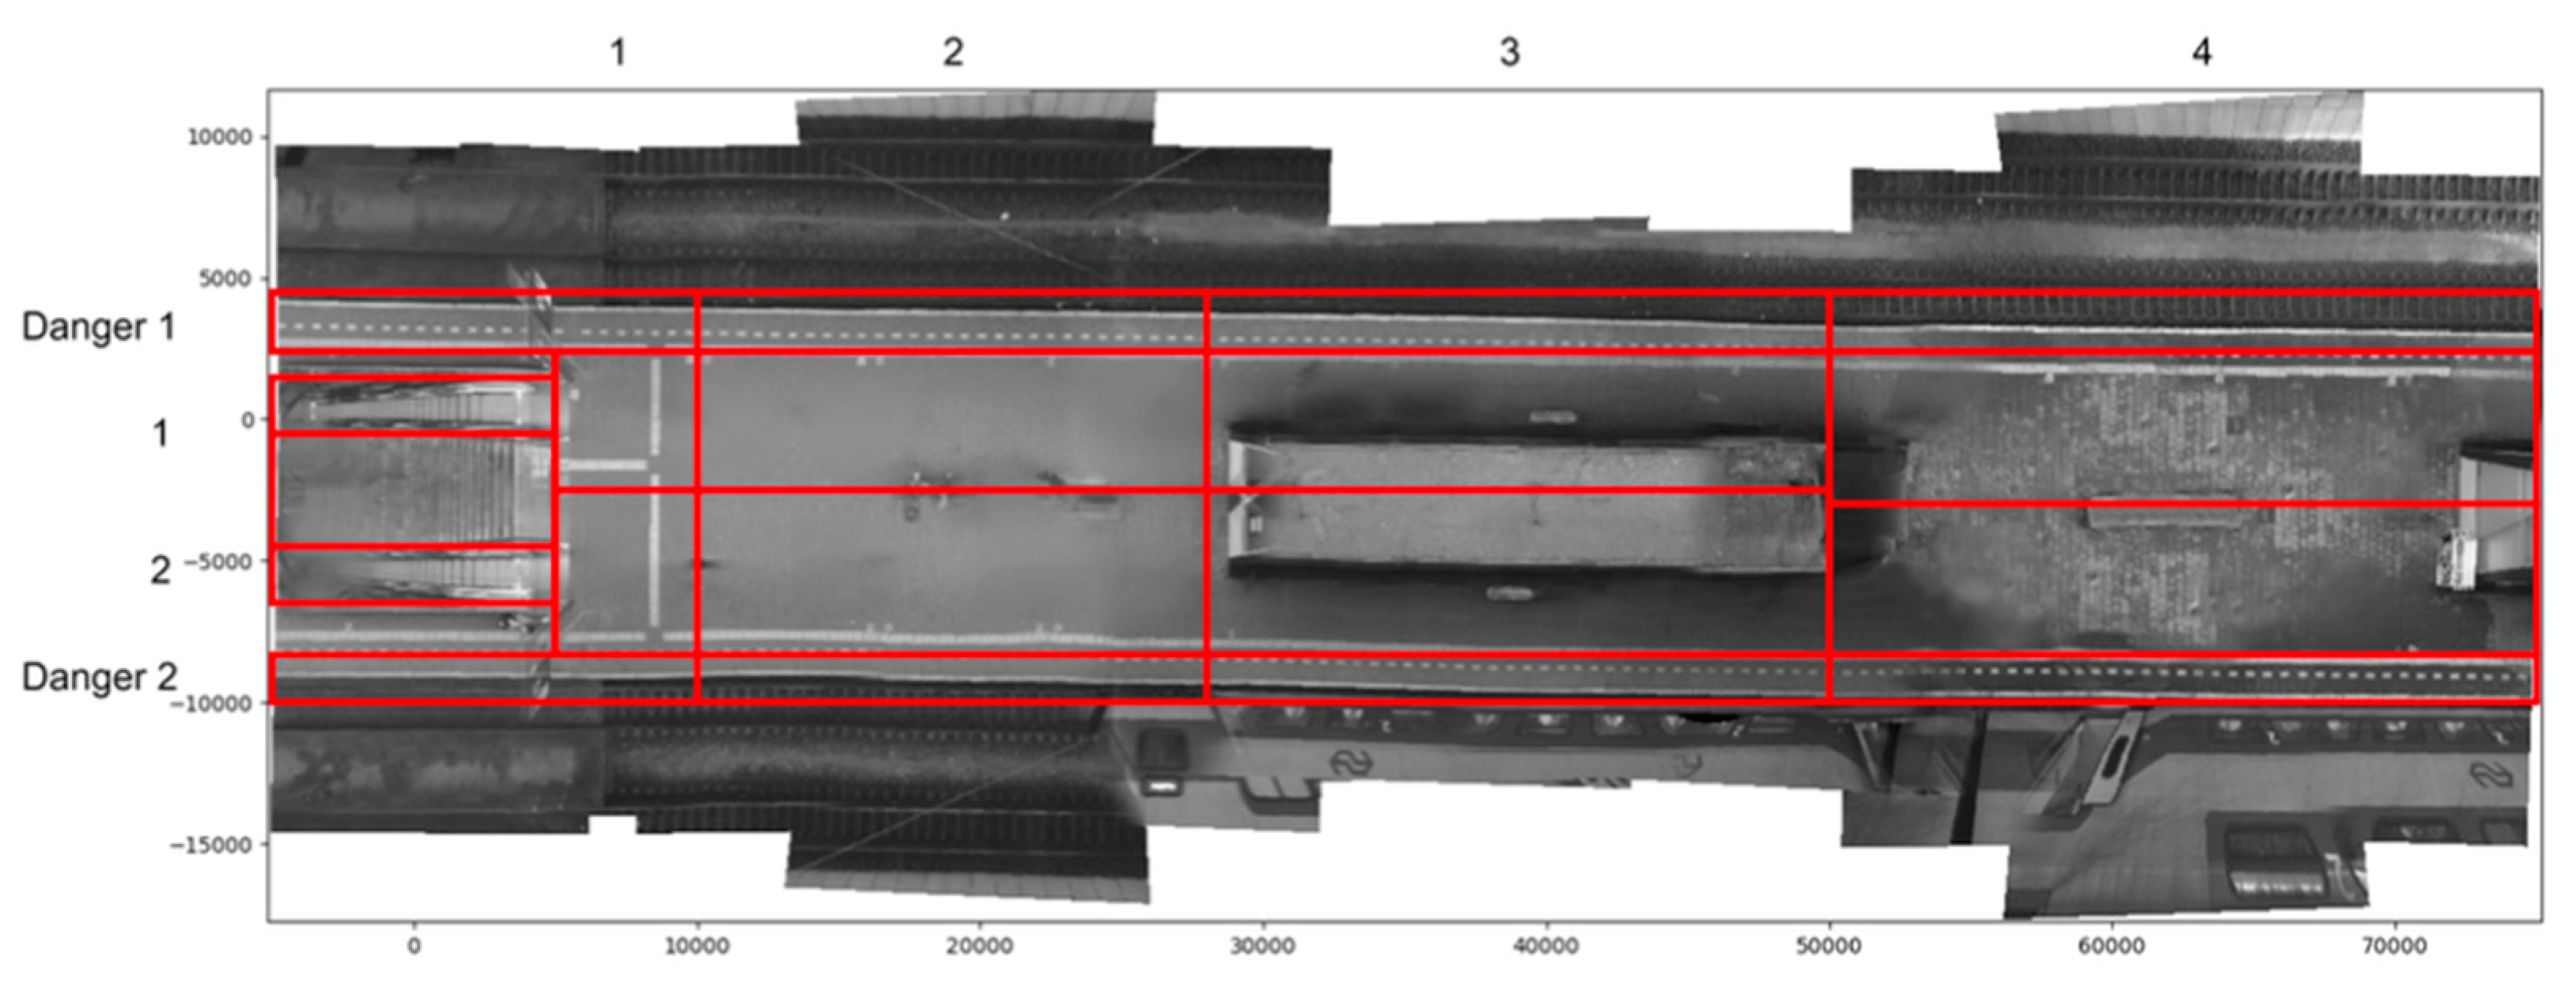
The students worked with the data to determine the different flows of people and the efficiency per zone of the train platform. To this end, they divided the platform into different zones and analyzed the density of people per zone (see Figure 5).
The students divided the platform into different zones (see Figure 5) so that they could identify relevant sectors, “such as the narrowing near the kiosk and the space right before the exit/entrance.
(4)
What are the trends for pedestrians’ path on platform 2.1 and what are the reasons behind it?
This Guiding Question had seven previous versions. In version 3, “What are the trends for pedestrians’ path on the platform? (Time taken, route taken, etc.)”, one of the lecturers told them that it was a good question and added that “What are the most frequent route decision (whatever you mean with this) and which seem detrimental.
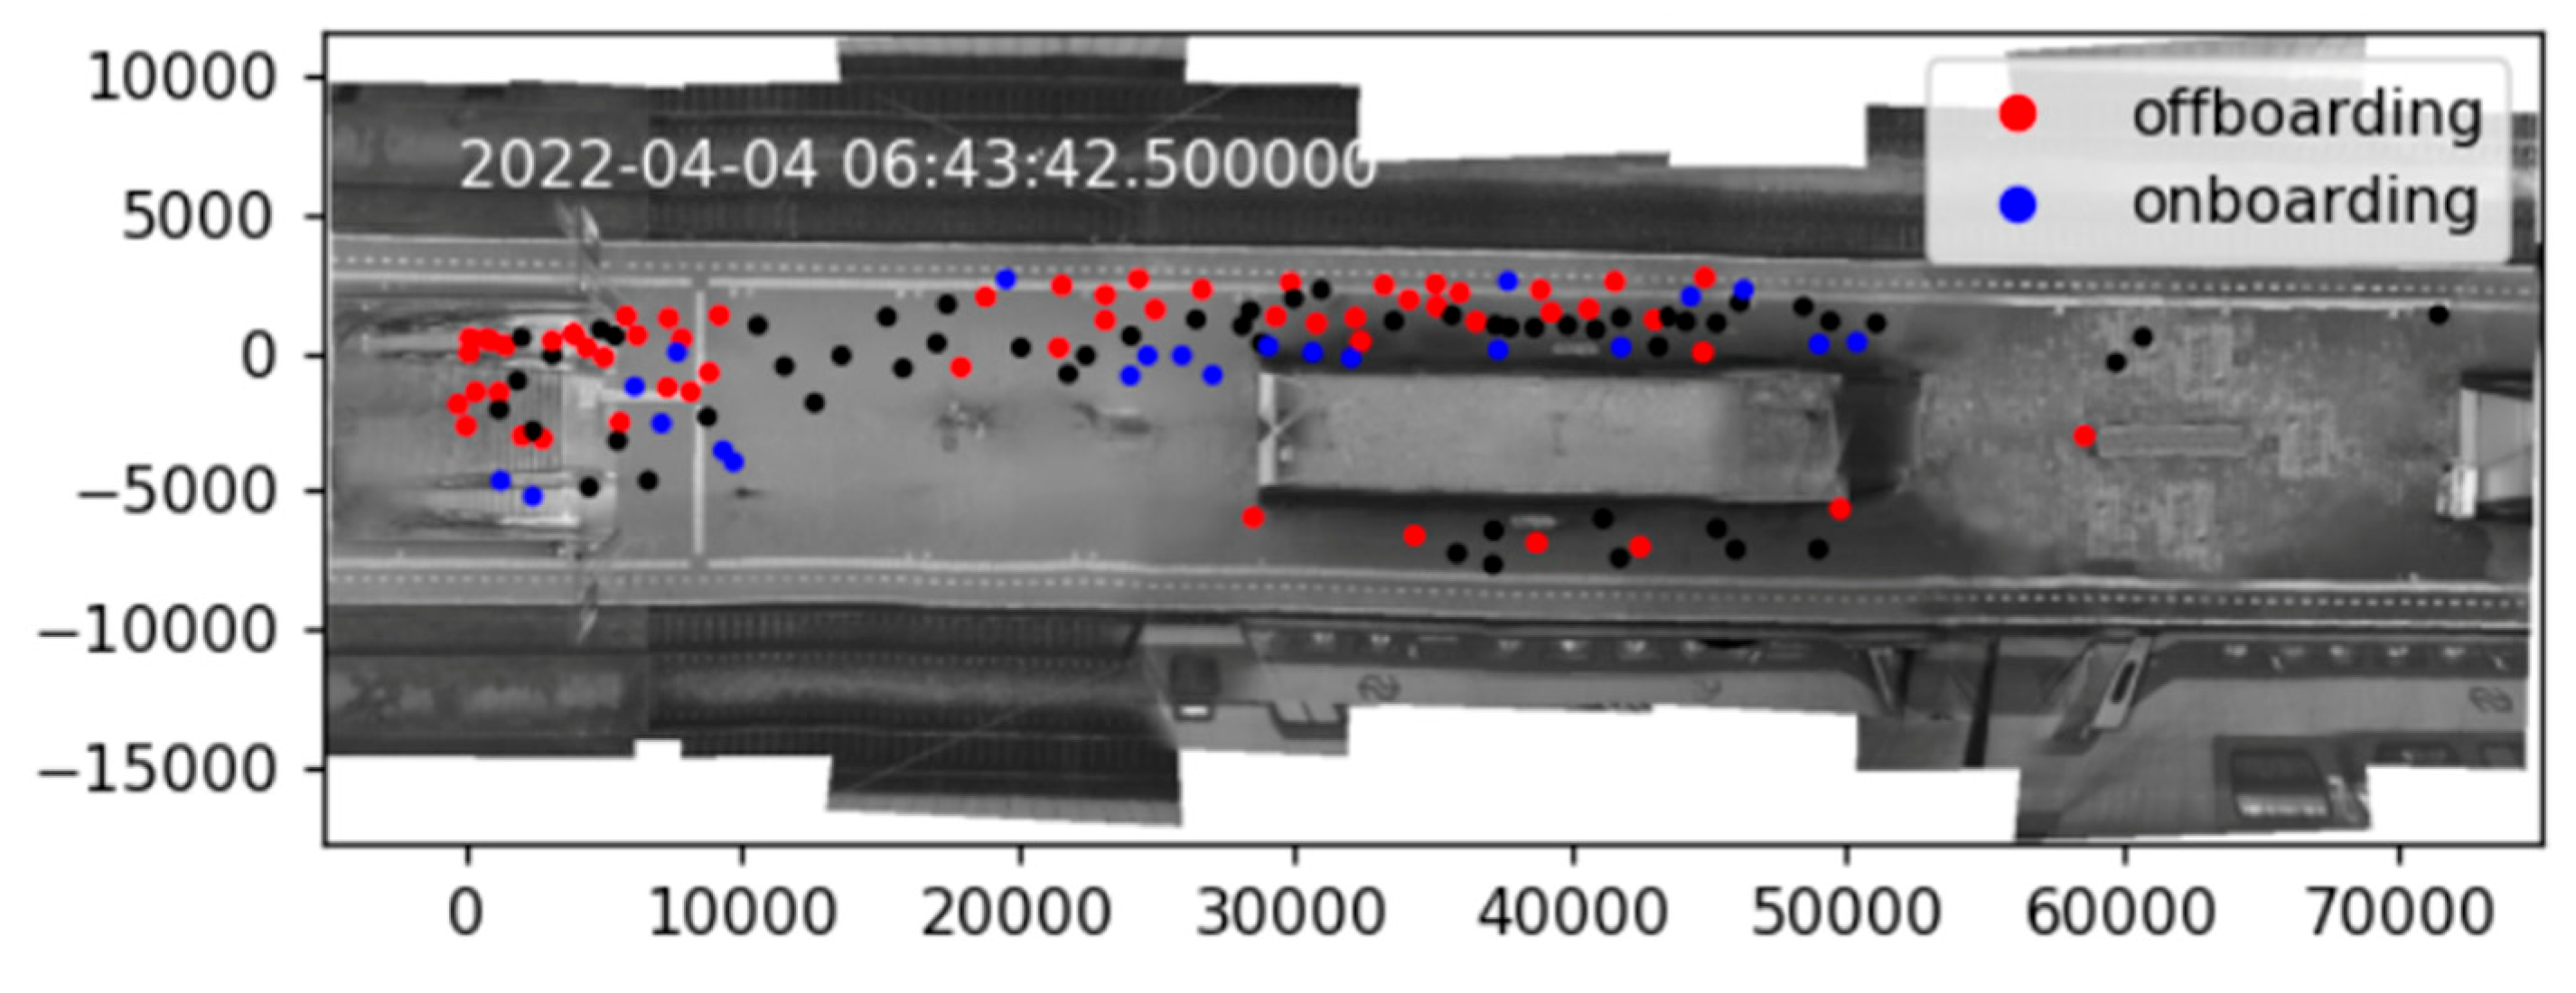
To answer this question, Team 1 created animations of the pedestrians “to identify trends in the flow of people that help us understand the social system”. Thus, they indicated in the report that “code was written that assigned to individual pedestrians either the label ‘onboarding’ or ‘offboarding’”. One of the animations produced by Team 1 is shown in Figure 6.
Figure 6 shows how Team 1 identified people who chose to go to the side of the kiosk nearest to them to board the train. In addition, to address this question, the students used the Markov Chain model, “considering the movement of an individual through the platform as a discrete-time stochastic process.
(5)
What are improvements in efficiency that can be made?
This Guiding Question had ten previous versions. In version 8: “What is the most efficient (as defined by Guiding Question 1) routing on a platform and how does it differ from the current routing?” the team received two comments that would help to make the question clearer. One of the lecturers asked: “Are you sure there is “one” efficient route?” and another lecturer said: “most efficient for what (speed, safety, …).
Team 1 approached this question based on the results found in the previous questions. The students identified that one of the problems to be solved to improve efficiency is related to the “accumulation of people in the left-most part of the platform, which causes a decrease in overall flow out of the platform. It is therefore important to identify bottlenecks in order to subsequently improve efficiency. In this respect it is particularly helpful to use the Markov model to try to modify the routes that people take.
The instrumentalization process is observed in the iterative development of questions, responding to feedback received through the Dashboard. The first Guiding Question underwent multiple versions, showcasing a dynamic process of refining the inquiry. Lecturer suggestions influenced the rephrasing, emphasizing the quantitative definition of efficiency. The instrumentalization process is further demonstrated in the subsequent questions, such as evaluating the influence of spatial factors and identifying bottlenecks. The Dashboard feedback guided the students in framing clear and relevant questions for data analysis. The graphical representations in Figure 4 and the division of zones in Figure 5 reveal how the team employed data to answer questions, uncovering efficiency patterns influenced by spatial factors and zone-specific pedestrian flows. Team 1’s animation in Figure 6 exemplifies instrumentalization through technology, as they visualized pedestrian movements to understand social dynamics. The adoption of a Markov Chain model for analysis showcases a sophisticated application of mathematical concepts as instruments in the investigative process.

4.2. Team 2

Team 2 worked on the challenge to design methods to distribute passengers on a train platform in order to improve boarding times (Table 1). To do this, students began by analyzing the data provided to them related to train boarding processes.

4.2.1. Instrumentation Process Related to the Use of Digital and Other Resources

From the observations and the SRRSs, we identified the following resources used by Team 2: onboarding week, lectures, the Dashboard, data provided by stakeholder, internet, teaching assistant, YouTube, Github, friends, tutors, walk-in hours, literature, stakeholder lecture, discussion with professors and peers, psychology and ethics articles.
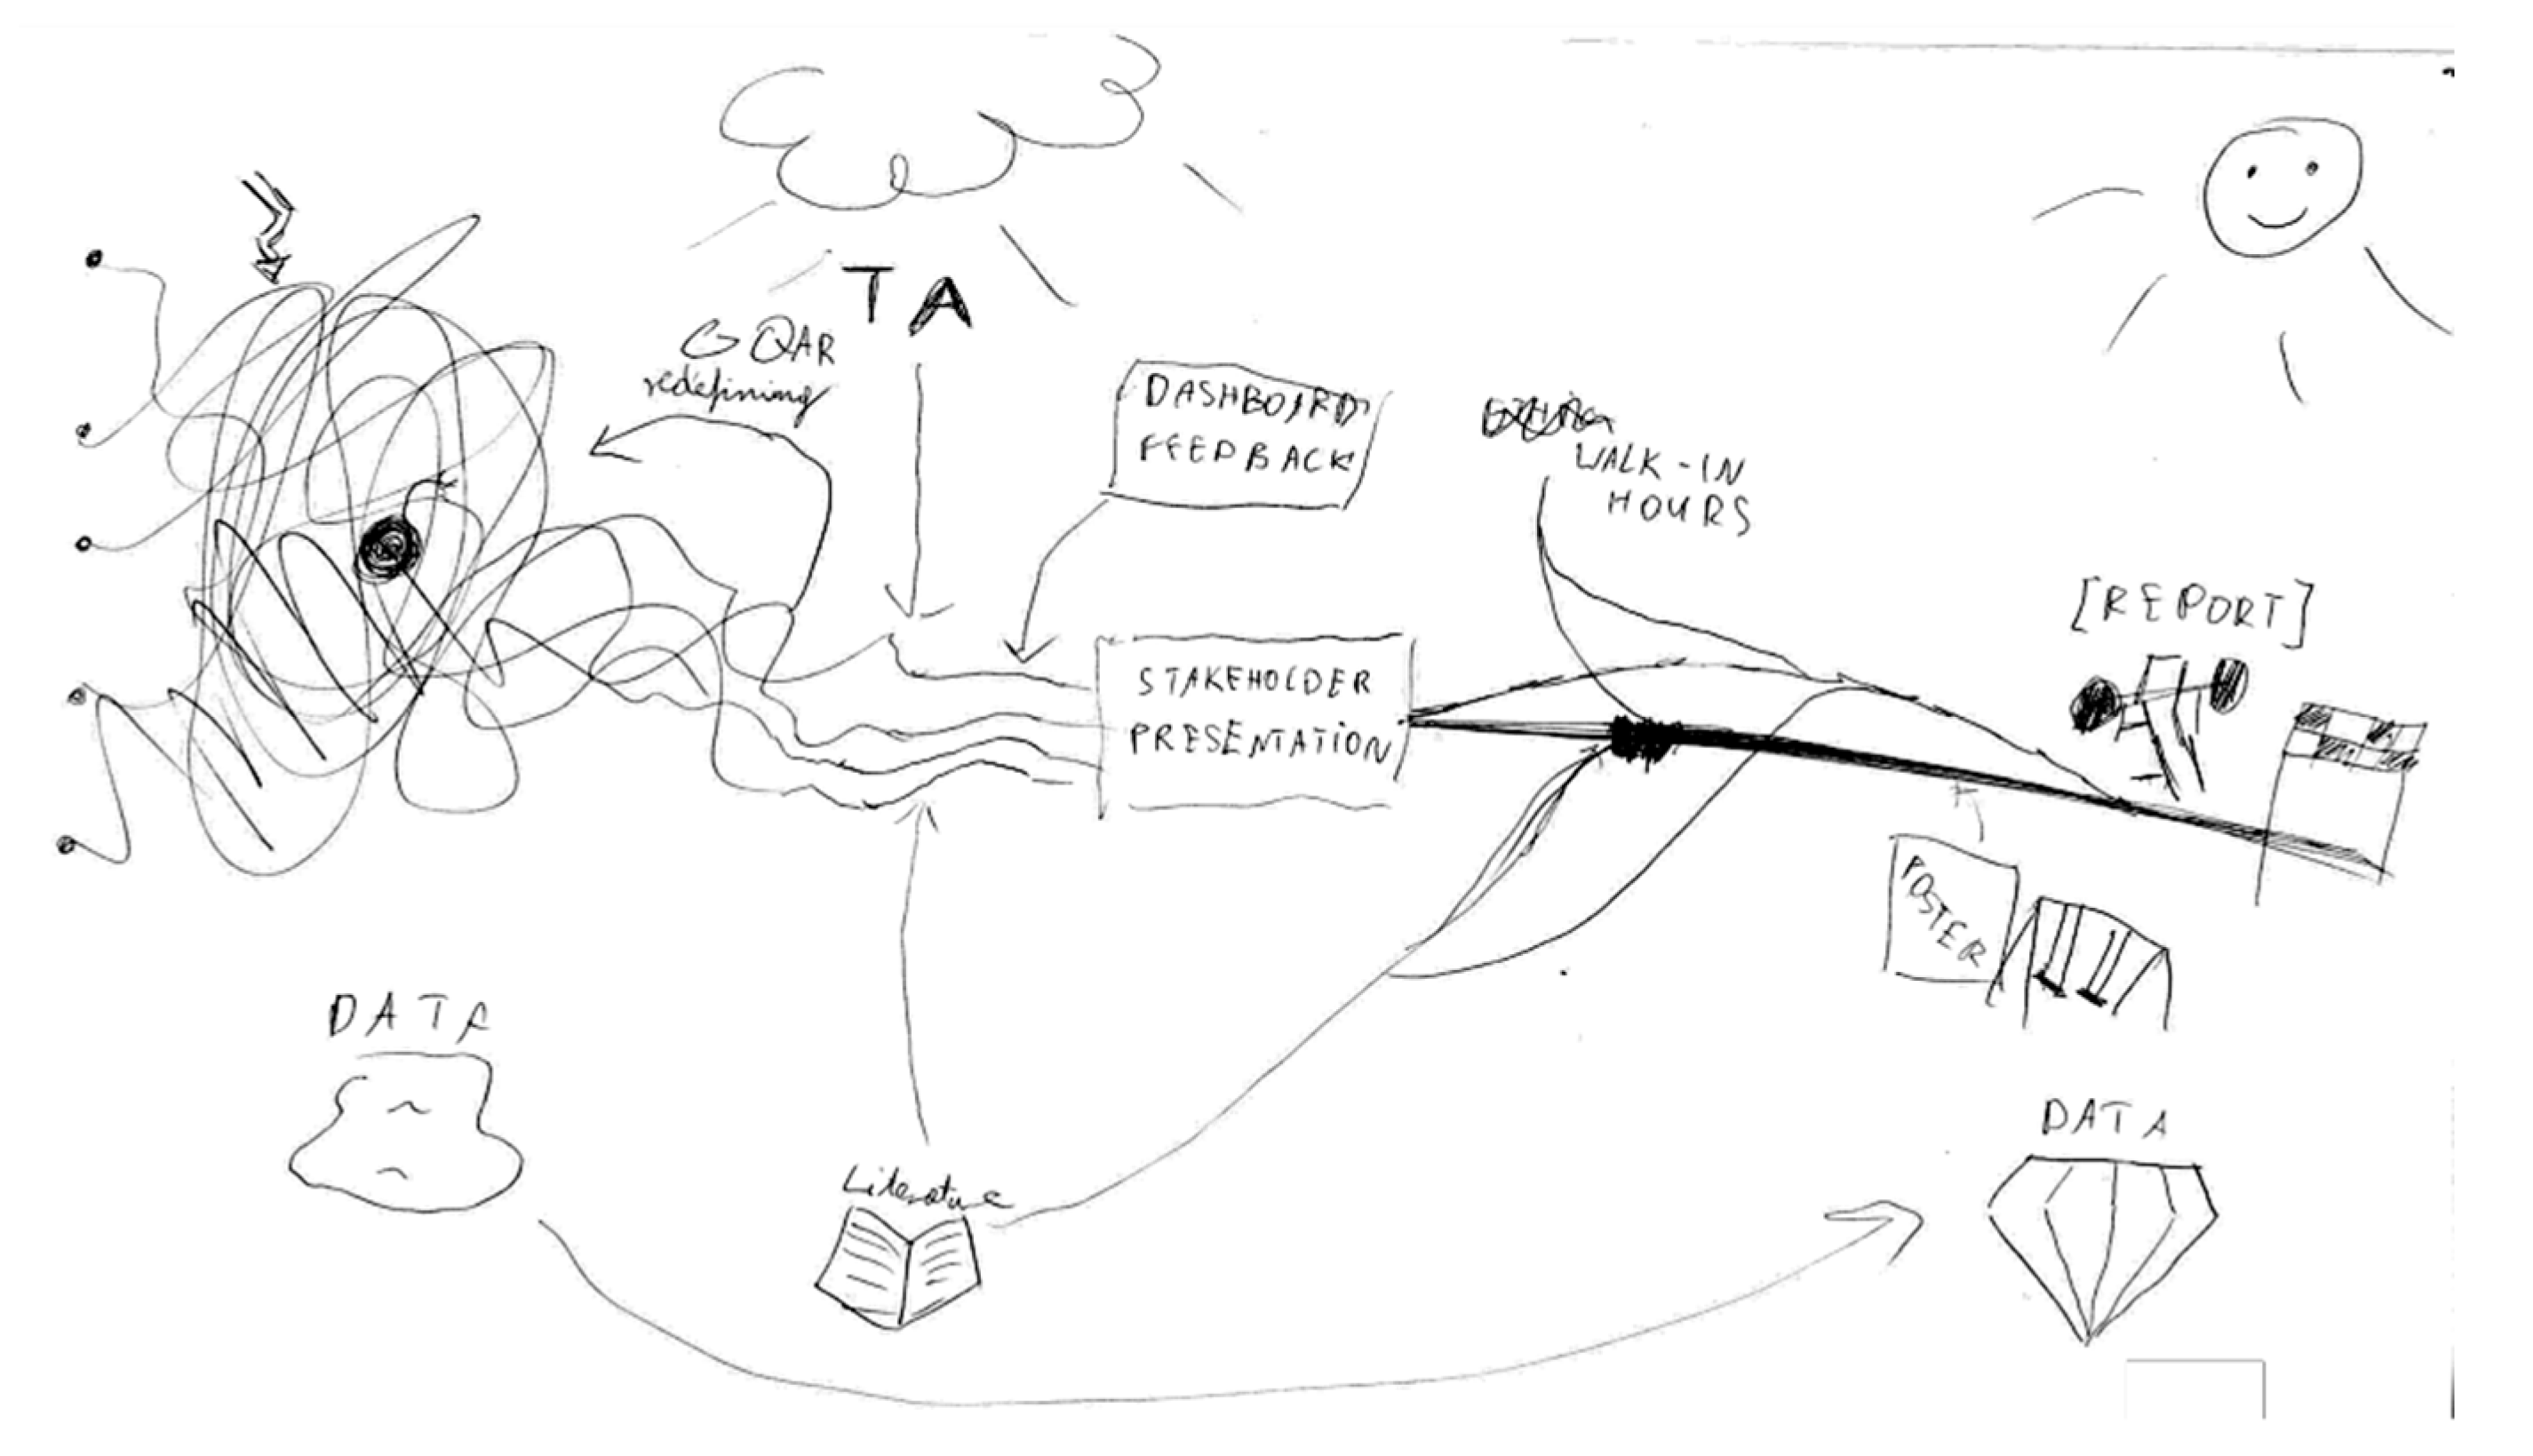
Students from this Team 2 expressed that it was important for them to recognize the characteristics of the Dashboard in the context of their activity and the course, e.g., S1: “Once I got used to it, I found some features that I didn’t know where they were, then I found it useful” and S5: “this is a very feedback centered course, in that sense I think the dashboard is definitely essential”; and to recognize how it helped them with the development of the challenge, e.g., S2: “I think is really nice to keep everything organized and have a nice interaction with the teachers easily through the comments that they can give from the guiding questions”. For the students in Team 2, the Dashboard also played a central role in supporting the reflection of GQs, as shown in one student’s SRRS (Figure 7).
Figure 7 shows that the Dashboard was particularly helpful in formulating the Guiding Questions, Guiding Activities, and Guiding Resources, which students had to formulate and reformulate based on the rapid feedback received from the tutors; S1: “At first there was chaos then the teaching assistant helped us very much, especially with redefining the guiding questions. Then, the dashboard feedback came, which got us onto some right track.” In the SRRS of S1, we can also observe that it was in the first part of the course that work was mainly done on the formulation and reformulation of Guiding Questions, which is consistent with the expected progression of the course.

4.2.2. Dashboard-Related Instrumentalization Process

The five Guiding Questions for the investigation of this challenge were:
(1)
How do we find the correlation between dwell time and distribution, and how does this change with the number of people on the platform?
This GQ had three previous versions. In the second version, “How does the distribution of people on the platform influence the boarding time and how to measure the correlation between boarding times and passenger distribution?”, the team received the following suggestion from one of the lecturers: “I would not limit myself to the distribution of people, there can be other factors that, given the same distribution, influence the boarding time.
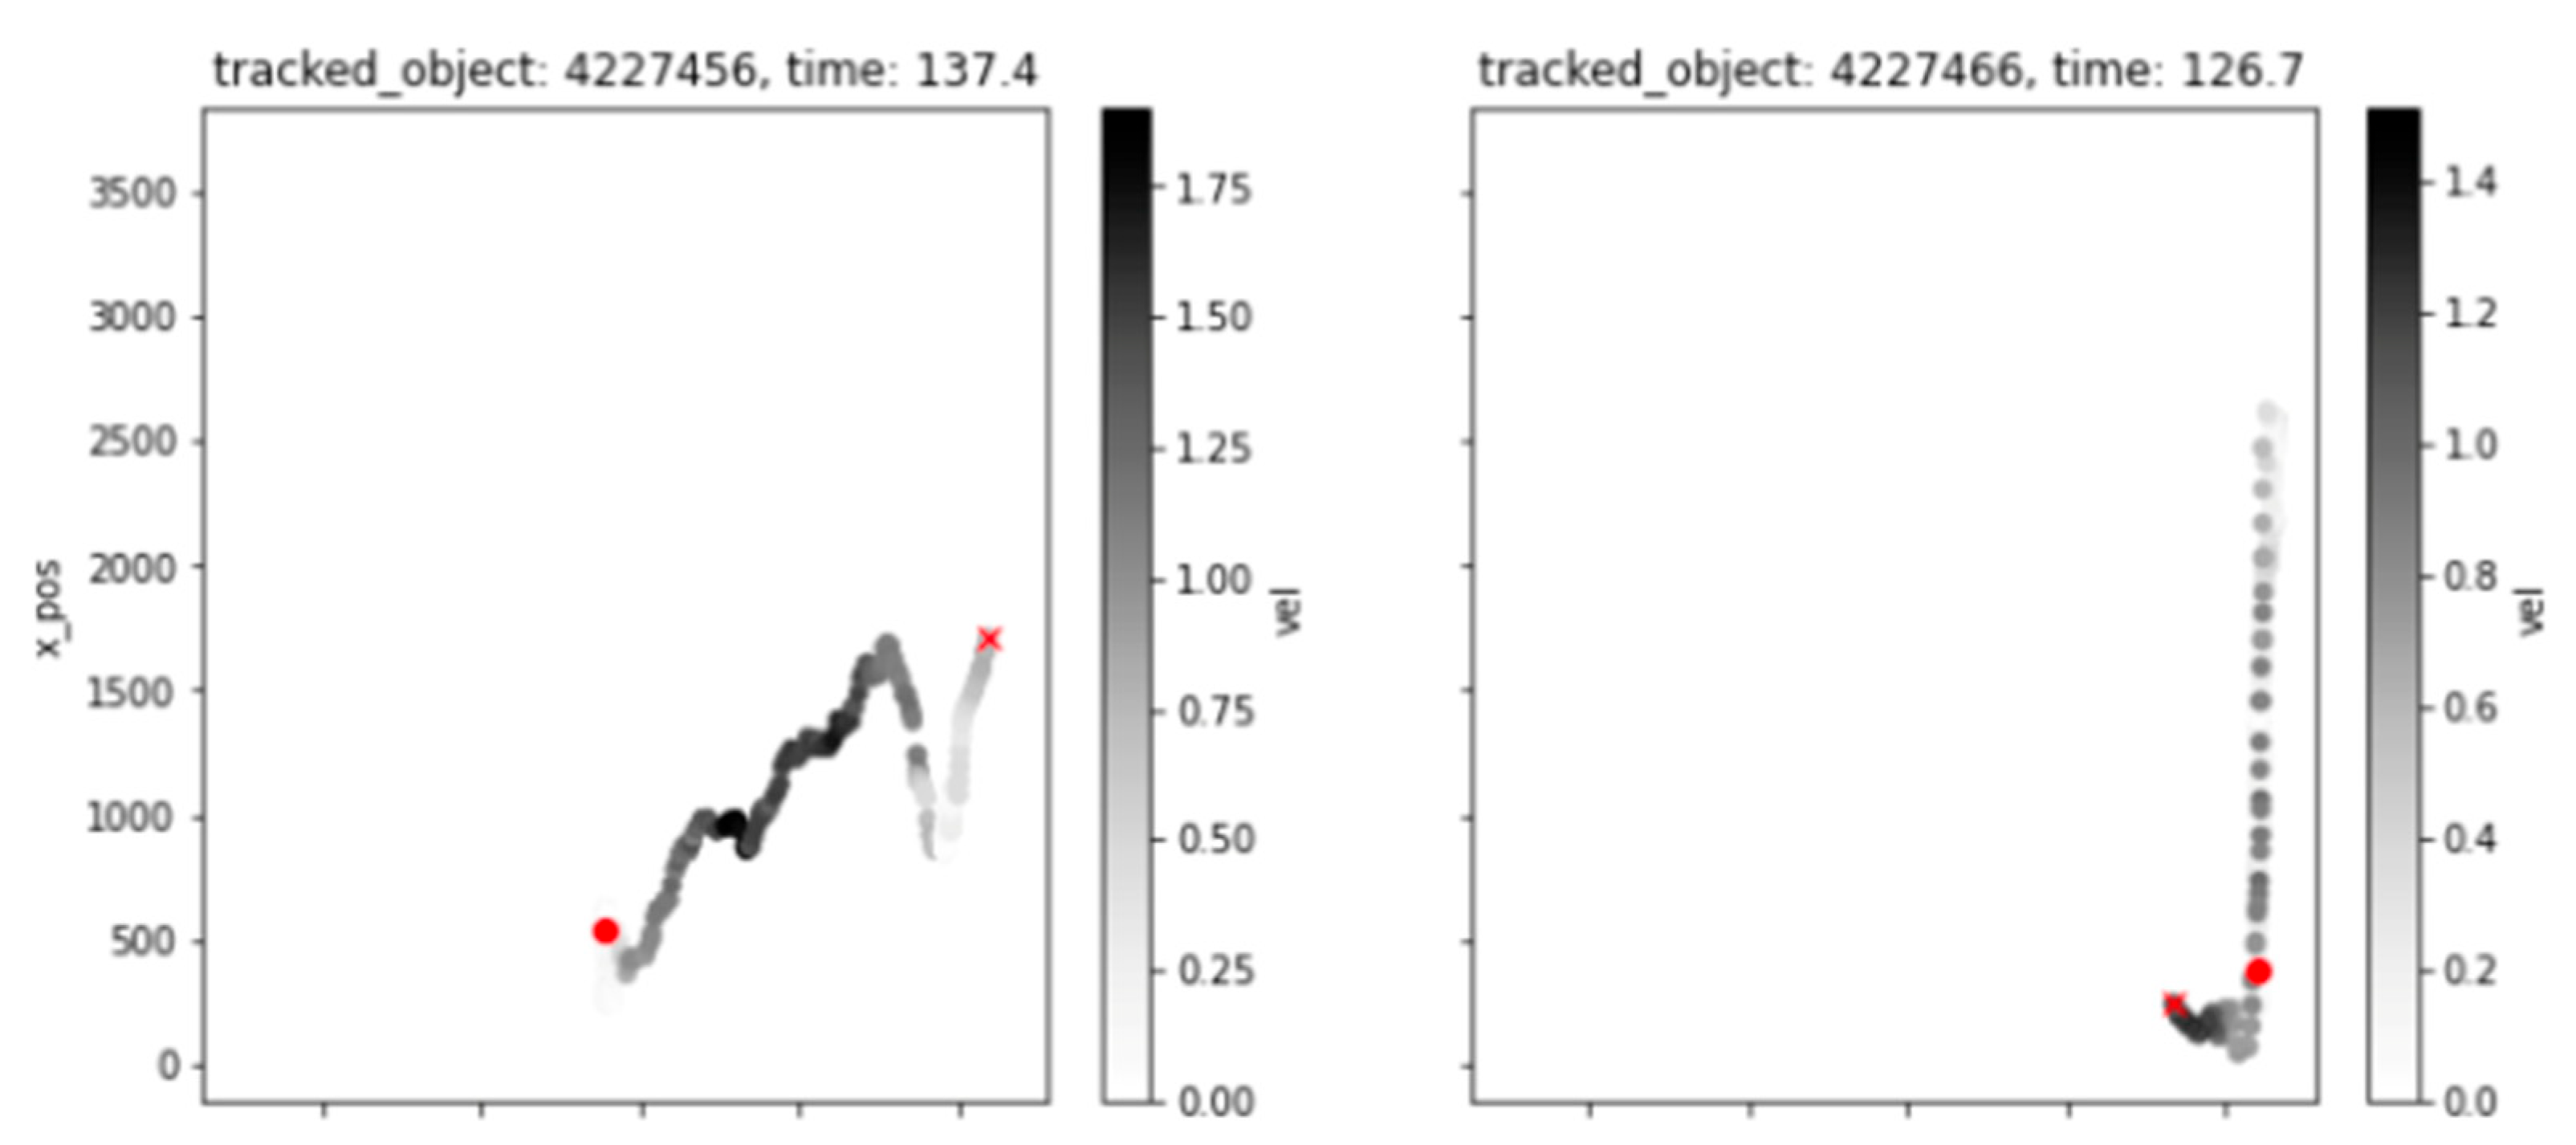
To answer this question, Team 2 worked with the real data to find, for example, the positions of the train doors along with the arrival and departure times of the trains, to calculate the distance passengers must travel from somewhere on the platform to board the train. Team 2 worked with the data to obtain graphs like the ones shown in Figure 8.
Figure 8 shows the trajectories of two randomly chosen people, where their start and end positions are marked with a circle and a cross, respectively, and shades of grey are used to represent their velocity. The horizontal and vertical axes represent their position on the platform. With data analysis, students can say that if the boarding time is shorter for the same number of people at two different trains, those people in the train with the shorter boarding time were more properly distributed across the platform, and then we can call that distribution more ‘optimal’.
(2)
How to define and measure the flow of (off-)boarding passengers on the train platform, by using the data containing their position in time?
This GQ had eight previous versions. In version 5: “How to measure and assess the flow of passengers on the train platform in terms of boarding time (while detecting when the train arrives)?” one of the lecturers pointed out that “Boarding time is probably simple to measure. Maybe you want to measure and understand the flows of human crowds as this is key to the duration of the boarding process.
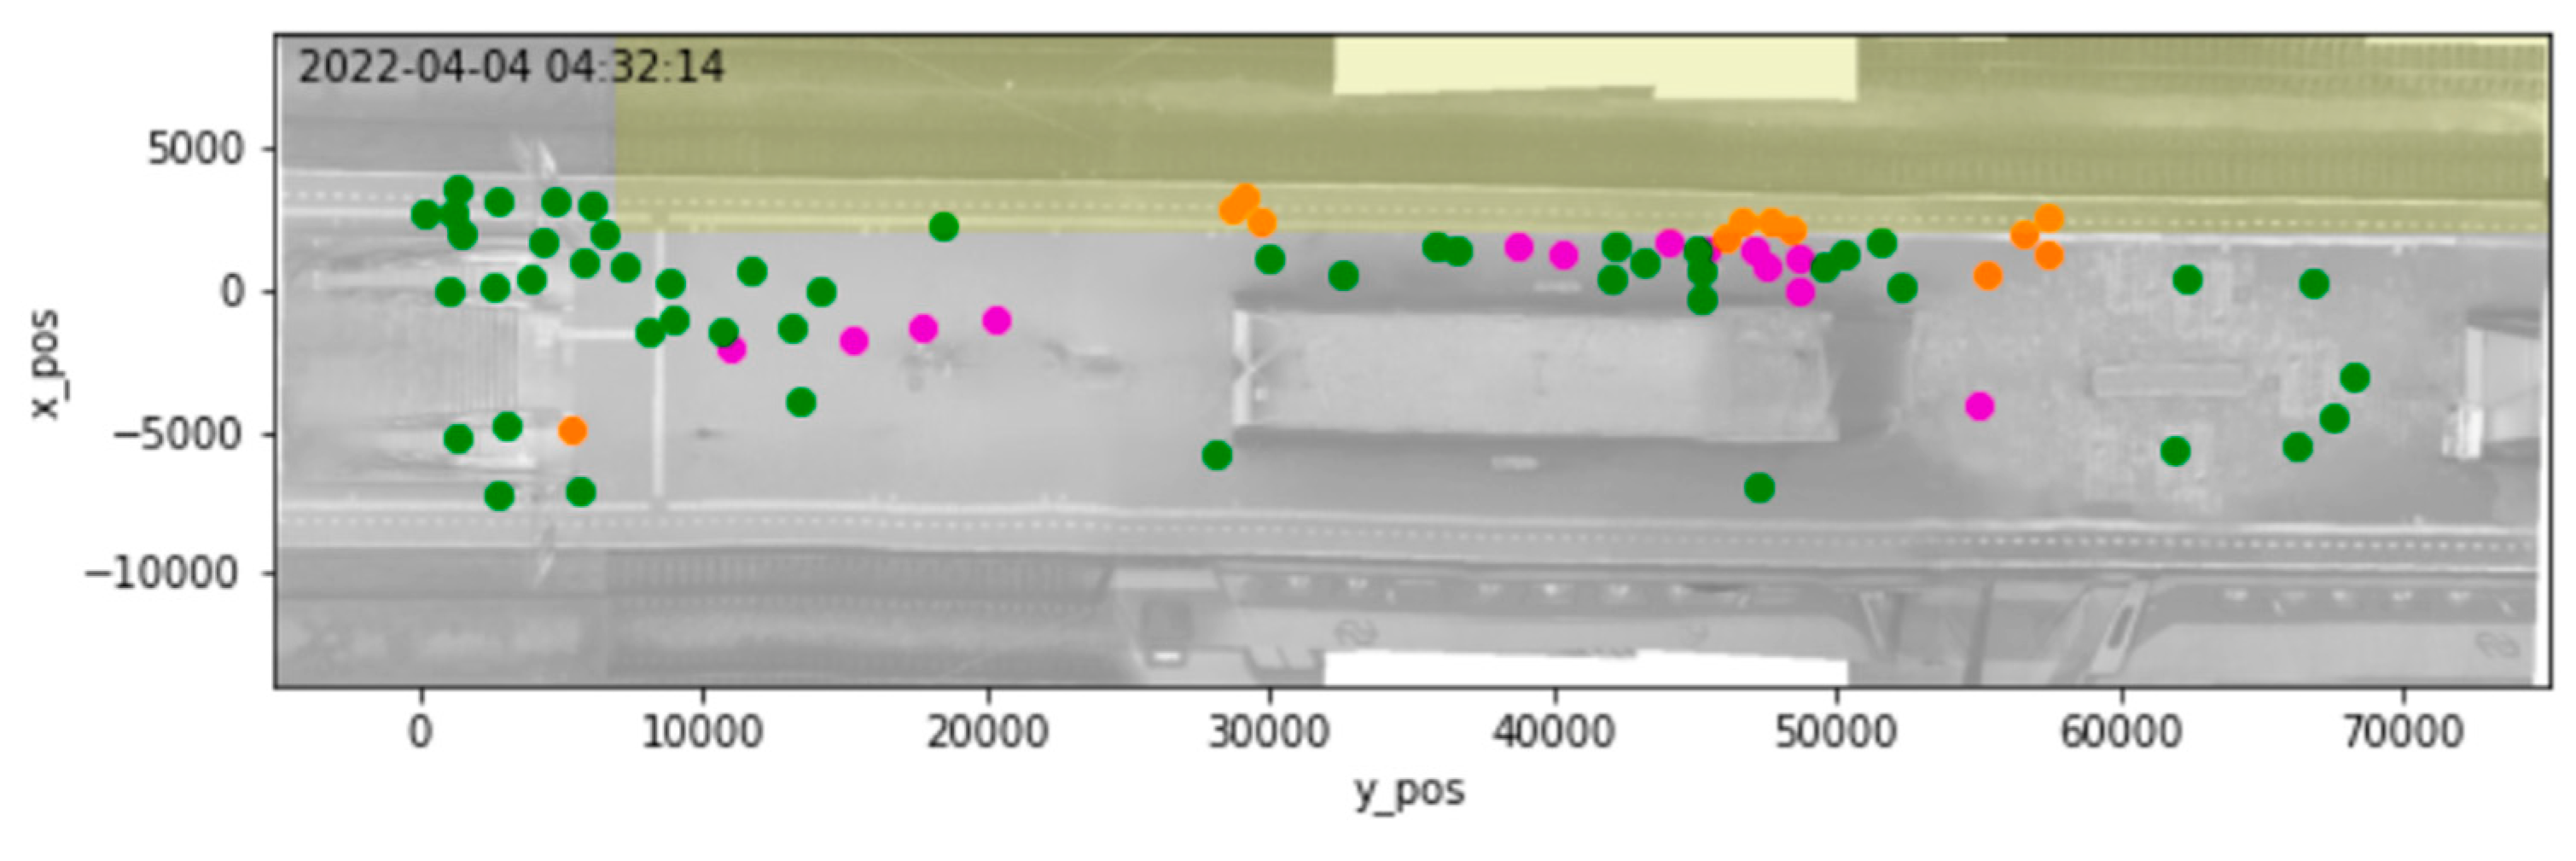
To answer this question, Team 2 created animations with real data on train boarding processes like the one shown in Figure 9.
Figure 9 represents a frame of an animation showing people getting off the train (purple dots) and those boarding the train (orange dots). The green dots are people without determining whether they are boarding or exiting the train.
(3)
How to identify the factors that influence passengers’ decision on avoiding/approaching different parts of the station, e.g., benches or trash bins, and how do these factors affect the passenger’s distribution on the platform?
This GQ had six previous versions. In the second version, “What are the rules and guidelines for designing a train station that need to be kept in mind while modifying it?”, the students received the following input by one of the lecturers: “Maybe a bit more general. What is already known about the dynamics of human crowds during boarding and how is this currently taken care of in stations design?
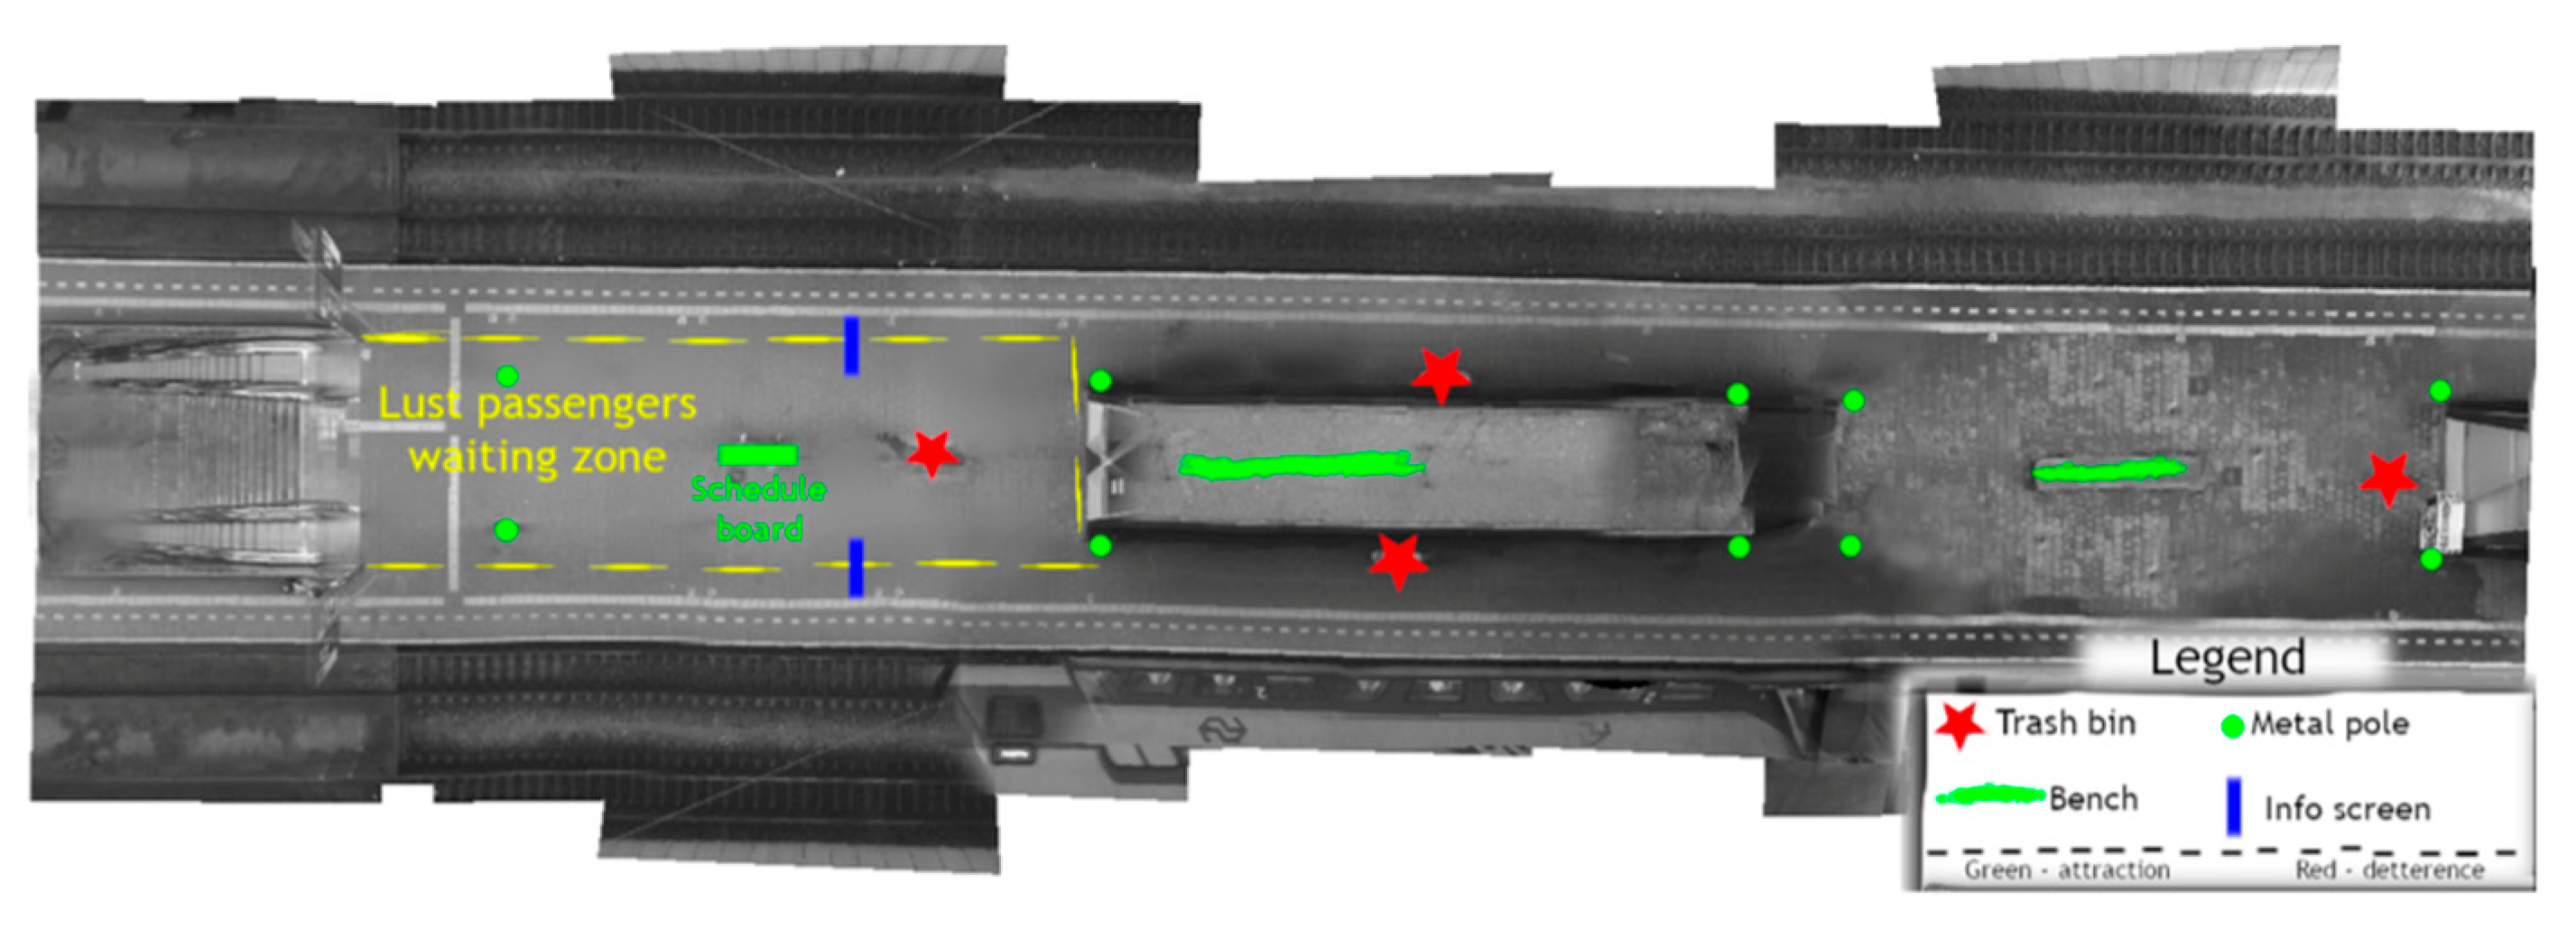
To answer this question, the students identified on the map of a train platform (Figure 10) places that attract (benches, timetables) and deter passengers (trash bins). The students observed that people tend to lean on the black, metal poles, hence these places were also included in the map.
The students identified on the map of the train platform the “lust passengers waiting zone”, and in their final report they mentioned that “The reason for the lust passengers to gather around the schedule board, is due to them seeking stimulation. They feel desire to be informed, because it creates a feeling of being in control of the situation. It is also frequent that they travel with large luggage, hence walking through the station and crowd is avoided as much as possible.
(4)
What are the ethical constrains and concepts we have to keep in mind while analyzing the data?
This GQ had three previous versions. All versions received good feedback in the sense that they were good questions and did not require adjustment. For example, the second version, “How do we define, quantify and visualize the distribution of people on the platform?”, was liked by one of the lecturers and they did not suggest any modifications. According to the development of the challenge research, the students decided on the last version.
On this question, the students pointed out in their final report that “Ethical values should be considered as only a quantitative analysis on the data is not sufficient to gain a valid conclusion to our research project.” and that “ethical concepts are very malleable when dealing with people and situations because context to context can be very different from day to day. When working and designing a nudge for people, ethical values and concepts need to be kept in mind in order for a successful and effective process.
(5)
How do we recognize moments in the data when a train arrives and leaves, to visualize and measure the boarding process?
This GQ has had five previous versions. In the fourth version, “How do we recognize moments in the data when a train arrives and leaves and how do we use this data to define the boundaries for boarding time?”, the most important question from one of the lecturers was: “are you sure that answering all questions you are able to tackle your challenge?
To answer this question, the students indicated in the final report that these data were added to the database at some point during the project. These data were used as a starting point. Then, Team 2 noted: “we wait for people to appear from the train, being people who have their initial position in an area around the doors. After we have recognized that people started appearing in the area around the doors, we wait for the time when for a couple of seconds, nothing happens, meaning nobody enters or exits. If this is the case, we consider the boarding process over.
In Team 2, as in Team 1, each Guiding Question underwent iterative refinement, shaped by feedback from lecturers and a recognition of potential limitations. The team actively engaged with real data, analyzing positions of train doors, arrival and departure times, and calculating passenger travel distances. The instrumentalization process extended to observational mapping, identifying factors influencing passenger behavior on the platform. Ethical considerations were integrated, emphasizing the need for values in data analysis. The students showcased adaptability, recognizing moments in the data when a train arrives and leaves, essential for visualizing and measuring the boarding process. Overall, Team 2’s instrumentalization process reflects a purposeful and adaptive approach, integrating feedback, ethical considerations, and real-world observations to effectively address the complexities of the train platform challenge.

4.3. The Use of the Dashboard in a CBE Environment

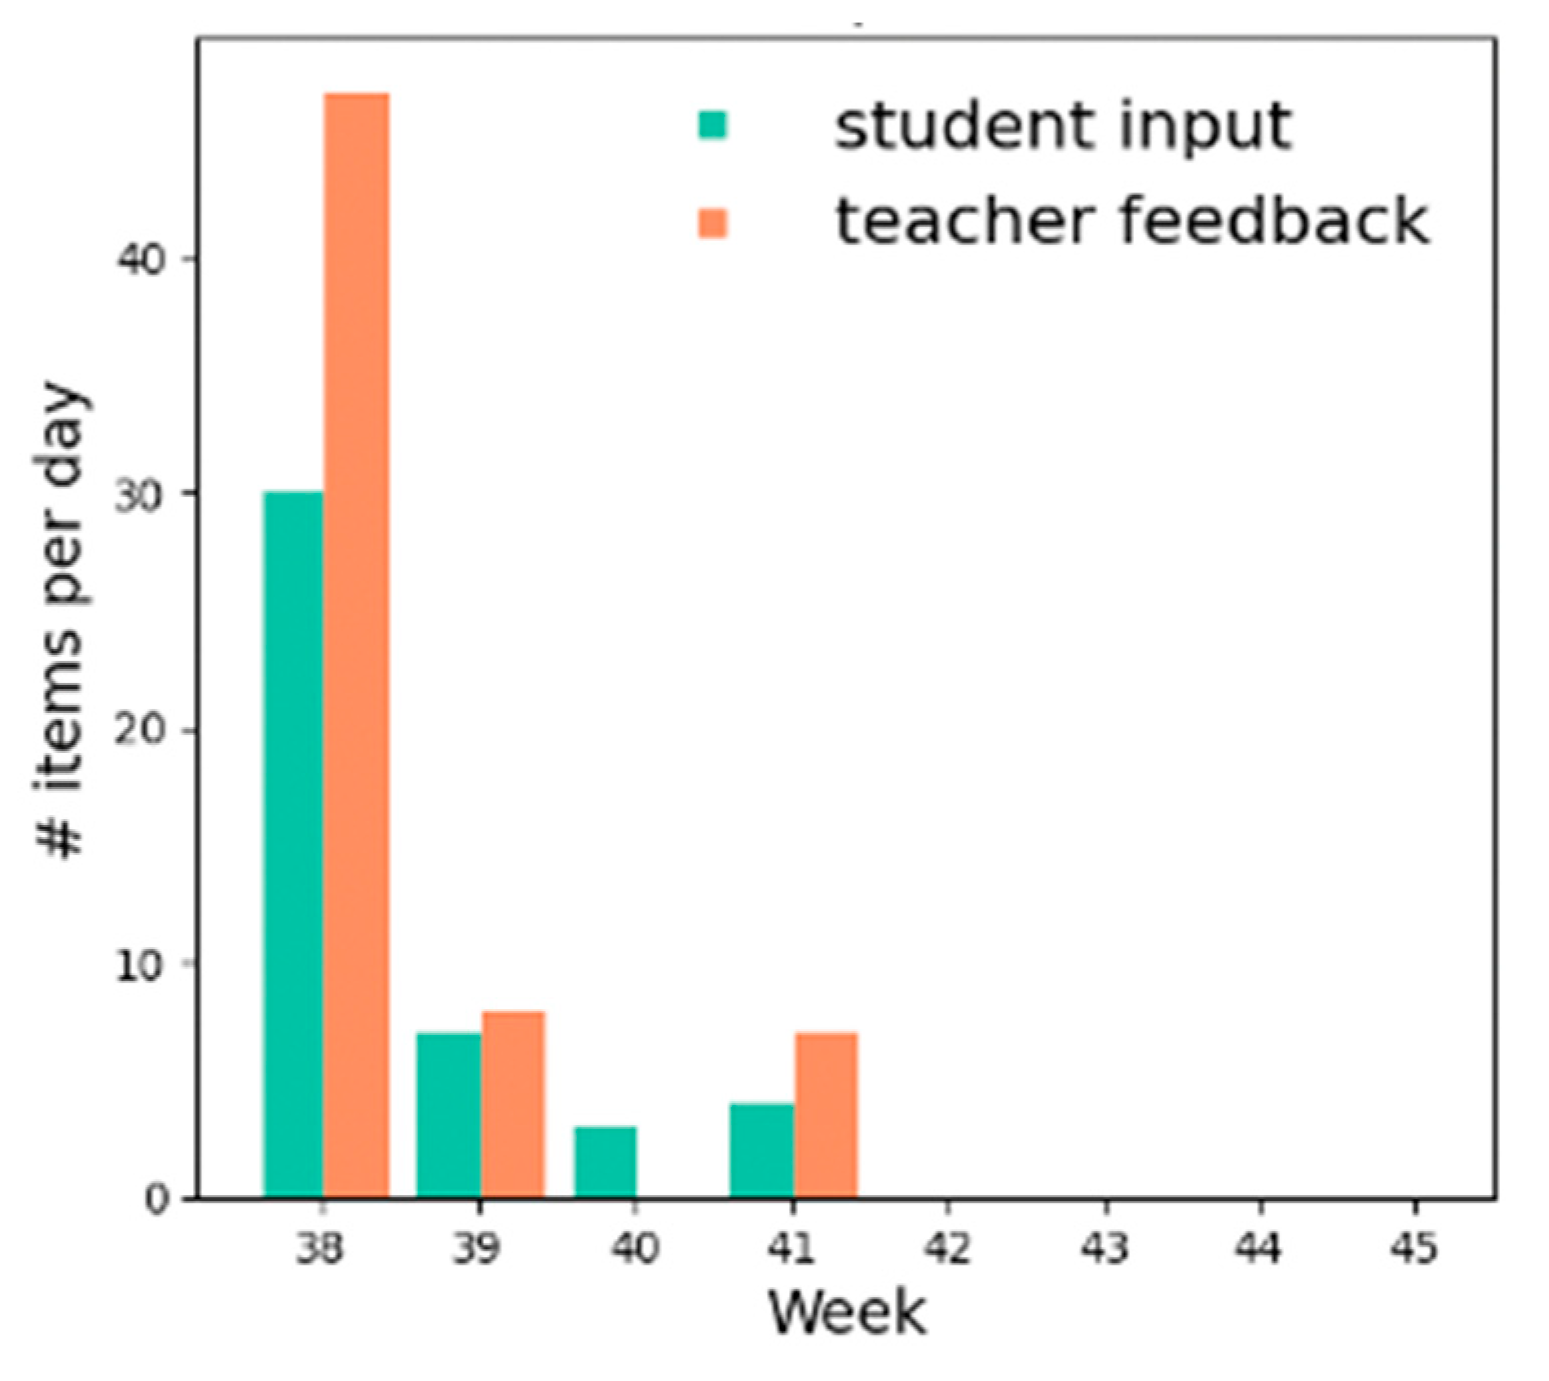
The number of interactions on the Dashboard were related to the expected development of the students’ activity throughout the course. Students were expected to formulate their GQs during the first part of the course (first 2–3 weeks) to have enough time to formulate their GAs and GRs related to each GQ, as well as to work with the data they were provided with and with which they developed models (not analyzed in this article). Figure 11 shows the number of interactions on the Dashboard along the course for all teams.
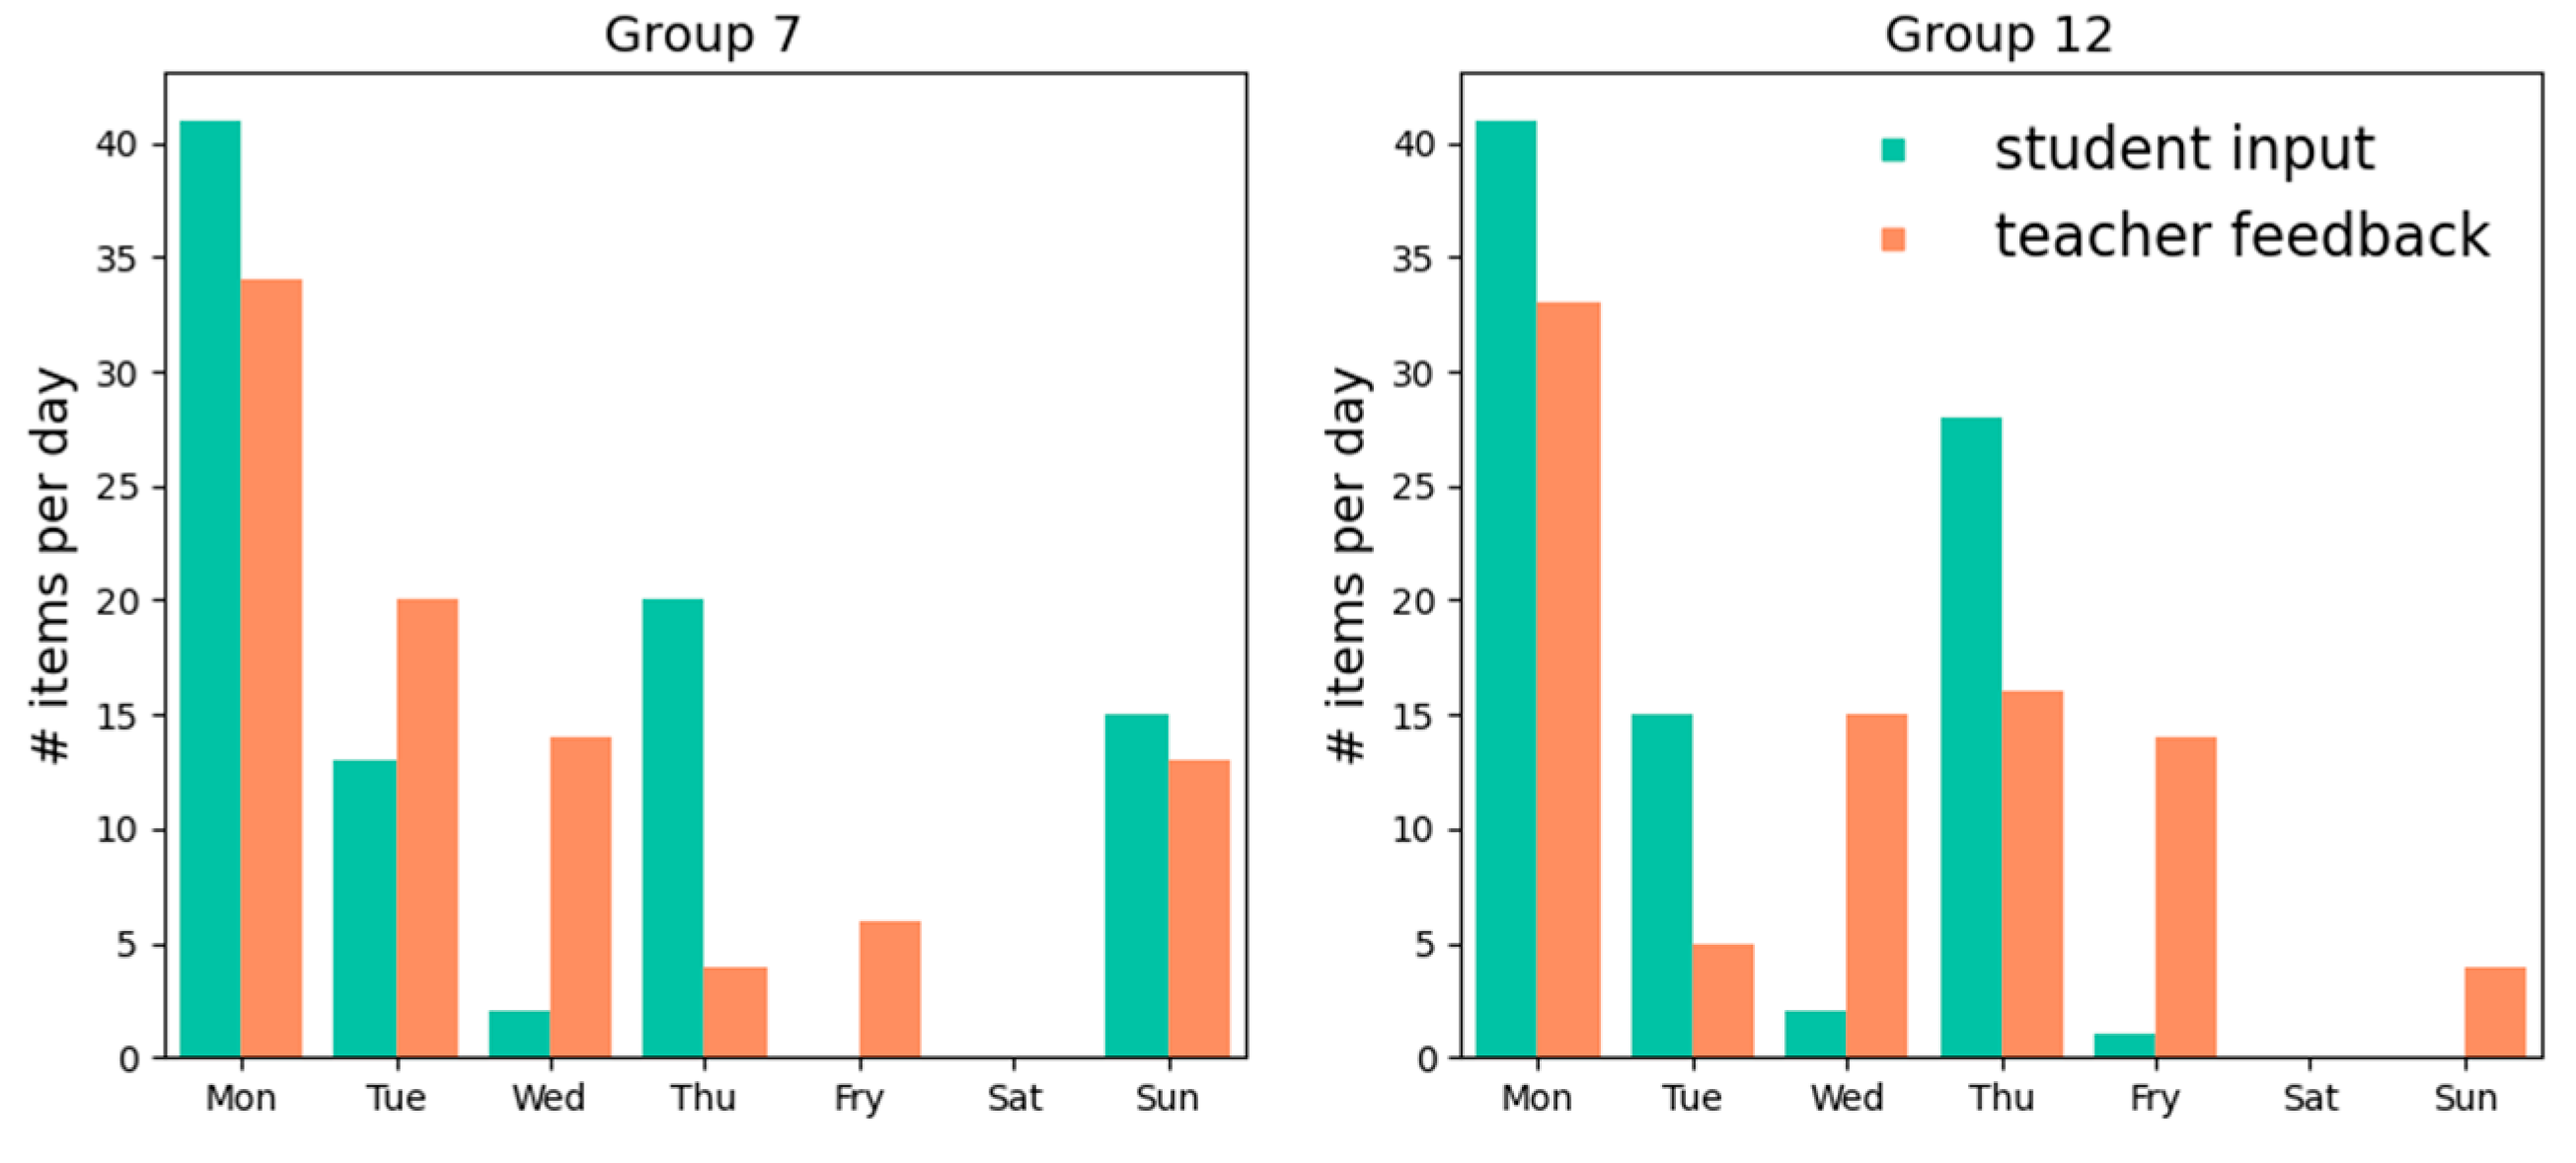
In addition, the Dashboard allowed students and teachers to interact outside of lectures; about 30% of the content posted by both teams was outside of lectures hours (33% Team 1, 21% Team 2), and teachers provided 50% of the feedback outside lecture hours (Figure 12).
We can observe that the use of the Dashboard enabled student teams to engage in iterative and collaborative refinement of their guiding questions. This process supported not only a deeper engagement with mathematical content but also promoted interdisciplinary reasoning, as students drew on knowledge from physics, psychology, and ethics. The feedback loops enabled by the Dashboard created a dynamic learning environment where students took ownership of their modelling process, reflecting a shift from passive knowledge reception to active knowledge construction. Compared to traditional approaches in mathematics instruction—often characterized by pre-structured problems and isolated content—this study shows that mathematical modelling embedded in authentic engineering contexts can foster autonomy, teamwork, and meaningful application of theory. The instrumentation and instrumentalization observed in this study reflect how digital tools can be appropriated as cognitive and organizational supports that transform the way students interact with mathematical knowledge.
In terms of dashboard use, students highlighted two elements as particularly valuable: (1) receiving structured feedback from teachers and TAs on their Guiding Questions and Guiding Activities, which helped steer the direction of their project work; and (2) the ability to give and receive anonymous peer feedback within their teams, which supported internal collaboration and accountability. As for areas of improvement, students suggested the implementation of automatic notifications—for example, email alerts when new feedback is available or reminders to complete peer-feedback tasks. These requests point to the importance of integrating time-sensitive features that can support both engagement and regulation throughout the modelling process.
The findings presented in this study resonate with previous research that highlights the importance of feedback tools in digital learning environments. Studies on Challenge-Based Learning in STEM contexts (e.g., Malmqvist et al., 2015) emphasize the role of iterative problem formulation and interdisciplinary thinking, both of which were evident in our teams’ modeling processes. However, unlike studies that report difficulties with collaborative regulation (Järvelä et al., 2015), our teams used the Dashboard as a shared cognitive scaffold that improved coordination.

5. Conclusions

This paper investigated how digital resources, including the Dashboard, and other resources, supported two teams in the early stages of mathematical modelling in a CBE environment; particularly, to identify, define and start to model a real-world problem (efficiency of moving crowds on a train platform). For answering our RQ, the use of digital resources, focusing on the use of the Dashboard, was analyzed through the feedback received by the students on the formulation of their Guiding Questions and two processes: instrumentation, and instrumentalization in the context of a modelling problem. Learning from experience and adapting strategies were integral components of the instrumentation process, demonstrating the dynamic nature of how students engaged with resources to achieve their objectives. Students’ instrumentalization process involved a continuous refinement of Guiding Questions based on Dashboard feedback, coupled with advanced data analysis techniques and visualizations. The dynamic interaction with the Dashboard and other digital resources highlights the instrumental role they played in shaping the investigative journey and knowledge generation within the context of the challenge. Thus, technology is not just a tool; it became an instrument influencing the students’ approach to problem-solving and decision-making.
The students considered the Dashboard as an important DCR (e.g., S5: “the dashboard is definitely essential”) and it helped them identify and define their challenge through the quick and effective feedback they received from the tutors to formulate their Guiding Questions (instrumentation process). We observed that most of the interactions on the Dashboard took place in the first 3-4 weeks of the course (Figure 11).
This is consistent with what was expressed by S1, where it was observed that it was in the first part of the course that students were focused on the identification and definition of their problem. After the first weeks, interaction with the Dashboard (i.e., placing new posts) ceased to play a significant role in the day-to-day work of the students. However, the content of the Dashboard, with its Guiding Questions, Guiding Activities and Guiding Resources, continued to guide the students’ activities throughout the course (instrumentalization process).
Second, regarding students’ interaction with the Dashboard, we placed our discussion in the context of IA and mediation: human actions are shaped by cultural tools (Rabardel & Bourmaud, 2003). These cultural tools (e.g., the Dashboard), are oriented towards the goal of the activity, towards others and towards students. They help to shape their cognitive structures which, among other things, allow them to know and identify their objective (epistemic mediations to object). Thus, focusing on students’ appropriation of DCRs, the results of our study showed that the resources mediated between students and their objectives, and in turn help to shape the way they reflect on their challenge both by themselves and as a team. Students in the two teams were guided and affected by their interaction with the Dashboard to identify and translate a real-world situation as a problem that involves mathematical work.
The theoretical perspectives of CBE, instrumental approach, and digital modelling were interwoven throughout our study. They not only guided our methodological choices but also provided a framework for interpreting the findings and drawing meaningful conclusions about the role of digital resources in enhancing student learning in a multidisciplinary, challenge-based context. Thus, these results support key concepts from the instrumental approach. The observed evolution of guiding questions illustrates the process of instrumental genesis, where students appropriated the Dashboard not merely as an external organizer but as a thinking tool that shaped their mathematical reasoning. Furthermore, the dual processes of instrumentation and instrumentalization were evident in how students adapted the Dashboard (e.g., renaming sections, integrating external tools) to suit their modeling needs. This aligns with Artigue (2002) and Trouche (2004), who emphasize that the meaningful use of digital resources depends on learners’ constructive reinterpretation of the tool’s affordances within a specific context.
The results have implications for practice and are useful for course designers: e.g., the use and design of digital resources for providing effective feedback for CBE courses. In CBE, students need to define their own problem from a given challenge and feedback is perhaps the most important means by which teachers can provide guidance. A digital tool like the Dashboard can help to provide this feedback to relatively large groups of students and can help student teams to go through iterations of problem definitions that converge in a short period of time. In this way, the Dashboard is one of the innovative digital tools needed to support student learning in CBE (van den Beemt et al., 2022). While the analysis of two student teams allowed for an in-depth exploration of modeling practices in a CBE context, the small number of cases naturally limits the generalizability of the findings. These results should be interpreted as context-bound and exploratory rather than representative. Nonetheless, the richness of the data and the theoretical grounding provide valuable insights for future research on digital tool use in mathematics education, particularly in engineering programs.
The insights from this study call for a reconceptualization of how mathematics is taught to engineers: not just as a foundational science, but as a flexible, context-sensitive practice enhanced by technology. Future research would deepen into how a DCR interacts with other resources (e.g., Microsoft Teams and face-to-face sessions) as part of a broader resource system focused on providing effective feedback and would also consider students’ comments after interacting with the DCR (e.g., likes or dislikes of some features of the Dashboard) for possible future developments.

Author Contributions

Conceptualization, U.S.-H., Z.-j.K. and B.P.; methodology, U.S.-H., Z.-j.K. and B.P.; formal analysis, U.S.-H., Z.-j.K., B.P. and A.G.; investigation, U.S.-H., Z.-j.K., B.P., A.G., F.T. and J.L.-G.; resource design (The Dashboard), A.G. and F.T.; writing—original draft preparation, U.S.-H.; writing—review and editing, U.S.-H., Z.-j.K., B.P., A.G., F.T. and J.L.-G.; supervision, B.P.; funding acquisition, B.P. All authors have read and agreed to the published version of the manuscript.

Funding

This study was funded by the Innovation Fund of 4TU.CEE at Eindhoven University of Technology.

Institutional Review Board Statement

The project has been approved by the Ethical Review Board of the Eindhoven University of Technology. Approval code: ERB2021ESOE9. Approval date: 23 September 2021.

Informed Consent Statement

Informed consent was obtained from all subjects involved in the study.

Data Availability Statement

No new data were created or analyzed in this study. Data sharing is not applicable to this article.

Acknowledgments

We would like to thank the students, and the tutors for allowing us to conduct observations and interviews. We also acknowledge the TU/e educational innovation projects “New Challenge Based learning line: Physics of Social Systems” and “Scaling up Challenge Based Learning (CBL) at TU/e”.

Conflicts of Interest

The authors declare no conflicts of interest.

Abbreviations

The following abbreviations are used in this manuscript:
CBEChallenge-Based Education
SRRSSchematic Representation of Resource System
TAteaching assistant
DCRdigital curriculum resource

References

  1. Abassian, A., Safi, F., Bush, S., & Bostic, J. (2019). Five different perspectives on mathematical modeling in mathematics education. Investigations in Mathematics Learning, 12(1), 53–65. [Google Scholar] [CrossRef]
  2. Artigue, M. (2002). Learning mathematics in a CAS environment: The genesis of a reflection about Instrumentation and the dialectics between technical and conceptual work. International Journal of Computers for Mathematical Learning 7, 245–274. [Google Scholar] [CrossRef]
  3. Blum, W., & Borromeo Ferri, R. (2009). Mathematical modelling: Can it be taught and learnt? Journal of Mathematical Modelling and Application, 1(1), 45–58. Available online: https://eclass.uoa.gr/modules/document/file.php/MATH601/3rd%20%26%204rth%20unit/3rd%20unit_Modelling%20cycle.pdf (accessed on 26 August 2025).
  4. Blum, W., & Leiss, D. (2007). How do students and teachers deal with modelling problems? In C. Haines, P. Galbraith, W. Blum, & S. Khan (Eds.), Mathematical modelling: Education, engineering and economics-ICTMA 12 (pp. 222–231). Chichester. [Google Scholar]
  5. Borba, M. de C., & Villarreal, M. E. (2005). Humans-with-media and the reorganization of mathematical thinking. Springer. [Google Scholar] [CrossRef]
  6. Conde, M. Á., García-Peñalvo, F. J., Fidalgo-Blanco, Á., & Sein-Echaluce, M. L. (2017). Can we apply learning analytics tools in challenge based learning contexts? In Learning and collaboration technologies. Technology in education: 4th international conference, LCT 2017, held as part of HCI international 2017, Vancouver, BC, Canada, July 9–14, 2017, Proceedings, Part II 4 (pp. 242–256). Springer International Publishing. [Google Scholar]
  7. Dahl, B. (2018). What is the problem in problem-based learning in higher education mathematics. European Journal of Engineering Education, 43(1), 112–125. [Google Scholar] [CrossRef]
  8. Deemer, P., Benefield, G., Larman, C., & Vodde, B. (2013). The SCRUM primer. [PDF]. Available online: http://www.brianidavidson.com/agile/docs/scrumprimer121.pdf (accessed on 23 June 2023).
  9. Doulougeri, K., Bombaerts, G., Martin, D., Watkins, A., Bots, M., & Vermunt, J. D. (2022, March 28–31). Exploring the factors influencing students’ experience with challenge-based learning: A case study. 2022 IEEE Global Engineering Education Conference (EDUCON) (pp. 981–988), Tunisia, North Africa. [Google Scholar] [CrossRef]
  10. Elicer, R., & Tamborg, A. L. (2022). Nature of the relations between programing and computational thinking and mathematics in Danish teaching resources. In U. T. Jankvist, R. Elicer, A. Clark-Wilson, H.-G. Weigand, & M. Thomsen (Eds.), Proceedings of the 15th international conference on technology in mathematics teaching (ICTMT 15) (pp. 45–52). Aarhus University. [Google Scholar]
  11. Gallagher, S. E., & Savage, T. (2020). Challenge-based learning in higher education: An exploratory literature review. Teaching in Higher Education, 28(6), 1135–1157. [Google Scholar] [CrossRef]
  12. Gaskins, W. B., Johnson, J., Maltbie, C., & Kukreti, A. R. (2015). Changing the Learning environment in the college of engineering and applied science using challenge based learning. International Journal of Engineering Pedagogy, 5(1), 33–41. [Google Scholar] [CrossRef]
  13. Gueudet, G., & Pepin, B. (2018). Didactic Contract at the Beginning of University: A Focus on Resources and their Use. International Journal of Research in Undergraduate Mathematics Education, 4, 56–73. [Google Scholar] [CrossRef]
  14. Järvelä, S., Kirschner, P. A., Panadero, E., Malmberg, J., Phielix, C., Jaspers, J., Koivuniemi, M., & Järvenoja, H. (2015). Enhancing socially shared regulation in collaborative learning groups: Designing for CSCL regulation tools. Educational Technology Research and Development, 63, 125–142. [Google Scholar] [CrossRef]
  15. Kynigos, C. (2022). Embedding mathemathics in socio-scientific games: The case of the mathematical in grappling with wicked problems. In U. T. Jankvist, R. Elicer, A. Clark-Wilson, H.-G. Weigand, & M. Thomsen (Eds.), Proceedings of the 15th international conference on technology in mathematics teaching (ICTMT 15) (pp. 11–28). Aarhus University. [Google Scholar]
  16. Leijon, M., Gudmundsson, P., Staaf, P., & Christersson, C. (2021). Challenge based learning in higher education—A systematic literature review. Innovations in Education and Teaching International, 59(5), 609–618. [Google Scholar] [CrossRef]
  17. Malmqvist, J., Rådberg, K. K., & Lundqvist, U. (2015). Comparative analysis of challenge-based learning experiences. In CDIO (Ed.), Proceedings of the 11th international CDIO conference (Vol. 8, pp. 87–94). Chengdu University of Information Technology. [Google Scholar]
  18. Mayring, P. (2015). Qualitative content analysis: Theoretical background and procedures. In A. Bikner-Ahsbahs, C. Knipping, & N. Presmeg (Eds.), Approaches to qualitative research in mathematics education: Examples of methodology and methods (pp. 365–380). Springer. [Google Scholar] [CrossRef]
  19. Membrillo-Hernández, J., J. Ramírez-Cadena, M., Martínez-Acosta, M., Cruz-Gómez, E., Muñoz-Díaz, E., & Elizalde, H. (2019). Challenge based learning: The importance of world-leading companies as training partners. International Journal on Interactive Design and Manufacturing (IJIDeM), 13(3), 1103–1113. [Google Scholar] [CrossRef]
  20. Misfeldt, M., Jankvist, U. T., Geraniou, E., & Bråting, K. (2020). Relations between mathematics and programming in school: Juxtaposing three different cases. In A. Donevska-Todorova, E. Faggiano, J. Trgalova, Z. Lavicza, R. Weinhandl, A. Clark-Wilson, & H.-G. Weigand (Eds.), Proceedings of the 10th ERME topic conference on mathematics education in the digital era, MEDA 2020 (pp. 255–262). Johannes Kepler University. [Google Scholar]
  21. Molina-Toro, J. F., Rendón-Mesa, P. A., & Villa-Ochoa, J. (2019). Research trends in digital technologies and modeling in mathematics education. EURASIA Journal of Mathematics, Science and Technology Education, 15(8), em1736. [Google Scholar] [CrossRef] [PubMed]
  22. Niss, M., & Blum, W. (2020). The learning and teaching of mathematical modelling. Routledge. [Google Scholar]
  23. Niss, M., & Højgaard, T. (2019). Mathematical competencies revisited. Educational Studies in Mathematics, 102(1), 9–28. [Google Scholar] [CrossRef]
  24. Pepin, B., Biehler, R., & Gueudet, G. (2021). Mathematics in Engineering Education: A Review of the Recent Literature with a View towards Innovative Practices. International Journal of Research in Undergraduate Mathematics Education, 7(2), 163–188. [Google Scholar] [CrossRef]
  25. Pepin, B., Choppin, J., Ruthven, K., & Sinclair, N. (2017a). Digital curriculum resources in mathematics education: Foundations for change. ZDM Mathematics Education, 49(5), 645–661. [Google Scholar] [CrossRef]
  26. Pepin, B., & Kock, Z. (2021). Students’ Use of Resources in a Challenge-Based Learning Context Involving Mathematics. International Journal of Research in Undergraduate Mathematics Education, 7(2), 306–327. [Google Scholar] [CrossRef]
  27. Pepin, B., Xu, B., Trouche, L., & Wang, C. (2017b). Developing a deeper understanding of mathematics teaching expertise: Chinese mathematics teachers’ resource systems as windows into their work and expertise. Educational studies in Mathematics, 94(3), 257–274. [Google Scholar] [CrossRef]
  28. Rabardel, P., & Bourmaud, G. (2003). From computer to instrument system: A developmental perspective. Interacting with Computers, 15(5), 665–691. [Google Scholar] [CrossRef]
  29. Smith, R. C., Bossen, C., Dindler, C., & Sejer Iversen, O. (2020, June 15–20). When participatory design becomes policy: Technology comprehension in Danish education. 16th Participatory Design Conference 2020—Participation(s) Otherwise (Vol. 1, pp. 148–158), Manizales, Colombia. [Google Scholar] [CrossRef]
  30. Soares, D. d. S., & Borba, M. d. C. (2014). The role of software Modellus in a teaching approach based on model analysis. ZDM Mathematics Education, 46(4), 575–587. [Google Scholar] [CrossRef]
  31. Stake, R. E. (1995). The art of case study research. SAGE Publications. [Google Scholar]
  32. Toschi, F., Gabbana, A., Lazendic-Galloway, J., Boonacker-Dekker, A., & Vervuurt, Y. (2023). Designing a learning dashboard to facilitate project development and teamwork in a CBL physics course. In A. Guerra, J. Chen, R. Lavi, L. Bertel, & E. Lindsay (Eds.), Transforming Engineering Education (pp. 178–182). Aalborg Universitetsforlag. [Google Scholar]
  33. Trouche, L. (2004). Managing the complexity of human/machine interactions in computerized learning environments. International Journal of Computers for Mathematical Learning, 9(3), 281–307. [Google Scholar] [CrossRef]
  34. van den Beemt, A., van de Watering, G., & Bots, M. (2022). Conceptualising variety in challenge-based learning in higher education: The CBL-compass. European Journal of Engineering Education, 48(1), 24–41. [Google Scholar] [CrossRef]
  35. van Uum, M. S. J., & Pepin, B. (2022). Students’ self-reported learning gains in higher engineering education. European Journal of Engineering Education, 1–17. [Google Scholar] [CrossRef]
  36. Vergnaud, G. (1998). Toward a cognitive theory of practice. In A. Sierpinska, & J. Kilpatrick (Eds.), Mathematics education as a research domain: A search for identity (pp. 227–240). Kluwer. [Google Scholar] [CrossRef]
  37. Vérillon, P., & Rabardel, P. (1995). Artefact and cognition: A contribution to the study of thought in relation to instrumented activity. European Journal of Psychology in Education, 10(1), 77–101. [Google Scholar] [CrossRef]
  38. Villa-Ochoa, J. A., González-Gómez, D., & Carmona-Mesa, J. A. (2018). Modelling and technology in the study of the instantaneous rate of change in mathematics [Modelación y tecnología en el estudio de la tasa de variación instantánea en matemáticas]. Formación Universitaria, 11(2), 25–34. [Google Scholar] [CrossRef]
  39. Vreman-de Olde, C., Van Der Meer, F., Van Der Voort, M., Torenvlied, R., Kwakman, R., Goudsblom, T., Zeeman, M. J., & Damoiseaux, P. (2021). Challenge based learning @ UT: Why, what, how (pp. 1–9). University of Twente. Available online: https://www.utwente.nl/en/cbl/documents/seg-innovation-of-education-challenge-based-learning.pdf (accessed on 26 August 2025).
  40. Yazan, B. (2015). Three approaches to case study methods in education: Yin, merriam, and stake. The Qualitative Report, 20(2), 134–152. [Google Scholar] [CrossRef]
  41. Yin, R. K. (2002). Case study research: Design and methods. SAGE Publications. [Google Scholar]
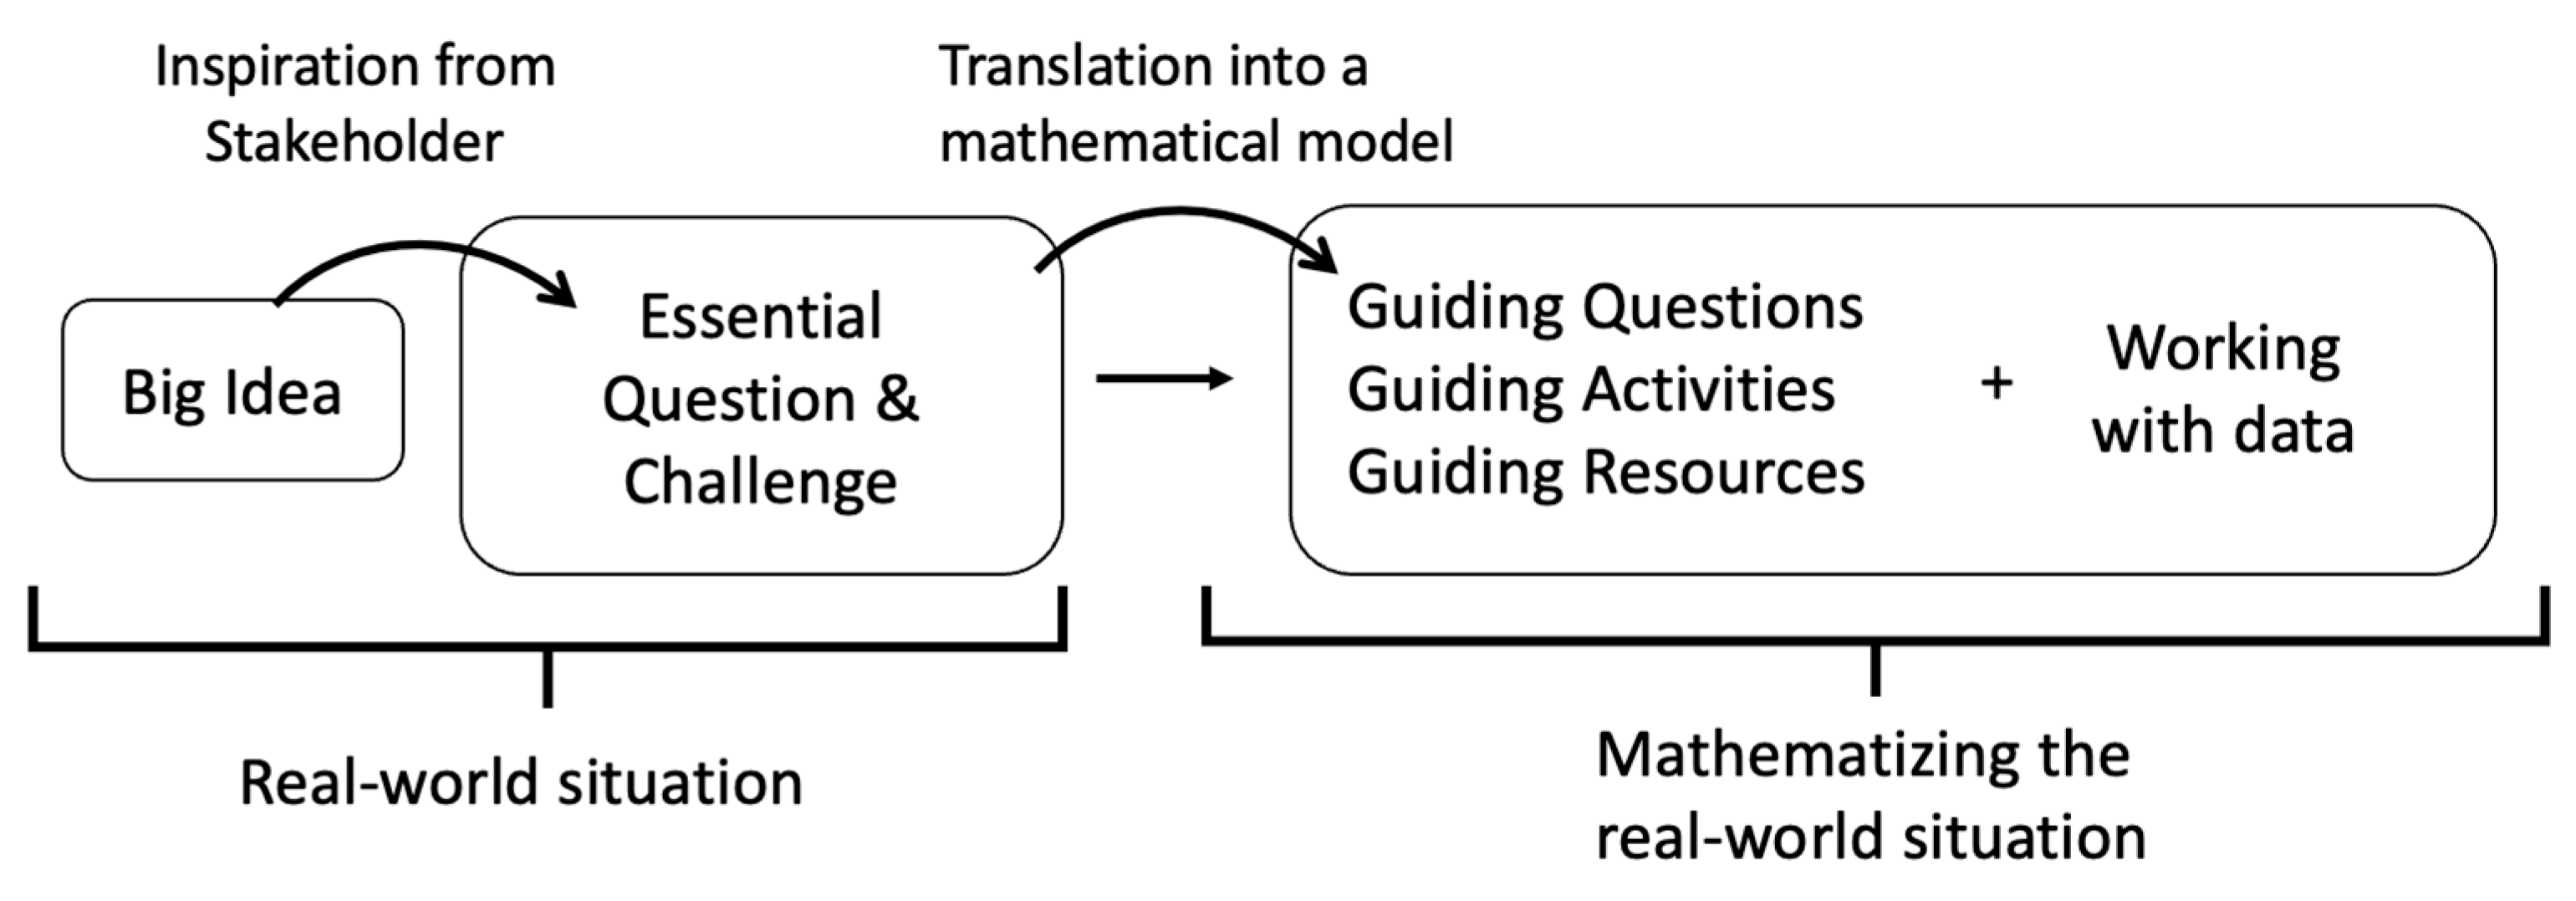
Figure 1. Mathematization process of a real-world situation in CBE.
Education 15 01123 g001
Figure 2. Display of the Dashboard interaction for the case of the fifth version of a GQ of Team 2.
Education 15 01123 g002
Figure 3. Example of a Schematic Representation of Resource System (SRRS) from a student from Team 1.
Education 15 01123 g003
Figure 4. Graphs produced by Team 1 on influence of spatial factors.
Education 15 01123 g004
Figure 5. Division of zones, marked in red, for analysis of flux and density set up by Team 1.
Education 15 01123 g005
Figure 6. Animation of people moving along a train platform.
Education 15 01123 g006
Figure 7. Example of a Schematic Representation of Resource System (SRRS) from a student from Team 2.
Education 15 01123 g007
Figure 8. Student-made graphs of trajectories of two persons (randomly chosen) on a train platform.
Education 15 01123 g008
Figure 9. Animation of boarding process.
Education 15 01123 g009
Figure 10. Map of a railway platform with its points of interest.
Education 15 01123 g010
Figure 11. Number of interactions on the Dashboard during the course.
Education 15 01123 g011
Figure 12. Number of interactions on the Dashboard during the course by day of the week.
Education 15 01123 g012
Table 1. Real-world situation of each team to be mathematized.
Team 1Team 2
Big IdeaEfficiencyThe flow of human crowds—efficiency
Essential QuestionHow can efficiency on the platforms be improved by influencing pedestrians’ routing decisions (choice of route from A to B and choice of B)?How to improve the efficiency of the boarding process?
ChallengeImprove efficiency on the platforms by influencing pedestrians’ routing decisions.Design methods to optimally (not necessarily homogeneously) distribute passengers on a train platform to improve the boarding time.
Table 2. Data collection methods.
Data SourcesData Collection Methods
Students: 2 teams of 5 students eachObservations, group interviews, Schematic Representation of Resource Systems (drawings), student products (presentations, poster, and final report)
Tutors: 3 lectures and 2 TAs (one per team)Observation, interviews
DashboardStudent posts, tutor feedback
Disclaimer/Publisher’s Note: The statements, opinions and data contained in all publications are solely those of the individual author(s) and contributor(s) and not of MDPI and/or the editor(s). MDPI and/or the editor(s) disclaim responsibility for any injury to people or property resulting from any ideas, methods, instructions or products referred to in the content.