Article

Exploring Opportunities for More Effective Acquisition and Interpretation of New Knowledge by Students in the Field of Architectural Visualization Through Multimedia Learning

by
Desislava Angelova
*,
Tsvetan Stoykov
,
Vanina Tabakova
,
Denislav Lyubenov
,
Eli-Naya Konetsovska
and
Anna-Maria Sofianska
Faculty of Forest Industry, Department of Interior and Furniture Design, University of Forestry, 1797 Sofia, Bulgaria
*
Author to whom correspondence should be addressed.
Educ. Sci. 2025, 15(9), 1105; https://doi.org/10.3390/educsci15091105
Submission received: 30 July 2025 / Revised: 18 August 2025 / Accepted: 18 August 2025 / Published: 26 August 2025
(This article belongs to the Section Higher Education)

Abstract

This study explores opportunities for improving the learning process of design students using multimedia and microlearning, with a focus on architectural visualization. It analyzes the learning habits of students and faculty in higher education, reflects on the need for digitalization and adaptation to the cognitive characteristics of Generations Z and Alpha, and emphasizes the importance of visual perception in design thinking. The research includes a survey of 130 respondents from eight Bulgarian universities and an experiment with three groups of students using different learning methods—live demonstration, video demonstration, and a combined approach. The results indicate that the combined method leads to the highest levels of understanding, confidence, and task performance. The research is grounded in pedagogical theories related to visual learning and cognitive engagement, particularly relevant for Generations Z and Alpha. Students expressed a preference for short, practice-oriented formats, such as project-based learning and video tutorials, aligning with their digital fluency and attention patterns. The results underline the importance of incorporating multimedia elements and flexible instructional strategies to support motivation, engagement, and effective skill development in design education.

1. Introduction

We live in a rapidly changing world driven by advanced technology and an increased flow of information, where users of educational services seek ever more effective and flexible learning methods. These methods must enable them to perceive, absorb, and apply specific topics or skills within a short period of time. Consequently, numerous questions arise regarding the relevance of higher education and its capacity to meet the needs of learners. It is essential to reconsider and update teaching and learning methods to adapt to current conditions while aligning with the generational characteristics of students. This leads to questions such as the following: How does the modern individual find the information they need? What are the channels for obtaining the necessary information? How much time is dedicated to learning—the perception, processing, and interpretation of information? What are the generational characteristics of today’s learners? Are the capabilities of digital environments adequately utilized in university education?
These questions touch not only on the type, content, and volume of educational materials, but also on the tools used for effective perception and interpretation. This presents several challenges for higher education in the Republic of Bulgaria and its traditional learning formats, calling for a fundamental shift in teaching approaches. Although the COVID-19 pandemic accelerated the adoption and development of e-learning and its associated tools, most of these were discontinued once the situation normalized. While this was partially due to limitations in academic curricula, this was not the sole reason. Contemporary education demands flexible frameworks for structuring content and dynamic teaching methods that align with learners’ expectations of educational services. There is a need for active work on teaching methods and tools, including specific learning units that integrate a variety of instruments for fast assimilation and interpretation of information at a convenient moment for the learner.
In this context, it is advisable to draw upon the experience and best practices of microlearning by systematizing the opportunities for applying well-established instructional tools, including digital tools, in higher education. Microlearning, also known as “microteaching” or “micro educational units,” is a learning process that segments information into small, specific, and easily digestible units (Hug, 2006). This approach focuses on delivering short, concentrated content aimed at achieving a clearly defined learning outcome.
Torgerson and Iannone (2020) define microlearning as a set of tools and principles already employed by training content creators, such as “just-in-time” learning and refresher modules. These educational units share one essential characteristic: they can be quickly absorbed. Tipton (2017) makes an important clarification: breaking down instructional content into smaller units is not intended to make learning superficial or to merely fit the format, but rather to support deeper understanding and improved knowledge retention.
According to Blueoceanbrain.com (Blue Ocean Brain, 2025), for microlearning to be effective, it must be naturally integrated into students’ curricula and daily tasks. They add that such systems should be based on how people learn and retain information and must be adaptable to help learners achieve specific, concrete goals. Educational expert Thalheimer (2017) defines microlearning as any relatively short learning interaction—ranging from a few seconds to approximately 20 min—that may include a combination of the following: presentation of new content, review of prior material, hands-on exercises, task assignments, feedback on independent work, consultations, and more.
Kapp and Defelice (2019) further elaborate on the definition of microlearning by out-lining its key elements: the unit is short in duration, with a clearly defined beginning and end; it targets a specific and measurable learning outcome; it can take various forms and lengths, such as a short video lesson, text document, work instruction, or info-graphic; it requires voluntary and active learner engagement; it includes a specific learner action (whether cognitive or physical); and it must be consciously designed, rather than being a mechanical segmentation of longer content into smaller parts.
In their study “Online Microlearning and Student Engagement in Computer Games Higher Education”, McKee and Ntokos (2022) reveal that the use of microlearning techniques—such as segmented lecture recordings—can contribute to maintaining learner engagement and confidence with the instructional content among higher education students. This approach proves particularly effective in the context of online and distance education, as it addresses the challenge of sustaining students’ focus and attention. The study finds that an optimal video length of 5–8 min is associated with the greatest increase in learners’ confidence and engagement.
Another study, presented in the article “The Effectiveness of Microlearning to Improve Students’ Learning Ability”, compares the effectiveness of traditional teaching methods with microlearning in the field of information technology at the elementary school level. The results indicate that microlearning methods led to an 18% improvement in learning outcomes compared to traditional methods, and students demonstrated a high level of motivation and interest in the microlearning tools used (Mohammed et al., 2018, p. 37).
Microlearning supports the retention of previously acquired knowledge by leveraging psychological principles related to memory and learning. The psychologist Ebbinghaus (1885) conducted some of the earliest research on memory and spaced learning. His well-known “forgetting curve” illustrates how learners tend to forget more than 50% of the learned material within 20 min after a lesson. Furthermore, this percentage drops to 40% within nine hours, and to 24% after 31 days if the information is not reviewed.
In 2015, Murre and Dros (2015) successfully replicated Ebbinghaus’s forgetting curve. In their study, a participant spent 70 h learning information at spaced intervals, resulting in retention levels comparable to those reported in Ebbinghaus’s original findings. Additional studies have confirmed that memory reactivation through periodic review—a widely applied technique in microlearning—helps enhance long-term information retention. A 2018 study by MacLeod et al. (2018) demonstrated that memory reactivation strengthens long-term memory by triggering cellular reconsolidation.
With the help of mobile devices and apps, learners can study at their own pace and from any location. The ability to move backward and forward through lessons allows them to increase their retention rate by revisiting previous content in shorter sessions. The review process reinforces neural connections in the brain and facilitates the transfer of knowledge from short-term to long-term memory. In his research, Kang (2016) also notes that findings from cognitive and educational psychology indicate that spacing out repetitions of material over time significantly improves long-term retention.
Microlearning enables the learning environment to adapt to the limited attention span of individuals, particularly in the context of mobile learning systems (Hamzah, 2021). Attention span encompasses a variety of factors, including learner-specific characteristics such as behavior, competencies, demographics, prior knowledge, literacy, needs, preferences, and learning skills, as well as technological parameters such as network conditions, device capabilities, and platform functionality. This adaptation aims to optimize the learning process by delivering content tailored to the user’s needs, providing appropriate learning materials and activities based on the learner’s current knowledge and performance. By incorporating these adaptive features, personalized learning systems can better engage users and enhance knowledge retention by aligning educational content with individual needs, preferences, and contextual factors.
Microlearning also adapts to limited attention spans, particularly in mobile learning contexts (Hamzah, 2021). Personal attributes (e.g., behavior, skills, preferences) and technological factors (e.g., device capabilities, networks) affect attention. Adaptive learning systems that match instructional content with individual needs, preferences, and contextual factors improve engagement and learning efficiency.
Microlearning helps to avoid the phenomenon of mental fatigue, also known as central nervous system fatigue or central fatigue (Shail, 2019). Mental fatigue leads to a decline in cognitive processes such as planning, response inhibition, executive attention, sustained attention, goal-directed attention, alternating attention, divided attention, and conflict-monitoring selective attention (Slimani & Znazen, 2015, 2018). According to Ishii et al.’s (2014, p. 469) research, it represents a potential deterioration in cognitive function and is considered one of the most significant contributors to accidents in modern society. Microlearning employs the conceptual model of neuronal regulation and advocates for the prevention of overstimulation or cognitive overload through temporally spaced instructional sessions.
The issue of enhancing the effectiveness of learners’ perception and interpretation of information has been explored from various perspectives; however, there is a growing need to investigate this issue more thoroughly within the context of design education. The specific nature of design education necessitates the use of numerous visual tools, as visual thinking is characteristic of designers—this is a process in which problems are explored from multiple perspectives through observation, and subsequently perceived and interpreted via visualization (sketching, drafting, three-dimensional modeling, etc.). Alongside the emergence of new digital tools that enable faster and more realistic visualization of ideas, sketching remains the most convenient, efficient, and cost-effective tool for rapidly illustrating designers’ concepts. Sketching is a fundamental skill for designers, not as a linear process, but as a way of thinking. These specificities in design education require the skillful integration of diverse educational tools that guide and enhance the processes of observation, perception, and interpretation of new knowledge.
The discussion above highlights the necessity of conducting research focused on the development of specific instructional units that integrate a variety of tools and methods for the rapid acquisition and interpretation of targeted information. On the one hand, these instructional units must be aligned with the particularities of design education, and on the other, they must correspond to the behavioral characteristics and expectations of contemporary learners. According to Zlatanova-Pazheva (2024, pp. 138–139), as of 2024, the societal role of children has become increasingly represented by Generation Alpha and Generation Z—cohorts born after the widespread adoption of the Internet. “They grow up with constant access to the Internet and participation in social media and therefore perceive these technologies as an integral part of life. For this reason, Generation Z is often referred to as ‘the first digital generation.’ Generation Z is constantly connected to the Internet and their social media profiles via their mobile phones. They use these devices to study, search for information, chat, shop, take photos, listen to music and podcasts, and more.” (Zlatanova-Pazheva, 2024, p. 78).
It is no coincidence that various institutions offering intensive courses—often conducted remotely and employing flexible learning options—are in high demand among modern learners, regardless of their age or interests.
An excellent example of such an educational model in the Republic of Bulgaria is the learning platform Ucha.se (2025), which, according to its own data, had over 1,169,550 users as of 26 May 2025. The educational content on the platform is aligned with Bulgaria’s national educational standards and the official curriculum from grades 1 through 12.
The numerous awards the platform has received over the years, along with its extensive user base, reflect public recognition of the effectiveness of the educational methods and tools it employs—such as video lessons, quizzes, and revision with mind maps. All content is accessible online and structured according to the principles of microlearning. It allows students to progress at their own pace and incorporates various approaches, including gamification, interactivity, engagement, and personalization of the learning process. For example, learners earn points while studying, which helps them develop their profiles and earn badges; they can also compare their activity with that of their friends, monitor their learning habits, and identify areas for improvement.
The example of the educational platform Ucha.se (2025) illustrates how the integration of digital technologies into education is transforming teaching and learning methods to better align with learners’ cognitive dispositions.
According to Laurillard (2012), digital education creates new opportunities for teaching and learning through models based on simulations, visual metaphors, and adaptive content—elements particularly valuable in the field of design. Laurillard proposes a teaching framework that emphasizes the role of digital environments and adaptive technologies as tools for personalizing learning and enhancing student engagement.
Research on design education highlights the importance of interdisciplinary approaches and constructivist learning models, in which knowledge is actively constructed by the learner. Kolb (1984) developed an experiential learning model, which is widely applicable in design education as it supports students in developing critical thinking and creative problem-solving skills (Kolb, 1984, p. 21). Similarly, Schön (1983) introduced the concept of the “reflective practitioner,” describing how professionals—including designers—learn through reflection on their own practice. Experiential learning and reflective practice models are extensively applied in design teaching, as they enhance students’ abilities to think critically and engage in creative problem-solving.
Contemporary pedagogy emphasizes the importance of constructive alignment—the coherence between learning objectives, teaching methods, and assessment—as a key factor for the effective acquisition of new knowledge (Biggs & Tang, 2007). According to Biggs and Tang (2007), constructive alignment between intended learning outcomes, teaching strategies, and evaluation methods is essential for meaningful learning, particularly in disciplines that demand high levels of autonomy and creativity. In this context, the role of the educator shifts from a transmitter of knowledge to a facilitator of learning, encouraging students to take an active role in constructing their own understanding (Biggs & Tang, 2007).
There is a growing interest in the use of visual and conceptual tools such as mind maps, visual diagrams, storyboarding, sketchnoting, and prototyping, which facilitate the processes of perception, interpretation, and application of knowledge. Novak and Cañas (2008) emphasize that these tools support conceptual understanding by building connections between new and existing information.
From the perspective of learning theory in the digital age, Siemens (2005) proposes connectivism as a model in which learning occurs through the creation of networks of knowledge and links between various sources of information. This is particularly relevant for design students, who must navigate large volumes of visual, textual, and interactive content from diverse digital channels.
Salmon (2011) emphasizes the role of e-moderation and online collaboration as key factors for enhancing knowledge acquisition in digital learning environments. These approaches encourage active student participation and knowledge construction within a social context—a principle that aligns closely with project-based design education. This is further supported by the findings of Ivanova et al. (2024).
There is also considerable interest in the influence of cognitive and motivational factors on learning in design education. Research indicates that elements such as visual thinking, visual literacy, and spatial perception play a significant role in acquiring new concepts in this field (McKim, 1972). These factors not only facilitate content comprehension but also support the creative processing and application of knowledge within the context of real-world projects. Furthermore, approaches that incorporate gamification, collaborative learning, and the use of digital tools have demonstrated a positive impact on student engagement and deeper understanding of the material (Boud et al., 2013). Such motivational strategies, including gamification and collaborative learning, were also described by Ivanova et al. during training conducted in the 2020–2021 academic year in a fully virtual environment. In this context, assistants introduced a new tool—an online interactive whiteboard, Mural—that catalyzed this innovative approach to collaborative work. An additional benefit of using such a tool was the increased transparency in the educational process for all students (Ivanova et al., 2024, pp. 38–41).
Research by Clark and Mayer (2016) on multimedia learning demonstrates that the integration of visual and verbal representations of information, when applied appropriately, leads to improved cognitive processing and a higher level of comprehension. This is particularly relevant in design education, where visual metaphors and diagrams support the interpretation of abstract concepts. Mayer (2009) further confirms that well-designed multimedia can reduce cognitive load and facilitate learning.
In this context, architectural visualization emerges as a discipline-specific application of multimedia learning, directly supporting the educational process in design fields. It serves as a fundamental tool in architectural design, communication, and presentation. It enables clearer and more realistic envisioning of proposed projects, bridging conceptual thinking with visual output (Singh, 2024). More precisely, architectural visualization refers to the process of creating visual representations of architectural designs using digital tools. These representations may include static images, animations, or interactive 3D environments that help communicate spatial, material, and atmospheric qualities of a design before it is built (Wang & Schnabel, 2009, pp. 15–26).
The research is theoretically grounded in the Cognitive Theory of Multimedia Learning (Mayer, 2001), which emphasizes the role of dual coding—visual and verbal—in facilitating effective knowledge acquisition. This principle directly informed the design of the experimental phase, in which live demonstration, video tutorials, and their combination were tested for their impact on learning performance.
Additionally, the study draws on constructivist learning theory, which posits that learners actively build knowledge through experience and interaction. This pedagogical framework supports the inclusion of project-based and microlearning formats that encourage autonomy, engagement, and contextual understanding—particularly in design education where tacit knowledge and visual reasoning are essential.
These frameworks guided the research design and helped translate theoretical principles into specific instructional strategies, making the study not only empirically valid but also pedagogically meaningful.
The present study aims to explore the possibilities for more effective acquisition and interpretation of new knowledge by design students using multimedia learning. The research is based on both quantitative and qualitative data collected from a survey of 130 respondents, as well as an experiment conducted with students in a real educational setting. The focus is placed on identifying successful pedagogical practices and approaches that support deeper understanding and application of knowledge within design education, specifically in the field of architectural visualization.

2. Materials and Methods

2.1. Research Design

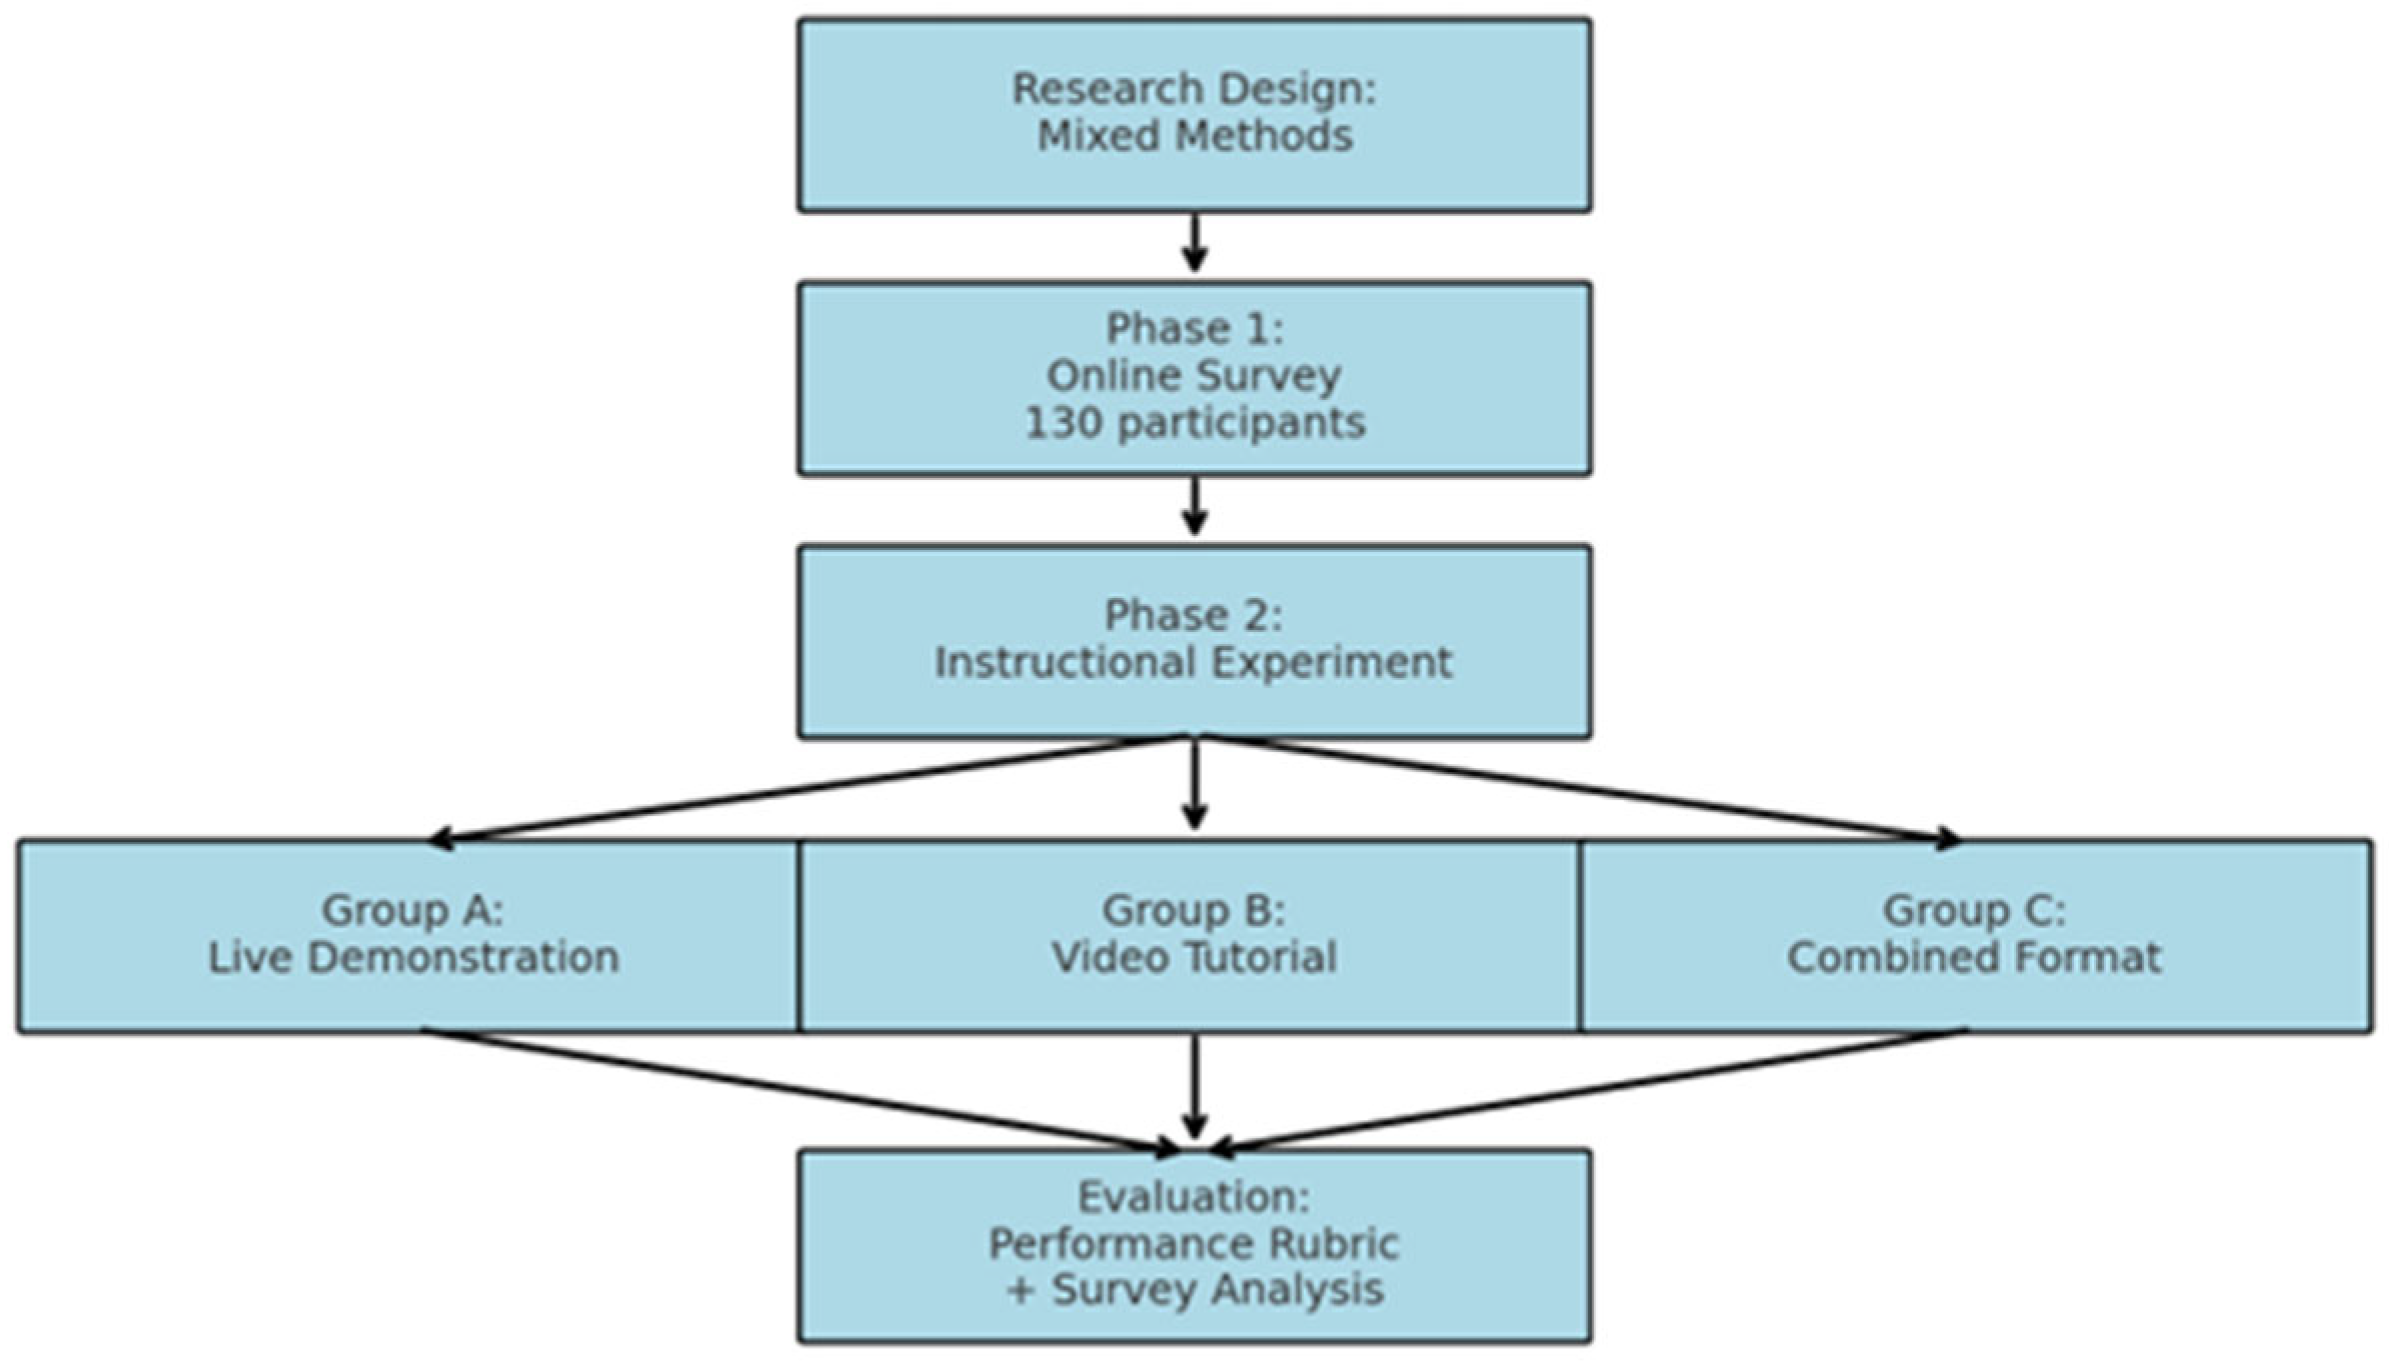
This study employed a mixed-methods research design, combining both qualitative and quantitative approaches to explore the effectiveness of multimedia and microlearning strategies in architectural visualization education. The research was conducted in two main phases: a survey phase and an experimental training phase.
In the survey phase, data were collected via an online questionnaire aimed at analyzing the learning habits, preferences, and perceptions of students and faculty members in design-related programs. This phase sought to provide contextual background for the experimental intervention.
The experimental phase involved a controlled pedagogical intervention with three groups of students, each exposed to a different instructional method: (1) traditional live demonstration, (2) pre-recorded video tutorial, and (3) a combination of both. This design enabled comparison of the instructional methods in terms of learner understanding, confidence, and performance outcomes.

2.2. Participants

The study involved a total of 130 participants, all of whom were students enrolled in design-related academic programs at eight Bulgarian universities. Participants were selected through voluntary response sampling and were informed of the study’s objectives and their rights as participants.
The sample included students from various academic years and specializations in architecture, interior design, and landscape architecture. The diversity of the sample ensured a broad representation of design learners with different levels of experience and familiarity with digital tools.
For the experimental phase, participants were randomly assigned into three groups:
  • Group A received instruction through live demonstration only;
  • Group B engaged with a video tutorial;
  • Group C experienced a combined approach integrating both live and video-based instruction.
The composition of each group was balanced to ensure comparable size and background characteristics, enabling fair analysis of the learning outcomes.

2.3. Procedure

The study was conducted in two main phases: a preliminary survey and a controlled instructional experiment.
In the first phase, an online survey was distributed to students and academic staff across eight Bulgarian universities. The survey aimed to gather insights into participants’ learning habits, preferred formats, and familiarity with digital educational tools. The data served to inform the instructional strategies tested in the second phase.
In the second phase, students were divided into three experimental groups. All groups received instruction on the same design topic—creating a simple architectural visualization task—under different learning conditions. The sessions were conducted in a controlled academic setting with equivalent time allocation:
  • Group A attended a live demonstration by an instructor.
  • Group B watched a pre-recorded video tutorial.
  • Group C participated in a combined format involving both a live session and the same video material.
Following the instructional session, all participants were asked to complete the same practical task individually. Their results were then evaluated through expert judgment, which does not involve predefined quantitative criteria or scales.

2.4. Instruments and Tools

The instruments used in this study included:
Online Questionnaire—developed using Google Forms and distributed via academic mailing lists and course platforms. The questionnaire comprised both closed and open-ended questions addressing learning preferences, frequency of multimedia usage, and attitudes toward digital learning environments. Demographic data such as study program and academic year were also collected.
Instructional Materials—created specifically for the experimental phase. These included:
  • A live demonstration plan delivered by an instructor in real time.
  • A video tutorial recorded in advance and made accessible to participants online.
  • A task brief outlining the learning objective and final outcome expected from all groups.
Assessment Rubric—a standardized evaluation form developed to assess the student submissions. The rubric focused on three main criteria:
  • Understanding of the task,
  • Confidence in execution, and
  • Performance Quality of the final visualization product.
Expert evaluators used this rubric to assess all submissions anonymously.

2.5. Data Analysis

The data collected from both phases of the study were analyzed using descriptive and comparative statistical methods, as well as qualitative content analysis (Figure 1).
Quantitative data from the online questionnaire and the rubric-based evaluations were processed using Microsoft Excel (Version 2024) and SPSS (Version 29). Descriptive statistics (means, percentages, and standard deviations) were calculated to summarize participant demographics and preferences. Comparative analysis was used to examine differences in task performance across the three instructional groups.
Qualitative data from open-ended survey responses were analyzed thematically. Responses were grouped into categories based on recurring keywords and concepts, allowing the researchers to identify common attitudes and perceptions regarding learning formats and digital tools.
The findings from both analyses were then triangulated to ensure validity and consistency between quantitative outcomes and qualitative insights. Emphasis was placed on interpreting results through the lens of pedagogical relevance for contemporary design education.
3. Results

This study was conducted in two stages: The first was a survey aimed at identifying preferred learning styles, attitudes toward new knowledge, perceived effectiveness of various teaching methods, and levels of engagement. The second was an experimental training phase to assess the degree of knowledge acquisition and its practical application in the field of architectural visualization through different instructional approaches.

3.1. Survey

A standardized online questionnaire was developed, comprising a total of 26 closed- and open-ended questions. The questions were organized into four sections:
  • Section 1—General demographic data of the participant.
  • Section 2—Perceptions regarding the format of instruction.
  • Section 3—Attitudes toward educational content and digitalization.
  • Section 4—General impressions and recommendations.
The survey was anonymous, and the information was used exclusively for the purposes of the research project entitled “Exploring Opportunities for More Effective Acquisition and Interpretation of New Knowledge by Students in Design Education”, Contract No. NIS-B-1403/16.05.2025, implemented at the University of Forestry, Sofia.
A total of 130 respondents completed the survey, including 72 students (54% of participants), 2 professionals working in the field of education, and 56 university lecturers (2 of whom were also enrolled in academic programs at the time). Respondents included both students and university lecturers from eight Bulgarian universities: University of Forestry; Technical University; National Academy of Arts; New Bulgarian University; Sofia University; University of Architecture, Civil Engineering and Geodesy; National Sports Academy; and Varna Free University “Chernorizets Hrabar”.
The largest number of respondents came from the University of Forestry, accounting for 65 participants—29 of whom were university lecturers and 38 were students. Overall, the ratio between students and lecturers was relatively balanced; however, the disproportionate representation of respondents from the University of Forestry limits the representativeness of the data and raises concerns regarding the generalizability of the conclusions to the higher education system in the Republic of Bulgaria as a whole.
In terms of age distribution, 70 respondents (54%) were under the age of 25; 5 respondents (4%) were between 25 and 30 years old; 12 respondents (9%) were between 31 and 40; 23 respondents (18%) were between 41 and 50; 8% of the respondents were between 51 and 60; and 9 participants (7%) were over 60 years of age.
The data reveals a predominance of younger participants, primarily students; this inevitably influences the general perceptions regarding the effectiveness of traditional versus digital teaching methods.
For the purposes of this study, the analysis was based on responses to nearly half of the questions included in the survey.

3.1.1. Analysis of Results

In response to the mandatory question “Are you familiar with the specific characteristics of teaching students who study design?”, 58 respondents (45%) indicated that they were thoroughly familiar with the specifics of design education. Among them were 23 university lecturers from six institutions (University of Forestry; National Academy of Arts; New Bulgarian University; University of Architecture, Civil Engineering and Geodesy; Technical University—Sofia; and Varna Free University “Chernorizets Hrabar”), 34 students from five universities, and 1 individual working in the field of education.
A total of 38 respondents (29%) reported that they were familiar but lacked in-depth knowledge. This group included 16 lecturers from three universities (University of Forestry; University of Architecture, Civil Engineering and Geodesy; and Technical University—Sofia), 21 students from five universities, and 1 educational professional. Another 22 respondents (17%) stated they were only slightly familiar with the topic. Among them were 10 lecturers from three universities (University of Forestry and Technical University—Sofia), 12 students from four universities, and 1 individual employed in the education sector. Lastly, 12 respondents (9%) reported that they were not familiar with the topic at all; this group comprised 7 university lecturers from the University of Forestry and 5 students from three different universities.
In total, nearly one-third of the surveyed participants (34 respondents, or 26%) were either slightly familiar or entirely unfamiliar with the specific needs of design education, which raises concerns about the validity of some of the evaluations presented in the survey.
In response to the question “Which of the listed formats do you consider appropriate for design education?”—a mandatory question allowing for multiple selections—respondents clearly demonstrated a preference for blended and practice-oriented approaches. This is a logical outcome given the nature of disciplines such as design. The most frequently identified appropriate formats were the use of digital tools during in-person instruction (33%), project-based learning (28%), and hybrid learning models (26%).
In response to the question “How would you evaluate the effectiveness of the various forms of instruction in the context of design education?”—a mandatory question requiring assessment of each listed option—participants identified interactive and practice-oriented approaches as the most effective. Project-based learning was rated as effective or highly effective by 72.3% of respondents. The use of digital tools in face-to-face settings received even stronger approval, with 87.7% of participants considering it effective. Hybrid learning was moderately well received, with 53.8% indicating it as effective. Self-directed learning using digital resources received mixed evaluations. Distance learning, however, remained largely unaccepted, with 60.8% of respondents deeming it ineffective—likely due to the inherently visual and hands-on nature of design as a discipline, which requires direct interaction and practical engagement.
In response to the open-ended question “In your opinion, what changes should be made to the format of instruction in order to enable students to more effectively acquire and interpret new knowledge?”—which was optional—82 out of the 130 survey participants (63.1%) chose to provide suggestions. More than half of these responses (53.6%) came from 44 students, indicating their strong engagement with the topic. Both students and university lecturers clearly emphasized the need to modernize teaching through digital means—such as video lessons, online platforms, hybrid learning models, and the use of specialized software. This is particularly important given the technological fluency of today’s students.
Students frequently noted a lack of motivation among university lecturers. They stated that when university lecturers do not demonstrate effort or enthusiasm, their own interest declines. Lecturers, on the other hand, highlighted the need for greater student engagement. This is a challenge that cannot be resolved solely through the implementation of digital tools. There is a risk of passive information consumption without the development of reflective and critical thinking skills if interaction is lacking.
Another recurring theme in the responses of both groups was the necessity of incorporating practical assignments, project-based learning, real-world case studies, and internships into the curriculum.
In response to the question “How often are the following resources provided to you/do you provide/use the following resources in the learning process?”—a mandatory question requiring evaluation of each listed item—only 40% of participants (combining “often” and “very often”) reported regular use, while over 43% (“never” and “rarely”) indicated infrequent use. University lecturers were more active than students in using digital textbooks.
Regarding online platforms (e.g., Moodle, Teams), 61.5% of respondents reported using them frequently or very frequently, while only 5.4% had never used them. In this area, university lecturers were particularly active: 38 of them reported frequent or very frequent use.
With respect to video lessons, 65.4% of respondents reported using them rarely or never, and only 25.4% indicated frequent or very frequent use. Among students, video lessons were rarely used, which may represent a potential area for development.
As for interactive tests and simulations, 57.7% reported either no use or rare use, and only 23% indicated frequent or very frequent usage. Students had significantly less access to these resources than lecturers.
Specialized software tools were the most widely used resource: 58.5% of respondents reported frequent or very frequent use. These tools were more commonly provided by university lecturers than by students themselves, suggesting potential for improved communication and implementation in the teaching process.
In response to the mandatory question “Do you use applications or platforms related to short instructional modules (e.g., LinkedIn Learning, Coursera, Udemy, Domestika, YouTube) to enhance your knowledge in a specific subject area?”, 89 respondents (68%) answered affirmatively. Among them, students comprised the majority (48 out of 89), indicating a high level of personal initiative in seeking additional learning opportunities outside the traditional academic system.
However, the low daily usage rate (only 14% reported using such platforms daily) suggests that this format has not yet become a routine part of the learning process, despite evident interest. Sixty percent of respondents stated that they use these resources at least several times per month.
Of the 89 respondents who confirmed usage, 67 specified the subject areas in which they found these platforms useful. Both students and lecturers most frequently reported using them for practical and visually oriented disciplines, such as graphic design, CAD software, interior design, and 3D modeling. This reflects a clear gap in the current curriculum, particularly in terms of practical training involving software and visual techniques.
Many students shared that self-directed online learning is not a matter of preference but rather a necessity. Numerous participants stated that they use such applications and platforms for inspiration, personal interest, or to catch up on missed knowledge. University lecturers also used these platforms to stay current and adapt to emerging trends.
While such learner autonomy is commendable, it also highlights a lack of structured integration of these resources into formal academic content. University curricula currently do not offer systematically developed video resources or interactive modules, even though lecturers themselves acknowledge the need for them.
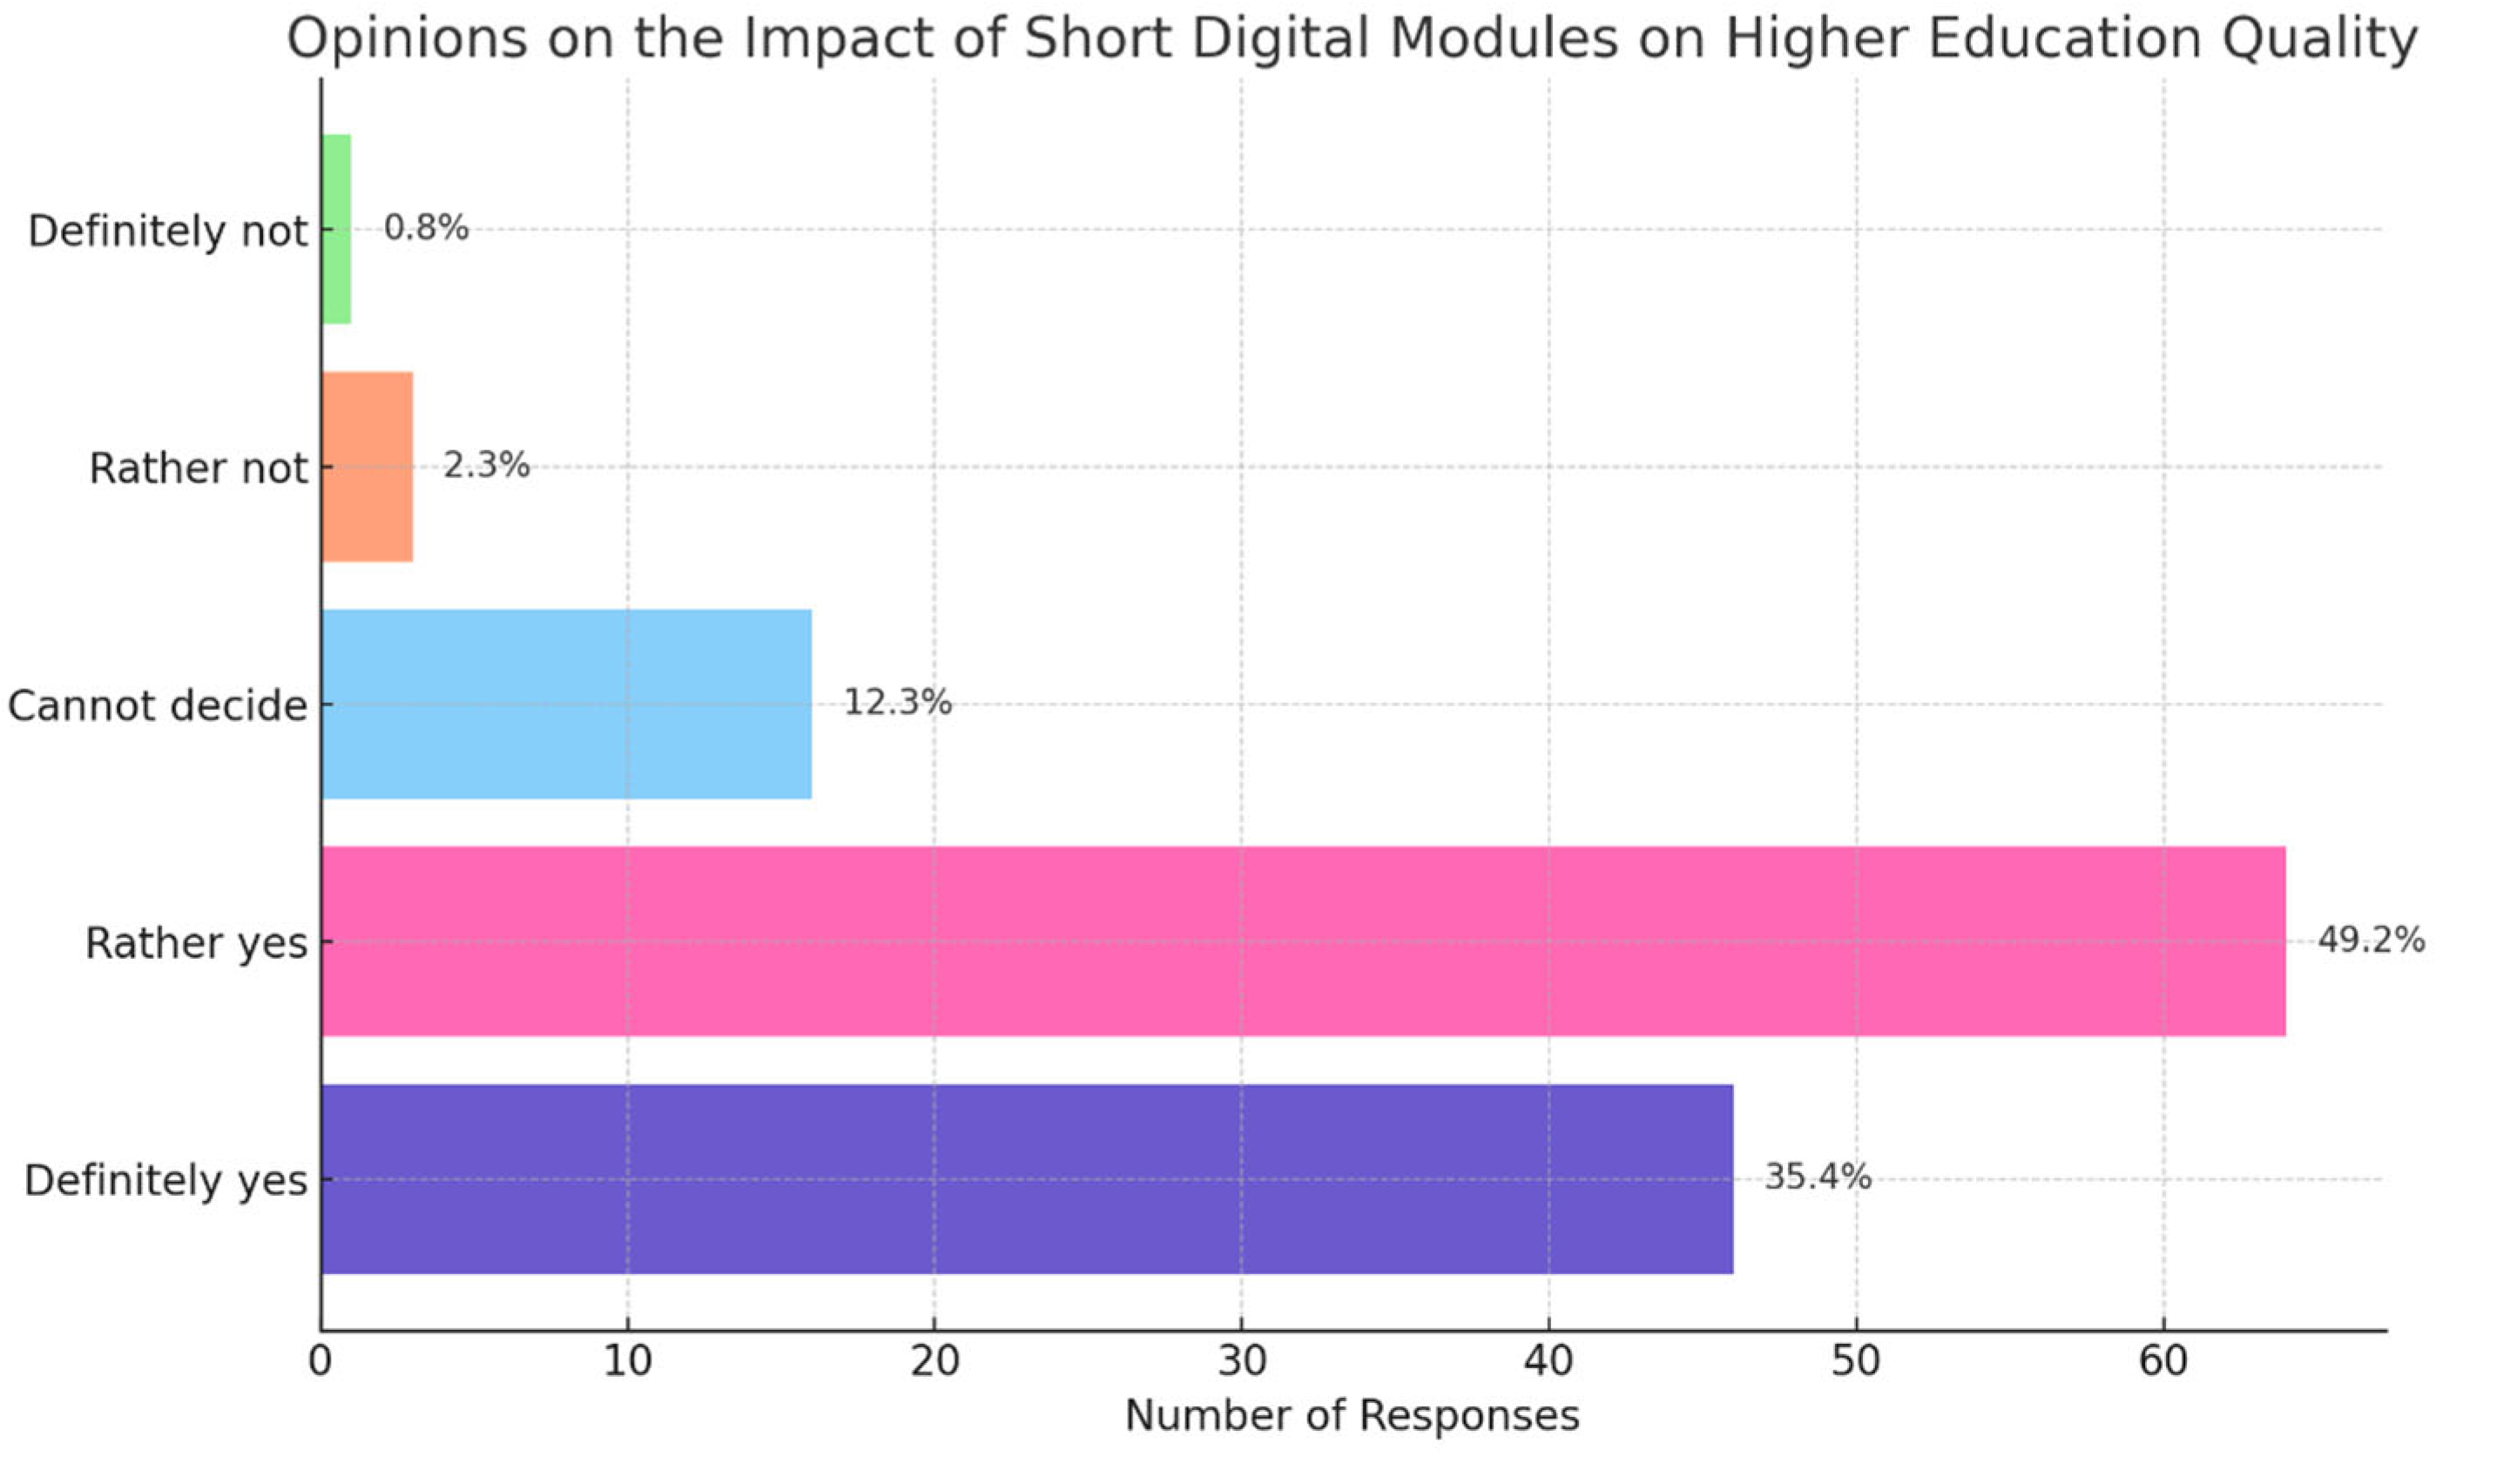
In response to the mandatory question “Do you believe that the integration of short digital learning modules into traditional teaching methods would improve the quality of education in higher education institutions?”—with only one answer permitted—46 respondents (35%), including 24 lecturers, stated that they strongly believe such integration would enhance educational quality (Scheme 1).
The overall results indicate a high level of approval for incorporating short digital modules: 84% of respondents (46 strongly agree + 64 somewhat agree) believed that this approach would improve the quality of instruction. This demonstrates a clear openness to innovation and the integration of new methodologies within higher education.
University lecturers also showed strong support: 51 out of 75 (68%) expressed agreement or strong agreement, while only 1 lecturer was firmly opposed to the idea.
In response to the mandatory question “Which of the following digital resources do you consider suitable for use in design education?”—where multiple answers were allowed—six main categories of digital resources emerged: software tools, online platforms, video content, interactive tests and simulations, gamification, and digital textbooks. There was near-unanimous agreement among both students and university lecturers regarding the relevance and applicability of these resources. No category was strongly rejected—each received considerable support, indicating a conscious effort to diversify teaching and learning methods.
Both lectures and exercises delivered in audiovisual formats were reported as highly desirable, particularly for complex software tasks and creative processes. Many lecturers and students stated that they use various educational platforms as well as self-produced recordings. Digital textbooks received strong support, although the comments provided lacked specific details about their origin, quality, or level of interactivity.
To effectively meet the needs of the digital generation, textbooks should not be mere PDF replicas but rather include interactive content such as embedded examples, videos, quizzes, and simulations—features that help maintain student engagement.
While the results indicate clear trends favoring the combined instructional method, they should be interpreted with caution due to the limited sample size and the exploratory nature of the study.

3.1.2. Conclusions from the Analyzed Results

Dialog and motivation—overlooked but critical factors. Numerous responses highlight a lack of motivation and the need for mutual engagement as key issues. These are both sociocultural and systemic challenges. Addressing them requires reforms in teacher training, as well as incentives that promote active participation of both lecturers and students throughout the educational process—including psychological support and motivational mechanisms such as certificates, events, and internships.
Practical training—a consensus on necessity. Both student and faculty responses consistently emphasize the need for practical assignments, project-based learning, real-world case studies, and internships. The implementation of “learning by doing” is seen as highly effective, but it does present challenges: it demands prior preparation from lecturers and is most effective when applied in small-group settings.
The strong role of non-formal learning. Short-format learning platforms are regarded as critically important tools for enriching knowledge in applied and technical disciplines. While they do not replace formal academic instruction, they serve to supplement and compensate for curricular shortcomings. These platforms are used more frequently by students, with online platforms and specialized software being the most widely utilized. Video lessons and interactive simulations are the least used, representing areas with considerable potential for development. There is a clear opportunity for more interactive and multimedia-enriched learning, as well as for improved integration of external resources into formal academic environments.

3.2. Experimental Training

3.2.1. Implementation, Evaluation, and Analysis of the Experimental Training Results

Between 19 May and 28 May 2025, an experimental study was conducted involving 42 first-year students enrolled in the program “Engineering Design (Interior and Furniture Design)” at the University of Forestry. The experiment aimed to investigate students’ ability to acquire and interpret new knowledge in the field of architectural visualization using various instructional methods: live demonstration, video-based instruction, and a combination of both.
The participating students had no prior experience with the assigned task. Their participation in the experiment was voluntary, and they were randomly divided into three equally sized groups. Each group received identical initial instruction covering the basic functions of 3ds Max—creating and copying objects and moving and rotating them, among others. The initial briefing lasted 30 min.
Following the introductory session, all three groups completed a specific practical assignment: modeling interior walls based on a provided technical drawing. Each group was taught and guided using different instructional approaches for demonstrating the steps involved in completing the task.
Group 1—Live Demonstration: Participants received a live demonstration from an instructor, showing all the steps required to complete the task. The sequence of steps was repeated three times, after which students were given 20 min of independent work time to replicate the demonstrated process.
Group 2—Video Demonstration: Participants were shown a pre-recorded video containing the same demonstration as Group 1, identical in both content and duration. They were allowed unlimited access to the video, including the ability to pause, rewind, or fast-forward. The group was also allotted 20 min of independent work time, as in Group 1.
Group 3—Combined Method: Participants first observed the live demonstration and were then granted access to the same video shown to Group 2. They had the opportunity to review the video before beginning the task and, as in Group 2, could view it as many times as they desired. The allotted time for independent work was again 20 min.
Evaluation
The assessment of the practical task was carried out by a single expert in the field of interior visualization, who also possessed experience in teaching and evaluating educational activities of similar nature and content to those involved in the experiment. The evaluation was based on expert judgment and did not rely on predefined quantitative criteria or rating scales. Instead, the emphasis was placed on the overall quality of execution, accuracy in completing the required steps, logical sequencing in task performance, and the applicability of the results to real-world conditions and visualization processes.
This approach represents a form of subjective expert evaluation commonly employed in studies that investigate complex skills, as well as creative or practical activities that are difficult to reduce to objective indicators. While it does not offer complete quantitative objectivity, expert assessment enables a deeper understanding of the quality and adequacy of performance, considering contextual and procedural factors that numerical metrics might overlook.
Based on this qualitative evaluation, participants’ results were categorized into three performance levels:
Category A: Excellent performance—all steps demonstrated were completed, and the resulting 3D model was identical to the reference example.
Category B: Partial performance—the resulting 3D model showed minor discrepancies or small technical errors but demonstrated an overall understanding of the demonstrated steps.
Category C: Unsuccessful performance—the submitted 3D model showed significant deviations from the reference or was incomplete, with major steps missing, rendering the model unusable.
It is important to note that the use of subjective expert evaluation constitutes a methodological limitation that should be considered when interpreting the results. To minimize potential individual bias and enhance the validity of the conclusions, the evaluation was conducted under conditions that ensured equal access to information and consistent observation for all participants. During the experiment, all participants saved their files using standardized naming conventions for each group, enabling blind review and unbiased assessment of individual submissions.
Analysis of the Experimental Results
Based on the criteria presented in the previous section, the distribution of scores for the practical task across the three performance categories, by group, is shown in Table 1.
To facilitate statistical analysis and increase the sensitivity of comparisons given the small sample size, Categories A and B were merged into a group labeled “Successful Performance,” while Category C was treated as “Unsuccessful Performance.” Based on this transformation, a two-category distribution by group was constructed (Table 2).
To determine whether there was a statistically significant difference between the groups in terms of success rates, the extended version of Fisher’s exact test (Fisher–Freeman–Halton test) was applied. This test is appropriate for r × c contingency tables with small frequencies, where traditional chi-square tests may not be reliable.
The test uses the following hypergeometric probability formula:
P = R 1 ! × R 2 ! × R 3 ! × C 1 ! × C 2 ! N ! × ( n 11 ! × n 12 ! × n 21 ! × n 22 ! × n 31 ! × n 32 ! ) ,
where
  • R1, R2, R3 are the row totals (13, 15, 14);
  • C1, C2 are the column totals (32, 10);
  • nij are the cell frequencies;
  • N is the total number of observations (42).
Substitution and result:
P = 13 ! × 15 ! × 14 ! × 32 ! × 10 ! N 42 ! × ( 8 ! × 5 ! × 11 ! × 4 ! × 13 ! × 1 ! )   , P 0.0173
This is the exact probability of observing the given table under the null hypothesis of no association between the instructional method and task performance.
To determine the p-value, a Monte Carlo simulation with 10,000 iterations was conducted, estimating the proportion of possible tables with equal or lower probabilities than the observed one: P ≈ 0.09.
Interpretation of the Results
The resulting p-value (0.09) does not meet the conventional threshold for statistical significance (α = 0.05). Therefore, the null hypothesis—that there is no relationship between the type of instructional method and student performance—cannot be rejected.
Nevertheless, a clear trend emerges suggesting that the combined instructional method (Group 3) yields better performance outcomes:
  • Group 1: 61.5% successful performance;
  • Group 2: 73.3% successful performance;
  • Group 3: 92.9% successful performance.
These results may be interpreted as indicative of a positive effect from the combined approach (live demonstration + video). A larger-scale study with an expanded sample is recommended to confirm the observed trend.

3.2.2. Analysis of Results and Conclusions from the Student Survey Conducted During the Experiment

Upon completion of the task or expiration of the allotted time, students were asked to complete a questionnaire designed to gather information regarding their prior experience with 3D modeling software; their familiarity with video-based learning and its perceived effectiveness; and their personal perception of how well they understood the material at the end of the experiment.
The first section of the questionnaire focused on the students’ prior experience in working with 3D modeling software and their exposure to the use of video tutorials.
Regarding prior experience with 3D modeling software: More than half of the surveyed students indicated that they had no previous experience working with 3D modeling programs. Among those who reported some level of experience, most described it as minimal or moderate. In response to the question of whether they had worked with 3ds Max—the software used during the experiment—78% answered negatively, with only 5% (two participants) stating that they had substantial experience with the program. Among other popular software tools, participants mentioned having experience primarily with AutoCAD, SketchUp, and Blender.
Slightly more than half (52%) reported never having used 3D software in an educational context, while 23% stated they had used such tools but only infrequently. When asked whether they were able to follow steps from a video tutorial and reproduce them within a 3D modeling program, 64% responded that they could do so with minimal assistance, and 24% stated they could replicate the steps independently. Participants with prior experience had acquired their skills through online video tutorials and formal education settings such as school or university.
The responses provided by the participants indicate that the group, as a whole, had limited experience with the software and with 3D modeling in general. Participants who did report experience were relatively evenly distributed across the three groups. This is an important consideration in analyzing the experimental data, as no group consisted predominantly of experienced participants—thus minimizing the risk of skewed results in the practical task. At the same time, the fact that most participants were not only expected to replicate specific steps in a designated software environment but were also encountering the program for the first time highlights the relevance of evaluating the effectiveness of the different instructional methods. This, however, cannot be definitively proven using statistical methods alone, due to the limited sample size.
Regarding prior experience with video tutorials, only two respondents (5%) indicated that they had never used them. The subject areas in which video tutorials had been utilized were broad and diverse, ranging from mathematics and computer science to the humanities and design. This outcome is not surprising given the significant shift in educational models prompted by the COVID-19 pandemic and the behavioral tendencies of the current generation of students.
Despite the high percentage of participants who had previously used video tutorials, not all of them considered such materials to be more effective than live instruction. Specifically, 26% stated that video tutorials are a significantly better method of instruction; 21% believed that video-based teaching is somewhat better; 31% considered the two approaches to be equally effective; and 10% perceived video tutorials as a slightly less effective teaching method. These varied responses suggest, on the one hand, that live instruction remains important to students and, on the other hand, that attitudes toward video tutorials are likely influenced by the differing experiences participants have had with video-based learning.
The second part of the questionnaire focused on the demonstration and the specific practical task during the experiment, aiming to assess participants’ self-perceived understanding of the demonstrated material and their confidence in replicating the specific steps.
Regarding the understanding of the steps and independent replication, significant variation in responses was observed—unlike the responses to the questions in the first part of the questionnaire, which were largely homogeneous and evenly distributed across the groups. Despite these differences, there were still several questions for which the surveyed students provided very similar answers.
When asked whether they experienced difficulties in understanding the material, 95% of the respondents indicated that they did not. Moreover, none of the students believed that there were missing or unclear steps in the presentation, regardless of whether it was delivered live or via video.
As for the pace of instruction, 90% of participants stated that it was appropriate, neither too fast nor too slow. The demonstration was considered engaging by 93% of respondents. The differences between the groups became more apparent in response to questions related to the participants’ understanding of the material and their confidence in independently replicating the steps (Scheme 2).
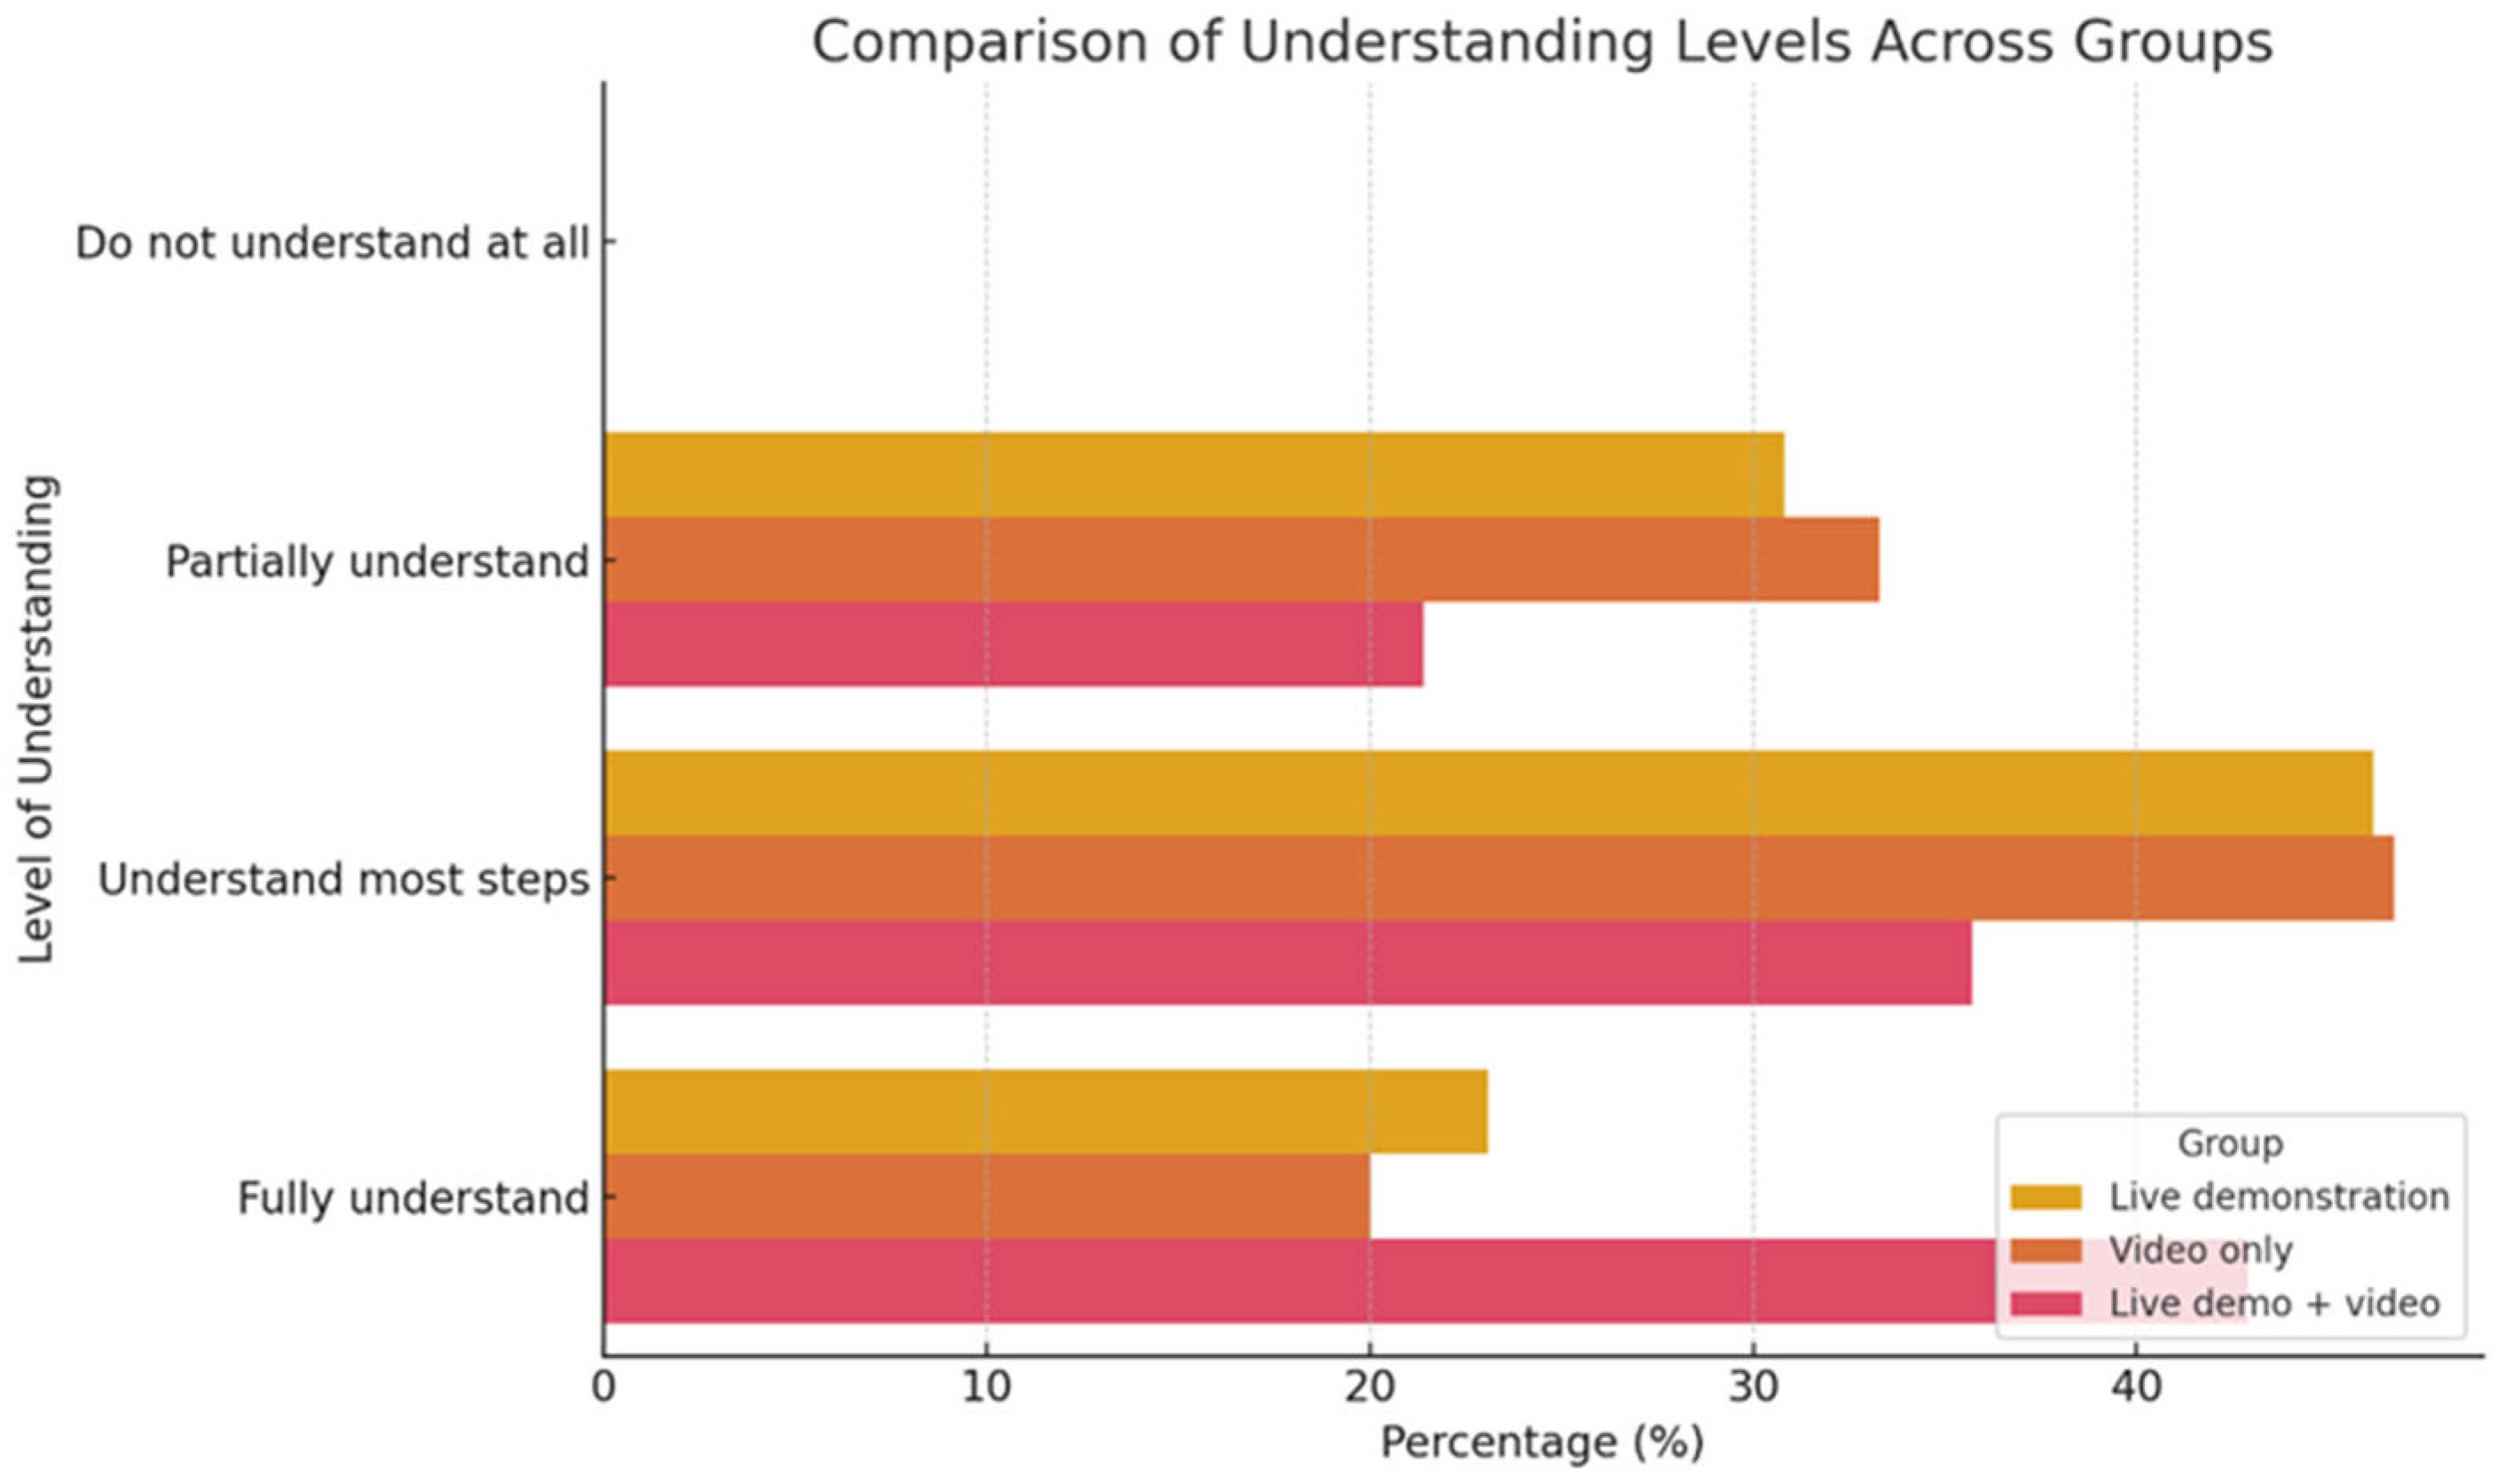
When participants were asked about the extent to which they understood the steps of the task, the group exposed to both live demonstration and video reported the highest level of comprehension, while the results were similar between the other two groups (Scheme 3).
Confidence in independently repeating the steps was also significantly higher in the group that received both a live demonstration and access to the video, compared to the other two groups. An interesting comparison can be made between the live demonstration group and the video-only group: the latter exhibited lower levels of confidence. This may be attributed to the fact that live demonstrations allow participants to observe the entire sequence of actions, including potential difficulties, multiple times before beginning independent work, which may aid memory retention. In contrast, video-based instruction may lead some participants to begin executing the steps immediately—step by step—without first watching the full sequence. As a result, they may rely more heavily on the video and retain the individual steps less effectively.
When asked “Do you believe that the video/demonstration was sufficient to complete the task independently?”, a clear pattern emerged: nearly 80% of those in the combined group (live demonstration + video) stated that this method was sufficient for independent task execution. In the video-only group, 13.3% of participants gave negative responses, suggesting that video alone may be less effective when not supported by a live demonstration (Scheme 4).
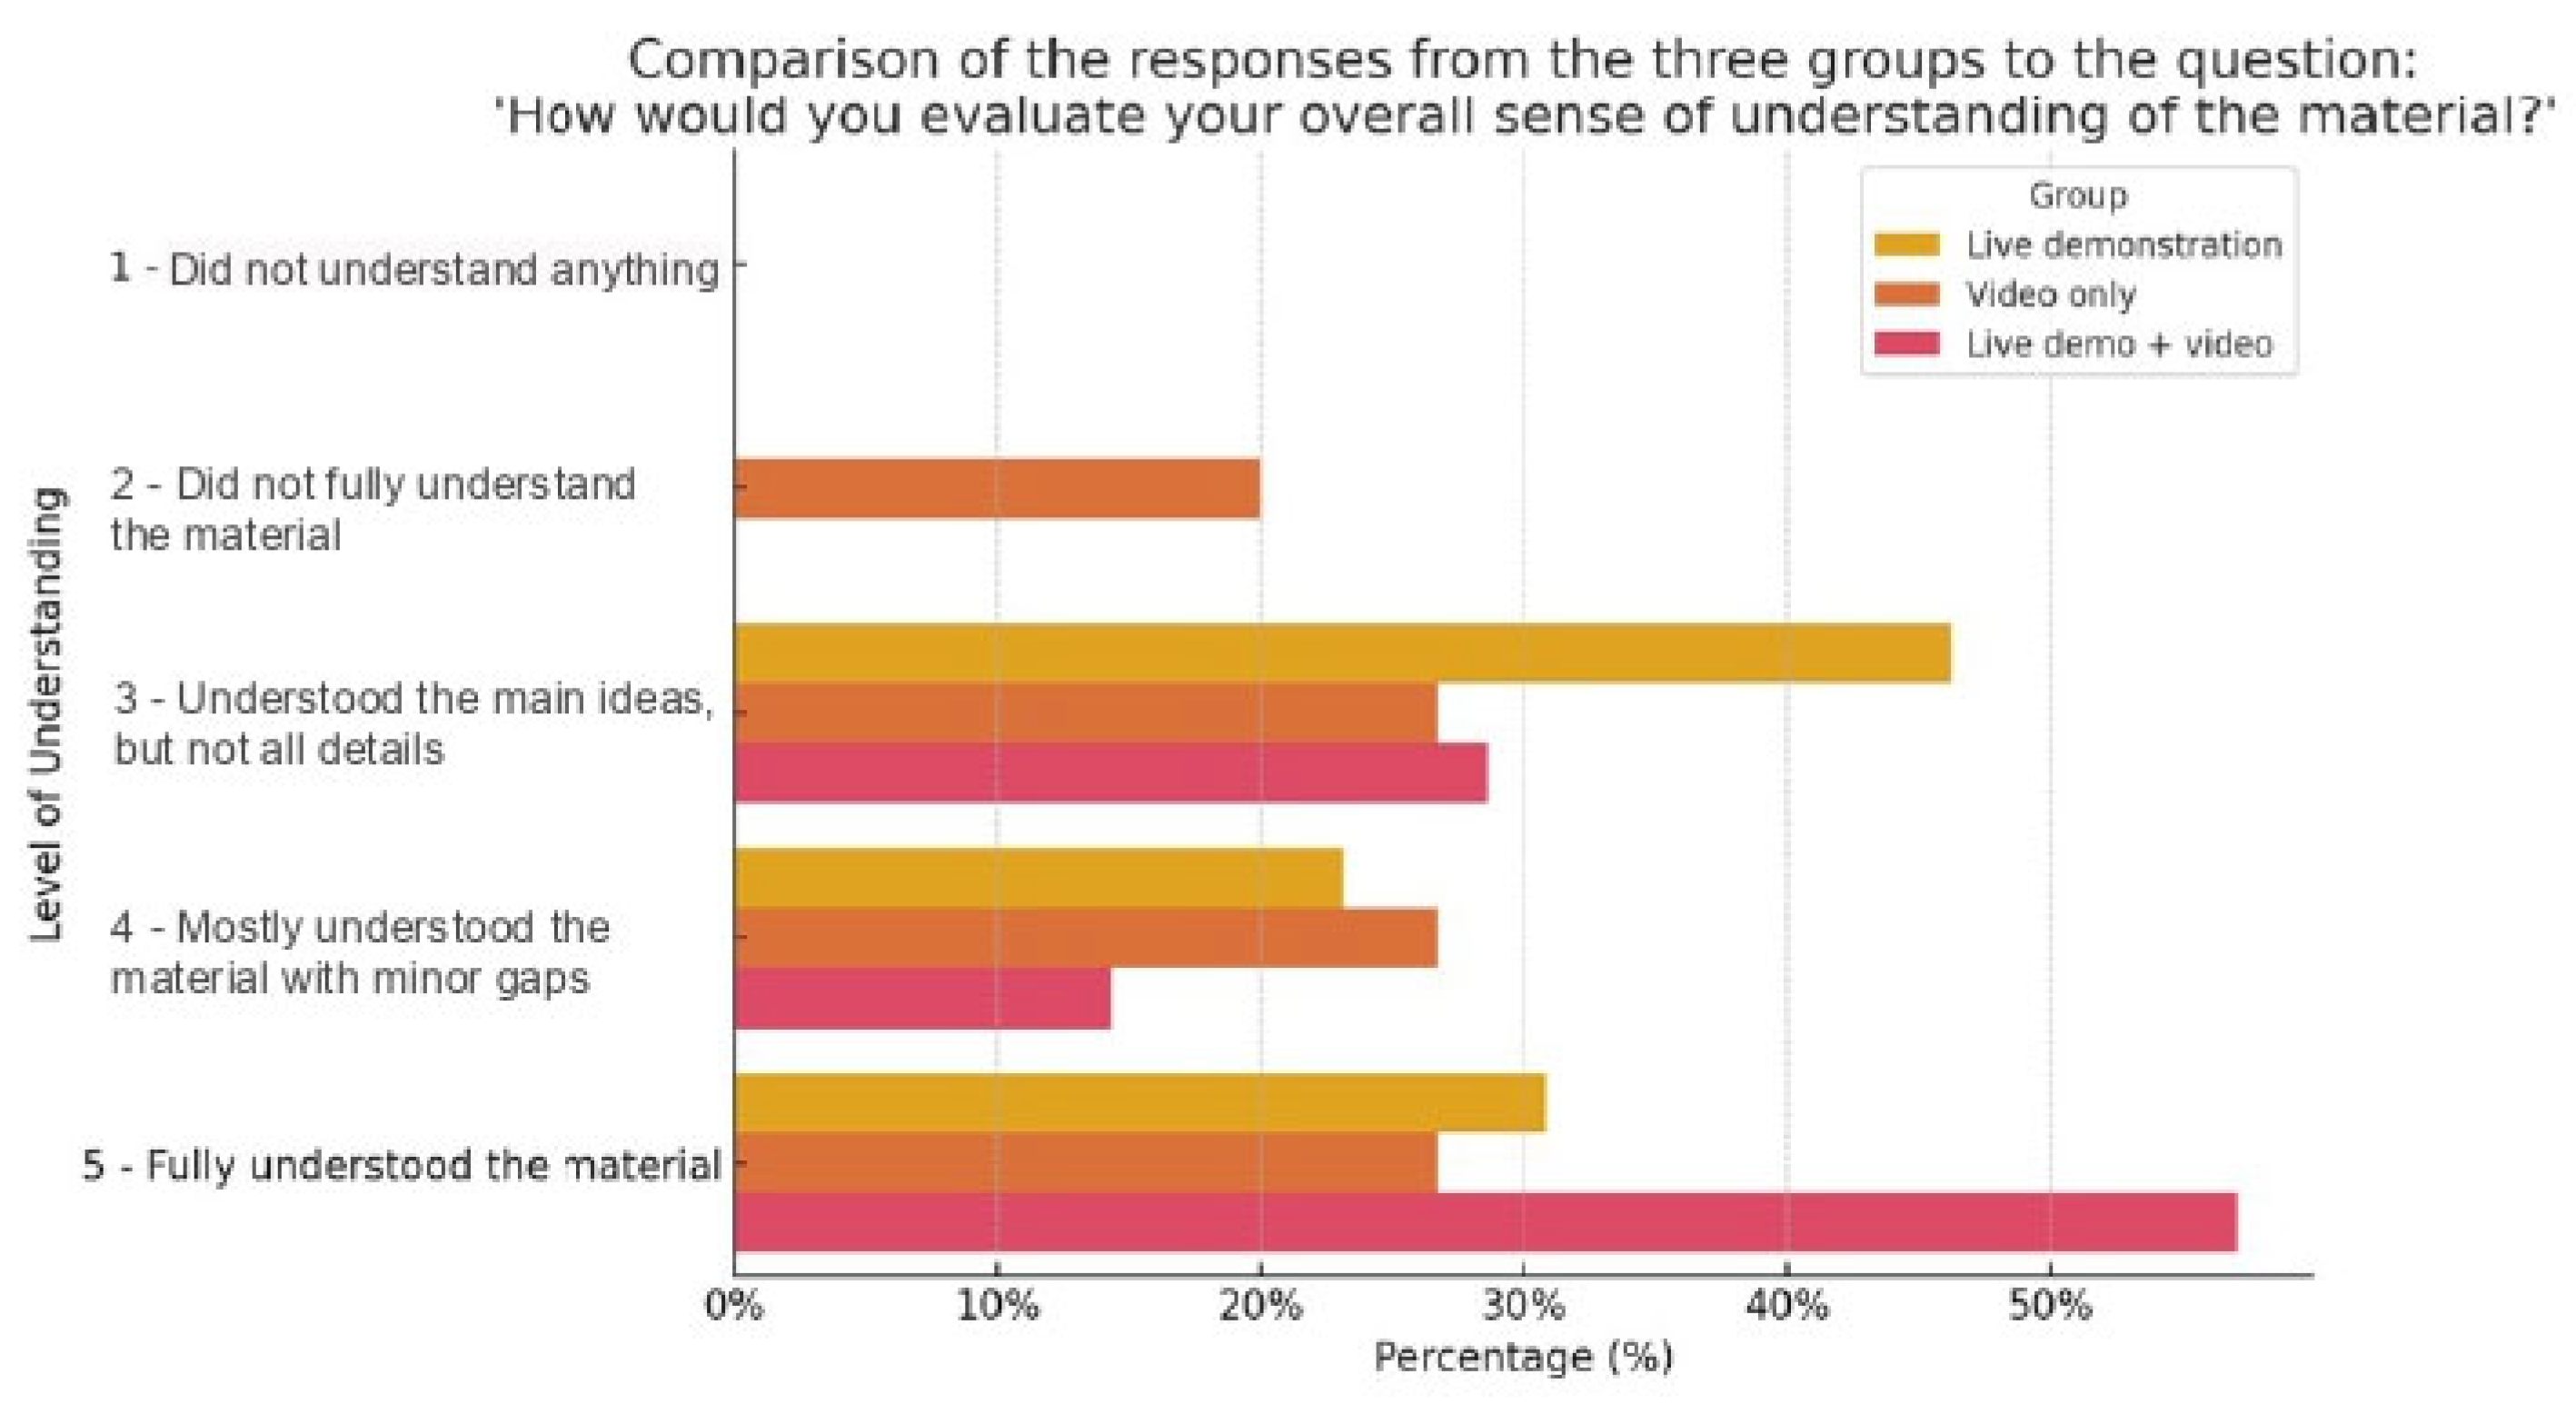
This tendency toward lower results in the video-only group is also evident in responses to the question regarding overall comprehension of the material. In this group, 20% of respondents stated that they did not fully understand the material. In contrast, the other two groups reported average to above-average levels of comprehension, with the combined group again reporting the highest confidence in their understanding (Scheme 5).
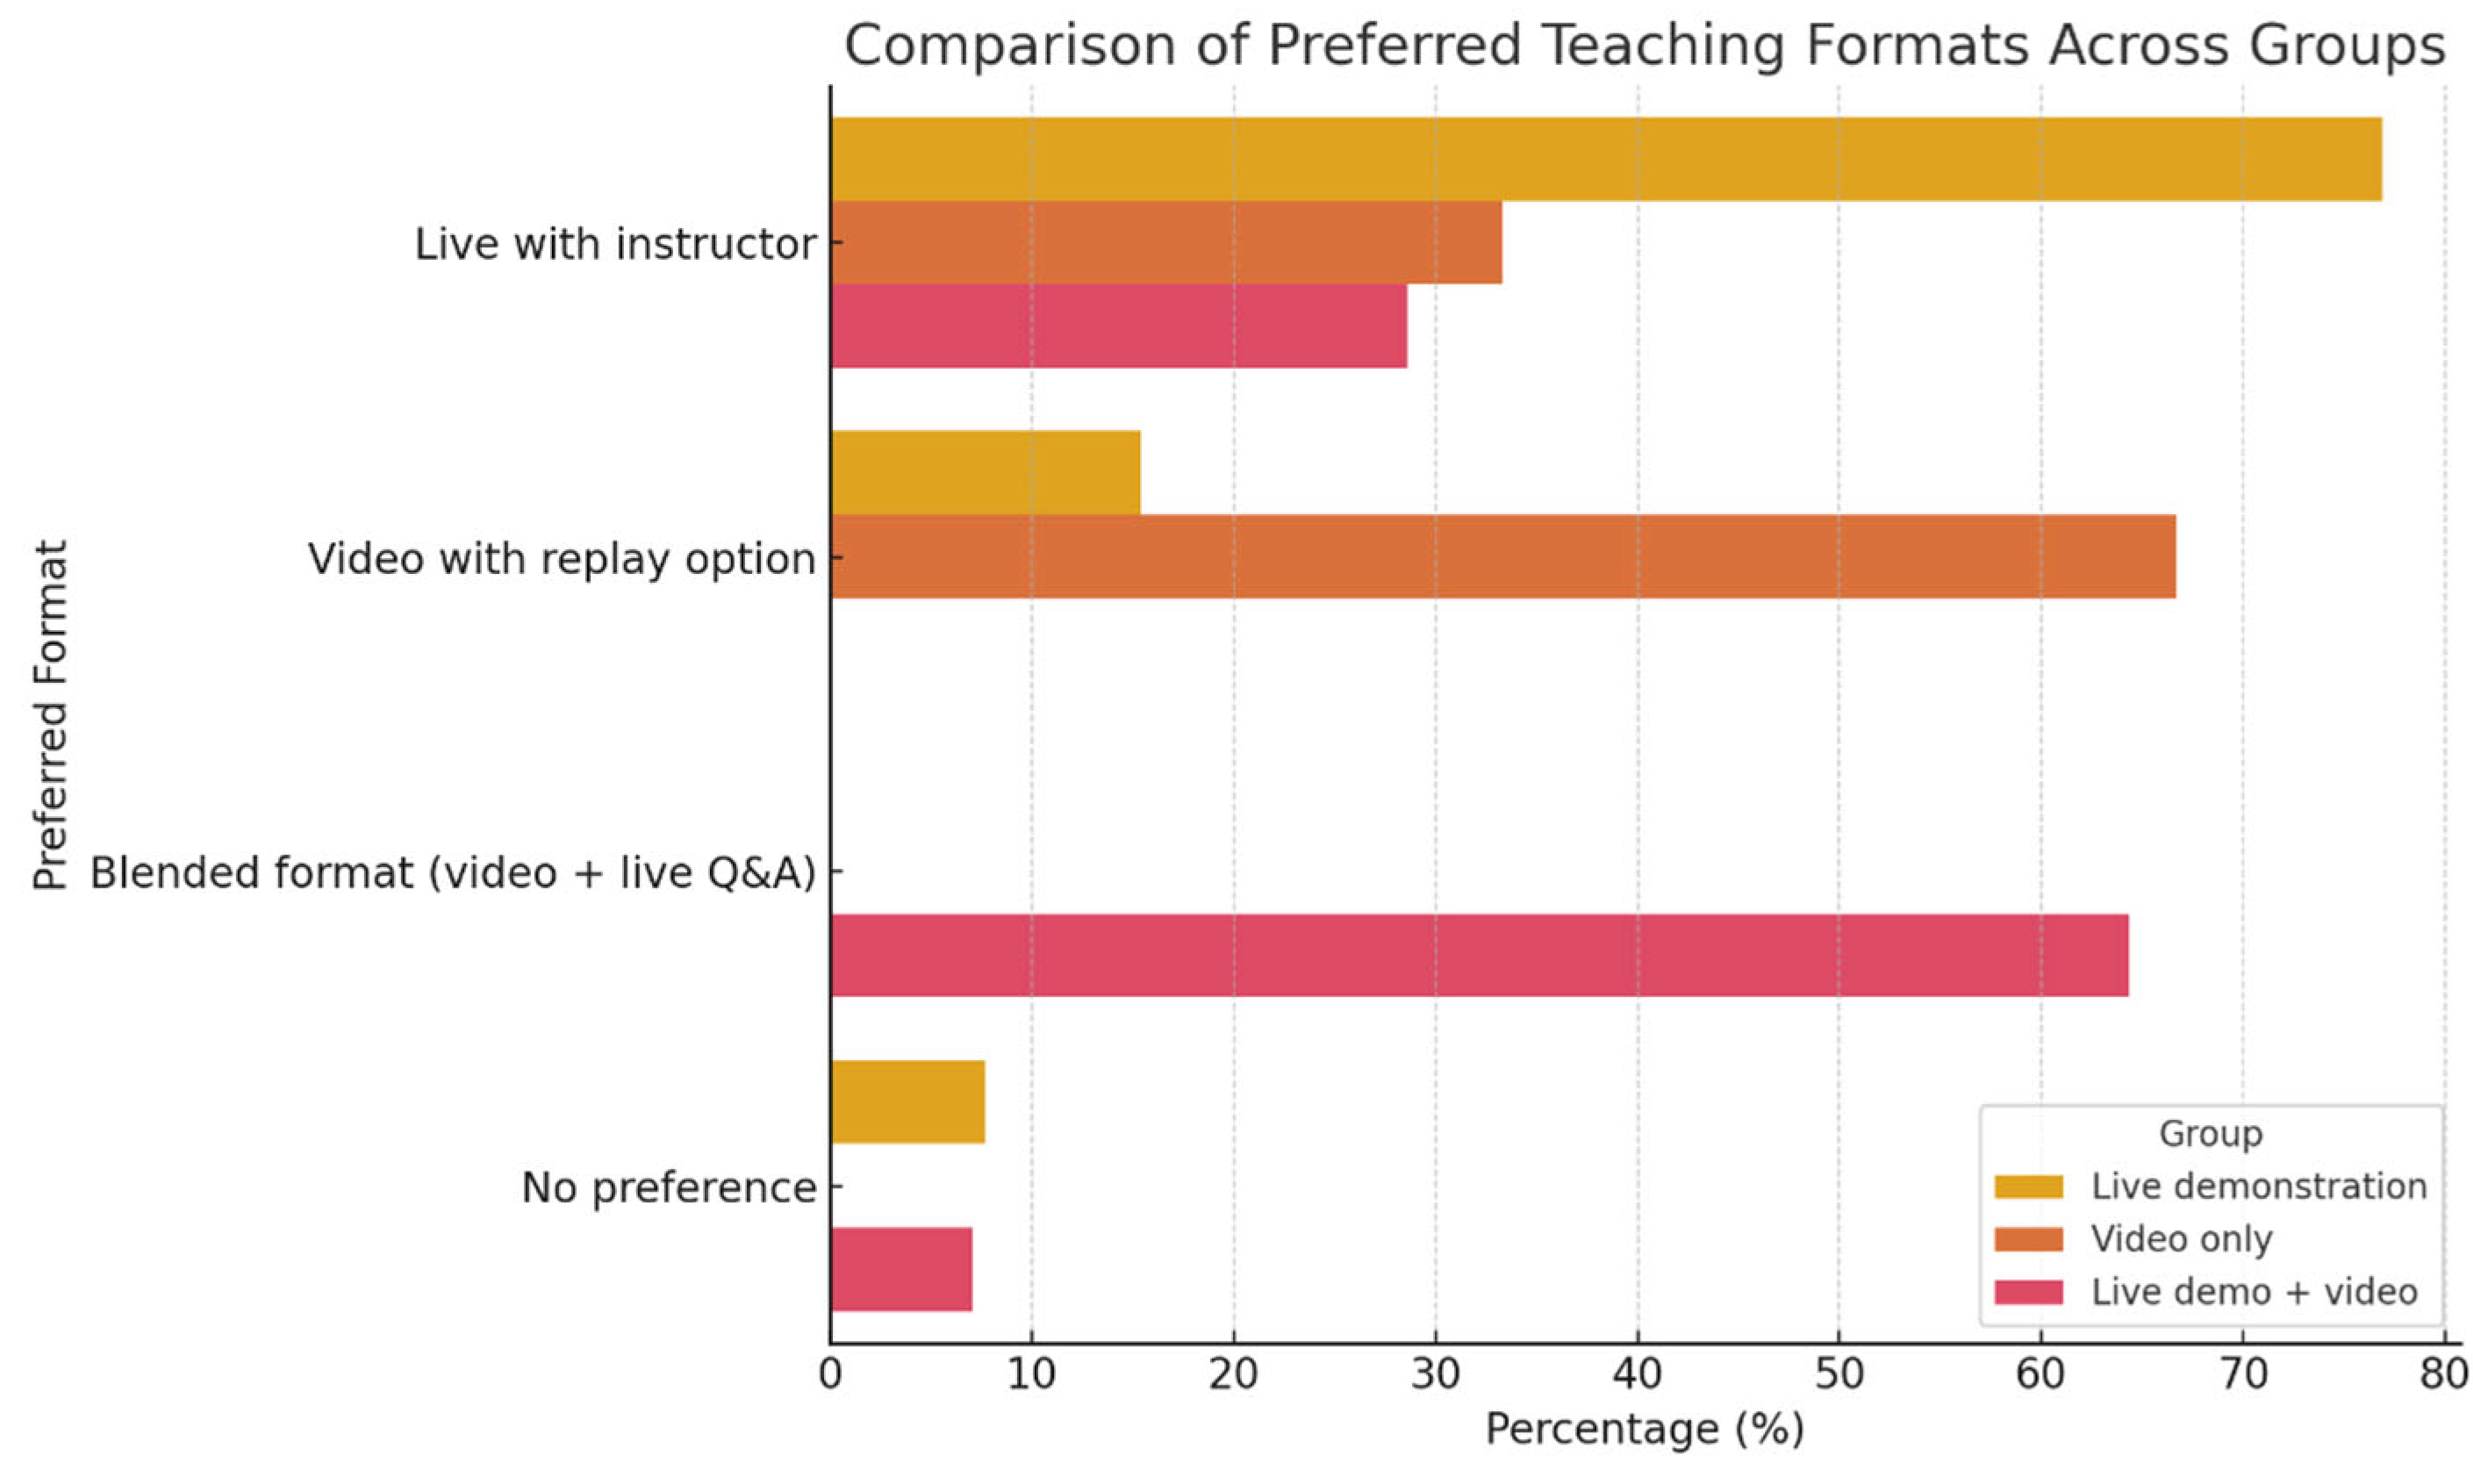
Responses to the question “Which type of demonstration would you prefer in the future?”, regarding preferred teaching formats, were unsurprising: the live demonstration group expressed a preference for live instruction with an instructor, while the other two groups favored a blended format (Scheme 6).

3.2.3. Conclusions from the Student Survey Conducted During the Experiment

Due to the small representative sample, the conducted experiment did not succeed in statistically proving that one teaching method is categorically better than the others. However, the participants’ results show a tendency toward better performance in the group that received live demonstrations combined with the ability to review a video recording. This outcome also aligns with the subjective perceptions of the participants, as expressed in their responses to the completed questionnaires. This information may be interpreted as indicative of a positive effect from the combined presentation format (live demonstration + video), and it is recommended that a larger-scale study with a bigger sample size be conducted to confirm the observed trend.
A comparison between students’ self-reported perceptions and their actual task performance reveals several points of alignment. Students who participated in the combined instruction group not only achieved the highest scores but also reported higher levels of confidence and clarity. This consistency supports the effectiveness of the integrated method. In contrast, some students in the live demonstration group expressed confidence in understanding despite lower performance scores, suggesting possible overestimation or gaps in retained knowledge. These nuances highlight the importance of combining subjective and objective measures in evaluating learning outcomes.

4. Discussion

The experimental phase affirms the relevance of multimedia learning principles in enhancing cognitive engagement and comprehension among design students. Preferences for short, visual formats align with the characteristics of Generations Z and Alpha, supporting the integration of theory-informed strategies in design curricula.
The combined instruction group demonstrated the strongest alignment between students’ self-perceptions and actual performance, suggesting the effectiveness of multimodal methods. While other groups exhibited mismatches between perceived understanding and results, these inconsistencies emphasize the value of instructional formats that support both engagement and demonstrable competence.
A consistent trend emerged in favor of interactive, visually rich teaching approaches that facilitate active participation and hands-on experience—hallmarks of design education. Project-based learning and digital tools were favored by both students and instructors, aligning with constructivist pedagogy and experiential learning theory (Kolb, 1984).
Although statistical significance was not achieved (p ≈ 0.09), the data suggests greater learning outcomes when live demonstrations are complemented by video instruction. This aligns with Clark and Mayer’s (2016) claims regarding multimedia learning and cognitive load reduction through dual channels—visual and verbal.
The wide use of informal learning platforms (e.g., Coursera, YouTube, Udemy) highlights learners’ initiative in seeking supplementary resources but also points to curricular gaps. Institutions could enhance their relevance by integrating short, modular content, such as video tutorials and simulations, within formal instruction.
The qualitative findings reveal motivational challenges among students and faculty, calling for a systemic approach to curriculum and instructional design. Self-determination theory suggests that autonomy, competence, and relatedness are essential for sustained engagement (Deci & Ryan, 1985). Microlearning formats can support this by enabling autonomy and building confidence through small, achievable tasks.
These observations reinforce the need for adaptive, multimodal strategies in design education, where visual communication and spatial reasoning are central (Lim & Querol-Julián, 2024, pp. 1–20). Aligning these strategies with cognitive load theory may optimize instructional efficiency and learner experience in highly visual, practice-oriented fields.

5. Conclusions

This study provides preliminary insights into how multimedia and microlearning formats can support more effective knowledge acquisition in design education, particularly in the domain of architectural visualization. The findings suggest that integrating both live demonstrations and video tutorials enhances learner comprehension and performance through dual-channel processing, in line with multimedia learning theory.
However, several limitations must be acknowledged. The sample size was modest and limited to participants from eight Bulgarian universities, which may constrain the generalizability of the findings. Moreover, the results reflect short-term effects; longitudinal research is required to validate sustained learning outcomes. Methodological limitations, such as the reliance on subjective expert evaluation and variation in student disciplines, may also influence the results.
Based on the data collected, students favor short, visually oriented, and practical learning formats. These preferences are closely aligned with the characteristics of Generations Z and Alpha and reflect the cognitive and motivational demands these learners bring to higher education environments.
The pedagogical implications of this study underscore the importance of adopting adaptive and learner-centered strategies that promote motivation, engagement, and the development of visual-spatial skills. Design educators should consider integrating microlearning modules, project-based learning, and visual media not as supplementary tools but as core components of instructional design.
Future research should employ mixed-methods and longitudinal designs across diverse educational settings to better evaluate the impact of multimedia learning strategies on long-term skill development and academic outcomes.

Author Contributions

Conceptualization, D.A., T.S. and V.T.; investigation, D.A. and T.S.; Methodology, D.A. and T.S.; Project administration, D.A.; validation, D.A. and T.S.; formal analysis, D.A., T.S. and V.T.; investigation, D.A., T.S., D.L., E.-N.K. and A.-M.S.; resources, D.A., T.S. and V.T.; data curation, D.A. and T.S.; writing—original draft preparation, D.A. and T.S.; writing—review and editing, D.A.; visualization, D.A.; supervision, D.A.; project administration. All authors have read and agreed to the published version of the manuscript.

Funding

This research was funded by the Scientific Research Sector at the University of Forestry, Contract No. НИС-Б-1403/16.05.2025.

Institutional Review Board Statement

The study was conducted in accordance with the Declaration of Helsinki, and approved by the Institutional Review Board of University of Forestry (16 May 2025).

Informed Consent Statement

Informed consent was obtained from all subjects involved in the study.

Data Availability Statement

The data presented in this study are available on request from the corresponding author.

Acknowledgments

The authors would like to thank the students and lecturers from all participating universities for their cooperation and participation in the surveys and experimental study.

Conflicts of Interest

The authors declare no conflicts of interest.

References

  1. Biggs, J., & Tang, C. (2007). Teaching for quality learning at university (3rd ed.). McGraw-Hill Education. [Google Scholar]
  2. Blue Ocean Brain. (2025). Microlearning: The ultimate guide. Available online: https://info.blueoceanbrain.com/microlearning-ultimate-guide#break-down-learning (accessed on 28 July 2025).
  3. Boud, D., Cohen, R., & Sampson, J. (2013). Peer learning in higher education: Learning from and with each other. Routledge. [Google Scholar]
  4. Clark, R. C., & Mayer, R. E. (2016). E-learning and the science of instruction: Proven guidelines for consumers and designers of multimedia learning (4th ed.). John Wiley & Sons. [Google Scholar]
  5. Deci, E. L., & Ryan, R. M. (1985). Intrinsic motivation and self-determination in human behavior. Plenum Press. [Google Scholar]
  6. Ebbinghaus, H. (1885). Memory: A contribution to experimental psychology. Teachers College, Columbia University. [Google Scholar]
  7. Hamzah, A. (2021). Determinant factors and adaptation features of mobile personalized learning system. Journal of Physics: Conference Series, 1858(1), 012008. [Google Scholar] [CrossRef]
  8. Hug, T. (2006). Microlearning: A new pedagogical challenge (introductory note). In T. Hug, M. Lindner, & P. A. Bruck (Eds.), Microlearning: Emerging concepts, practices and technologies after e-learning: Proceedings of microlearning conference 2005: Learning & working in new media (pp. 8–11). Innsbruck University Press. [Google Scholar]
  9. Ishii, A., Tanaka, M., & Watanabe, Y. (2014). Neural mechanisms of mental fatigue. Reviews in the Neurosciences, 25(4), 469–479. [Google Scholar] [CrossRef] [PubMed]
  10. Ivanova, M., Botev, S., Angelova, D., & Vodenova, P. (2024). Successful collaboration between disciplines in a virtual teaching context through the application of design thinking. Innovations in Woodworking Industry and Engineering Design, 25(1), 32–43. [Google Scholar]
  11. Kang, S. H. K. (2016). Spaced repetition promotes efficient and effective learning: Policy implications for instruction. Policy Insights from the Behavioral and Brain Sciences, 3(1), 12–19. [Google Scholar] [CrossRef]
  12. Kapp, K. M., & Defelice, R. A. (2019). Microlearning: Short and sweet (pp. 228–230). Association for Talent Development. [Google Scholar]
  13. Kolb, D. A. (1984). Experiential learning: Experience as the source of learning and development. Prentice Hall. [Google Scholar]
  14. Laurillard, D. (2012). Teaching as a design science: Building pedagogical patterns for learning and technology. Routledge. [Google Scholar]
  15. Lim, F. V., & Querol-Julián, M. (2024). Learning with technologies in the digital age: Now and the future. In F. V. Lim, & M. Querol-Julián (Eds.), Designing learning with digital technologies: Perspectives from multimodality in education. Routledge. [Google Scholar]
  16. MacLeod, S., Reynolds, M. G., & Lehmann, H. (2018). The mitigating effect of repeated memory reactivations on forgetting. npj Science of Learning, 3(1), 9. [Google Scholar] [CrossRef] [PubMed]
  17. Mayer, R. E. (2001). Cognitive theory of multimedia learning. In R. E. Mayer (Ed.), Multimedia learning (pp. 41–62). Cambridge University Press. [Google Scholar]
  18. Mayer, R. E. (2009). Multimedia learning (2nd ed.). Cambridge University Press. [Google Scholar]
  19. McKee, C., & Ntokos, K. (2022). Online microlearning and student engagement in computer games higher education. Research in Learning Technology, 30, 2680. [Google Scholar] [CrossRef]
  20. McKim, R. H. (1972). Experiences in visual thinking. Brooks/Cole Publishing Company. [Google Scholar]
  21. Mohammed, S. G., Wakil, K., & Nawroly, S. S. (2018). The effectiveness of microlearning to improve students’ learning ability. International Journal of Educational Research Review, 3(3), 32–38. [Google Scholar] [CrossRef]
  22. Murre, J. M. J., & Dros, J. (2015). Replication and analysis of Ebbinghaus’ forgetting curve. PLoS ONE, 10(7), e0120644. [Google Scholar] [CrossRef] [PubMed]
  23. Novak, J. D., & Cañas, A. J. (2008). The theory underlying concept maps and how to construct and use them. Technical Report IHMC CmapTools 2006-01 Rev 01-2008. Florida Institute for Human and Machine Cognition.
  24. Salmon, G. (2011). E-moderating: The key to teaching and learning online. Routledge. [Google Scholar]
  25. Schön, D. A. (1983). The reflective practitioner: How professionals think in action. Basic Books. [Google Scholar]
  26. Shail, M. S. (2019). Using micro-learning on mobile applications to increase knowledge retention and work performance: A review of literature. Cureus, 11(8), e5307. [Google Scholar] [CrossRef] [PubMed]
  27. Siemens, G. (2005). Connectivism: A learning theory for the digital age. International Journal of Instructional Technology and Distance Learning, 2(1), 3–10. [Google Scholar]
  28. Singh, V. (2024). Architectural visualization: Bridging imagination and reality. Journal of Architectural Engineering Technology, 13(3), 388. [Google Scholar]
  29. Slimani, M., & Znazen, H. (2015). Effects of mental fatigue on brain activity and cognitive performance: A magnetoencephalography study. Anatomy & Physiology, 5(S4), 002. [Google Scholar] [CrossRef]
  30. Slimani, M., & Znazen, H. (2018). The effect of mental fatigue on cognitive and aerobic performance in adolescent active endurance athletes: Insights from a randomized counterbalanced, cross-over trial. Journal of Clinical Medicine, 7(12), 510. [Google Scholar] [CrossRef] [PubMed]
  31. Thalheimer, W. (2017, January 13). Definition of microlearning. Work-learning research. Available online: https://www.worklearning.com/2017/01/13/definition-of-microlearning/ (accessed on 5 May 2025).
  32. Tipton, S. (2017, July 17). Microlearning: The misunderstood buzzword. Learning rebels. Available online: https://www.learningrebels.com/2017/07/17/microlearning-the-misunderstood-buzzword/ (accessed on 5 May 2025).
  33. Torgerson, C., & Iannone, S. (2020). Designing microlearning (pp. 2–13). Association for Talent Development. [Google Scholar]
  34. Ucha.se. (2025). Урoците на разбираем и интересен език [Lessons in understandable and interesting language]. Available online: https://ucha.se/ (accessed on 28 July 2025).
  35. Wang, X., & Schnabel, M. A. (Eds.). (2009). Mixed reality in architecture, design and construction. Springer. [Google Scholar]
  36. Zlatanova-Pazheva, E. (2024). The digital generations Z and Alpha in Bulgaria. The International Journal of Engineering and Science (IJES), 13(6), 136–141. [Google Scholar]
Figure 1. Overview of the research design and experimental procedure.
Education 15 01105 g001
Scheme 1. Responses to the question “Do you believe that the integration of short digital learning modules into traditional teaching methods would improve the quality of education in higher education institutions?”.
Education 15 01105 sch001
Scheme 2. Comparison of responses of the three groups to the question ‘To what extent do you comprehend the actions that were demonstrated live/shown in the video?’.
Education 15 01105 sch002
Scheme 3. Comparison of the confidence levels across the three groups regarding their ability to independently repeat the steps demonstrated.
Education 15 01105 sch003
Scheme 4. Comparison of the responses from the three groups to the question ‘Do you believe the video/demonstration is sufficient for independent completion of the task?’.
Education 15 01105 sch004
Scheme 5. Comparison of the responses from the three groups to the question ‘How would you evaluate your overall sense of understanding of the material?’.
Education 15 01105 sch005
Scheme 6. Comparison of the responses from the three groups to the question ‘Which type of demonstration would you prefer in the future?’.
Education 15 01105 sch006
Table 1. Distribution of practical task scores across three categories by group.
GroupCategory ACategory BCategory CTotal
Group 1—Live Demonstration26513
Group 2—Video Demonstration56415
Group 3—Combined Method94114
Total16161042
Table 2. Distribution of practical task scores across two categories.
GroupCategory A+B (Successful)Category C
(Unsuccessful)
Total
Group 1—Live Demonstration8513
Group 2—Video Demonstration11415
Group 3—Combined Method13114
Total321042
Disclaimer/Publisher’s Note: The statements, opinions and data contained in all publications are solely those of the individual author(s) and contributor(s) and not of MDPI and/or the editor(s). MDPI and/or the editor(s) disclaim responsibility for any injury to people or property resulting from any ideas, methods, instructions or products referred to in the content.