Article

Capturing the Complex: An Intraindividual Temporal Network Analysis of Learning Resource Regulation

by
Bettina Harder
1,*,
Nick Naujoks-Schober
1,2 and
Manuel D. S. Hopp
3
1
Department of Psychology, Friedrich-Alexander Universität Erlangen-Nürnberg, 90478 Nürnberg, Germany
2
Faculty of Media, Ansbach University of Applied Sciences, 91522 Ansbach, Germany
3
Hector Research Institute of Education Sciences and Psychology, University of Tübingen, 72072 Tübingen, Germany
*
Author to whom correspondence should be addressed.
Educ. Sci. 2025, 15(6), 728; https://doi.org/10.3390/educsci15060728
Submission received: 17 April 2025 / Revised: 3 June 2025 / Accepted: 6 June 2025 / Published: 10 June 2025
(This article belongs to the Special Issue Innovative Approaches to Understanding Student Learning)

Abstract

:
Understanding a learner’s resources as a system of interacting components, the success of a learning process is determined by the effectiveness of their interactions. Theoretical assumptions and empirical findings clearly show the importance of resource availability in learning systems but do not sufficiently consider the individuality or the temporal and situational aspects of resource regulation. Therefore, the current study addresses the complex interplay between learning resources (educational and learning capitals) in an individual learner (N = 1) by utilizing multivariate time series data of a 50-day vocabulary learning process with daily assessments of learning resource availability, performance, learning duration, and stress. We draw on methods of psychometric network analysis, modeling all variables in simultaneous interaction and allowing predictions between all variables from measuring point to measuring point (temporal dynamics). Specifically, using a Graphical Vector Autoregressive (graphicalVAR) model, yielding a contemporaneous and a temporal dynamics network model, we identified pivotal resources in regulating the student’s learning processes and outcomes, including resources with strong connections to other variables, intermediary resources, and resources maintaining the system’s homeostasis. This innovative approach has possible applications as a diagnostic tool that lays the foundation for tailored interventions.

1. Introduction

In education, it has always been a goal to gain a deep understanding of individual learning processes as a basis for tailored and efficient interventions. Advances have been made in this direction, especially in the fields of self-regulated learning (Panadero, 2017) and talent development (Ziegler & Stoeger, 2017, 2019). University students represent a group of learners expected to learn in a self-regulated manner and thus have been studied extensively (Dresel et al., 2015).
Throughout their university studies, students repeatedly encounter challenges. Hadwin et al. (2022) differentiate between cognitive, metacognitive, social–emotional, goal- and time-management-related, and motivational challenges, which students must largely manage independently to succeed academically (Koivuniemi et al., 2017). Cognitive challenges include, for example, understanding a learning task or achieving defined performance goals when retrieving information. Metacognitive challenges arise, for instance, when creating a learning plan for the targeted performance goal. These challenges can occur at various levels. They may relate to a large-scale learning cycle, such as exam preparation or an entire semester (Blasiman et al., 2017). However, Liborius et al. (2019) examined university students’ learning diaries and showed that students had to regulate their resources (e.g., effort) to overcome challenges in their daily learning episodes, such as workload and procrastination tendencies. Therefore, day-to-day challenges and their regulation should be considered in the temporal resolution of learning diagnostics. Theories of self-regulated learning (Dresel et al., 2015; Panadero, 2017; Winne, 2001) highlight the need for resources (also “learning resources”) to be present, interact, and be regulated for students to overcome these challenges and effectively shape their learning process. Boekaerts (2011) states that self-regulation during learning “prevents threat to the self and loss of resources so that one’s well-being is kept within reasonable bounds” (pp. 410–411) and locates resources in her model within the layer of the self, making resources and their regulation a highly individual matter. This is evident, for example, when a student has to harmonize their current individual learning goals, time available, social support, and energy (Ziegler & Phillipson, 2012). Focusing on strategic regulation of these resources, research within the framework of self-regulated learning primarily showed positive relationships between the amount of strategic regulation and academic achievement (for an overview, see Trentepohl et al., 2023; Waldeyer et al., 2022).
However, previous research in this area tends to have a relatively coarse resolution when considering resources and their changes. A large proportion of studies examined the characteristics or regulations of resources independently of specific learning situations, which may favor generic conclusions but, at the same time, does not account for the influences of the current circumstances in which learners act (Rovers et al., 2019). Additionally, there are very few empirical studies on the interactions of resources, and to our knowledge, no publications yet exist on the temporal dynamics of these interactions. As far as we are aware, the only currently available framework that focuses on the interconnectedness between a learner’s resources and that allows for an examination of the different levels of temporal resolution is the systemic view of the Actiotope Model of Giftedness (Ziegler, 2005).

1.1. Systemic Framework and the Theory of Educational and Learning Capitals

The Actiotope Model of Giftedness (Ziegler, 2005) provides a systemic framework to understand learning and development in general, not only in gifted individuals or specific contexts. At the same time, it is holistic and precise enough to operationalize the proposed concepts. It regards all actions and achievements (system output) as the result of a complex interaction between an individual and their environment (processing within the system). Ideally, the learner has particular abilities, goals, and experience in the domain. At the same time, the environment sets standards for evaluating performance and offers various forms of support during the learning process. To engage in these interactions, overcome challenges, and progress, the learning system needs a constant supply of resources (system input) that must be regulated on various levels, ensuring an effective interplay (Ziegler & Stoeger, 2019). Ziegler and Baker (2013) conceptualized resources in ten functionally necessary forms of exogenous resources provided by the environment and endogenous resources within the individual. They are named educational and learning capitals, respectively, with the categories of economic, infrastructural, cultural, didactic, and social educational capital as environmental resources and organismic, actional, telic, episodic, and attentional learning capital as individual resources (definitions and examples are provided in Table 1). Both forms, educational and learning capitals, can be relatively stable (e.g., good health, goals, and financial support) or fluctuating over time (e.g., unstable health conditions, depending on tips as a waiter or waitress, and accumulating experience and knowledge). Each learner holds specific personal and environmental resources that may also depend on the subjective interpretation, for instance, of cultural norms. Hence, educational and learning capitals serve to analyze individual systems with their processes of stabilization and modification.
A considerable body of research has shown that the educational and learning capitals a learner perceives to possess or has access to represent a useful concept in predicting achievement across various learning and performance settings (e.g., sports training, school and university students, and career progress), skill levels (e.g., primary and secondary school math and language competences, specific competences at the university level, and internationally renowned experts), domains (e.g., performance in school or university subjects, musical performance, sports, and chess), and age groups (e.g., Debatin et al., 2015; Harder et al., 2018, 2015; Mendl et al., 2021; Paz-Baruch, 2015, 2017, 2020; Reutlinger et al., 2020; Veas et al., 2018; Vladut et al., 2013, 2015; Ziegler et al., 2012, 2019). For an overview, see Ziegler et al. (2017). At the same time, the model offers a causal mechanism for how the system develops towards competence (Phillipson et al., 2023; Ziegler & Stoeger, 2017). Resources fuel the system by enabling learners to act according to their goals. Students facing problems regarding concentration at home may use their infrastructural capital and change their learning environment to the next library. Additionally, these resources interact in manifold ways to enable learning episode by episode towards higher competence levels.
However, two problems remain. First, the mentioned studies operationalized only a part of the theory, namely, the degree of positive manifestations of educational and learning capitals or the perceived amount of capital available to or used by the learner. Their interplay has only been considered in general in the sense of high correlations between all capitals, bespeaking the holistic and systemic conceptualization, or by mediation analyses. The latter have shown that educational capital unfolds its effects mainly through learning capital, i.e., the learner must use those resources (Paz-Baruch, 2020; Veas et al., 2018; Vladut et al., 2016). The regulation of single capitals in specific learning situations, on the other hand, has been widely disregarded. Ziegler and Stoeger (2017) cautioned that the systemic nature assumed in the model is not amenable to empirical testing without further theoretical specifications. The reasons for this lie in the complexity assumed in the systemic framework: regulation can take many forms. Ziegler and Stoeger (2019) raise nine dimensions of regulating a learning system, each comprising several aspects. Furthermore, regulation is difficult to assess, even if we capture the crucial mechanisms, because many of these regulatory processes happen beyond our awareness, especially among learning capitals (e.g., Bargh & Chartrand, 1999; Burnette et al., 2013). They are also difficult to model with standard statistical procedures due to high interrelatedness and non-linear behavior (Phillipson et al., 2023).
Second, self-regulation in learning must be assumed to follow highly individual patterns of resource acquisition and use to overcome individual combinations of challenges (Boekaerts, 2011; Koivuniemi et al., 2017). Using open-ended questions, Koivuniemi et al. (2017) categorized challenges experienced by first-year university students during their studies. Interestingly, they found significant differences regarding the extent of experienced challenges based on students’ ability for self-regulated learning, such as the use of attention control strategies. Capital expressions already differ essentially between individuals, with everyone having different social networks to rely on, different abilities, or different goals and goal conflicts. Considering that having resources at one’s disposal does not necessarily result in their usage (Harder, 2025) and the manifold interaction possibilities between two or more resources (Phillipson et al., 2023; Ziegler & Stoeger, 2019), creating an individual regulatory pattern increases variability between learners drastically.
Based on these findings, Meier (2023) made a first attempt to analyze the interplay between single educational and learning capitals in three qualitative interview studies, differentiating three forms of interaction: the accelerative, destructive, and compensatory regulation between two capitals (Ziegler & Stoeger, 2019). Generalizing her findings across individuals, she confirmed the mediating role of learning capital and identified didactic capital as being primarily involved in accelerative and destructive regulations. Consistent with a second qualitative study by Stemmer (2020), Meier identified social capital as an essential system parameter for compensatory regulation. However, gaining a clear yet detailed and comprehensive understanding of how the learner’s system functions remains an open challenge.

1.2. New Approaches to Capture Systemic Interplay

Various research fields have encountered the problem of accounting for systems’ individuality and complexity, providing some guidelines that have been adopted for analyzing learning systems lately. In disciplines like biology or medicine, systems’ ability to adapt to environmental challenges has been modeled on the meta-level using correlation adaptometry (Sedov et al., 1988; Tyukina, 2022). Although measures of the system components (e.g., levels of specific nutrients in plants) did not show any group differences between healthy and unhealthy systems, on the meta-level, i.e., on the level of these components’ correlations and variances, different patterns emerged consistently (Gorban et al., 2010): systems under pressure or stress (e.g., students facing challenges in their learning process) display increased correlations among the system components (e.g., their resources) and increased variances—the system orchestrates the regulation of its components. When the system manages to regulate itself, both parameters decrease again. If it cannot regulate itself, correlations decrease while variances increase, ordered regulation is lost, and the system reaches the bottom of the crisis, either recovering later or collapsing. In line with these observations, the law of the minimum has been studied, saying that the scarcest resource determines the borderlines of systems’ adaptivity in terms of stress-coping mechanisms or further talent development (Gorban et al., 2011; Naujoks-Schober et al., 2025; van der Ploeg et al., 1999).
Within the area of learning and talent development, Phillipson et al. (2023) developed another approach. The complexity of system regulation can only be modeled with appropriate data, leading to diagnostic recommendations, and with modeling techniques that implement (a) the growth of talent over time and (b) all possible interactions between the capitals while also considering non-linear interactions. They conclude that artificial neural networks, requiring extensive data sets, represent an adequate means to receive a proper predictive model mirroring systemic development principles.
Those two approaches already tackle major challenges in modeling the systemic interplay. However, the aspect of individuality remains unaccounted for. The deeper we dive into the details of resource regulation, the more interaction possibilities arise, raising the question of whether we can expect generalizable regulatory patterns (David et al., 2018).
The theory of educational and learning capitals suggests that there might be some general patterns as the capitals adhere to different functions (Ziegler et al., 2017). There are two proto-capitals: organismic capital within the person and economic capital in the environment. These two categories represent resources that cannot be used for learning directly but enable the growth of other capitals or must be transformed into resources conducive to learning. For instance, physical and mental possibilities must be used to create focused learning phases (attentional capital) or to gain experience with a new strategy (episodic capital). Financial means must be invested into usable learning support like books and mentors (didactic capital) or access to a training infrastructure through a membership fee. The fact that these proto-capitals lay the groundwork for many other resources to rise could assign them a central role in regulating the network. Aside from this aspect, we have little reason to believe in general regulatory patterns. On the contrary, the systemic assumption is that the whole learning system is a complex interplay of factors where each change will affect other factors (Ziegler & Phillipson, 2012). Moreover, we know that between-subject effects usually cannot be transferred to intraindividual processes (Fisher et al., 2018; Molenaar, 2004). Thus, we should first analyze individual systems to see whether general patterns emerge and then proceed towards group analyses of complex interactions.
Clinical psychology has developed an answer to this demand during the last few years. Two trends have become evident in psychotherapy: First, there has been a call for personalized psychotherapy to meet a patient’s individual needs (Wright & Woods, 2020). Second, in order to personalize interventions, it has become necessary to model the complex interactions between symptoms and other related factors to understand their dynamics, predict the disorder’s development, and control the effects of treatments. This has resulted in the network theory of psychopathology (Borsboom, 2017) and a growing body of clinical studies (e.g., Borsboom & Cramer, 2013; Cramer & Borsboom, 2015; Cramer et al., 2010; Kroeze et al., 2017). Contrary to the common perspective of a latent disorder creating relatively independent symptoms, this systemic approach identifies a network of interacting symptoms from which a disorder may emerge (Guyon et al., 2017). This can be operationalized through temporal psychometric network analysis for single-subject time series data (Epskamp et al., 2018a), besides many other study designs (for an overview, see Hevey, 2018). The network analysis approach is relatively young in psychometric research but offers broad possibilities for analyzing the systemic interaction of different variables. For example, it has also been implemented in research on personality (Costantini et al., 2015; Mõttus & Allerhand, 2017), health (Harder & May, 2024; Kossakowski et al., 2016), or attitudes (Dalege et al., 2016).

1.3. Study Aims

The current study addresses the desiderata of insights into learning processes with a more fine-grained resolution on same-day and day-to-day influences as well as the consideration of individuality and complexity in the interplay of influential factors. By implementing a diary-based measurement instrument in combination with temporal psychometric network analysis, we assessed the interactions and regulations of one individual’s learning resources over an extended learning process.
The first aim was to unveil the interaction between resources (educational and learning capitals) and outcomes (duration of learning, stress, and performance) during learning episodes. Learning episodes always comprised the same task, learning vocabulary (new words and repeated words); hence, a regulatory pattern should emerge. Recognizing these patterns, especially identifying pivotal capitals in the regulation process, is key to targeted and efficient interventions. Network analysis yields several metrics that identify strongly connected variables that can influence each other and “gatekeeper” variables funneling the information flow in the network. Both sorts of variables are prime candidates for targeted interventions, as they can improve regulation in the whole network successively.
The second aim was to gain insights into the temporal dynamics of this learner’s regulation. To make progress, a learning system needs to orchestrate the interplay of its learning resources throughout the process, either to maintain balance (homeostasis) or to follow a developmental trajectory (homeorhesis). Both processes are necessary (Ziegler & Stoeger, 2019) and can be mirrored in network analyses as negative and positive temporal effects, respectively. Hence, we can expect stable regulative patterns that allow us to predict future resources and learning outcomes. In our study design, temporal resolution is daily (one learning episode plus assessment per day), allowing for predictions from day to day, which is a reasonable expectation (Liborius et al., 2019). However, more short- and long-termed effects can be imagined.
To gain these insights into the individual learning process, we used a graphical vector autoregressive model (graphicalVAR), a novel technique well-suited for analyzing single-case, multivariate time series data (Epskamp, 2017a), which has not been applied to learning processes previously. This innovative approach (Epskamp et al., 2018a) allowed us to model the student’s learning resources, stress, learning duration, and performance not as isolated variables but as an interconnected system or network. Crucially, graphicalVAR distinguishes between two fundamental types of relationships within this system, directly aligning with our research objectives: (1) A contemporaneous network showing simultaneous interactions (partial correlations) between variables within each day, after accounting for the previous day’s influence. This network addresses the first study aim by revealing the interplay during learning episodes and identifying potentially pivotal resources based on their concurrent connections. (2) A temporal network showing directed predictions from one day (t − 1) to the next (t) (lag-1 effects). This network addresses the second study aim by illustrating day-to-day dynamics, including feedback loops (homeostasis/homeorhesis) and predictive relationships indicative of Granger causality (Granger, 1969). Combined, these networks provide a nuanced, systems-level view of the learner’s resource regulation (addressing both study aims), forming the basis for individualized support strategies. Therefore, this article’s perspective is the individual case, which does not allow for drawing generalizable conclusions.

2. Materials and Methods

2.1. Study Design

We set up a single-case time series study to assess individual, multiple interactions between factors influencing learning and learning process indicators. The time series consisted of 50 measurement points, one per day. Measures were taken when the participant engaged in a daily learning episode of the same type, i.e., learning new and rehearsing previously learned vocabulary of a foreign language. The distinction between independent and dependent variables turns blurry from a systemic point of view, as all variables are allowed to interact directly. Over time, a variable can be both cause and effect. Experiencing stress, for example, can cause resources to decrease, but at the same time, it is fueled by low resources. Whether the order of effects can be differentiated depends on the temporal resolution of the measurements. With our temporal resolution of daily assessments, we prefer to view the ten types of educational and learning capitals primarily as independent variables while viewing stress level, duration of the learning session, and the two achievement measures (percentage of correctly recalled new words and repeated words) as focal variables.

2.2. Participant and Procedure

In this single-case study, one 25-year-old German female student in her 7th semester of teacher education studies (main subjects were English as a foreign language and mathematics for secondary school) committed herself to learning the basic vocabulary of a foreign language (Spanish) she had no prior knowledge of. Learning Spanish was unrelated to her university studies or part-time office job. She engaged in a 50-day learning diary study after giving her informed consent. Each day, she first rated her currently available educational and learning capitals and her current stress level. Then, she learned new words and reviewed previously learned words, aiming at a basic vocabulary of 340 words by the end of the study. She learned M = 6.80 new words per day (range 0 to 14 words) and repeated M = 52.44 previously learned words per day (range 0 to 340 words) at approximately the same time throughout the study. After the learning phase, she tested her recall of the newly learned and the repeated words. Thereafter, she noted the test results and the duration of the session in the diary. She took additional notes of exceptional circumstances, like exceptionally high or low capital availability, or events of the day that somehow influenced her learning session.

2.3. Measures

The diary was realized by an Excel sheet, leading the participant through the items to be answered, one row per day. The diary created line graphs of her capital expression and stress, learning duration, and performance measures as feedback to the participant.
Educational and learning capitals were measured with one item per capital, thus resulting in 10 items. For instance, for telic learning capital, the item read, “I have set clear long-term and short-term goals for learning words.” For didactic educational capital, the item read, “I have access to excellent learning possibilities, like a good teacher or mentor, or high-quality learning materials.” Answers were rated on a Likert scale from 1 = not at all true to 9 = totally true.
The current stress level was assessed with one item, “What is your current stress level?”, requiring an answer on a Likert scale from 1 = totally relaxed, over 5 = medium stress, to 9 = totally stressed. Existing studies show an acceptable validity of one-item stress assessments (Elo et al., 2003; Littman et al., 2006; Salminen et al., 2014).
To measure the duration of each learning episode, the participant set a clock when starting to learn and noted the time passed (rounded to whole minutes) when she finished learning before she began the recall tests.
She used index cards to test her recall of new and repeated words, giving the word in her mother tongue on one side (question) and the foreign language on the other (control answer). The participant noted the number of tested words and the number of correctly recalled words. We used the percentage of correctly recalled new and repeated words for the analyses.

2.4. Data Analyses

2.4.1. Data Preprocessing

The time series contained six missing values among the recall test performances, which were not missing at random. Therefore, we desisted from standard imputation methods (Mansueto et al., 2023) and set the following values. The first value for correctly recalled repeated words was zero; on day one, the participant could not repeat any previously learned words. The value was set to the value of correctly recalled new words for that day. The other five missing values were correctly recalled new words at the end of the time series. The participant had set the goal to learn a predefined basic vocabulary of 340 words and reached that goal on day 45. After that, she only repeated words. The value for correctly recalled new words on the last five days was set to the previous entry’s value of day 45, simulating ongoing learning episodes.
Testing each time series for constant statistical properties over time (stationarity), the Augmented Dickey–Fuller test (ADF; Dickey & Fuller, 1979) and Kwiatkowski Phillips Schmidt and Shin test (KPSS; Kwiatkowski et al., 1992) yielded contradictory results (Table 2), questioning the fulfillment of the precondition. Therefore, every time series was differenced once by subtracting each data point from its preceding value (Montgomery et al., 2015), resulting in stationary data according to both tests (Table 2).

2.4.2. Network Estimation Using Graphical Vector Autoregression (graphicalVAR)

To model the intraindividual system of learning resources, stress, duration, and performance over the 50 days, we utilized the Graphical Vector Autoregression (graphicalVAR) approach (Epskamp et al., 2018b), implemented in R version 4.4.2 (R Core Team, 2024) via the graphicalVAR package (Epskamp, 2017a). This method is designed explicitly for multivariate time series data from a single individual (N = 1) and combines two modeling traditions: Vector Autoregression (VAR) and Gaussian Graphical Models (GGM).
First, the VAR component addresses the temporal dependencies in the data. It estimates how well each variable at time t can be predicted by all variables (including itself) at the preceding time point, t − 1. This yields a temporal network, which is a directed network where edges represent the strength of prediction from one variable on day t − 1 to another variable on day t, controlling for all other variables at t − 1. These directed relationships satisfy the temporal precedence condition for causality and are often interpreted as indicating Granger causality (Granger, 1969)—meaning one variable’s past values help predict another’s future values beyond the predictive power of the second variable’s own past.
Second, the GGM component analyzes the relationships within a single time point, after accounting for the day-to-day predictive effects captured by the VAR model. Specifically, it examines the residuals of the VAR model—the information not explained by the previous day’s state. This yields a contemporaneous network: an undirected graph where edges represent partial correlations between variables at time t. An edge indicates a linear association between two variables within the same day, controlling for all other variables at time t and the statistical influence from t − 1. This network is crucial, as it captures the simultaneous interplay and co-fluctuations, potentially reflecting regulatory processes that occur much faster than the day-to-day lag interval (Epskamp et al., 2018a).
To enhance network interpretability and mitigate the inclusion of spurious connections potentially arising from sampling variability, we employed LASSO (Least Absolute Shrinkage and Selection Operator) regularization (Tibshirani, 1996). This technique penalizes model complexity during estimation by systematically shrinking parameter estimates associated with network edges. A key feature of LASSO is its ability to shrink estimates for weak or unstable connections precisely to zero, effectively performing automated model selection and resulting in sparser, more parsimonious network structures. The degree of shrinkage is determined by a tuning parameter (λ), which requires careful selection. We utilized the Extended Bayesian Information Criterion (EBIC; Foygel & Drton, 2010) to identify the optimal λ, as EBIC balances the model’s goodness-of-fit with model parsimony. Consistent with recommendations for exploratory network analysis (Epskamp, 2017b), we set the EBIC hyperparameter gamma to 0 (γ = 0, equivalent to standard BIC). This choice prioritizes sensitivity for detecting potential regulatory relationships over achieving maximal sparsity, aligning with the exploratory nature of our investigation.
To identify influential nodes within the estimated networks, we calculated centrality metrics, specifically, strength (including in-strength and out-strength for directed networks) and betweenness centrality (Opsahl et al., 2010).
Strength centrality quantifies a node’s overall level of direct connection or involvement in the network, which is calculated as the sum of the absolute weights of all edges connected to it. In the directed temporal network, this distinguishes between in-strength (the sum of weights of incoming edges, reflecting the total strength of prediction towards the node from other nodes at the previous time point) and out-strength (the sum of weights of outgoing edges, reflecting the total strength of prediction from the node towards other nodes at the next time point). As the contemporaneous network is undirected, only a single combined strength measure is calculated. For example, performance may have high strength centrality in the contemporaneous network and is positively connected to three resource variables (concentration, strategy use, and clear goals). This means that these three resources and performance covary strongly during a learning episode, such that increasing the resource variables will likely increase performance, and possibly vice versa, as the connections are not causally directed (successful performance could also enhance concentration and reinforce strategy use and goal setting). In the temporal network, performance could have high in-strength, positively depending on two resources (e.g., health and goals). This means that when these two resources are depleted on one day (catching a cold and resigning from learning goals), performance will decrease the next day. The out-strength of performance could be low, meaning that it does not influence resources on the next day. They might be independent of performance (like available infrastructure that remains constant), or the effects of performance on resources may occur immediately (like tiredness directly after performing) or in the long run (exhausted resources after prolonged periods of performance) rather than from one day to the next.
Betweenness centrality, in contrast, identifies nodes that act as crucial intermediaries or bridges. It measures how frequently a node lies on the shortest weighted path between other pairs of nodes in the network. Nodes exhibiting high betweenness often function as “gatekeepers” (Freeman, 1977; Gursakal & Bozkurt, 2017), suggesting their importance as potential intermediaries connecting different parts of the learning system. Such nodes could represent critical bottlenecks impacting resource regulation and system development, consistent with concepts like the law of the minimum (Naujoks-Schober et al., 2025). For instance, health may be a gatekeeper, standing between performance and stress on one side and critical learning resources on the other. Learning resources can only lead to good performance and minimal stress when the individual feels healthy and energized enough to utilize them effectively. If health deteriorates, the learning process may be curtailed, as the bottleneck determines the system’s possibilities.

3. Results

3.1. Description of System Dynamics

3.1.1. Learning Capital

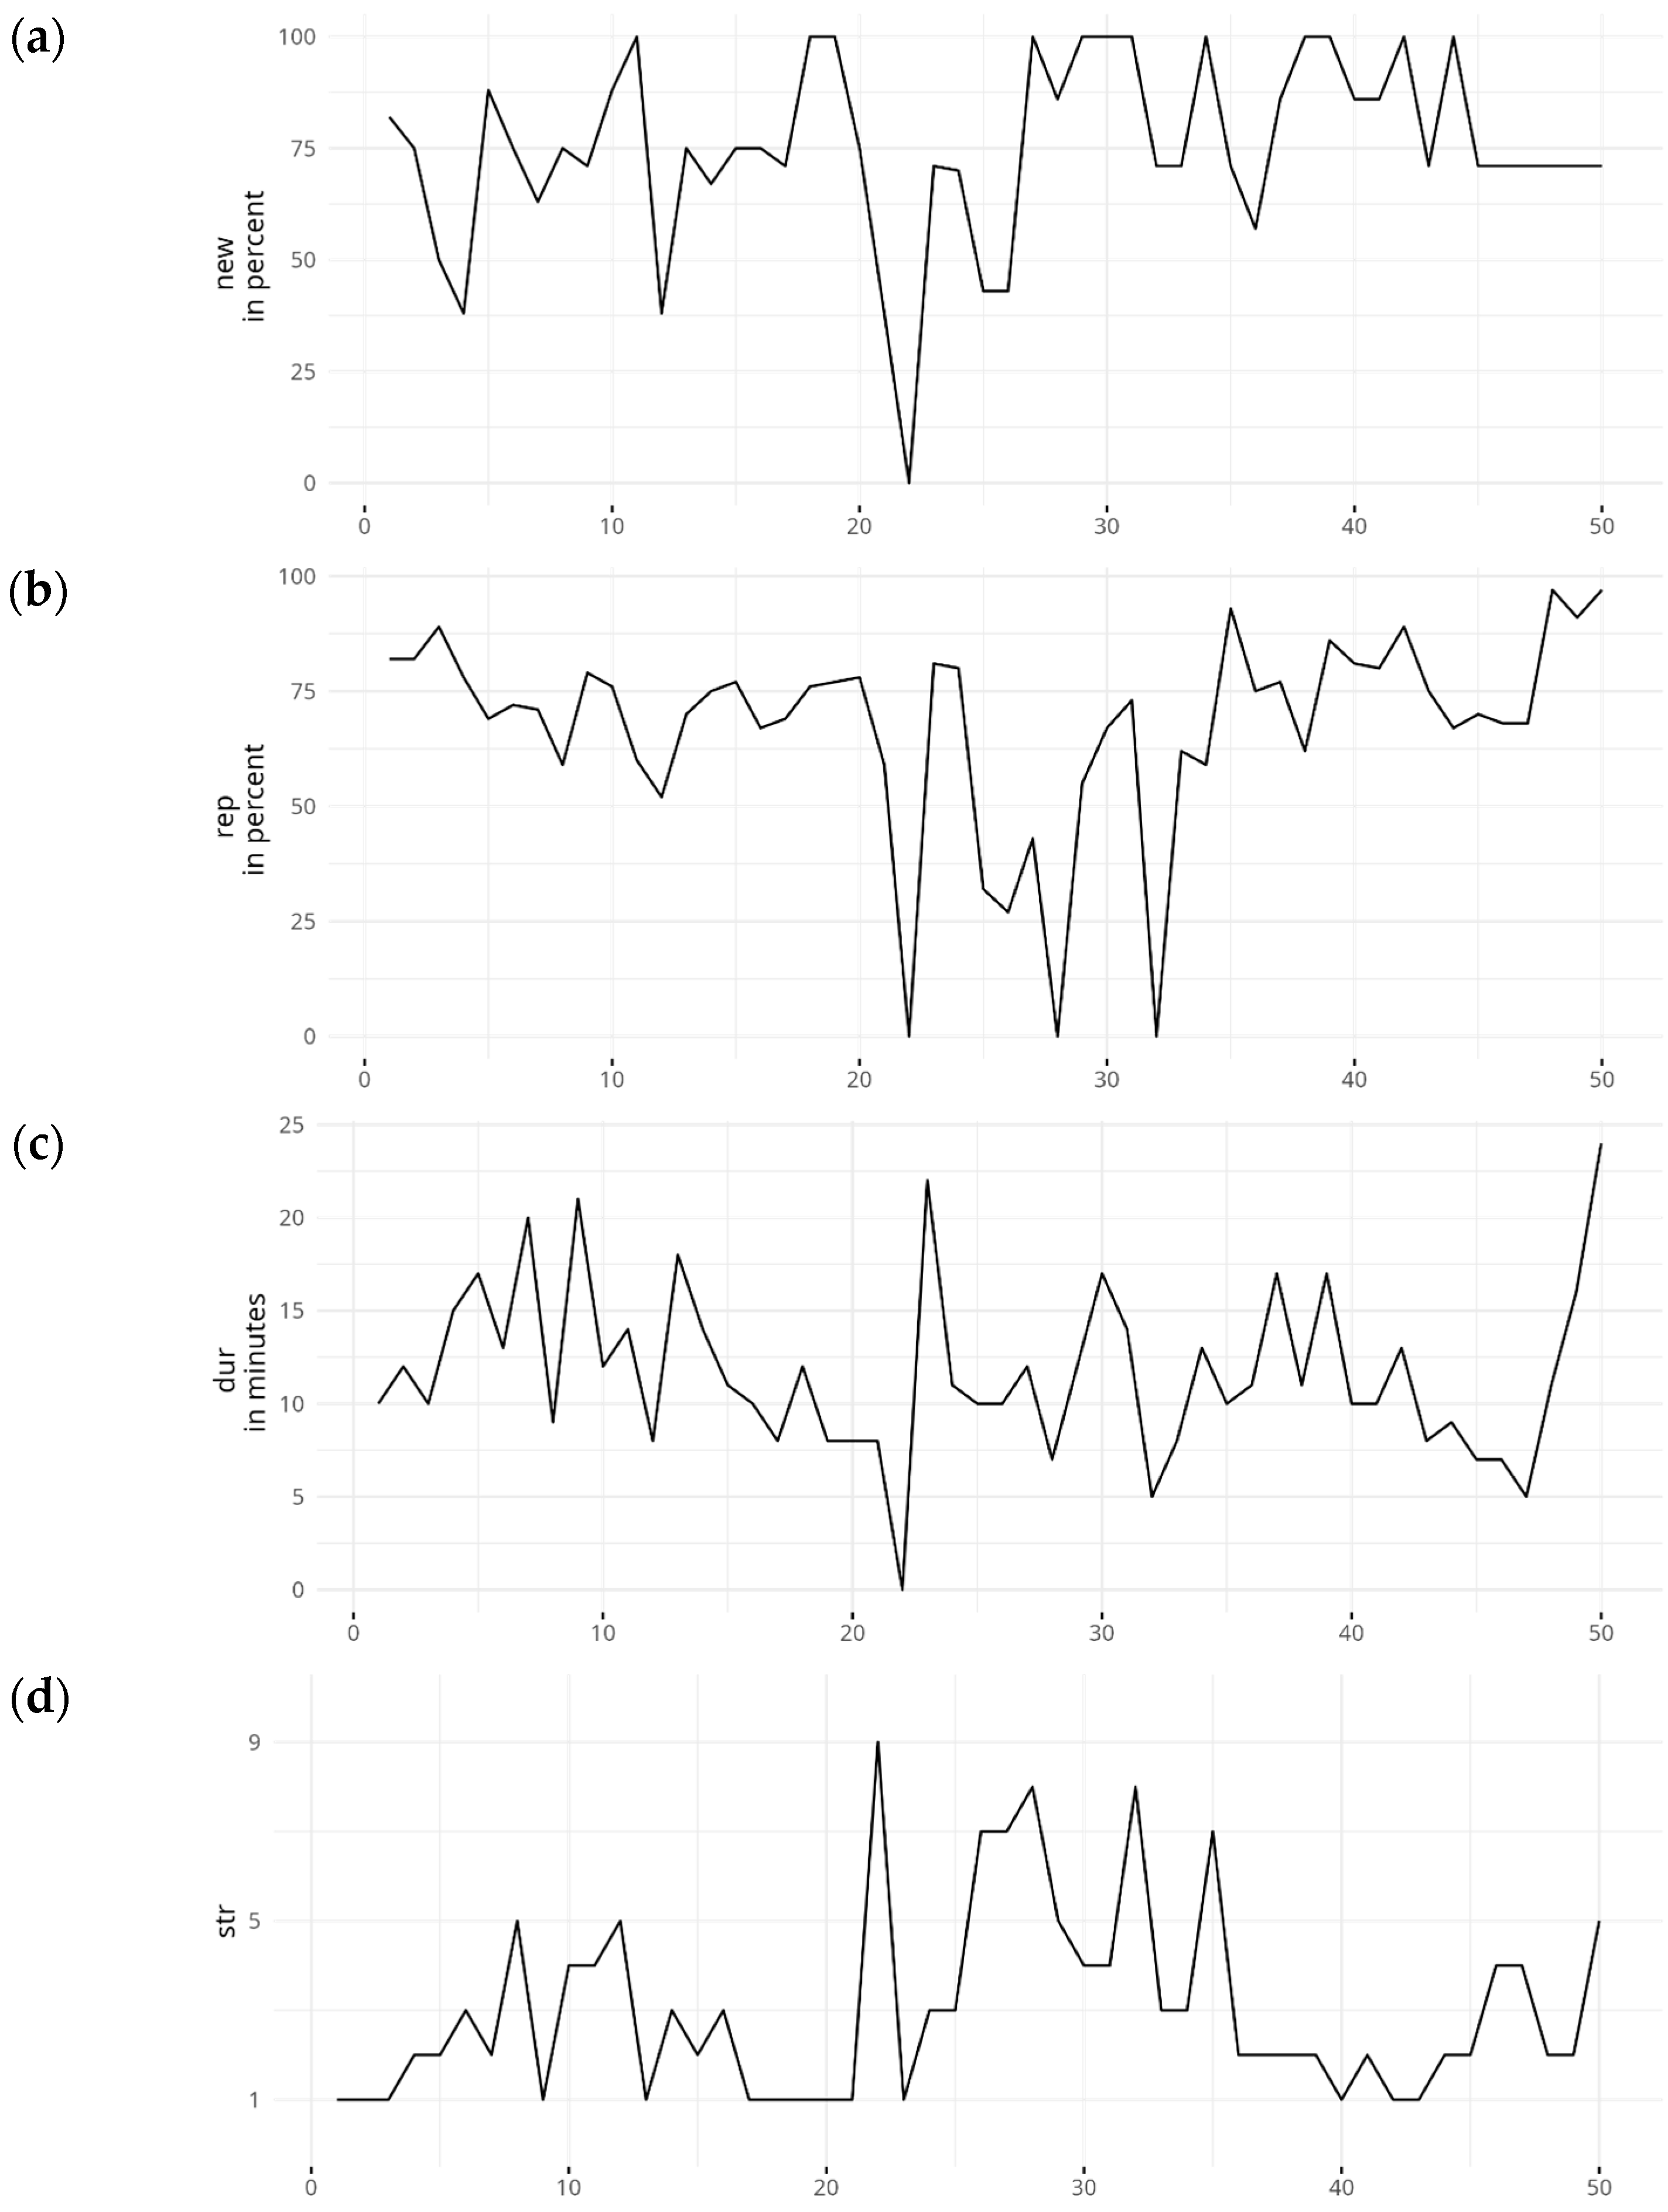
Figure 1 shows the time series of all educational and learning capitals, starting with learning capitals. While actional, episodic, and telic learning capital mostly stay within the upper range of the scale, organismic and attentional learning capital were more dynamic and often changed in parallel. We find some days with extremely low values for organismic and attentional learning capital (days 22, 25, 28, 32, and 47 and relatively low levels on days 12 and 17). The participant’s notes unveil that organismic capital was low when she felt sick or was exhausted from other demanding tasks. This was associated with little focus on her learning activities (attentional capital) and lower learning outcomes (see Figure 2a,b). High values in attentional capital (e.g., days 1 to 3, 9, 19, and 39) correspond to days when she reported having no other things to do (being on vacation and free days) or when she slightly moved her learning time window to an earlier time (also lower stress levels on these days; see Figure 2d). The drop in actional and telic capital towards the end of the study is interesting (days 45 and 46). The participant reported that she had reached her goal of learning 340 new words and had to change her strategies as well as her daily goals: she started repeating more and more of the vocabulary visible in the increasing duration of learning episodes (Figure 2c) and the absolute numbers of repeated words (up to 215 and 340 the last two days).

3.1.2. Educational Capital

The participant reported relatively stable economic and cultural educational capital. Although her environment constantly exhibited a positive attitude towards her learning endeavors, her social educational capital varied with low values on days 22 and 28. On these days, her friends and work tasks required her full attention, thereby jeopardizing her learning conditions (also high stress levels and no learning episode on day 22; see Figure 2c,d). The lines for infrastructural and didactic educational capital show the most striking dynamics, with low values on days 17 and 22 and on days 25 and 28 only for infrastructural capital. On these days, she was on a plane, on a boat, or on the road, neither finding a suitable learning environment nor profiting from her didactically well-designed learning possibilities. Consequently, she also assigned minimal values to attentional and organismic learning capital on these days. Interestingly, infrastructural capital did not suffer from low organismic or attentional learning capital on other occasions, pointing to a one-directional effect. On days 20 and 21, the participant was in Spain, explaining her maximum ratings for didactic educational capital.

3.1.3. Performance, Duration, and Stress Level

Figure 2a–d display the participant’s retrieval performance (correctly recalled new and repeated vocabulary), duration of the learning session, and daily stress level, yielding parallels to the educational and learning capital dynamics. Achievement minima, the shortest learning sessions, and higher stress levels coincide with the three notable days in terms of low organismic, attentional, infrastructural, and didactic capital (days 22, 28, and 32). Correctly recalled repeated words shows more extreme breakdowns than retrieval performance for new words. The participant was keen on sticking to her schedule for learning all 340 new words, prioritizing learning new words over revisiting old words when conditions required her to shorten the learning session. She showed increased stress levels from day 22 to 35, which traces back to higher demands at work and university during this phase.

3.2. Network Analyses

After this descriptive impression of the ups and downs the participant experienced, the network analyses allowed us to quantify the emerging patterns of interaction between all variables.

3.2.1. Regulation Within Learning Episodes—Contemporaneous Network

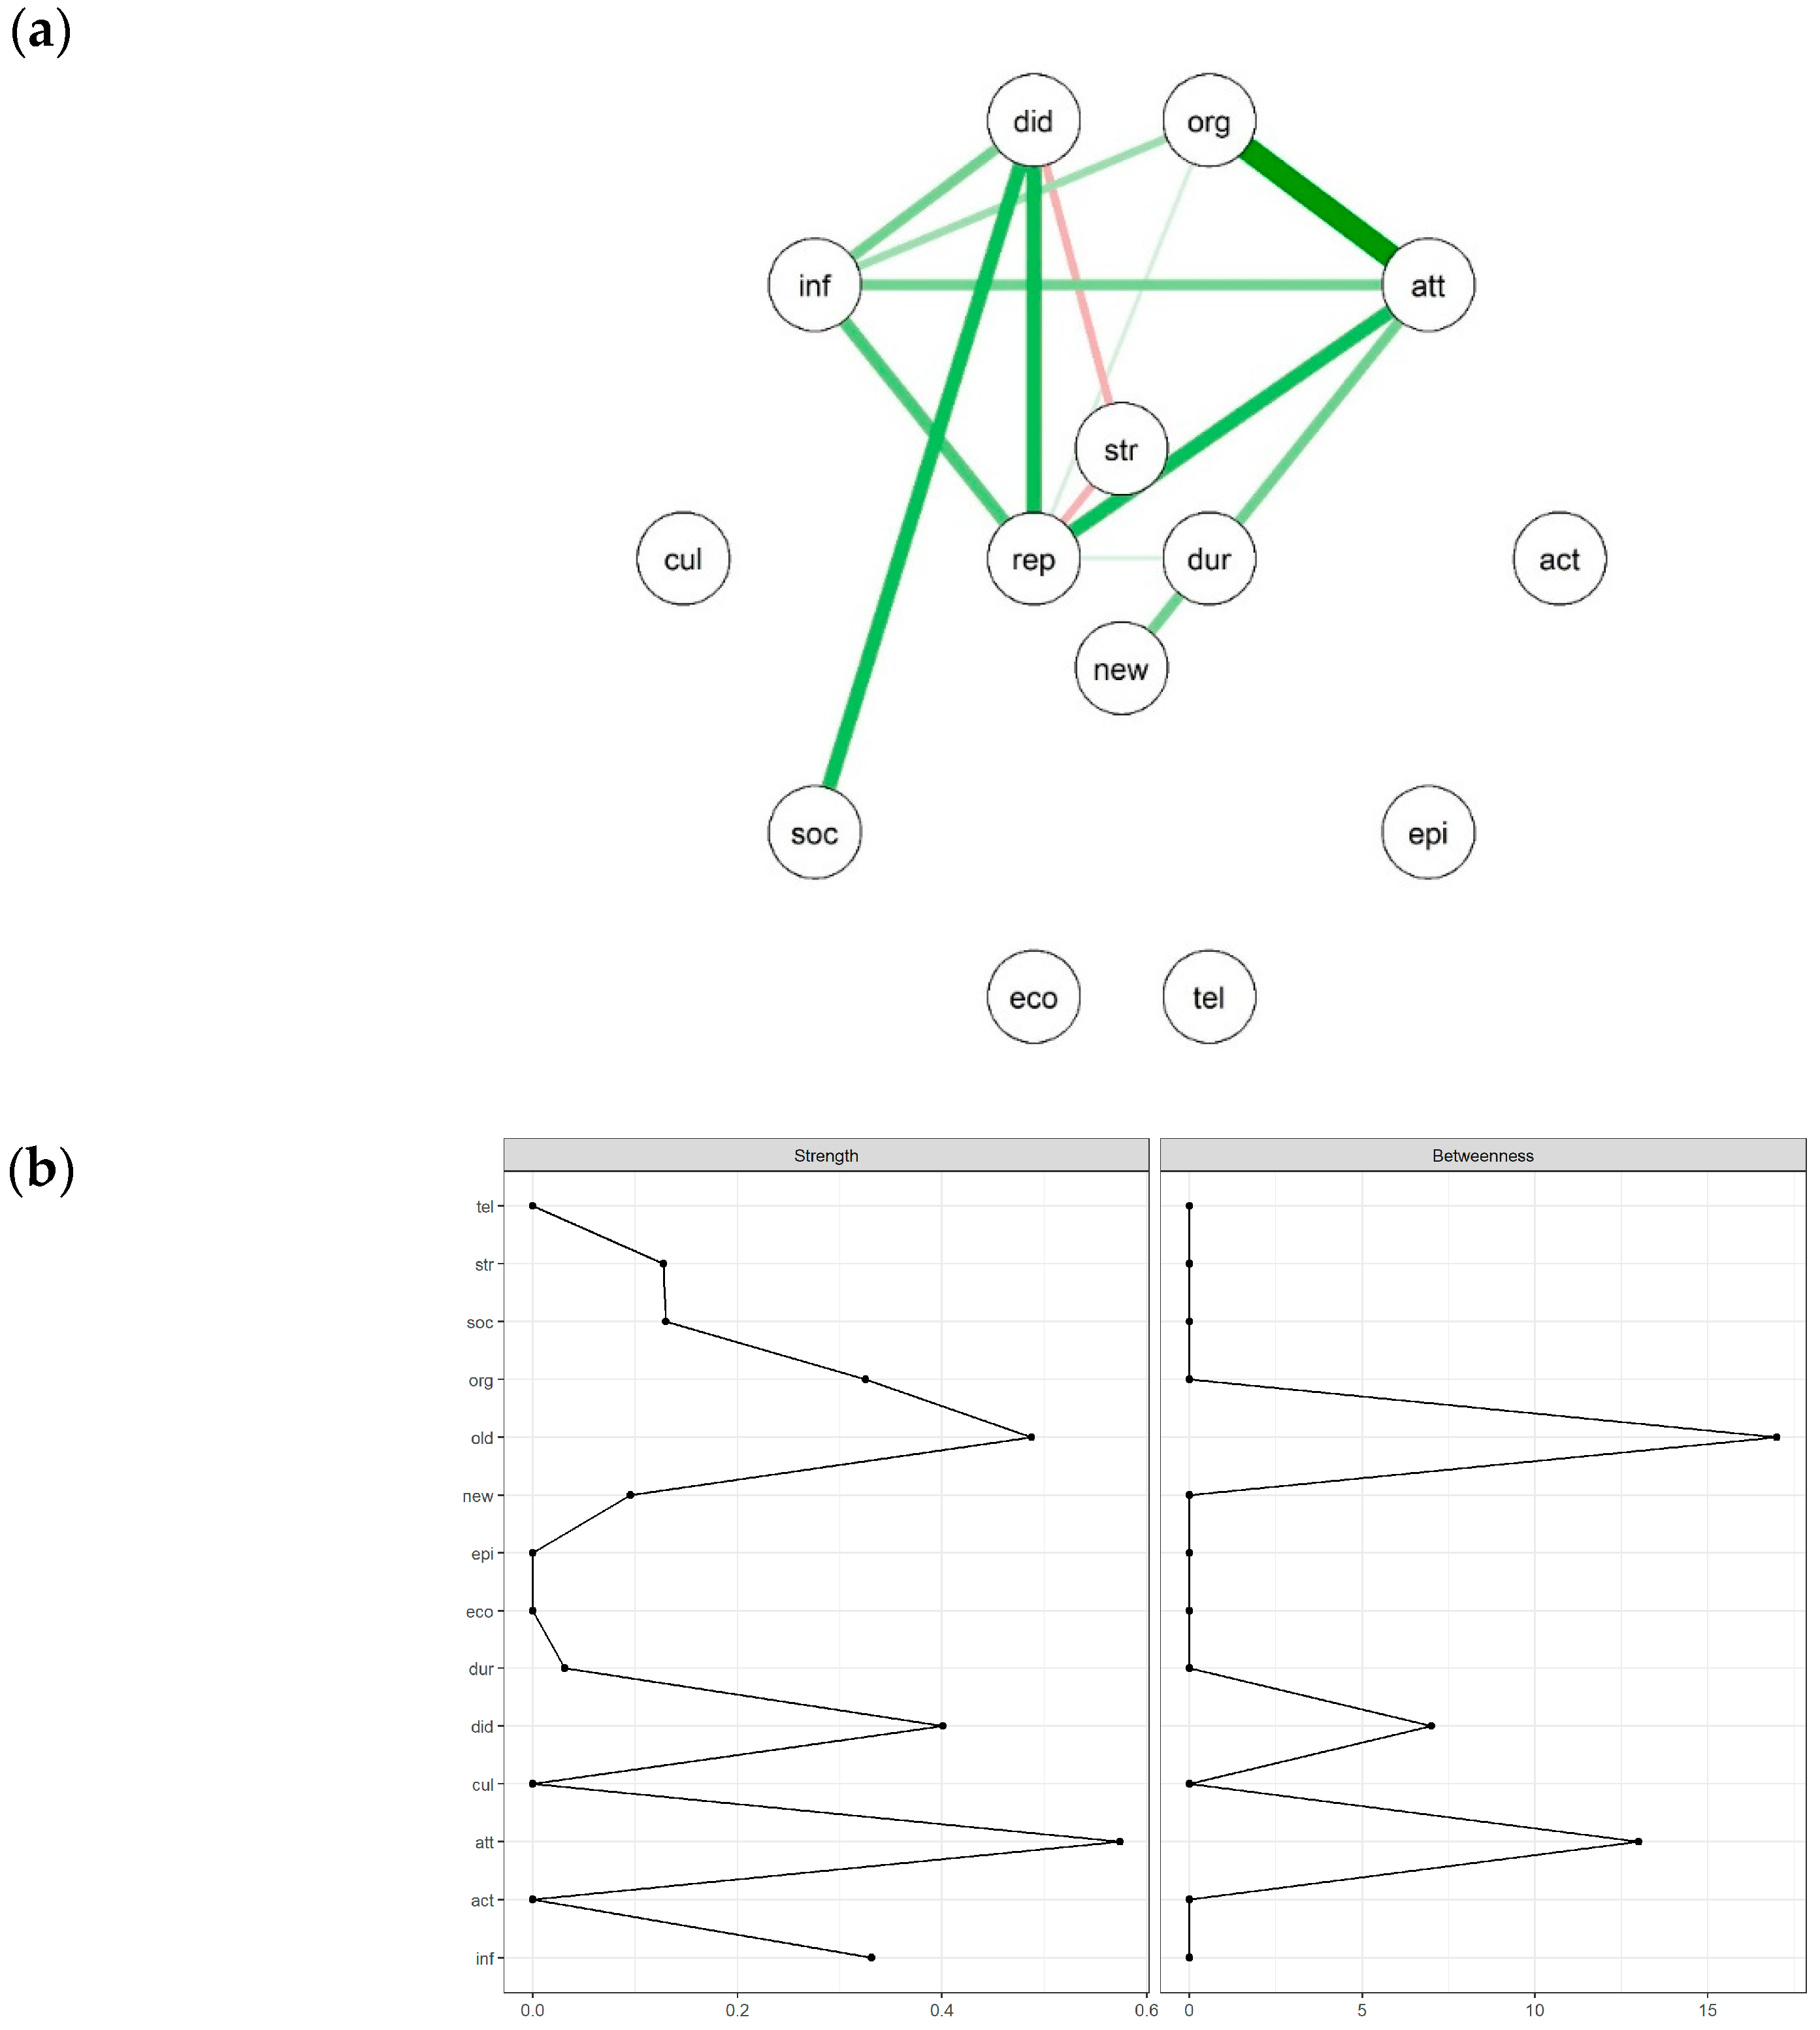
We first examined the contemporaneous network (Figure 3a), which reveals the consistent patterns of interplay between variables within the same day’s learning episode after accounting for predictions from the previous day. Not all capitals were directly related in this within-day network. However, a core group of variables showed strong positive partial correlations (green edges in Figure 3a), indicating that they tended to fluctuate together simultaneously: organismic, attentional, didactic, and infrastructural capital. Performance on repeated words is also strongly positively linked within this group, particularly to attentional, didactic, and infrastructural capital. Conversely, stress level shows negative partial correlations (red edges) with didactic educational capital and performance on repeated words.
To identify the most influential nodes in this simultaneous interplay, we examined centrality metrics (Figure 3b). According to overall strength, attentional learning capital is the most central variable in the network, suggesting that it has the strongest overall simultaneous connections to other variables. It is followed by correctly recalled repeated words and didactic, infrastructural, and organismic capital. This indicates that fluctuations in these specific variables were most strongly associated with simultaneous fluctuations in other system components.
Betweenness centrality points out nodes acting as potential intermediaries or “gatekeepers” in the network. In this network, correctly recalled repeated words had the highest betweenness centrality. As this is a focal outcome variable, this high betweenness likely reflects its position as a central hub connected to several key resources (didactic, infrastructural, and attentional capital) rather than primarily serving as a structural bridge between these resources. Attentional and didactic capital also show high betweenness centrality, positioning them as potentially crucial mediators that could facilitate or impede the rapid, within-day regulation of the learning system, depending on their state.

3.2.2. Temporal Dynamics—Directed Temporal Network

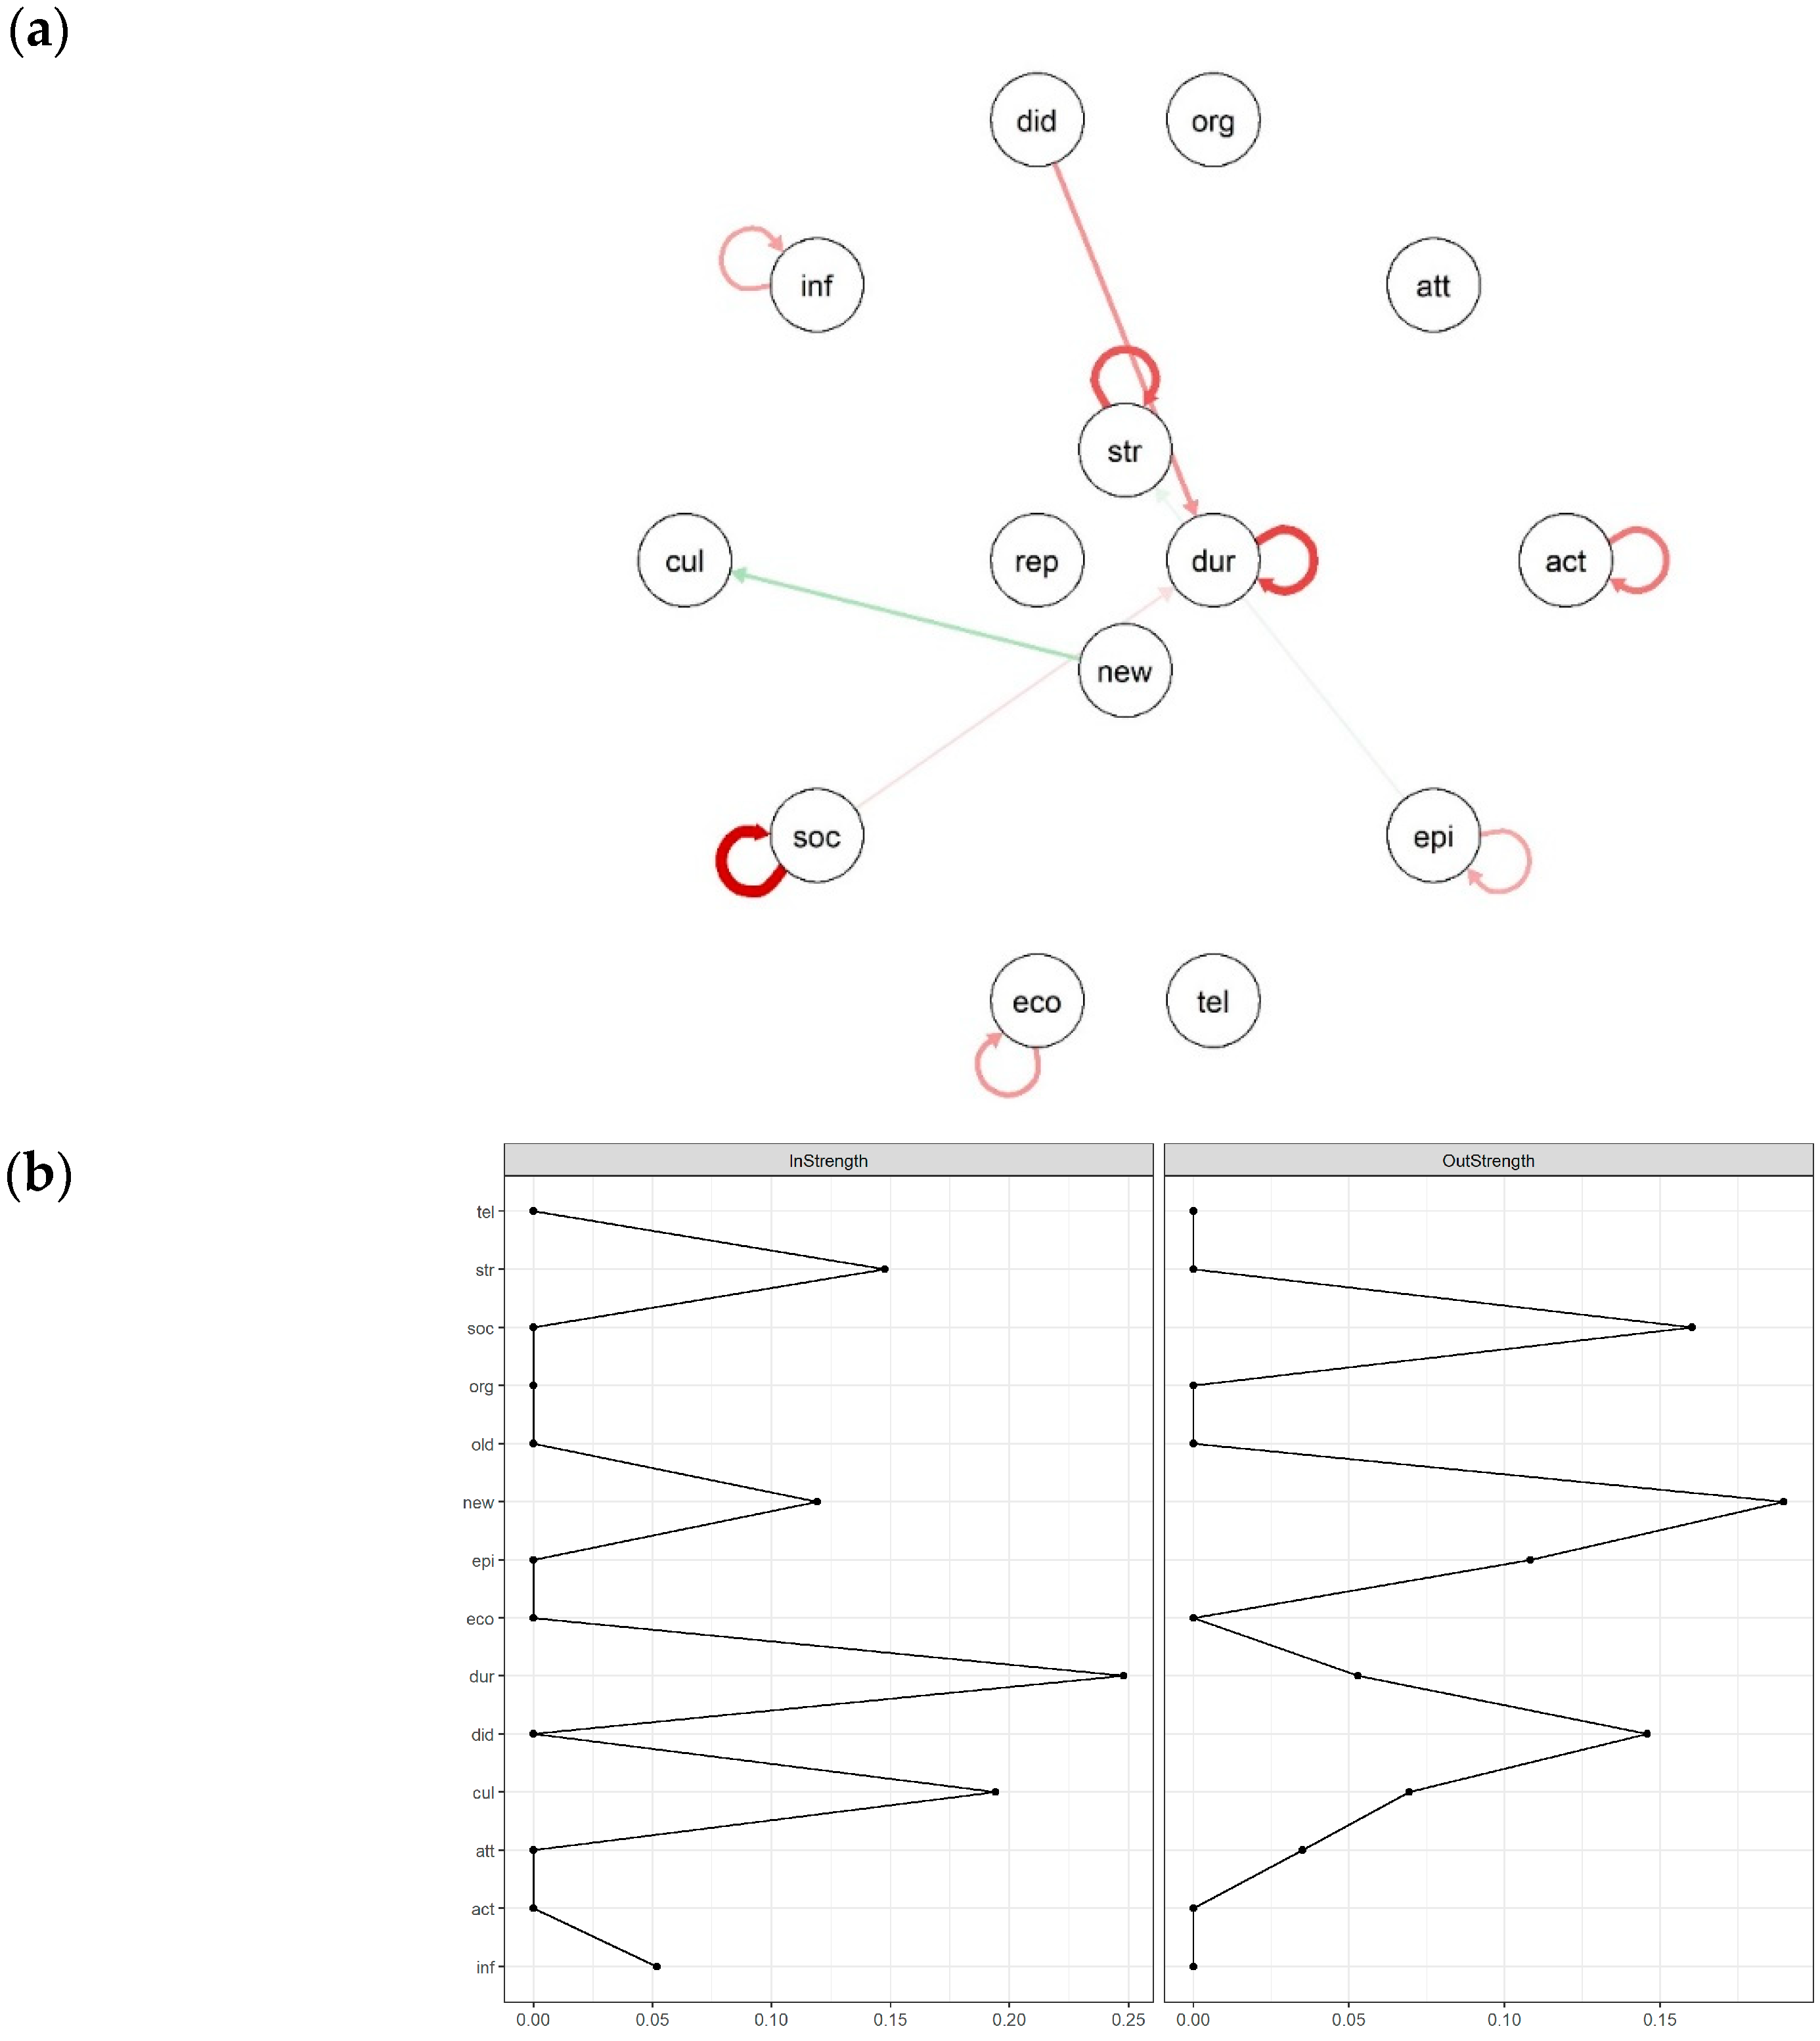
Turning to the temporal network (Figure 4a), we examined the directed predictive relationships from one day (t − 1) to the next (t). The connections shown in the temporal partial correlations network (Figure 4a) are specifically temporal and incremental relationships, above and beyond any same-day correlations. The temporal network is very sparse, featuring only seven autoregressive effects (loops from a node back to itself) and four cross effects (edges between different nodes). This sparsity suggests that strong, direct predictive influences between different variables from one day to the next might be limited or unstable for this learner. Consistent with the stronger connectedness in the contemporaneous network and theoretical assumptions (e.g., Ziegler & Baker, 2013; Ziegler & Stoeger, 2019), this supports the interpretation that many regulatory processes likely occur rapidly within learning episodes based on current conditions rather than primarily unfolding across days.
The negative autoregressive loops (red loops in Figure 4a) for actional, episodic, economic, social, and infrastructural capital indicate homeostatic self-regulation. This means that high values on one day predicted lower values on the next, and vice versa, suggesting these resources tended to stabilize around a mean level over time. Notably, organismic, attentional, telic, and didactic capital did not show significant autoregressive effects, implying their levels were less predictable based solely on their own state the previous day.
For the cross effects, Figure 4b provides centrality indices (autoregressive effects are not included in centrality indices). The duration of the learning episode displayed the highest in-strength, negatively depending on the didactic and social capital of the previous day. This suggests another form of homeostatic regulation: the participant seemingly reduced the learning time following days with high resource availability (good learning opportunities and social support) and increased it following days with lower resource availability.
The other two cross effects were positive partial correlations (green arrows), potentially indicating escalating effects to positive or negative states (homoerhesis). High achievements in extending the participant’s vocabulary with new words were followed by more positive attitudes in her environment the next day (cultural capital). Additionally, high episodic capital weakly predicted increased stress the next day. Given the lack of a clear theoretical link for the latter, we cautiously interpret this observed association as potentially arising from an unmeasured confounding variable. Betweenness centrality indices all equaled zero, because no path connected more than two nodes in this sparse temporal network.

3.2.3. Summary of Network Findings

In summary, the network analyses provided two views of the system dynamics. The contemporaneous network highlighted strong simultaneous associations within daily learning episodes, particularly involving attentional, didactic, infrastructural, and organismic capital, plus performance on repeated words. Attentional and didactic capital also showed high betweenness centrality, indicating potential mediating roles in these within-day interactions. In contrast, the temporal network revealed fewer direct day-to-day predictions between different variables. Its main features were homeostatic negative autoregressions for several resources (actional, episodic, economic, social, and infrastructural capital), suggesting these tended to stabilize around their mean. A few cross-lagged effects were also present, notably, the prediction of learning duration by prior resource levels.

4. Discussion

This study is one of the first quantitative investigations to longitudinally capture interactions between students’ learning resources in an authentic learning process. The analysis of intraindividual and multivariate time series data using contemporaneous and directed temporal network analyses represents a promising methodological innovation, complementing existing valuable cross-sectional findings on the role of learning resources with detailed and individual information. Given our focus on an individual learning process, this discussion concentrates on the insights obtained with the time series network approach and its possible utilization as a diagnostic tool in student learning progress assessment and coaching.

4.1. Insights into the Regulation of the Learning Process

The fine-grained descriptive examination of the learning process highlights the situational dependency on resource regulation (Rovers et al., 2019). At the level of the entire learning process, the descriptive time series analysis revealed phases that emerged as reactions to various challenges (e.g., illness), confirming extant research. Consistent with findings on the relationships between educational capital, learning capital, and outcome variables (e.g., Harder et al., 2018; Mendl et al., 2021; Paz-Baruch, 2020; Veas et al., 2018), low levels of resources corresponded with lower academic performance and higher stress. However, the time series data also showed that resources did not consistently decrease in response to learning process challenges. Indeed, various patterns of covariation between resources surfaced, indicating that complex regulatory processes were at play.
Moving beyond the descriptive level through network analyses allowed us to quantify the relationships between learning resources from the contemporaneous view of regulations (simultaneous and fast regulations) and the temporal perspective on day-to-day changes, pointing us directly to central variables in the regulatory process.

4.1.1. Contemporaneous Regulation

Initially, it can be noted that after regularizing the networks to delete spurious connections, not all nodes of the networks (resources, stress, and performance) were connected via partial correlations. On the one hand, this simplifies the network for interpretation (parsimony) and, on the other hand, shows that although learning resources are theorized to form an interconnected, comprehensive system, or the learner’s actiotope (Ziegler & Stoeger, 2017), not all of these resources appear to be substantial for this individual learning process. In the case of our participant, attentional and didactic capital played pivotal roles in the contemporaneous regulation, which aligns well with research on self-regulated learning among students (Trentepohl et al., 2023; Waldeyer et al., 2022), pointing out the relevance of the learner’s attention and infrastructure (e.g., a quiet study space) for her learning success. This case study did not confirm the expectation of proto-capitals (organismic and economic capital) to exert major influence within the network, as they lay the groundwork for other resources to grow (Ziegler et al., 2017). Although organismic capital was among the four high-strength nodes, it was neither the most influential factor nor a gatekeeper. We can assume that the resources proximal to determining learning actions become evident in this type of analysis instead of their precursors. Thus, the idea of general regulation patterns justifying group analyses remains questionable. It is likely that in other individuals or learning contexts, different resources may emerge as central within the network. Based on systemic theories such as the law of the minimum (Gorban et al., 2011), the individually least developed resource is expected to exert the most significant influence on the system and hinder development. A high strength and betweenness centrality of this node within the network should reflect this. For our participant, two such gatekeepers were identified, attentional and didactic capital, contradicting the law of the minimum and pointing towards multiple limitations (Gorban et al., 2010; Saito et al., 2008). When relatively low values in both gatekeepers coincide, as on days 17, 22, and 32, the system should be hindered severely. This is mirrored in the focal variables, but we also find days with lower learning outcomes and more stress, suggesting additional regulatory mechanisms in the daily learning episodes of our participant.

4.1.2. Day-to-Day Dynamics

The temporal lag-1 network model also offered some interesting insights. First, the model was very sparse, indicating that few dependencies exist between resources and focal variables from one day to the next within our participant’s system. This can either mean that the regulatory processes were indeed from day to day but were unstable throughout the study or that regulation happened at another time scale (faster, which is captured in the contemporaneous network model, or slower) or in non-linear ways (Epskamp et al., 2018a). All of these options are probably true for some regulatory processes, which supports the claim to account for the system’s complexity (Borsboom, 2017; Phillipson et al., 2023).
Second, we found several negative autoregressions, providing the first empirical examination of homeostatic regulation within an actiotope (Ziegler & Stoeger, 2019). These resources and outcome variables stabilized over time, preventing exhaustion and maintaining the learning process. In addition, one homeorhethic regulation became evident, and it would be interesting to determine whether more of these resource- or performance-elevating effects can be captured with this methodology, for example, with a learner who dedicates several hours a day to the development of new skills or a learning product.

4.2. Implications for Learning Diagnostics and Targeted Interventions

The proposed network-based approach to capturing and representing the regulation of learners’ resources offers, in our view, an excellent approach for diagnosis in the sense of learning progress diagnostics and resulting interventions. A graphical representation of time series data clarifies the current status quo of all relevant resources in the students’ actiotope. This visualization can serve as feedback (Butler & Winne, 1995; Hattie & Timperley, 2007), enabling learning companions and learners to identify potential deficiencies or strengths in their resources and the effects of their covariation.
The metrics derived from network analyses provide additional cues to better understand the interactions within the system of one’s resources and to draw conclusions for the regulation of the further learning process. For example, considering the resources with the highest strength in a contemporaneous network provides insights into which resources strongly influence other variables. Depending on the direction of the relationships, which can be determined in a discussion with the learner, tailored and highly effective interventions could be developed on this basis, specifically strengthening these critical resources. Resources identified as gatekeepers for other resources or learning variables based on high betweenness centrality should be monitored closely. If, as in our example, attention and access to excellent learning opportunities prove to be central, these resources should be consistently maintained throughout the learning process to avoid negative impacts on other resources.
In the case of our participant, we may suggest the following interventions and select appropriate ones after discussing them with her, thereby validating the conclusions drawn from the analyses. Her temporal network shows homeostatic regulations. At the day-to-day level, this is useful so as not to become exhausted. To further her development, some additional homeorhethic influences (positive partial correlations with an accelerating effect on the target variable) of highly available capitals would be advantageous. So far, her learning achievement appears to regulate her cultural capital consistently and in an accelerating way, as we saw in the descriptive analysis (high values throughout the study). However, this regulation has a dead end: cultural capital is not further connected, neither in the temporal nor the contemporaneous network; hence, increases in cultural capital will not unfold significant positive effects on her system. She could change this by using her cultural capital more efficiently, like using the strategy of enhancement of personal significance by focusing on comments of her social contacts that assemble relations between the task and her individual interests and preferences (Schwinger et al., 2009).
A general intervention to enhance homeorhethic regulation from day to day could be to implement routines or habits (Arlinghaus & Johnston, 2019; Lally et al., 2010) that ensure she will increase or at least keep her strongly connected capitals in the contemporaneous network stable. This leads to four auspicious starting points for intervention (nodes with high strength and betweenness centrality), didactic, infrastructural, attentional, and organismic capital. To continually increase didactic capital, she could seek to implement something special in her daily learning. For instance, she could prepare a list of different learning possibilities and try them out to find the most efficient ones. Additionally, she could search for a Spanish-speaking person to speak the language with regularly, creating more motivating learning opportunities aside from her vocabulary studying. This can go hand in hand with improvements in infrastructural capital when she acquires new materials, exercises, instructions, feedback, and the like. To foster her attentional capital, she could flexibly move her learning episode to a time when she can concentrate easily instead of keeping the time fixed. She could also try methods to increase focus, like writing down all her thoughts to clear her head or getting some rest before learning. Similarly, she could target organismic capital by implementing healthy sleep, balanced nutrition, and physical exercise.

4.3. Limitations and Future Directions

While the present study addresses existing desiderata in research on learning resources with an innovative method, potential limitations also became apparent. A general limitation of the analyses was that they only considered linear regulatory effects and the lag-1 model. Further studies should extend analyses to non-linear and higher lag models to identify additional regulatory effects (for an overview, see Hevey, 2018). Furthermore, we used the method on one student learning vocabulary as an exemplary illustration of its potential for individual diagnosis and intervention planning. Of course, this single-case design and the specific learning task do not allow for theory building or generalizations of found effects. Some specific limitations include the number of measurements and modeled nodes and the assessments of educational and learning capitals and their interactions.
First, the number of measurement points (50) may have been too low to depict global temporal structures, while the number of nodes (14) may have been too high. Other studies have used an entire semester with up to 154 days (Bellhäuser et al., 2019; Liborius et al., 2019), but this is undoubtedly among the extremes in learning research. Mansueto et al.’s simulation studies (Mansueto et al., 2023) recommend a minimum of 75 to 100 observations for single-case network analyses with no more than 6 nodes, which is tenable in clinical cases with short symptom assessments several times per day (e.g., David et al., 2018) but very demanding in learning studies. In the present study, it would be possible to reduce the number of nodes by aggregating the items into the two overarching capital forms of learning and educational capitals, but this would entail a considerable loss of information. Therefore, future research should focus on increasing the number of observations.
Further limitations deal with the degree of differentiation in resource assessment with the extremes of estimating the whole abstract category of an educational or learning capital (single-faceted with one item or multi-faceted with several items) on one end and collecting specific examples from everyday life on the other end of the continuum. We settled for the first extreme due to economical reasons. The assessment of resource-related variables with one item each is well-established in learning diary research (Bellhäuser et al., 2019; Brose et al., 2012; Goetz et al., 2013; Liborius et al., 2019). However, we only captured the aspect of resource availability, neglecting accessibility or its current use (Harder, 2025). An alternative measurement method for future research could be Cognitive–Affective Mapping (Reuter et al., 2022; Thagard, 2010), in which the participants themselves draw the network of influential factors, including the connections by directed and weighted edges (software available from Fenn et al., 2025).
Modeling the interaction between resources is another issue to discuss. We chose non-directed network models (Epskamp, 2017a), as they offer many desired analytical insights and are easy to perform with assessments of capital expression. However, knowledge of the direction of regulatory effects would enhance their understanding immensely. Assessing direction poses some challenges though. It requires the selection of one type of interaction (Phillipson et al., 2023; Ziegler & Stoeger, 2019), which then needs to be assessed for all pairs of system components (100 pairs, including autoregressive effects for 10 educational and learning capitals). Further difficulties lie in the high cognitive demands imposed on the participants by estimating abstract interactions (Harder & May, 2024) not necessarily accessible to our conscious self-regulation (Bargh & Chartrand, 1999).

5. Conclusions

With reference to this contribution’s title, it can be stated that individual time series data and resulting temporal networks are suitable for visualizing and analyzing complex multivariate relationships in learning contexts. Within the context of learning resources, the temporal network approach (Epskamp, 2017a) allows for the identification of resources within a learner’s system that (1) function as central nodes in learning resource regulation; (2) serve as intermediaries between a system’s learning resources and focal variables, such as performance, learning duration, and stress; and (3) help maintain the system’s stability. The temporal component of the networks allows for insights into relationships both within learning episodes and from day to day. The network metrics, in turn, can provide learners or instructors with helpful information for diagnosing difficulties and addressing these challenges. This innovative approach, developed in clinical psychology (Borsboom & Cramer, 2013), complements extant research on learning by accounting for the individuality and complexity of a learning system and should be considered by future research regarding individual learning processes.

Author Contributions

Conceptualization, B.H.; Formal analysis, B.H.; Investigation, B.H.; Methodology, B.H. and M.D.S.H.; Resources, B.H.; Supervision, B.H.; Visualization, M.D.S.H.; Writing—original draft, B.H. and N.N.-S.; Writing—review & editing, B.H., N.N.-S. and M.D.S.H. All authors have read and agreed to the published version of the manuscript.

Funding

This research received no external funding.

Institutional Review Board Statement

No review board was in charge; the participant approached the first author as supervisor for her Bachelor’s thesis on this study.

Informed Consent Statement

Informed consent was obtained from the subject involved in this study.

Data Availability Statement

Diary data cannot be made available due to possible identification of the participant. The data set used for network analyses is available from the first author on request.

Acknowledgments

The participant used the data for her Bachelor’s thesis, which represented the groundwork for the descriptive analyses. The R-Code to obtain graphics was partially generated by “Gemini 2.0 Flash Thinking Experimental 01-21”. The AI tool “Grammarly” as well as “Gemini 2.5 Pro“ were used to edit this manuscript. All suggestions were carefully checked for correctness.

Conflicts of Interest

The authors declare no conflicts of interest.

References

  1. Arlinghaus, K. R., & Johnston, C. A. (2019). The importance of creating habits and routine. American Journal of Lifestyle Medicine, 13(2), 142–144. [Google Scholar] [CrossRef] [PubMed]
  2. Bargh, J. A., & Chartrand, T. L. (1999). The unbearable automaticity of being. American Psychologist, 54(7), 462–479. [Google Scholar] [CrossRef]
  3. Bellhäuser, H., Mattes, B., & Liborius, P. (2019). Daily fluctuations in motivation. Zeitschrift für Entwicklungspsychologie und Pädagogische Psychologie, 51(4), 228–242. [Google Scholar] [CrossRef]
  4. Blasiman, R. N., Dunlosky, J., & Rawson, K. A. (2017). The what, how much, and when of study strategies: Comparing intended versus actual study behaviour. Memory, 25(6), 784–792. [Google Scholar] [CrossRef]
  5. Boekaerts, M. (2011). Emotions, emotion regulation, and self-regulation of learning: Center for the study of learning and instruction, Leiden University, The Netherlands, and KU Leuven. In Handbook of self-regulation of learning and performance (pp. 422–439). Routledge. [Google Scholar]
  6. Borsboom, D. (2017). A network theory of mental disorders. World Psychiatry, 16(1), 5–13. [Google Scholar] [CrossRef]
  7. Borsboom, D., & Cramer, A. O. J. (2013). Network analysis: An integrative approach to the structure of psychopathology. Annual Review of Clinical Psychology, 9, 91–121. [Google Scholar] [CrossRef]
  8. Brose, A., Schmiedek, F., Lovden, M., & Lindenberger, U. (2012). Daily variability in working memory is coupled with negative affect: The role of attention and motivation. Emotion, 12(3), 605–617. [Google Scholar] [CrossRef]
  9. Burnette, J. L., O’Boyle, E. H., VanEpps, E. M., Pollack, J. M., & Finkel, E. J. (2013). Mind-sets matter: A meta-analytic review of implicit theories and self-regulation. Psychological Bulletin, 139(3), 655–701. [Google Scholar] [CrossRef] [PubMed]
  10. Butler, D. L., & Winne, P. H. (1995). Feedback and self-regulated learning: A theoretical synthesis. Review of Educational Research, 65(3), 245–281. [Google Scholar] [CrossRef]
  11. Costantini, G., Epskamp, S., Borsboom, D., Perugini, M., Mõttus, R., Waldorp, L. J., & Cramer, A. O. J. (2015). State of the aRt personality research: A tutorial on network analysis of personality data in R. Journal of Research in Personality, 54, 13–29. [Google Scholar] [CrossRef]
  12. Cramer, A. O. J., & Borsboom, D. (2015). Problems attract problems: A network perspective on mental disorders. In R. A. Scott, & S. M. Kosslyn (Eds.), Emerging trends in the social and behavioral sciences: An interdisciplinary, searchable, and linkable resource (pp. 1–15). John Wiley & Sons, Inc. [Google Scholar] [CrossRef]
  13. Cramer, A. O. J., Waldorp, L. J., van der Maas, H. L., & Borsboom, D. (2010). Comorbidity: A network perspective. Behavioral and Brain Sciences, 33(2–3), 137–150; discussion 150–193. [Google Scholar] [CrossRef]
  14. Dalege, J., Borsboom, D., van Harreveld, F., van den Berg, H., Conner, M., & van der Maas, H. L. (2016). Toward a formalized account of attitudes: The Causal Attitude Network (CAN) model. Psychological Review, 123(1), 2–22. [Google Scholar] [CrossRef] [PubMed]
  15. David, S. J., Marshall, A. J., Evanovich, E. K., & Mumma, G. H. (2018). Intraindividual dynamic network analysis—Implications for clinical assessment. Journal of Psychopathology and Behavioral Assessment, 40(2), 235–248. [Google Scholar] [CrossRef] [PubMed]
  16. Debatin, T., Hopp, M., Vialle, W., & Ziegler, A. (2015). Why experts can do what they do: The effects of exogenous resources on the Domain Impact Level of Activities (DILA). Psychological Test and Assessment Modeling, 57(1), 94–110. [Google Scholar]
  17. Dickey, D. A., & Fuller, W. A. (1979). Distribution of the estimators for autoregressive time series with a unit root. Journal of the American Statistical Association, 74(366a), 427–431. [Google Scholar]
  18. Dresel, M., Schmitz, B., Schober, B., Spiel, C., Ziegler, A., Engelschalk, T., Jstl, G., Klug, J., Roth, A., Wimmer, B., & Steuer, G. (2015). Competencies for successful self-regulated learning in higher education: Structural model and indications drawn from expert interviews. Studies in Higher Education, 40(3), 454–470. [Google Scholar] [CrossRef]
  19. Elo, A.-L., Leppnen, A., & Jahkola, A. (2003). Validity of a single-item measure of stress symptoms. Scandinavian Journal of Work, Environment & Health, 29(6), 444–451. [Google Scholar] [CrossRef]
  20. Epskamp, S. (2017a). graphicalVAR: Graphical VAR for experience sampling data (R package version 0.3.4). Available online: http://CRAN.R-project.org/package=graphicalVAR (accessed on 4 January 2025).
  21. Epskamp, S. (2017b). Network psychometrics [Ph.D. thesis, University of Amsterdam]. [Google Scholar]
  22. Epskamp, S., van Borkulo, C. D., van der Veen, D. C., Servaas, M. N., Isvoranu, A. M., Riese, H., & Cramer, A. O. J. (2018a). Personalized network modeling in psychopathology: The importance of contemporaneous and temporal connections. Clinical Psychological Science, 6(3), 416–427. [Google Scholar] [CrossRef]
  23. Epskamp, S., Waldorp, L. J., Mottus, R., & Borsboom, D. (2018b). The Gaussian graphical model in cross-sectional and time-series data. Multivariate Behavioral Research, 53(4), 453–480. [Google Scholar] [CrossRef]
  24. Fenn, J., Gouret, F., Gorki, M., Reuter, L., Gros, W., Hüttner, P., & Kiesel, A. (2025). Cognitive-affective maps extended logic: Proposing tools to collect and analyze attitudes and belief systems. Behavior Research Methods, 57(6), 174. [Google Scholar] [CrossRef]
  25. Fisher, A. J., Medaglia, J. D., & Jeronimus, B. F. (2018). Lack of group-to-individual generalizability is a threat to human subjects research. Proceedings of the National Academy of Sciences, 115(27), E6106–E6115. [Google Scholar] [CrossRef] [PubMed]
  26. Foygel, R., & Drton, M. (2010, December 6–9). Extended Bayesian information criteria for Gaussian graphical models. 24th International Conference on Neural Information Processing Systems, Vancouver, BC, Canada. [Google Scholar] [CrossRef]
  27. Freeman, L. C. (1977). A set of measures of centrality based on betweenness. Sociometry, 40(1), 35–41. [Google Scholar] [CrossRef]
  28. Goetz, T., Frenzel, A. C., Hall, N. C., Nett, U. E., Pekrun, R., & Lipnevich, A. A. (2013). Types of boredom: An experience sampling approach. Motivation and Emotion, 38(3), 401–419. [Google Scholar] [CrossRef]
  29. Gorban, A. N., Pokidysheva, L. I., Smirnova, E. V., & Tyukina, T. A. (2011). Law of the minimum paradoxes. Bulletin of Mathematical Biology, 73(9), 2013–2044. [Google Scholar] [CrossRef]
  30. Gorban, A. N., Smirnova, E. V., & Tyukina, T. A. (2010). Correlations, risk and crisis: From physiology to finance. Physica A, 389, 3193–3217. [Google Scholar] [CrossRef]
  31. Granger, C. W. J. (1969). Investigating causal relations by econometric models and cross-spectral methods. Econometrica: Journal of the Econometric Society, 37(3), 424–438. [Google Scholar] [CrossRef]
  32. Gursakal, N., & Bozkurt, A. (2017). Identifying gatekeepers in online learning networks. World Journal on Educational Technology: Current Issues, 9(2), 75–88. [Google Scholar] [CrossRef]
  33. Guyon, H., Falissard, B., & Kopf, J.-L. (2017). Modeling psychological attributes in psychology—An epistemological discussion: Network analysis vs. latent variables. Frontiers in Psychology, 8, 798. [Google Scholar] [CrossRef]
  34. Hadwin, A. F., Sukhawathanakul, P., Rostampour, R., & Bahena-Olivares, L. M. (2022). Do self-regulated learning practices and intervention mitigate the impact of academic challenges and COVID-19 distress on academic performance during online learning? Frontiers in Psychology, 13, 813529. [Google Scholar] [CrossRef]
  35. Harder, B. (2025). Differential effects of resource availability and usage on learning, achievement, and subjective well-being. Cogent Education, 12(1). [Google Scholar] [CrossRef]
  36. Harder, B., & May, I. (2024, September 16–19). Ressourcenverfügbarkeit und Ressourceninteraktion bei der Stressbewältigung—Psychometrische Netzwerkmodellierungen [Availability and interaction of resources for stress management—Psychometric network models; Paper presentation]. Kongress der DGPS 2024, Vienna, Austria. [Google Scholar]
  37. Harder, B., O’Reilly, C., & Debatin, T. (2018). Intelligence, Educational and Learning Capital, and Domain Impact Level of Activities as Predictors of School Achievement. Journal for the Education of the Gifted, 41(4), 327–347. [Google Scholar] [CrossRef]
  38. Harder, B., Trottler, S., Vialle, W., & Ziegler, A. (2015). Diagnosing resources for effective learning via teacher and parent checklists. Psychological Test and Assessment Modeling, 57(2), 201–221. [Google Scholar]
  39. Hattie, J., & Timperley, H. (2007). The power of feedback. Review of Educational Research, 77(1), 81–112. [Google Scholar] [CrossRef]
  40. Hevey, D. (2018). Network analysis: A brief overview and tutorial. Health Psychology and Behavioral Medicine, 6(1), 301–328. [Google Scholar] [CrossRef]
  41. Koivuniemi, M., Panadero, E., Malmberg, J., & Järvelä, S. (2017). Higher education students’ learning challenges and regulatory skills in different learning situations. Journal for the Study of Education and Development: Infancia y Aprendizaje, 40(1), 19–55. [Google Scholar] [CrossRef]
  42. Kossakowski, J. J., Epskamp, S., Kieffer, J. M., van Borkulo, C. D., Rhemtulla, M., & Borsboom, D. (2016). The application of a network approach to Health-Related Quality of Life (HRQoL): Introducing a new method for assessing HRQoL in healthy adults and cancer patients. Quality of Life Research, 25(4), 781–792. [Google Scholar] [CrossRef]
  43. Kroeze, R., van der Veen, D. C., Servaas, M. N., Bastiaansen, J. A., Oude Voshaar, R. C., Borsboom, D., Ruhe, H. G., Schoevers, R. A., & Riese, H. (2017). Personalized feedback on symptom dynamics of psychopathology: A proof-of-principle study. Journal for Person-Oriented Research, 3(1), 1–10. [Google Scholar] [CrossRef]
  44. Kwiatkowski, D., Phillips, P. C. B., Schmidt, P., & Shin, Y. (1992). Testing the null hypothesis of stationarity against the alternative of a unit root: How sure are we that economic time series have a unit root? Journal of Econometrics, 54(1–3), 159–178. [Google Scholar] [CrossRef]
  45. Lally, P., Van Jaarsveld, C. H. M., Potts, H. W. W., & Wardle, J. (2010). How are habits formed: Modelling habit formation in the real world. European Journal of Social Psychology, 40(6), 998–1009. [Google Scholar] [CrossRef]
  46. Liborius, P., Bellhäuser, H., & Schmitz, B. (2019). What makes a good study day? An intraindividual study on university students’ time investment by means of time-series analyses. Learning and Instruction, 60, 310–321. [Google Scholar] [CrossRef]
  47. Littman, A. J., White, E., Satia, J. A., Bowen, D. J., & Kristal, A. R. (2006). Reliability and validity of 2 single-item measures of psychosocial stress. Epidemiology, 17(4), 398–403. [Google Scholar] [CrossRef] [PubMed]
  48. Mansueto, A. C., Wiers, R. W., van Weert, J. C. M., Schouten, B. C., & Epskamp, S. (2023). Investigating the feasibility of idiographic network models. Psychological Methods, 28(5), 1052–1068. [Google Scholar] [CrossRef] [PubMed]
  49. Meier, R. V. (2023). Regulationsverhalten im Lernverhalten von Kindern, Jugendlichen und Studierenden—Eine qualitative Untersuchung auf Grundlage des systemischen Ansatzes [Regulation of learning behavior in children, adolescents and university students—A qualitative investigation based on a system-theoretical approach [Ph.D. thesis, Friedrich-Alexander-Universität Erlangen-Nürnberg]. [Google Scholar]
  50. Mendl, A., Harder, B., & Vialle, W. (2021). Moderating effects of educational and learning capital on performance feedback. Psychological Test and Assessment Modeling, 63(2), 239–269. [Google Scholar]
  51. Molenaar, P. C. M. (2004). A manifesto on psychology as idiographic science: Bringing the person back into scientific psychology, this time forever. Measurement: Interdisciplinary Research & Perspective, 2(4), 201–218. [Google Scholar] [CrossRef]
  52. Montgomery, D. C., Jennings, C. L., & Kulahci, M. (2015). Introduction to time series analysis and forecasting (1st ed.). John Wiley & Sons. [Google Scholar]
  53. Mõttus, R., & Allerhand, M. (2017). Why do traits come together? The underlying trait and network approaches. In V. Zeigler-Hill, & T. Shackelford (Eds.), SAGE handbook of personality and individual differences: Volume 1. The science of personality and individual differences (pp. 1–22). Sage. [Google Scholar]
  54. Naujoks-Schober, N., Bakhiet, S., Altuwaijri, A. I., Vialle, W., Essa, Y. A. S., & Ziegler, A. (2025). Talent Development from a Learning Resource Perspective: Testing the Law of the Minimum. Gifted Child Quarterly. under review. [Google Scholar]
  55. Opsahl, T., Agneessens, F., & Skvoretz, J. (2010). Node centrality in weighted networks: Generalizing degree and shortest paths. Social Networks, 32(3), 245–251. [Google Scholar] [CrossRef]
  56. Panadero, E. (2017). A review of self-regulated learning: Six models and four directions for research. Frontiers in Psychology, 8, 422. [Google Scholar] [CrossRef]
  57. Paz-Baruch, N. (2015). Validation study of the Questionnaire of Educational and Learning Capital (QELC) in Israel. Psychological Test and Assessment Modeling, 57(2), 222–235. [Google Scholar]
  58. Paz-Baruch, N. (2017). Educational and learning capitals of Israeli students with high achievements in mathematics. Journal for the Education of the Gifted, 40(4), 334–349. [Google Scholar] [CrossRef]
  59. Paz-Baruch, N. (2020). Educational and learning capital as predictors of general intelligence and scholastic achievements. High Ability Studies, 31(1), 75–91. [Google Scholar] [CrossRef]
  60. Phillipson, S. N., Han, C. D., & Lee, V. C. S. (2023). Artificial neural networks and the actiotope model of giftedness—Clever solutions from complex environments. Journal of Intelligence, 11(7), 128. [Google Scholar] [CrossRef]
  61. R Core Team. (2024). R: A language and environment for statistical computing. R Foundation for Statistical Computing. Available online: https://www.R-project.org/ (accessed on 4 January 2025).
  62. Reuter, L., Mansell, J., Rhea, C., & Kiesel, A. (2022). Direct assessment of individual connotation and experience: An introduction to cognitive-affective mapping. Politics and the Life Sciences, 41(1), 131–139. [Google Scholar] [CrossRef] [PubMed]
  63. Reutlinger, M., Pfeiffer, W., Stoeger, H., Vialle, W., & Ziegler, A. (2020). Domain-specificity of educational and learning capital: A study with musical talents. Frontiers in Psychology, 11(2377), 561974. [Google Scholar] [CrossRef] [PubMed]
  64. Rovers, S. F. E., Clarebout, G., Savelberg, H. H. C. M., de Bruin, A. B. H., & van Merrinboer, J. J. G. (2019). Granularity matters: Comparing different ways of measuring self-regulated learning. Metacognition and Learning, 14(1), 1–19. [Google Scholar] [CrossRef]
  65. Saito, M. A., Goepfert, T. J., & Ritt, J. T. (2008). Some thoughts on the concept of colimitation: Three definitions and the importance of bioavailability. Limnology and Oceanography, 53(1), 276–290. [Google Scholar] [CrossRef]
  66. Salminen, S., Kouvonen, A., Koskinen, A., Joensuu, M., & Vnnen, A. (2014). Is a single item stress measure independently associated with subsequent severe injury: A prospective cohort study of 16,385 forest industry employees. BMC Public Health, 14(1), 543. [Google Scholar] [CrossRef]
  67. Schwinger, M., Steinmayr, R., & Spinath, B. (2009). How do motivational regulation strategies affect achievement: Mediated by effort management and moderated by intelligence. Learning and Individual Differences, 19(4), 621–627. [Google Scholar] [CrossRef]
  68. Sedov, K. R., Gorban, A. N., Petushkova, E. V., Manchuk, V. T., & Shalamova, E. N. (1988). Correlation adaptometry as a method of screening of the population. Vestnik Akademii Meditsinskikh Nauk SSSR, 10(1), 69–75. [Google Scholar]
  69. Stemmer, L. (2020). Frauen in MINT: Ein systemischer erklärungsansatz der Leaky Pipeline [Women in STEM: A resource-oriented explanation approach of the Leaky Pipeline] [Ph.D. thesis, Friedrich-Alexander Universität Erlangen-Nürnberg]. [Google Scholar]
  70. Thagard, P. (2010). EMPATHICA: A computer support system with visual representations for cognitive-affective mapping. In K. McGregor (Ed.), Proceedings of the workshop on visual reasoning and representation (pp. 79–81). AAAI Press. [Google Scholar]
  71. Tibshirani, R. (1996). Regression shrinkage and selection via the lasso. Journal of the Royal Statistical Society. Series B (Methodological), 58, 267–288. Available online: http://www.jstor.org/stable/2346178 (accessed on 20 January 2025). [CrossRef]
  72. Trentepohl, S., Waldeyer, J., Fleischer, J., Roelle, J., Leutner, D., & Wirth, J. (2023). Self-regulation of resources in higher education. Zeitschrift Fur Padagogische Psychologie. [Google Scholar] [CrossRef]
  73. Tyukina, T. A. (2022). Models of adaptation and behavioural patterns in complex systems in crisis [Ph.D. thesis, University of Leicester]. [Google Scholar]
  74. van der Ploeg, R. R., Böhm, W., & Kirkham, M. B. (1999). On the origin of the theory of mineral nutrition of plants and the law of the minimum. Soil Science Society of America Journal, 63(5), 1055–1062. [Google Scholar] [CrossRef]
  75. Veas, A., Castejón, J., O’Reilly, C., & Ziegler, A. (2018). Mediation analysis of the relationship between educational capital, learning capital, and underachievement among gifted secondary school students. Journal for the Education of the Gifted, 41(4), 369–385. [Google Scholar] [CrossRef]
  76. Vladut, A., Liu, Q., Leana-Taşcilar, M., Vialle, W., & Ziegler, A. (2013). A cross-cultural validation study of the Questionnaire of Educational and Learning Capital (QELC) in China, Germany, and Turkey. Psychological Test and Assessment Modeling, 55(4), 462–478. [Google Scholar]
  77. Vladut, A., Vialle, W., & Ziegler, A. (2015). Learning resources within the Actiotope: A validation study of the QELC (Questionnaire of Educational and Learning Capital). Psychological Test and Assessment Modeling, 57(1), 40–56. [Google Scholar]
  78. Vladut, A., Vialle, W., & Ziegler, A. (2016). Two studies of the empirical basis of two learning resource-oriented motivational strategies for gifted educators. High Ability Studies, 27(1), 39–60. [Google Scholar] [CrossRef]
  79. Waldeyer, J., Dicke, T., Fleischer, J., Guo, J., Trentepohl, S., Wirth, J., & Leutner, D. (2022). A moderated mediation analysis of conscientiousness, time management strategies, effort regulation strategies, and university students’ performance. Learning and Individual Differences, 100, 102228. [Google Scholar] [CrossRef]
  80. Winne, P. H. (2001). Self-regulated learning viewed from models of information processing. In J. B. Zimmerman, & D. H. Schunk (Eds.), Self-regulated learning and academic achievement: Theoretical perspectives (2nd ed., pp. 153–189). Lawrence Erlbaum. [Google Scholar]
  81. Wright, A. G. C., & Woods, W. C. (2020). Personalized models of psychopathology. Annual Review of Clinical Psychology, 16, 49–74. [Google Scholar] [CrossRef]
  82. Ziegler, A. (2005). The Actiotope model of giftedness. In R. J. Sternberg, & J. E. Davidson (Eds.), Conceptions of giftedness (2nd ed., pp. 411–436). Cambridge University Press. [Google Scholar]
  83. Ziegler, A., & Baker, J. (2013). Talent development as adaption: The role of educational and learning capital. In N. S. Phillipson, H. Stoeger, & A. Ziegler (Eds.), Exceptionality in East Asia: Explorations in the actiotope model of giftedness (pp. 18–39). Routledge. [Google Scholar]
  84. Ziegler, A., Chandler, K. L., Vialle, W., & Stoeger, H. (2017). Exogenous and endogenous learning resources in the Actiotope Model of Giftedness and its significance for gifted education. Journal for the Education of the Gifted, 40(4), 310–330. [Google Scholar] [CrossRef]
  85. Ziegler, A., Debatin, T., & Stoeger, H. (2019). Learning resources and talent development from a systemic point of view. Annals of the New York Academy of Sciences, 1445(1), 39–51. [Google Scholar] [CrossRef]
  86. Ziegler, A., Hopp, M., Linner, M., Schöferle, T., Thomas, N., Schielein, T., Vladut, A., & Götzfried, W. (2012). Bildungs-und Lernkapitalarmut von Hauptschülern: Ergebnisse einer explorativen Befragungsstudie mit Lehrkräften [Deficits in educational and learning capital among middle school students: Results of an explorative survey among teachers]. Schulpädagogik heute, 3(5), 1–10. [Google Scholar]
  87. Ziegler, A., & Phillipson, S. N. (2012). Towards a systemic theory of gifted education. High Ability Studies, 23(1), 3–30. [Google Scholar] [CrossRef]
  88. Ziegler, A., & Stoeger, H. (2017). Systemic gifted education: A theoretical introduction. Gifted Child Quarterly, 61(3), 183–193. [Google Scholar] [CrossRef]
  89. Ziegler, A., & Stoeger, H. (2019). A nonagonal framework of regulation in talent development (NFRTD). High Ability Studies, 30(1–2), 127–145. [Google Scholar] [CrossRef]
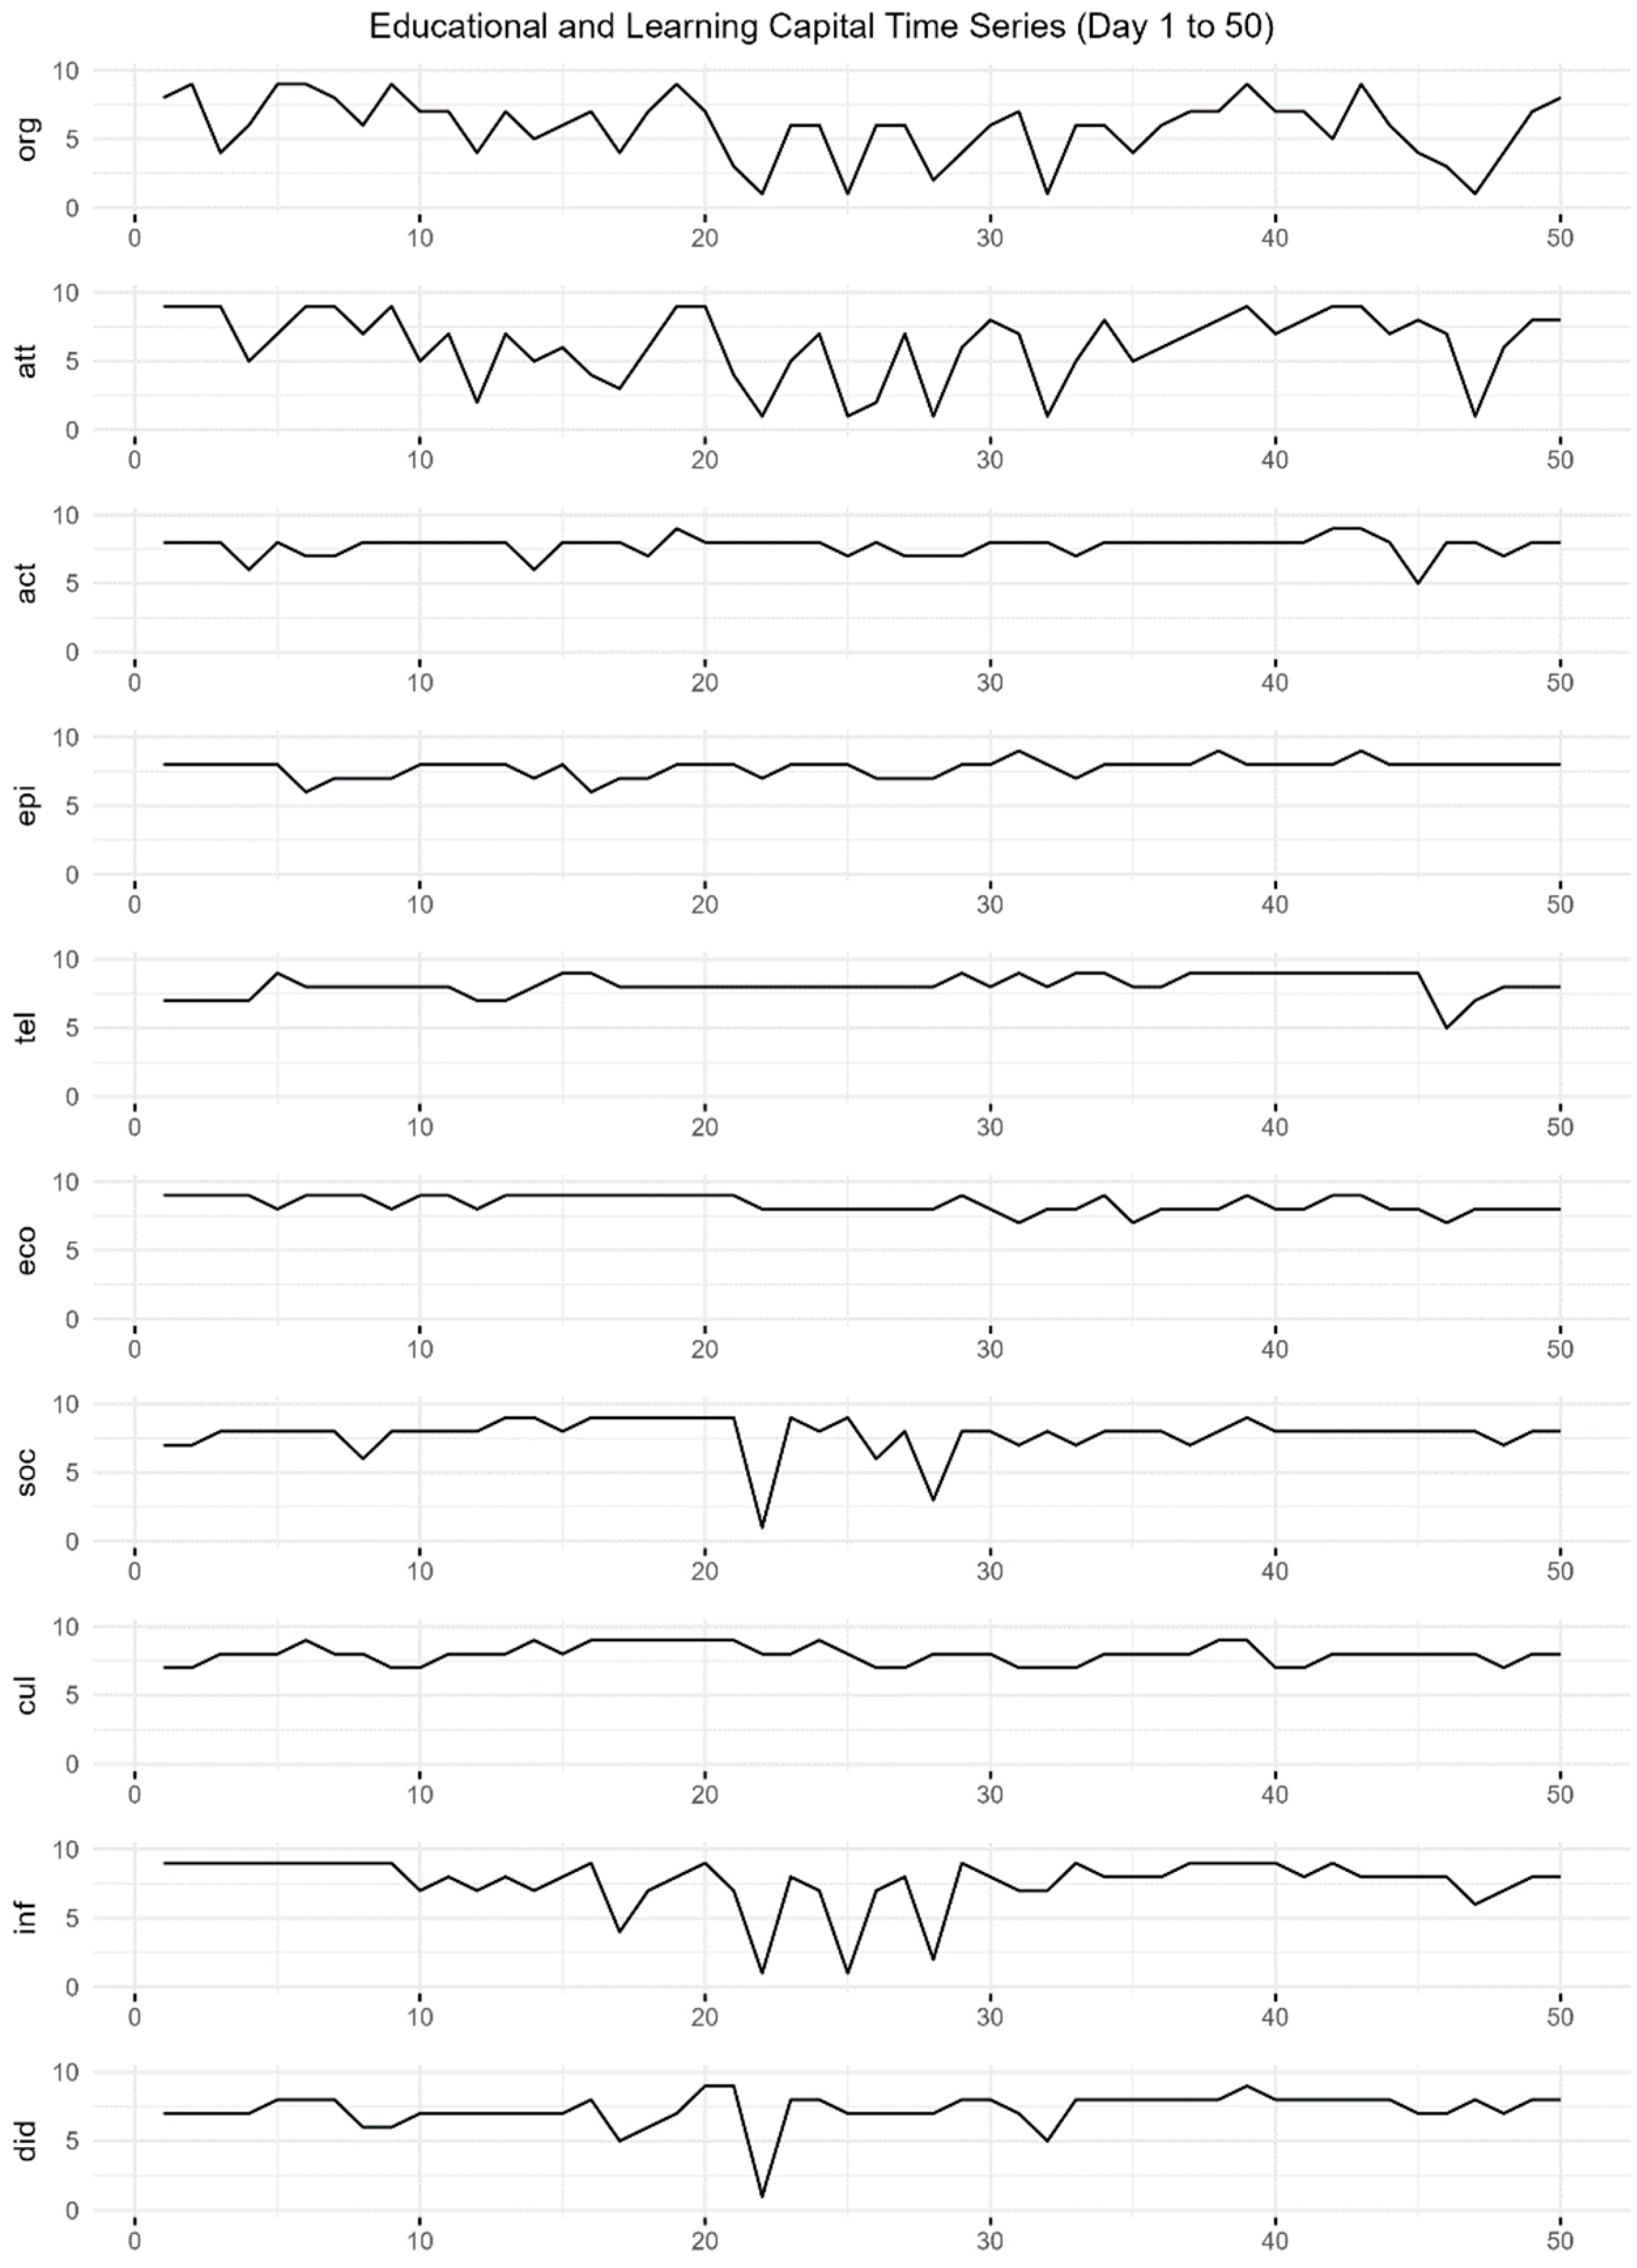
Figure 1. Time series data of the daily measurements of educational and learning capital availability from day 1 to 50 of the study, indicated on a scale from 1 to 9. Abbreviations: org = organismic; att = attentional; act = actional; epi = episodic; tel = telic learning capital; eco = economic; soc = social; cul = cultural; inf= infrastructural; did = didactic educational capital.
Education 15 00728 g001
Figure 2. Time series data from daily measurements over 50 days of four variables. (a) depicts the percentage of correctly recalled new words and (b) of repeated words in the daily performance tests; (c) shows the time series of the duration of each learning episode in minutes and (d), the stress level ratings on a scale from 1 to 9. Abbreviations: new = correctly recalled new words, rep = correctly recalled repeated words, dur = duration of learning episode, str = stress level.
Education 15 00728 g002
Figure 3. (a) Contemporaneous network graph (using regularized partial correlations) showing the consistent interrelations between variables at each point in time. Educational and learning capitals are displayed in the outer circle, and focal variables are displayed in the inner circle. Connections’ width and color intensity denote the connection’s weight; green vs. red connections represent positive vs. negative partial correlations. (b) Centrality indices corresponding to the contemporaneous network model, denoting each node’s strength (indicating its connectedness to other nodes) and betweenness (indicating an intermediary role between two other nodes). Abbreviations: org =organismic; att = attentional; act = actional; epi = episodic; tel = telic learning capital; eco = economic; soc = social; cul = cultural; inf= infrastructural; did = didactic educational capital; str = stress level; dur = duration of learning episode; new = correctly recalled new words; rep = correctly recalled repeated words.
Education 15 00728 g003
Figure 4. (a) Temporal network graph, using regularized lag-1 partial directed correlations, showing the predictions between all variables from one day to the next. Educational and learning capitals are displayed in the outer circle and focal variables are displayed in the inner circle. Connections’ width and color intensity denote the connection’s weight; green vs. red connections represent positive vs. negative partial correlations. (b) Centrality indices corresponding to the temporal network model, denoting each node’s in-strength (indicating total prediction towards the node from the previous time point) and out-strength (indicating total prediction from the node to the next time point). Abbreviations: org =organismic; att = attentional; act = actional; epi = episodic; tel = telic learning capital; eco = economic; soc = social; cul = cultural; inf= infrastructural; did = didactic educational capital; str = stress level; dur = duration of learning episode; new = correctly recalled new words; rep = correctly recalled repeated words.
Education 15 00728 g004
Table 1. Definitions of educational and learning capital categories according to Ziegler and Baker (2013), positive capital examples for a university student learning a foreign language, and the abbreviated names used in our analyses.
NameDefinitionPositive Examples
Educational Capital
ecoEconomic educational capital is every kind of wealth, possession, money, or valuables that can be invested in the initiation and maintenance of educational and learning processes (p. 27).Salary, financial support by parents or partner, and scholarships
infInfrastructural educational capital relates to materially implemented possibilities for action that permit learning and education to take place (p. 28).Learning materials like books and internet sites, and access to native speakers
culCultural educational capital includes value systems, thinking patterns, models, and the like, which can facilitate—or hinder—the attainment of learning and educational goals (p. 27).Family/friends/media valuing learning the language, the country, and the culture
didDidactic educational capital means the assembled know-how involved in the design and improvement of educational and learning processes (p. 29).Individually tailored instructions and corrective feedback (via learning apps or teachers)
socSocial educational capital includes all persons and social institutions that can directly or indirectly contribute to the success of learning and educational processes (p. 28).People encouraging and supporting learning and taking over household chores
Learning Capital
orgOrganismic learning capital consists of the physiological and constitutional resources of a person (p. 29).No learning disabilities, a healthy diet, and enough sleep
actActional learning capital means the action repertoire of a person—the totality of actions they are capable of performing (p. 30).Knowledge of learning strategies and rules of pronunciation
telTelic learning capital comprises the totality of a person’s anticipated goal states that offer possibilities for satisfying their needs (p. 30).Making a plan and prioritizing learning over other hobbies
epiEpisodic learning capital concerns the simultaneous goal- and situation-relevant action patterns that are accessible to a person (p. 31).Successful vocabulary memorizing strategies from prior experiences
attAttentional learning capital denotes the quantitative and qualitative attentional resources that a person can apply to learning (p. 31).Time window reserved for learning and no interruptions
Table 2. Results of ADF and KPSS tests for stationarity of all variables.
VariablesOriginal DataFirst Difference
ADFKPSSADFKPSS
Educational and Learning capitals
  Organismic−2.4780.303−4.413 **0.088
  Attentional −2.2060.206−4.836 **0.101
  Actional−3.286 +0.088−4.762 **0.047
  Episodic−5.118 **0.523 *−5.229 **0.045
  Telic−3.206 +0.344−5.228 **0.071
  Economic −2.7840.814 **−6.014 **0.046
  Social−3.1050.088−5.507 **0.051
  Cultural−2.7600.138−4.704 **0.079
  Infrastructural−1.7950.210−5.364 **0.061
  Didactic−3.835 *0.532 *−7.794 **0.047
Stress Level−2.0160.177−4.424 **0.069
Duration of Learning−2.6720.150−4.028 *0.120
Performance
  Correctly Recalled New Words−2.8740.226−4.691 **0.048
  Correctly Recalled Repeated Words−1.8050.240−5.052 **0.127
Note. The ADF test’s alternative hypothesis is stationarity (it should be significant), the KPSS test’s null hypothesis is stationarity (it should not be significant); + p < 0.10, * p < 0.05, and ** p < 0.01.
Disclaimer/Publisher’s Note: The statements, opinions and data contained in all publications are solely those of the individual author(s) and contributor(s) and not of MDPI and/or the editor(s). MDPI and/or the editor(s) disclaim responsibility for any injury to people or property resulting from any ideas, methods, instructions or products referred to in the content.