Abstract
Children’s graphic development reflects cognitive, emotional, motor and social processes, and is an indicator of the infant’s integral development. This study analyzed the validity of Viktor Lowenfeld’s developmental model in children aged 3 to 5 years, assessing whether the stages proposed by the author correspond to the patterns of graphic representation currently observed. A mixed design with a descriptive–comparative approach was used. The sample consisted of 218 drawings collected in educational centers in Madrid. Each drawing was evaluated according to criteria derived from Lowenfeld’s model (stroke, motor control, symbolism, use of color, spatial organization) and classified into one of the five developmental stages. The analysis included descriptive statistics, chi-squared tests (χ2 = 104.92, gl = 10, p < 0.0001), and Spearman correlations (ρ = 0.661, p < 0.0001), in addition to qualitative interpretation by inter-rater consensus. The results confirm that the general graphic sequence follows Lowenfeld’s scheme, but with notable variations in the age of onset of each stage. Pre-schematic manifestations were observed in children as young as 3 years old and persistence of scribbling in some 5-year-olds. These findings point to the influence of individual, sociocultural, and technological factors on the rate of graphic development. Lowenfeld’s model remains a valid framework for observing children’s drawing, but its application should be flexible. Interindividual differences and contemporary visual culture require a pedagogical adaptation that addresses the diversity of developmental rhythms. Its integration with inclusive methodologies and future cross-cultural studies is suggested.
1. Introduction
Children’s drawing is one of the earliest and most expressive forms of nonverbal communication during childhood, and its evolution has been the subject of interest in art education, developmental psychology and pedagogy. Beyond its aesthetic dimension, graphic production in childhood reflects cognitive, emotional, motor, and social processes, becoming an indicator of the infant’s integral development. In this context, the object of the present study is children’s graphic development, that is, the progression of the ability to draw as the child grows, understood not as an isolated artistic practice, but as a process linked to their cognitive maturity. Different theoretical currents have approached children’s graphic development from complementary approaches, providing explanatory frameworks that have enriched understanding from both developmental psychology and art education. Using a structural approach, Kellogg (1979) identified developmental stages in children’s scribbling, observing how the initial random strokes gave way to increasingly organized and representative forms as infants grew up. Similarly, Arnheim (1983) analyzed the development of drawing from the psychology of perception, focusing on how young children organize visual information and express their thoughts through art: starting from basic scribbles, they gradually reach more complex symbolic representations as they acquire greater perceptual control, spatial understanding, and compositional notions.
Other approaches have used child drawing for diagnostic purposes of intellectual and emotional development. Goodenough (1926) correlated the complexity of human figure drawing with chronological age, proposing that greater detail and proportion in drawing would reflect more advanced cognitive development. Later, Koppitz (1993) extended Goodenough’s test by identifying emotional and maturational indicators in young children’s drawings, while Machover (1949), using psychoanalysis, interpreted the drawing of the human figure as a projection of the personality, exploring the emotional structure and possible internal conflicts of the child. Along the same projective lines, Corman (1967) developed the family drawing test to evaluate the emotional state and family relationships through images, and Boutonier (1953) proposed a psychoanalytic reading of children’s drawings as a reflection of the inner world, analyzing elements such as the choice of colors, shapes, and spatial arrangement to infer the affective state of the child. On the other hand, in the field of general cognitive development, Piaget (1975) linked graphic production with intellectual evolution: during the preoperational stage (approximately 2 to 7 years), they acquire the symbolic function, which allows them to communicate information through images before fully mastering verbal language.
From an evolutionary perspective oriented to the study of drawing as a form of graphic expression in childhood, the contributions of Luquet (1927) and Viktor Lowenfeld, together with W. L. Brittain, stand out. Luquet described the evolution of children’s drawing in four stages, ranging from “fortuitous realism” around 2–4 years of age, “frustrated realism” (4–5 years), and “intellectual realism” (6–9 years) to “visual realism” (9–12 years), understanding that the capacity for graphic representation advances in parallel with the child’s cognitive development. For his part, Lowenfeld, an Austrian pedagogue and art educator, together with Brittain, presented a model of six developmental stages of children’s drawing, published in his work Creative and Mental Growth (Lowenfeld & Brittain, 1961). This model, which covers approximately 2 to 12 years of age, is the central axis of the present study. The authors conceived these stages in close connection with integral child development (cognitive, psychological, social and motor), emphasizing that the child’s drawing evolves according to the phases of its maturation.
The first is the scribbling stage (approximately 2–4 years), which represents the beginnings of graphic expression. In this phase, strokes and scribbles are made without representational intent, mainly as a result of spontaneous motor activity rather than deliberate visual observation. Lowenfeld subdivided scribbling into three subphases according to motor control: disordered scribbling, controlled scribbling, and named scribbling. In named scribbling, typically toward the end of this stage, the infant begins to associate his or her strokes with real-world objects or experiences (e.g., shows his or her drawings and assigns verbal meaning to them). From the age of 4 years, with greater visual–motor coordination and cognitive capacity, the pre-schematic stage emerges (approximately 4–7 years). In this phase the infant manages to capture the first recognizable figures of his environment, although still in a very basic and variable way. His graphic compositions become progressively more organized and begin to acquire communicative intent: drawing is added to verbal language as a means of expressing ideas, feelings, and experiences. It should be noted that these first two stages (scribbling and pre-schematic) cover the preschool period that concerns us in this study (3–5 years), where the most rapid changes in graphic ability are observed.
The influence of Lowenfeld’s ideas on the didactics of art education continues to this day. In fact, his model of stages continues to be taught in early childhood education teacher training, as it provides a practical framework for understanding students’ drawings and adapting teaching. The validity of this approach is evident in the academic literature: a search in Google Scholar of “Lowenfeld repository thesis Final Degree Project after: 2021” yields approximately 4200 results (theses and final degree projects from the last five years), which indicates that universities that train future teachers continue to use Lowenfeld’s stages either as a conceptual basis or as a methodology of analysis in research.
However, Lowenfeld’s scheme has also been the subject of debate and revision. His approaches were questioned decades ago (Wilson & Wilson, 1982; Bremner & Moore, 1984), and contemporary authors point out the need to update them to respond to the realities of children in the 21st century (Alter-Muri & Vazzano, 2014; Elliot & Day, 2004). At the same time, numerous empirical studies support the importance of drawing in child development, and in many cases, they are supported by the evolutionary framework described above.
Current studies suggest that infant expression through drawing (framed in artistic experience) strengthens the capacity for abstraction and improves communication, cooperation, and problem-solving (Hansen & Oxoby, 2017; White, 2017) and fosters creativity and fluency of ideas by reducing inhibition and excessive self-evaluation, which often limit original expression (Kleinmintz, 2017). On the other hand, pedagogical interventions focused on artistic activities have been shown to accelerate certain aspects of cognitive development in childhood and improve problem-solving skills (Arapaki & Zafrana, 2004; Councill, 2015). In particular, drawing as a specific form of children’s artistic expression-positively influences overall infant development because it stimulates fine motor development and hand–eye coordination (Lo & Wang, 2024), promotes divergent thinking and inventiveness (Lozančić & Tot, 2020), and can even enhance social and emotional skills when drawing is done in collaborative contexts (Kouvou, 2016). Likewise, the continued practice of drawing from an early age helps to cement attention and concentration skills (Ma & Ma, 2024).
In relation to these benefits, several authors propose using drawing as a mediation tool for learning in areas such as science, which, due to its abstract nature, works with unobservable entities that can benefit from the creation of meaning in a symbolic way, modeling or codifying experiences (Chang, 2017; Kampeza & Delserieys Pedregosa, 2024). Other authors suggest that drawing fosters critical, creative, and constructive thinking (Penn, 2020; Masi, 2021) at a stage when language development is not yet present and provides a vehicle for communication and expression, as well as allowing for greater retention of concepts (Xie & Deng, 2023) and enhancing cultural and social understanding (Lodge, 2007) by stimulating imagination and creativity (Bukhalenkova et al., 2023) of the context of the child’s own community (Lodge, 2007; Bukhalenkova et al., 2023).
In addition to these benefits, child drawing is also a tool for early detection of possible delays, difficulties, or atypical cognitive development. The observation of graphic patterns in drawings, such as lack of proportion in the human figure, restricted use of space, excessive repetition of shapes or the absence of age-representative elements, can alert us to problems in motor, perceptual, or cognitive development (Burkitt et al., 2021). Several studies have shown that children with autism spectrum disorder (ASD) or communication difficulties tend to have differences in the spatial organization and content of their drawings (Cheng et al., 2025). Likewise, assessment of laterality, stroke pressure, and color use can provide information to identify learning disorders, anxiety, or emotional difficulties (Brajša-Žganec et al., 2017). Therefore, the analysis of children’s drawing not only contributes to the educational setting but can also serve as a tool for clinical and psychological assessment in early childhood.
For teachers, the interpretation of the drawings allows them to find information about the cognitive development of the students and to anticipate situations in which signs that may indicate learning or developmental difficulties are observed, favoring the implementation of adapted strategies and coordination with specialists in educational intervention.
Considering the theoretical and practical relevance of children’s drawing described so far, the present study aimed to empirically reevaluate Lowenfeld and Brittain’s developmental model in light of current conditions. Despite it being more than sixty years since the model’s formulation, Lowenfeld’s stages continue to be a mainstay in teaching and research on children’s drawing. Numerous recent works have employed them as a reference: some to apply them and corroborate their usefulness (Goodman et al., 2022; Vansieleghem, 2021; Permatasari & Zulkarnaen, 2022; Ülger, 2023; Farokhi & Hashemi, 2011), and others to question their limits and propose adjustments (Alter-Muri & Vazzano, 2014; Moerdisuroso, 2022; Quaglia et al., 2015). Overall, current evidence suggests that under standard conditions, infants go through the graphic stages in the order predicted by Lowenfeld (Permatasari & Zulkarnaen, 2022; Ülger, 2023), which would support the idea that artistic development accompanies cognitive development in parallel. Even in very different contexts—from studies on creativity and cognition to research with special education students (e.g., children with autism)—Lowenfeld’s developmental classification has been found useful for describing graphic progress, either confirming its diagnostic value or pointing out its limitations in particular cases (Suryadi & Fetrianggi, 2021; Ülger, 2023). At the same time, certain disparities between chronological age and the graphical stage reached have been documented. For example, Alter-Muri and Vazzano (2014), when studying children aged 6 to 12 years, observed that some infants of a given age drew with characteristics of a lower or higher stage than would be expected according to the model, thereby emphasizing that the chronology proposed by Lowenfeld is approximate and not strict. Similarly, Elliot and Day (2004) argue that Lowenfeld’s taxonomy no longer fully fits today’s children, pointing to the influence of sociocultural changes (e.g., the omnipresence of digital technology from an early age) on the forms of graphic expression. In summary, Lowenfeld and Brittain’s theory of the stages of child drawing remains a valid, but debated reference: it persists as a useful interpretative framework, although contemporary literature us invites to apply it with flexibility and to update certain criteria to reflect the diversity of rhythms and contexts of child development in the 21st century.
In view of the above, in this study, we set out to analyze the current validity of Lowenfeld’s developmental model in children aged 3 to 5 years. The research pursued a twofold objective. First, we sought to identify models of graphic representation that conform to the stages of expressive development proposed by Lowenfeld, taking as a reference pictorial productions made in the last five years. Secondly, we aimed to analyze the correspondence between the actual age of the authors of the drawings and the established classification, evaluating to what extent these categories are still relevant in the current context.
2. Materials and Methods
2.1. Participants
The study sample was composed of 218 subjects (n = 218), selected by convenience sampling (non-probabilistic). By age group, the sample was composed of 111 3-year-olds (50.9%), 35 4-year-olds (16.1%) and 72 5-year-olds (33%). As for distribution by sex, a predominance of girls was observed in the younger age groups (3 years), while in the 4- and 5-year age groups, the distribution was more balanced. Table 1 presents a detailed breakdown of the sociodemographic characteristics of the sample.

Table 1.
Sociodemographic characteristics of the sample of drawings collected.
2.2. Evaluation Instruments
An ad hoc evaluation instrument was designed in spreadsheet format (available at Zenodo, DOI: 10.5281/zenodo.15078567), which documents a database composed of 218 children’s drawings. This instrument collects sociodemographic variables (age, sex) as well as a series of graphic analysis criteria of a qualitative and evolutionary nature. These criteria were organized according to the stages of children’s graphic development proposed by Lowenfeld and Brittain, as shown in Table 2.
Table 2.
Analysis matrix for the classification of drawings.
The theoretical validity of the instrument used is based on its rigorous adjustment to Viktor Lowenfeld’s developmental model. Each of the operational criteria included in the analysis matrix—stroke, motor control, use of color, representational intentionality, symbolism, among others—was derived directly from the descriptions proposed by the author for the different stages of graphic development. This correspondence between indicators and theoretical constructs guarantees the content and construct validity of the instrument, by ensuring that what is evaluated faithfully reflects the essential aspects of the phenomenon studied.
2.3. Procedure and Design
The research followed a mixed design, combining quantitative and qualitative methods with a descriptive–comparative approach. An explanatory–predictive dimension is also incorporated to identify patterns in the relationship between the drawings analyzed and the proposed theories of graphic development, following the methodological orientation proposed by Gil-Ruiz and García (2024).
The data collection process involved the systematic evaluation of 218 children’s drawings collected in real educational contexts. These drawings were collected by students studying early childhood education during their internships in schools in the Community of Madrid and subsequently delivered to the research team for analysis. The team proceeded to classify the drawings using a spreadsheet designed ad hoc, assigning a unique identification number to each work.
In this data matrix, relevant information was recorded for each drawing, including the author’s age, the graphic stage assigned according to Lowenfeld’s developmental taxonomy, the categories of analysis, and detailed qualitative observations. Among the categories evaluated, aspects of the stroke, the degree of motor control, the representational intentionality, and the presence of symbolism in the composition (as well as other indicators, such as the use of color and spatial organization) were considered, which allowed for a detailed characterization of each drawing.
In order to ensure the reliability of the classification, each drawing was evaluated independently by at least two researchers on the team. Subsequently, the evaluators contrasted their initial classifications, and in cases of discrepancy, held joint review sessions to resolve differences and reach consensus on the final categorization.
This study adhered to ethical standards that prioritize integrity, confidentiality, and respect for all participants and stakeholders. Specifically, it followed the AERA (American Educational Research Association, 2011) standards and the recommendations of the British Educational Research Association (BERA).
In addition, to achieve methodological consistency, a best-practice protocol was adopted following the Declaration of Helsinki (World Medical Association, 2008), which is divided into two phases:
- Participants are informed about the nature, purpose, and methodological procedure, requesting their voluntary collaboration and explaining that they can withdraw from the program at any time.
- They are asked for informed consent, which specifies the confidential treatment of the data, limits their disclosure to the academic environment, and establishes a personal responsibility and a physical place for their custody.
The project was approved by the Ethics Committee of the University of Valladolid (PI 23-3402 NO HCUV) on 2 November 2023, ensuring compliance with ethical and data protection regulations.
2.4. Data Analysis
Data analysis was carried out in three complementary phases: delimitation of qualitative categories, quantification of frequencies, and mixed processing of the information collected. The procedures used in each stage are detailed below.
- a.
- Delimitation of typologies and categories of analysis
The analysis process considered multiple dimensions to evaluate the relationship between the graphic productions and the age of the children, allowing us to identify patterns and establish levels of correspondence between the theory and contemporary educational reality. This categorization was organized in stages of graphic development according to the age of the participants, thus facilitating the comparison between the expected evolution and the productions collected in the sample. Table 3 presents the main categories of analysis along with examples of observations that illustrate the key aspects evaluated at each stage.
Table 3.
Categorization of children’s graphic development: stages, analysis criteria, and examples of observation.
- b.
- Frequency quantification
The quantitative analysis was performed by verifying the frequency and distribution of the drawings in each of the established categories. The presence or absence of the characteristic features of each stage of graphic development was recorded and a data matrix was prepared to systematize the results. Figure 1 shows examples of the drawings analyzed.
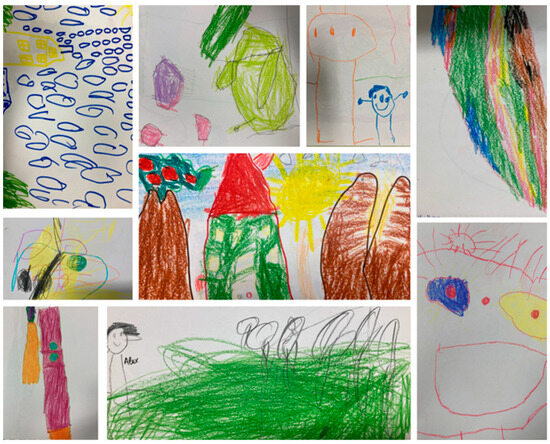
Figure 1.
Drawings of the sample aged 3 to 5 years.
The data obtained made it possible to calculate the relative frequency of each category within the sample and to examine the correspondence between the theoretical classification and the actual age of the children. In this way, it was possible to assess whether the distribution of the drawings conformed to the progression established by Lowenfeld or whether significant deviations were observed. The coded data were extracted from the assessment instrument developed for the study (see DOI: 10.5281/zenodo.15078567), which made it possible to apply consistent and replicable classification criteria.
- c.
- Data processing and interpretation
A mixed approach was adopted for data analysis, combining qualitative and quantitative techniques. At the quantitative level, a descriptive–comparative analysis was applied to determine the relationship between the children’s age and the categories of graphic development identified. Measures of central tendency and dispersion were used to describe the distribution of graphic productions.
To complement this descriptive analysis and to respond more precisely to the objectives of the study, a chi-squared test was applied. This made it possible to evaluate the association between the chronological age of the children and the graphic stage in which they were classified according to Lowenfeld’s model. The results showed a statistically significant association (χ2 = 104.92, gl = 10, p < 0.0001), which empirically supports the hypothesis that graphic progression is linked to the child’s age, albeit with individual differences.
Likewise, a Spearman correlation was calculated between age and the graphic level reached, ordinally coding the stages of development. The coefficient obtained was rho = 0.661 (p < 0.0001), indicating a moderate–high positive relationship between both variables. This result reinforces the validity of Lowenfeld’s model by showing that in general, graphic development progresses with age, although there may be cases of progress or delay due to individual or contextual factors.
As for the qualitative analysis, the drawings were interpreted according to narrative and expressive criteria, exploring emerging patterns in the graphic representation. The internal coherence of each production, the intentionality of the line, and the way in which the children organized space and color in their representations were examined.
This approach made it possible to contrast the validity of Lowenfeld’s model in the current educational context, identifying possible variations in the graphic manifestations derived from changes in the teaching–learning processes, technology, or access to new means of expression.
This triangulation of methods made it possible to obtain a rich and coherent picture of children’s graphic development in the age range studied, providing solid evidence both from the observational approach and from descriptive statistical analysis.
3. Results
Figure 2 shows the distribution of the 218 drawings analyzed according to their classification in one of the five developmental categories of Lowenfeld’s model. This categorization was not only based on the chronological age of the students but also on the graphic characteristics observed in each production, according to criteria such as the type of stroke, motor control, representational intentionality, or the use of space. The figure therefore illustrates the number of drawings that were assigned to each evolutionary stage of graphic development, regardless of the course or age group from which they originated.
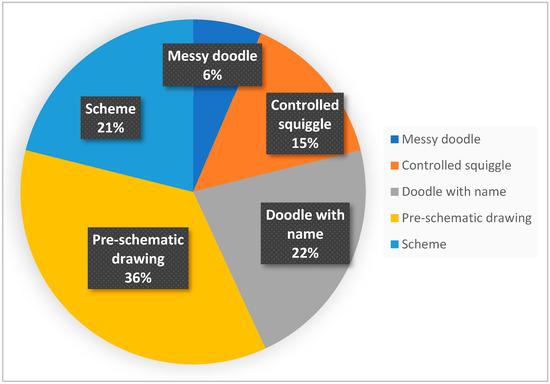
Figure 2.
Drawings organized by categories.
Comparative Descriptive Analysis
The aim of the descriptive analysis was to determine whether the progression of children’s graphic development in the sample analyzed followed Lowenfeld’s theoretical structure. For this purpose, measures of central tendency (mean, median, and mode) and dispersion (range and standard deviation) were used to describe the distribution of graphic productions in relation to the age of the infants (Table 4).
Table 4.
Summary of actual ages of participants by categories of analysis.
As for the disordered scribbling, we found 14 drawings (Figure 3) that belonged to the actual age of 3 years. Lowenfeld’s theory states that this stage occurs in children aged 0 to 2 years, so we found a considerable deviation from the proposed chronology.

Figure 3.
Drawing classified as disordered doodle.
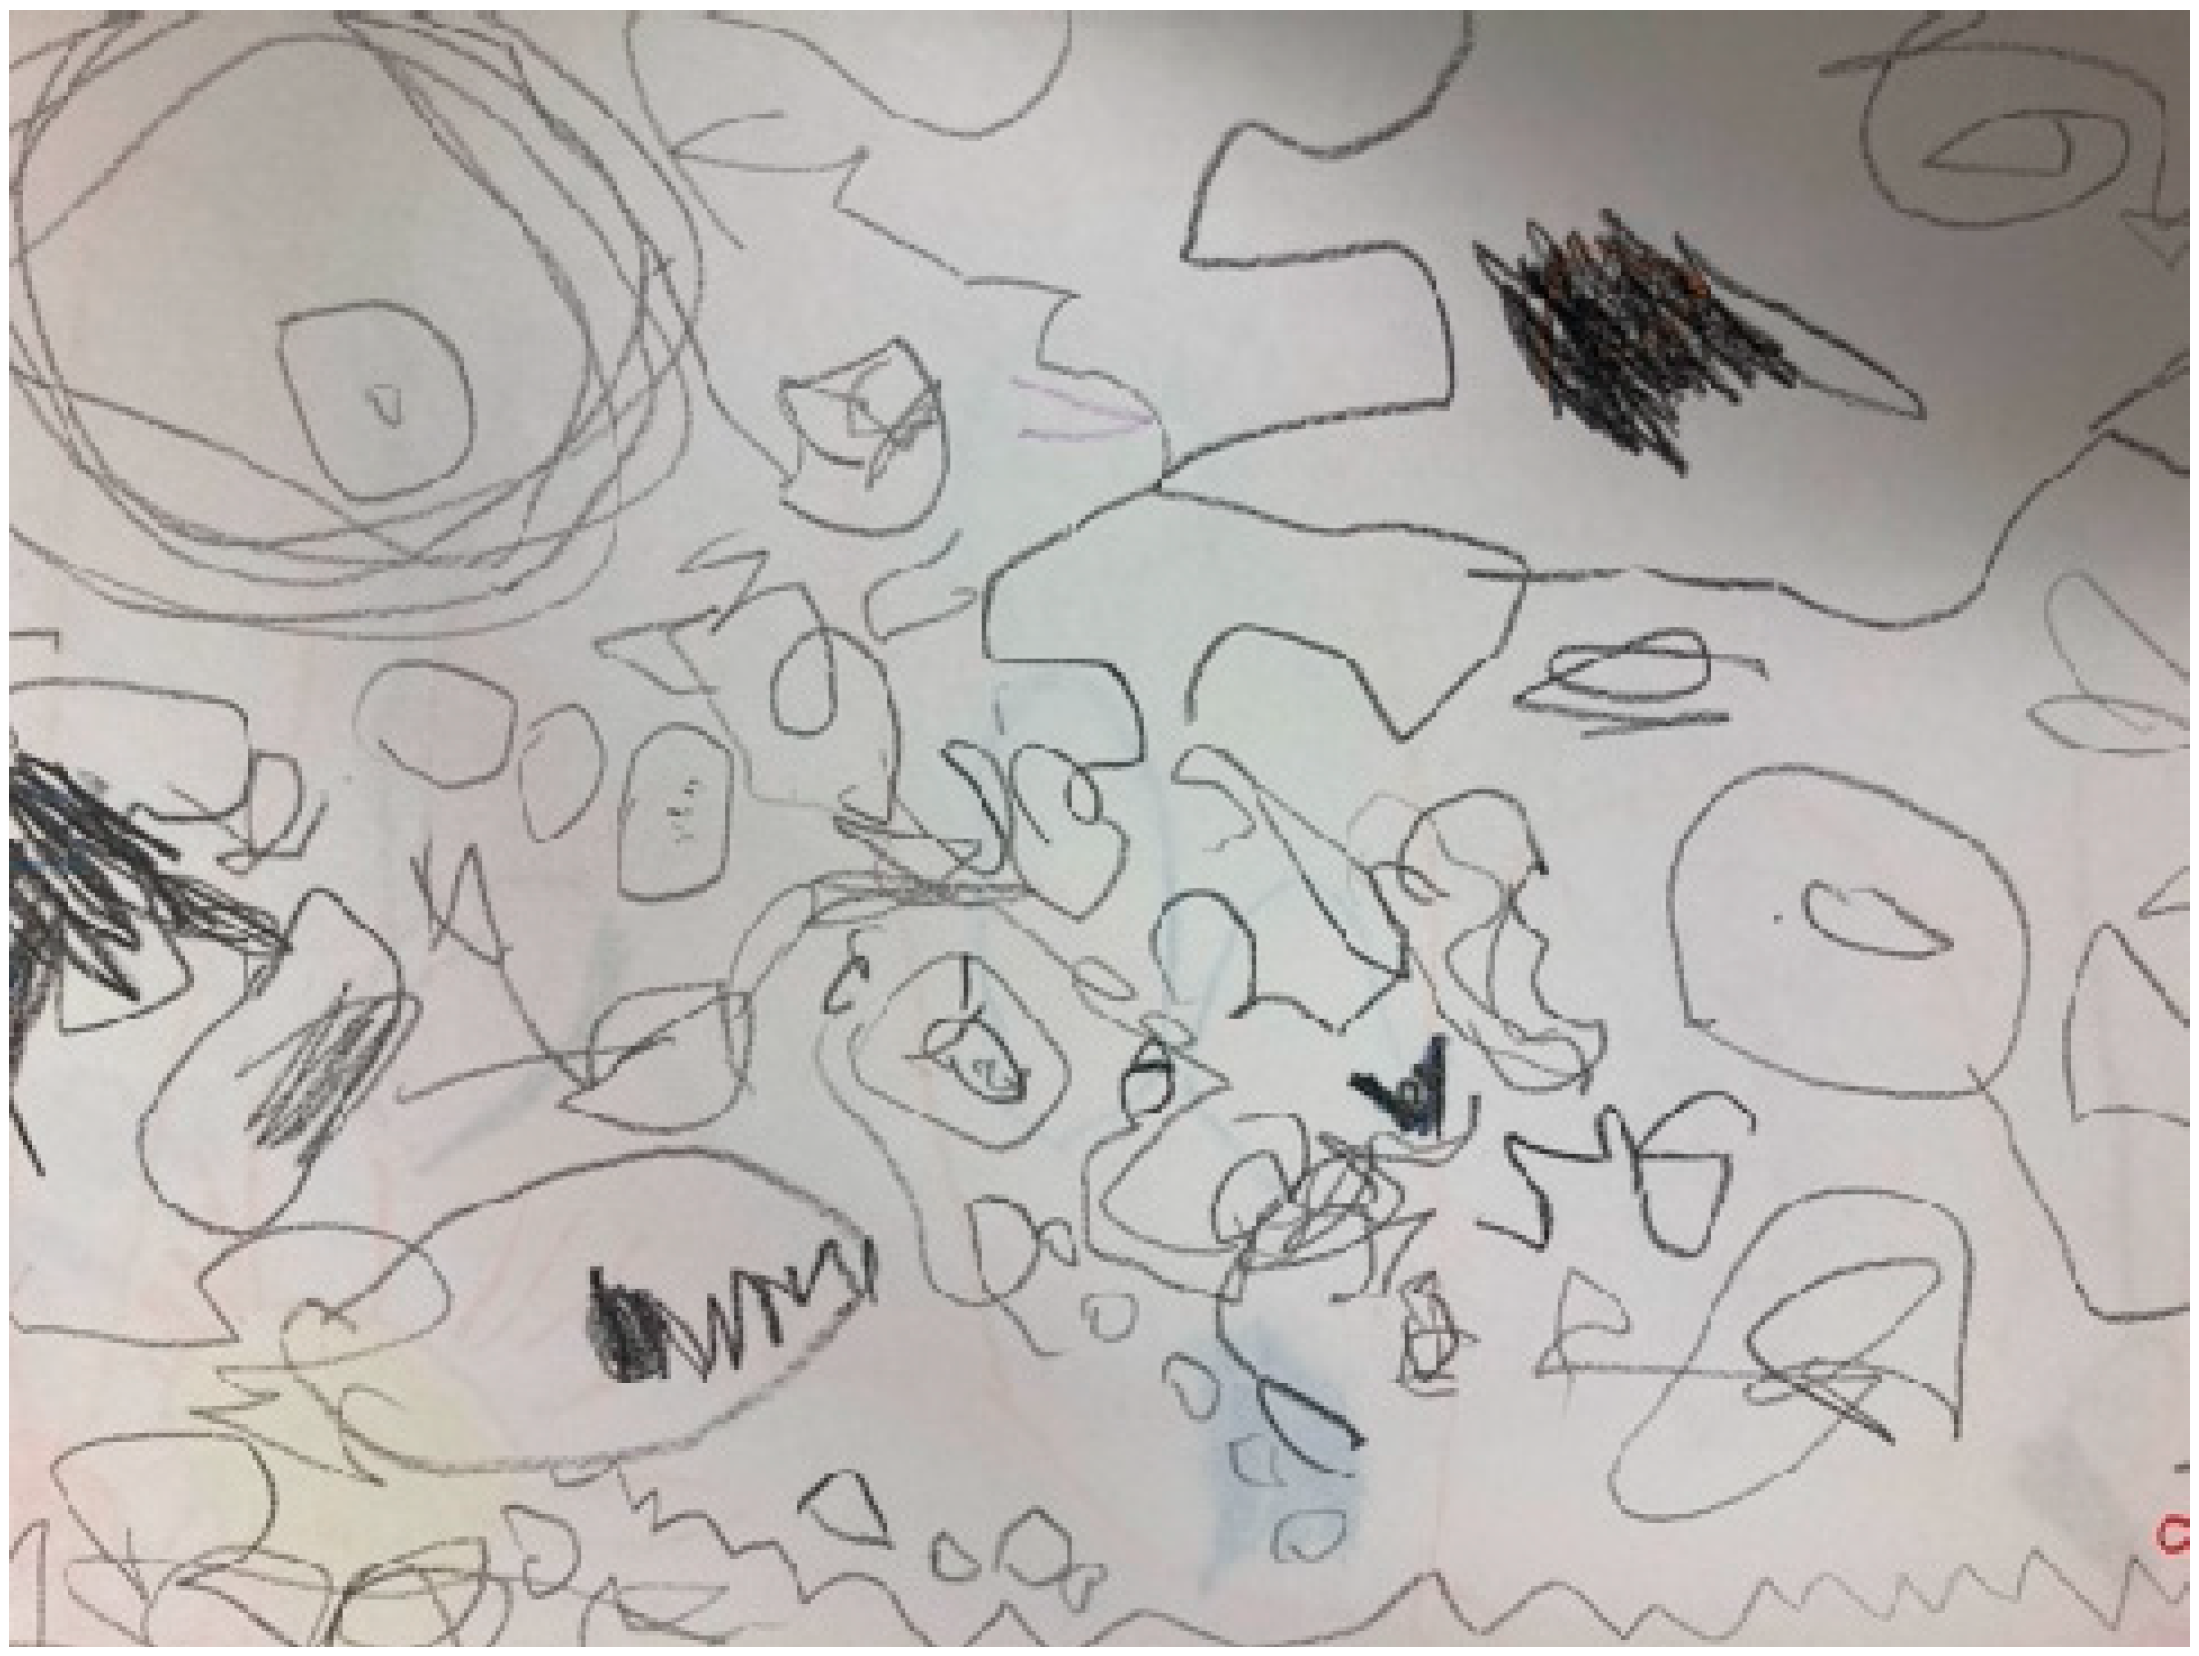
As for controlled scribbling, we classified 32 drawings as in this category (Figure 4). This is a phase in which infants discover the connection between their movements and the strokes they execute on paper, which usually occurs around the age of three. The drawings represent an improvement in visual–motor coordination, they repeat patterns such as horizontal and vertical lines and circles, and sometimes associate their scribbles with objects or experiences in their environment. Control of scribbling reflects progress in other areas of their development, such as the ability to manipulate objects (fitting pieces into a puzzle, pouring water into a glass, eating with a spoon or fork, turning the pages of a book) and is the beginning of visual–motor integration.

Figure 4.
Drawing categorized as a controlled doodle.
Of the 32 classified drawings, 31 corresponded to 3-year-olds, but we found 1 belonging to a 5-year-old infant. At 5 years of age, most infants already try to represent recognizable figures (houses, people, suns, etc.). If they still do controlled scribbling, it may be due to lack of interest in drawing, little practice with pencils, crayons, or art materials, or some difficulty in their fine motor development or visual–motor coordination.
As for the named doodles, we counted 48 drawings corresponding to the actual ages of 3 years (35 drawings), 4 years (7 drawings), 5 years (6 drawings). Most of the children in this category were 3 and 4 years old, which is consistent with Lowenfeld’s theory, which suggests that this stage appears around the age of three and a half years. However, 5-year-olds are still in this stage. What would be expected for this 5-year-old age group would be that they would be in the pre-schematic stage. Either due to lack of stimulation or due to delayed graphic development and possible cognitive or emotional difficulties, they could be affected in their development (Figure 5).
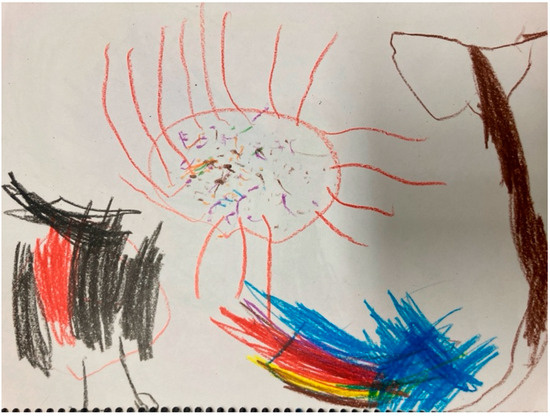
Figure 5.
Drawing classified as doodle with name.
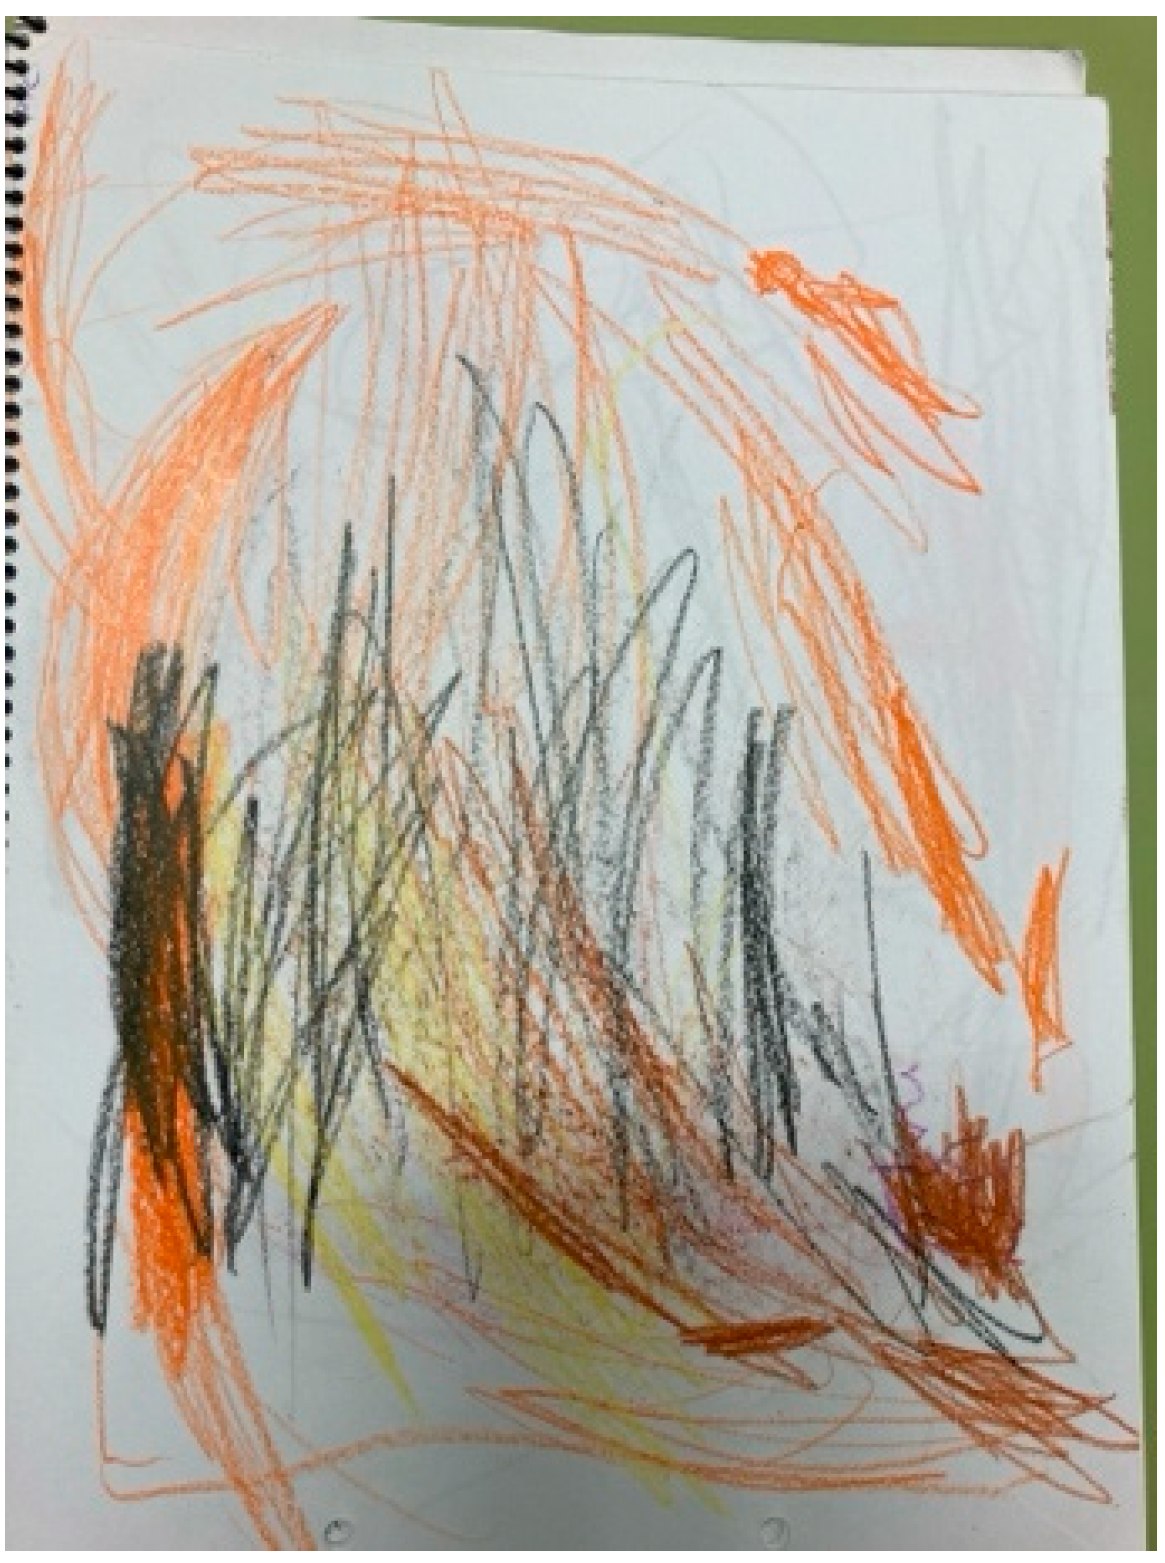
The category pre-schematic drawing yielded 78 samples with great variability in the ages, ranging from 3 to 5 years. Although the average ages were 4 and 5 years (33 and 14 drawings, respectively), there was a considerable presence of 3-year-olds (31 drawings). Figure 6 shows a representative example of this category, characterized by an increase in the level of spatial organization, the incipient use of symbolism, and greater structuring of the shapes represented.

Figure 6.
Drawing classified as pre-schematic.
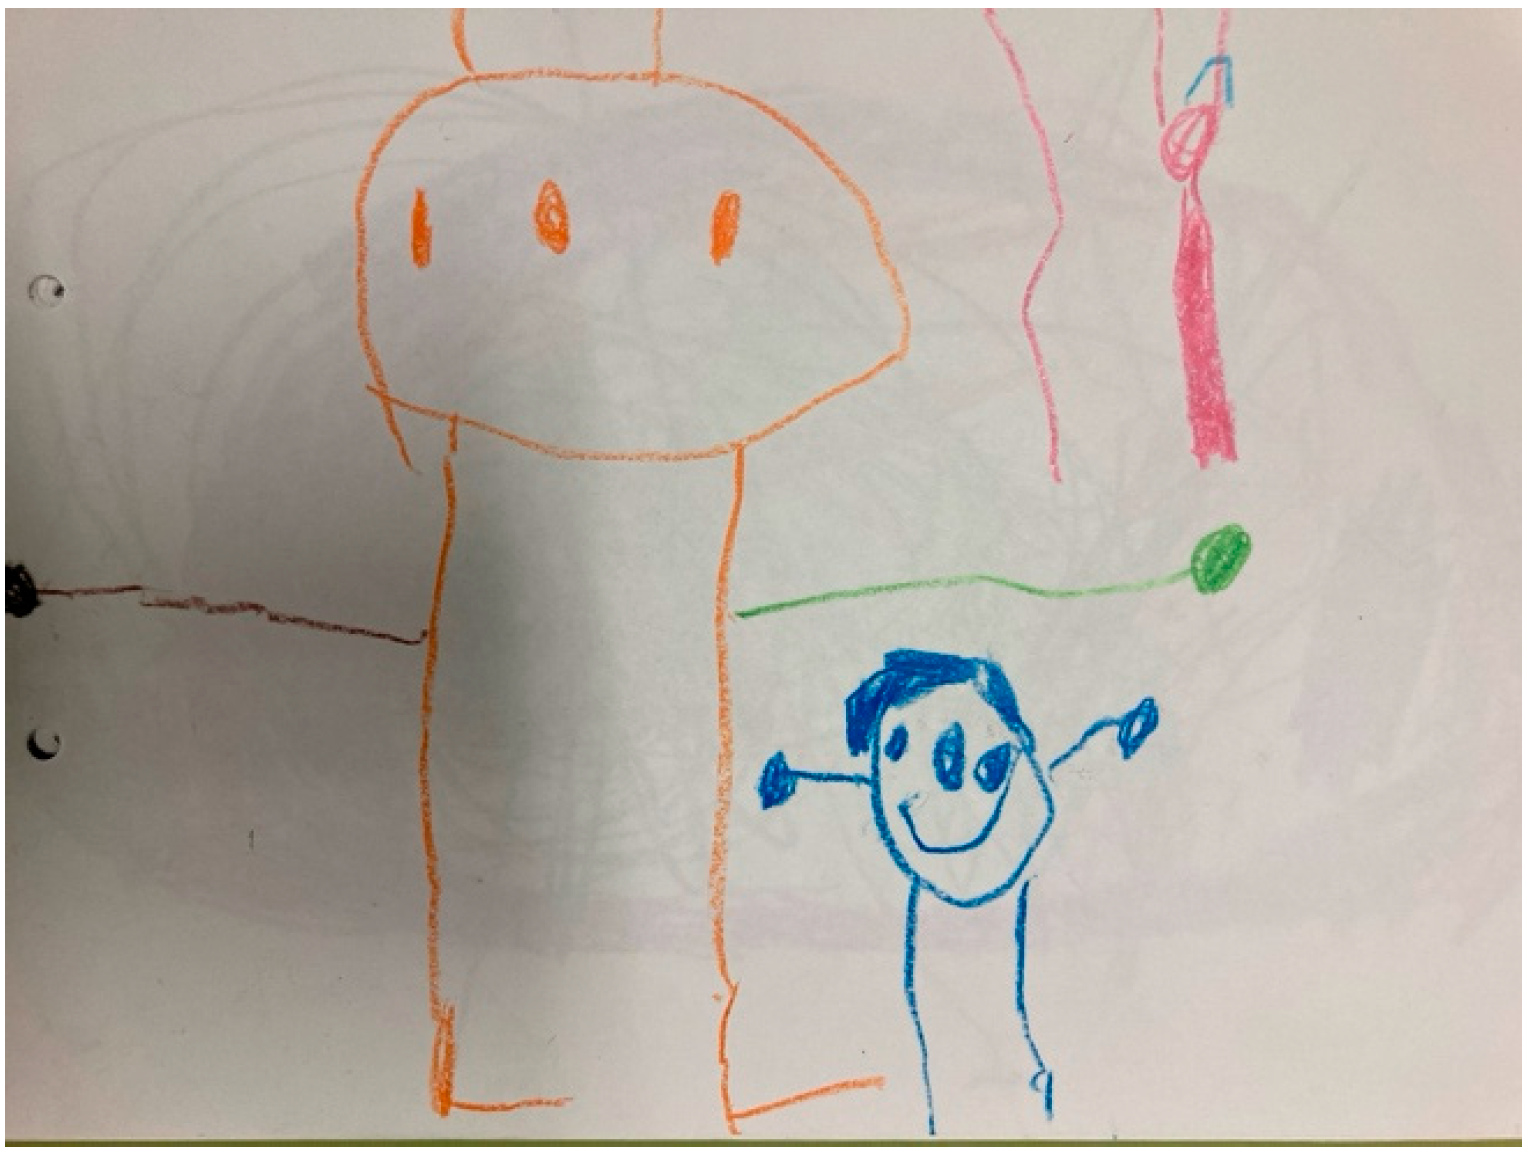
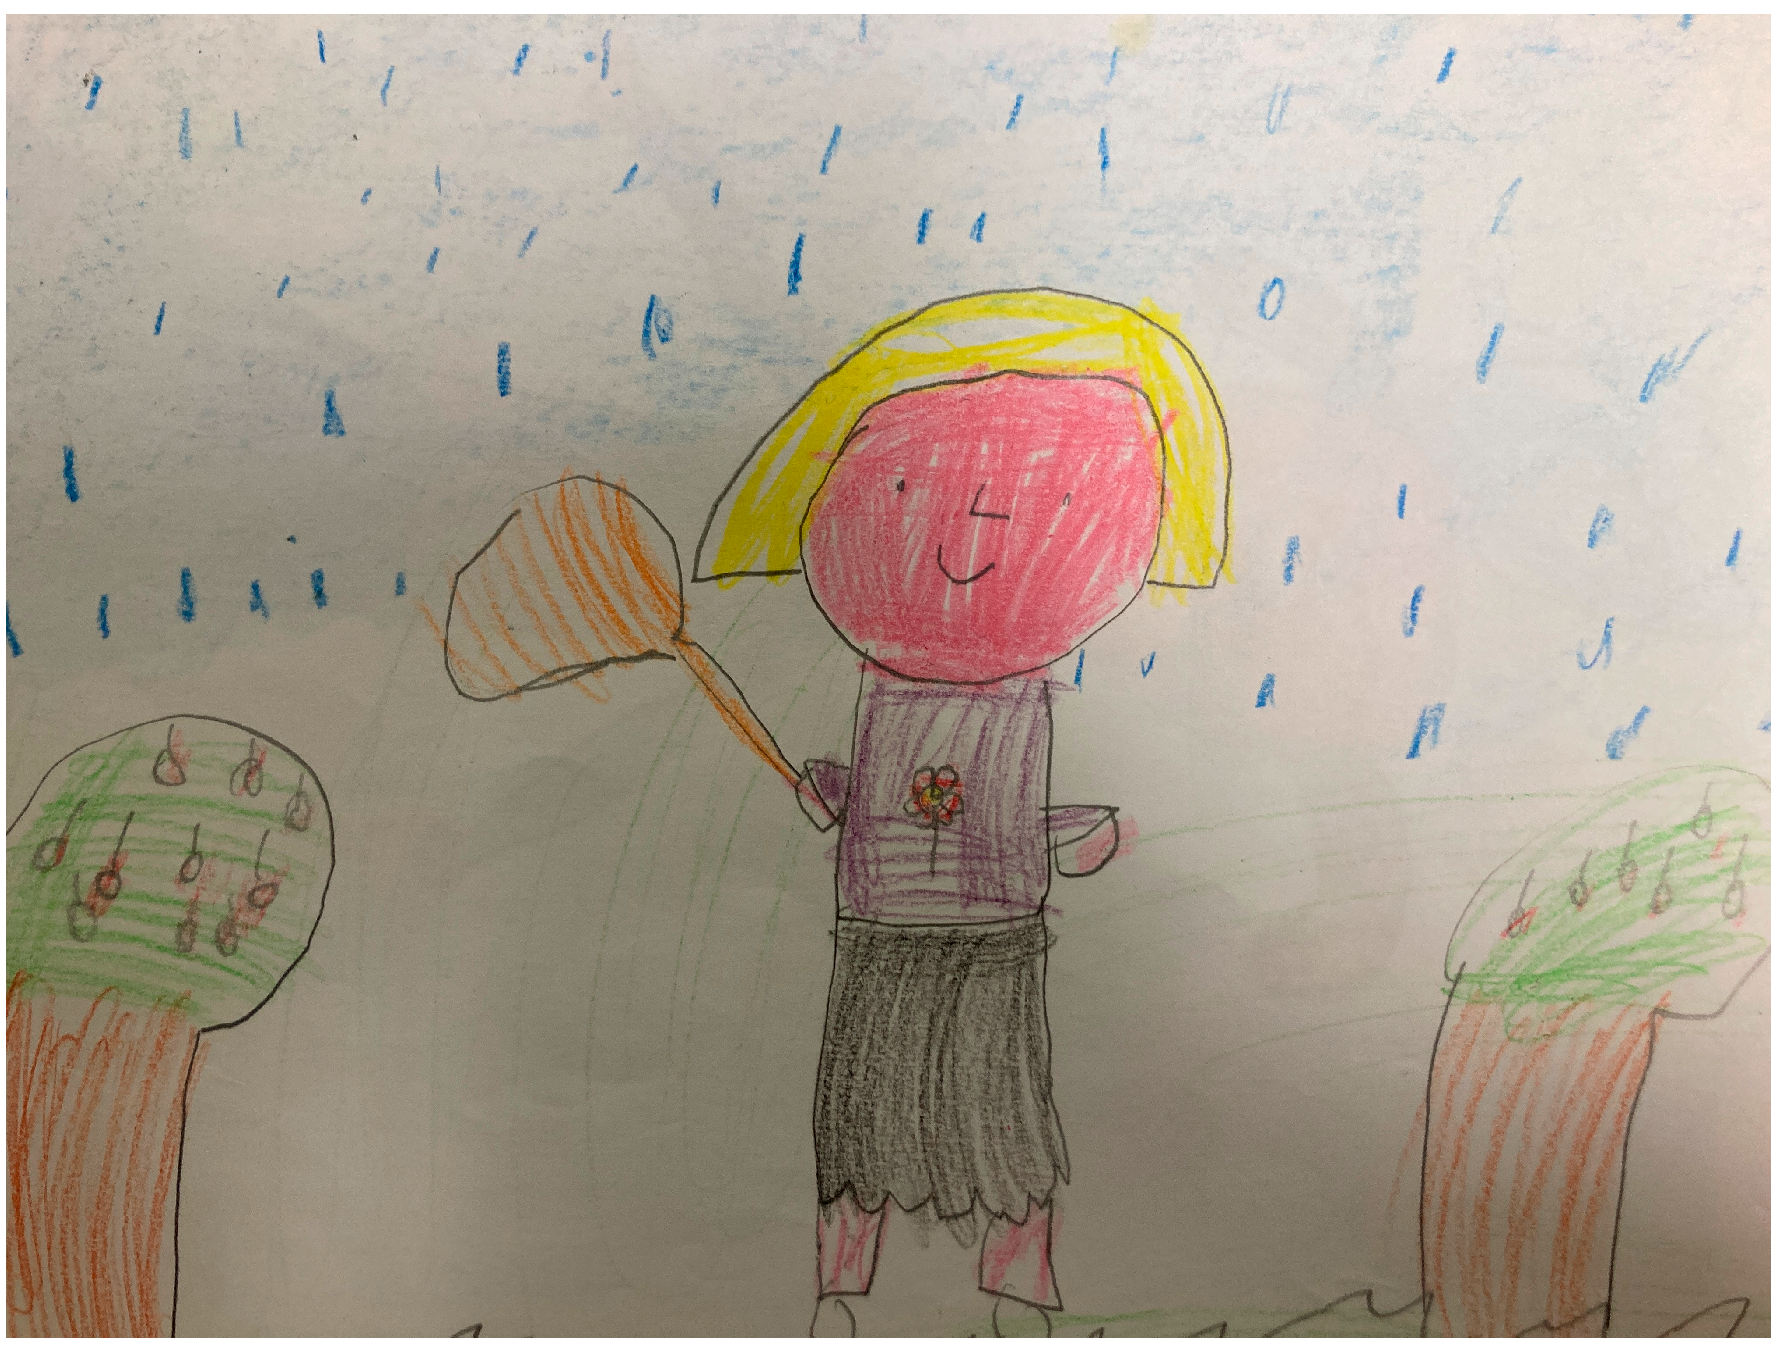
Lowenfeld associates the 7- to 9-year interval with the schematic stage. We found 46 drawings (see Figure 7) corresponding to this stage in the 4- and 5-year age ranges (14 and 32 drawings, respectively). Table 5 shows a summary of the results.
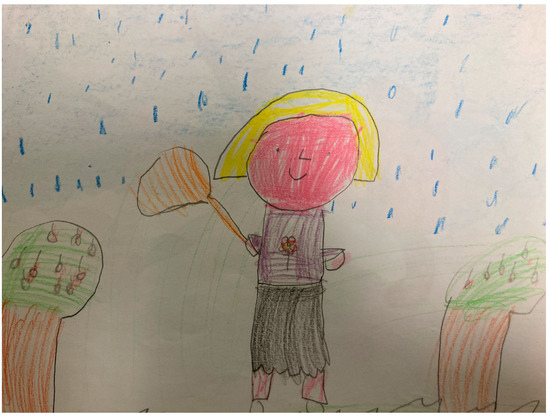
Figure 7.
Drawing categorized as schematic.
Table 5.
Summary of participants’ actual ages by analysis category.
Table 5 presents a comparative summary between the theoretical classification of the drawings according to Lowenfeld’s model and the actual ages of the participants in each category. The theoretical age range assigned to each stage by the model was taken as a reference, and cases were identified in which the drawings were classified in a stage other than the one that would correspond to the chronological age.
This table includes only those drawings whose final classification was considered valid after the process of double analysis and research consensus. Those productions that did not allow a reliable classification, due to formal ambiguity, low graphic quality, or absence of minimum evaluation indicators (for example, insufficient traces or deterioration of the support), were excluded from the comparative analysis because they did not meet the established minimum criteria.
4. Discussion
The present study aimed to analyze the contemporary validity of Lowenfeld and Brittain’s (1961) developmental model in the 3- to 5-year age group, evaluating whether the proposed stages correspond to the actual graphic production of boys and girls in the current educational context. The classic theory of Lowenfeld and Brittain (1961) postulates that children’s graphic development progresses through stages associated with stable age ranges. According to their model, infants transit through scribbling (2–4 years), the pre-schematic stage (4–7 years), and the schematic stage (7–9 years), until reaching a level of incipient realism in adolescence. However, the results of the present study indicate significant variations in the age of appearance of some of these stages, which invites us to reconsider the rigidity of the proposed age ranges.
One of the most outstanding findings was the precocity in the appearance of representative graphic manifestations. Features of the pre-schematic stage were observed in 3-year-old children, when theoretically scribbling should still prevail. Previous studies, such as that of Alter-Muri and Vazzano (2014), suggested that the actual development observed in some groups did not conform to the expected stages according to the chronological age proposed by classical theory. Along the same lines, a study by Goodman et al. (2022) yielded similar results by suggesting that significant deviations from the model were found in infants from two Ugandan villages in the spatial representation proposed by the theory for the schematic stage where there is a marked horizontal baseline. Their drawings showed a strong preference for vertical patterns of spatial organization or vertical baselines, questioning whether Lowenfeld’s model is valid for non-Western cultures.
However, Permatasari and Zulkarnaen (2022) empirically validated Lowenfeld’s early stages, observing a progression according to age from controlled scribbling to drawings with representational intent. In their research, they subjected the drawings of the 5- to 6-year group to analysis, finding a correlation with the pre-schematic stage at 4–7 years of age, with incipient representation of recognizable figures, but still with poorly defined proportions and spatial bases.
In our study, however, we found a considerable sample (n = 47) of drawings that were ahead of their triennial stage. Although the developmental stages coincide, the age ranges show disparate chronologies. Similarly, and with age ranges around 13 years, Ülger (2023) showed how students presented characteristics of the developmental stage corresponding to their age, but accompanied by some features of the previous stage, evidencing a transition period between stages.
The results of our study show cases of prolonged persistence in early stages. One 5-year-old infant continued in the controlled scribbling stage, when he should already have been in the transition to the pre-schematic stage. In another interval, with an actual age of 5 years, six infants were drawing at an earlier stage (3–4 years). As suggested by Alter-Muri and Vazzano (2014), we could interpret these mismatches as a lack of cognitive maturity or else by a specific sociocultural context, as it suggests that less exposure to graphic materials or a disinterest in artistic activity could explain these differences in developmental pace. In line with Ülger (2023), who found a significant correlation between cognitive and artistic development, we could suggest the incorporation of more artistic activities in those infants with limited cognitive development.
Another relevant aspect is the presence of realistic elements at early ages. Attempts at proportional representation and advanced details were found in infants aged 4 to 5 years, which contrasts with the schematic stage described by Lowenfeld from the age of 7 years. The omnipresence of digital technology and contemporary visual culture may be accelerating certain representational abilities, as suggested by Moerdisuroso’s (2022) study.
Despite these variations in chronology, the study confirms that the general sequence of graphic development follows the scheme proposed by Lowenfeld and Brittain (1961), albeit with differences in the pace and manifestation of each stage. This is consistent with the findings of Permatasari and Zulkarnaen (2022), who found that while the progression of stages follows a recognizable order, the rate of advancement varies according to the infant’s environmental and personal conditions. Therefore, the starting theory of the present study remains valid as a descriptive model, but should be understood with greater flexibility to adapt to contemporary realities.
In theoretical terms, in line with the suggestions of Ülger (2023), our study proposes that children tend to go through the proposed stages, validating the general sequence proposed by Lowenfeld, but with significant variations in the age of appearance of each phase according to the cultural and sociotechnological context, as reported by Goodman et al. (2022) and Permatasari and Zulkarnaen (2022). These discrepancies—children advancing precociously or remaining longer in early stages—require questioning the classical chronology. In this sense, recent literature emphasizes that although Lowenfeld’s basic structure is sound, its application requires flexibility and updating (Elliot & Day, 2004; Alter-Muri & Vazzano, 2014), integrating current approaches that contemplate individual and cultural diversity.
From a methodological perspective, the study vindicates children’s drawing as a tool for systematic observation in the educational context. Beyond its creative dimension, drawing is positioned as a graphic language with diagnostic capacity, especially relevant at early ages, when verbal skills are still developing. As recent studies have pointed out (Goodman et al., 2022; Quaglia et al., 2015), drawings allow access to aspects of cognitive, emotional, and motor development that are not always detectable through standardized tests. Elements such as the proportion of the figures, the spatial distribution, the detail, or the use of color offer interpretative clues about the child’s symbolic thinking, his or her representational capacity, or possible affective blocks. In this sense, qualitative observation of drawing is consolidated as an effective, non-invasive, and culturally sensitive methodology for interpreting child development in the classroom.
5. Conclusions
The aim of the research was to determine whether the current drawing representation patterns of the 3- to 5-year age group conform to the developmental stages proposed by the Austrian art pedagogue Viktor Lowenfeld. The children went through the artistic stages in the expected order, which is evidence that the theory is still valid as a descriptive framework for children’s graphic development. However, the rate and age of transition between stages varied significantly from child to child, indicating that the originally defined age intervals are not absolute, but should be applied flexibly. Additional adjustments or sub-stages could even be envisaged to reflect new forms of contemporary graphic expression.
The study revealed remarkable variations in the age at which the different stages of drawing emerge. Children as young as 3 years old showed features of the pre-schematic stage, ahead of what theory predicts for that age (Farokhi & Hashemi, 2011). Realistic details were observed in drawings from 4 to 5 years of age, despite Lowenfeld placing the appearance of consolidated graphic schemes at around 7 years of age. These discrepancies show that the chronology of appearance of the stages is not uniform in all participants, which leads us to prioritize individual attention in order to find possible relationships with social, environmental, and early stimulation factors.
From an applied perspective, our results have implications for children’s art education. The persistence of early stages in some infants suggests the need for adjustments in teaching methodologies, promoting pedagogical strategies adapted to the diversity of developmental rhythms. Furthermore, given the potential impact of technology on the acceleration of certain graphic skills, it is advisable to integrate digital tools in art education to take advantage of this phenomenon in a pedagogically effective way.
Moreover, the pervasiveness of technology and digital images in everyday life appears to be advancing certain representational skills. The study provided evidence of more realistic drawing attempts at younger ages (21%), which suggests that access to digital media from early childhood may accelerate and reshape stages of graphic development. In other words, contemporary visual culture (television, tablets, drawing apps) provides models and stimuli that can advance the appearance of details and proportions in children’s drawings. The diversity in developmental rhythms observed and the influences of the current environment carry important educational implications:
We suggest a need to adapt art education classes in early childhood education to cater to the variety of graphic developmental rhythms, as suggested by Goodman et al. (2022), exploring inclusive methodologies so that each infant receives the appropriate support, either because he or she advances quickly through the stages or because he or she requires more time in some of them.
In summary, the main findings confirm the general validity of Lowenfeld’s (1947) theory for 3- to 5-year-old children, but qualify its details. The proposed sequence of stages remains observable, although the starting ages of each stage may vary more than the original theory suggested (Alter-Muri & Vazzano, 2014). Factors such as the availability of art materials, the motivation to draw, and the influence of technology are determinants in these variations. Therefore, the Austrian pedagogue’s theory remains valid, but must be interpreted flexibly, incorporating the realities of the current context to optimally support children’s graphic development (Vansieleghem, 2021).
As possible lines of future research, we suggest (1) large cross-cultural longitudinal studies that assess how factors such as exposure to technology, formal art education, or local traditions affect progress through Lowenfeld’s stages (e.g., a study of 200 drawings from different parts of the world to see global versus regional patterns), (2) integration of Lowenfeld’s theory with contemporary visual culture, investigating how children incorporate elements of digital media into their drawings and whether this requires extending scenic descriptions, (3) delving into special groups—replicating studies on autism with larger samples or exploring other cases (differently abled children, exceptional/precocious artistic talents, etc.) to observe how they go through the different stages, and (4) didactic applications—exploring pedagogical methods (creative intervention programs, teacher training by stage) to optimize artistic development at each stage.
Among the main limitations of this study is the small sample, as well as its geographic and cultural bias, given that the data were collected exclusively in schools in Madrid, Spain. These characteristics limit the generalizability of the results to broader or more diverse contexts. Consequently, it is suggested that future research should expand the sample size and incorporate comparative studies in different sociocultural settings, in order to enrich the external validity and applicability of the results.
Author Contributions
The conceptualization of the study was carried out by P.G.-R. and V.M.-V. The methodology was developed by P.G.-R. while V.M.-V. was responsible for the software used. Validation was conducted by P.G.-R., V.M.-V., W.O.T. and W.C.M. Formal analysis and investigation were performed by P.G.-R. and V.M.-V. and Resources were managed by P.G.-R., who was also responsible for data curation. The original draft was written by P.G.-R., while writing—review and editing were conducted by P.G.-R., V.M.-V. and W.C.M. Visualization was performed by W.O.T. and W.C.M., and supervision was undertaken by V.M.-V. Project administration was managed by P.G.-R. All authors have read and agreed to the published version of the manuscript.
Funding
This research did not receive external funding. However, it is linked to the Competitive Teaching Innovation Project: Creation of Educational Resources for the Development of Creativity (Code: PINE-FCCED2505).
Institutional Review Board Statement
This study was conducted in accordance with the Declaration of Helsinki and was approved by the Ethics Committee of the University of Valladolid (PI 23-3402 NO HCUV and approved on November 2023).
Informed Consent Statement
Informed consent was obtained from all subjects participating in this study.
Data Availability Statement
The data used in this study are available from ZENODO under the identifier https://doi.org/10.5281/zenodo.15078567.
Acknowledgments
This project was carried out in collaboration with the International Doctorate in Design and Collaboration at the University of Caldas, during the research stays of the authors Paula Gil-Ruiz and Victoria Martínez-Vérez in 2024–2025.
Conflicts of Interest
The authors declare no conflicts of interest.
References
- Alter-Muri, S. B., & Vazzano, S. (2014). Gender typicality in child artistic development: A cross-cultural study. The Arts in Psychotherapy, 41(2), 155–162. [Google Scholar] [CrossRef]
- American Educational Research Association. (2011). Code of ethics. Available online: https://www.aera.net/Portals/38/docs/About_AERA/CodeOfEthics(1).pdf (accessed on 24 May 2025).
- Arapaki, X., & Zafrana, M. (2004). The artistic expression of kindergarten children after a ‘guided’ teaching approach. International Journal of Phytoremediation, 21(1), 43–58. [Google Scholar] [CrossRef]
- Arnheim, R. (1983). Art and visual perception. Alianza. [Google Scholar]
- Boutonier, M. (1953). Les dessins d’enfants. Presses Universitaires de France. [Google Scholar]
- Brajša-Žganec, A., Penezić, Z., & Sorić, I. (2017). Children’s drawings and their psychological meaning. Psychology of Aesthetics, Creativity, and the Arts, 11(4), 456–468. [Google Scholar] [CrossRef]
- Bremner, J., & Moore, S. (1984). Prior visual inspection and object naming: Two factors that enhance hidden feature inclusion in young children’s drawings. British Journal of Developmental Psychology, 2, 371–376. [Google Scholar] [CrossRef]
- Bukhalenkova, D. A., Almazova, O. V., & Gavrilova, M. N. (2023). Assessment of imagination in senior preschoolers by educators. National Journal of Psychology, 18(4), 148–164. [Google Scholar] [CrossRef]
- Burkitt, E., Watling, D., & Murray, L. (2021). The relationship between children’s drawing strategies and their cognitive development. British Journal of Developmental Psychology, 39(3), 512–527. [Google Scholar] [CrossRef]
- Chang, N. (2017). Appropriate integration of children’s drawings in the acquisition of science concepts. In T. E. Lewis, I. Wong, & J. Herbst (Eds.), Drawing for science education: An international perspective (pp. 135–145). Brill Sense. [Google Scholar] [CrossRef]
- Chen, P. S., Wong, J., Chen, E. E., & Chen, A. L. P. (2025). Detecting autism in children through drawing characteristics using the visual-motor integration test. Health Information Science and Systems, 13(18). [Google Scholar] [CrossRef]
- Corman, L. (1967). The family drawing test. Kapelusz. [Google Scholar]
- Councill, T. (2015). Art therapy with children. In D. E. Gussak, & M. L. Rosal (Eds.), The Wiley handbook of art therapy (pp. 242–251). Wiley. [Google Scholar] [CrossRef]
- Elliot, W. E., & Day, M. D. (2004). Handbook of research and policy in art education (1st ed.). Routledge. [Google Scholar]
- Farokhi, M., & Hashemi, M. (2011). The analysis of children’s drawings: Social, emotional, physical and psychological aspects. Procedia—Social and Behavioral Sciences, 30, 2219–2224. [Google Scholar] [CrossRef]
- Gil-Ruiz, P., & García, A. (2024). Digital traces: Effect of artificial intelligence on the creative process. Encuentros. Revista De Ciencias Humanas, Teoría Social Y Pensamiento Crítico, 22, 14–27. [Google Scholar] [CrossRef]
- Goodenough, F. L. (1926). Measurement of intelligence by drawing. Harcourt, Brace and World, Inc. [Google Scholar]
- Goodman, G., Dent, V. F., Tuman, D., & Lee, S. Y. (2022). Drawings from a play-based intervention: Windows to the soul of rural Ugandan preschool children’s artistic development. The Arts in Psychotherapy, 77, 101876. [Google Scholar] [CrossRef]
- Hansen, P., & Oxoby, R. J. (2017). An earned presence: Studying the effect of multitasking improvisation systems on cognitive and learning ability. Connection Science, 29(1), 77–93. [Google Scholar] [CrossRef]
- Kampeza, M., & Delserieys Pedregosa, A. (2024). Young children’s symbolic representation in science: Insights into preschoolers’ drawings of change of state of matter. Educational Sciences, 14(10), 1080. [Google Scholar] [CrossRef]
- Kellogg, R. (1979). Analyzing children’s art. National Press Books. [Google Scholar]
- Kleinmintz, O. M. (2017). Creativity and its neural basis. In N. Silton (Ed.), Exploring the benefits of creativity in education, media, and the arts (pp. 67–90). IGI Global Scientific Publishing. [Google Scholar] [CrossRef]
- Koppitz, E. M. (1993). Drawing the human figure in children. Guadeloupe. [Google Scholar]
- Kouvou, O. (2016). Drawing with children: An experiment in assisted creativity. International Journal of Art Education and Design, 35(2), 275–290. [Google Scholar] [CrossRef]
- Lo, H.-C., & Wang, T.-H. (2024). A study on the design of embedded visual image teaching aids to assist young children’s cognitive and fine motor development. Journal of Intelligence, 12(10), 102. [Google Scholar] [CrossRef]
- Lodge, C. (2007). Regarding learning: Children’s drawings about learning in the classroom. Learning Environments Research, 10(2), 145–156. [Google Scholar] [CrossRef]
- Lowenfeld, V. (1947). Creative and mental growth. Macmillan. [Google Scholar]
- Lowenfeld, V., & Brittain, W. L. (1961). Creative and mental growth. Kapelusz Publishers. [Google Scholar]
- Lozančić, A. J., & Tot, D. (2020). Creativity and creation in early childhood and preschool education curriculum. Croatian Journal of Education, 22(1), 25–34. [Google Scholar] [CrossRef]
- Luquet, G. H. (1927). L’art néo-calédonien. In Les Travaux et Mémoires de l’Institut d’Ethnologie (Vol. 11). Université de Paris. [Google Scholar]
- Ma, Y., & Ma, E. (2024). The role of graphics tablets in the development of artistic and creative abilities of preschool children in multicultural education. Interactive Learning Environments, 33, 2585–2596. [Google Scholar] [CrossRef]
- Machover, K. (1949). Projection of personality in drawings of the human figure. Charles C. Thomas. [Google Scholar]
- Masi, C. (2021). Drawing to learn: A review of the literature. Drawing: Research, Theory, Practice, 6(1), 199–218. [Google Scholar] [CrossRef]
- Moerdisuroso, I. (2022). Reading children’s drawings through analysis of three metafunctions. JPUD—Jurnal Pendidikan Usia Dini, 16(1), 186–199. [Google Scholar] [CrossRef]
- Penn, L. R. (2020). Space for monsters and writers: Performativity in children’s classroom drawing. Contemporary Issues in Early Childhood, 21(3), 208–223. [Google Scholar] [CrossRef]
- Permatasari, D., & Zulkarnaen, Z. (2022). Analysis of the drawing stages of children aged 5–6 years. Early Childhood Research Journal (ECRJ), 5(2), 44–50. [Google Scholar] [CrossRef]
- Piaget, J. (1975). La formación del símbolo en el niño. Fondo de Cultura Económica. [Google Scholar]
- Quaglia, R., Longobardi, C., Iotti, N. O., & Prino, L. E. (2015). A new theory of infant drawing: Analyzing the role of emotion and movement in graphic development. Infant Behavior & Development, 39, 81–91. [Google Scholar] [CrossRef]
- Suryadi, A., & Fetrianggi, R. (2021). Case study of imaging outcomes of autistic children in middle school. In Advances in social science, education and humanities research (pp. 342–345). Atlantis Press. [Google Scholar] [CrossRef]
- Ülger, K. (2023). The investigation of 13-year-old students’ drawings according to Lowenfeld’s stages of artistic development and Piaget’s theory of cognitive development. Milli Eğitim, 52(238), 1011–1034. [Google Scholar] [CrossRef]
- Vansieleghem, N. (2021). Drawing lines: On the educational significance of drawing. Studies in Philosophy and Education, 40(3), 275–285. [Google Scholar] [CrossRef]
- White, M. H. (2017). Imagination in learning: Learning to imagine. In W. Schiller (Ed.), Issues in expressive arts curriculum for early childhood: An Australian perspective (pp. 99–111). Taylor & Francis. [Google Scholar]
- Wilson, B., & Wilson, M. (1982). Teaching children to draw: A guide for teachers and parents. Prentice Hall. [Google Scholar]
- World Medical Association. (2008, October 18). Declaration of Helsinki—Ethical principles for medical research involving human subjects. 59th General Assembly, Seoul, Republic of Korea. Available online: https://www.wma.net/es/policies-post/declaracion-de-helsinki-de-la-amm-principios-eticos-para-las-investigaciones-medicas-en-seres-humanos/ (accessed on 24 May 2025).
- Xie, H., & Deng, S. (2023). Drawing as a strategy for children to learn ancient Chinese poetry. Acta Psychologica, 240, 104039. [Google Scholar] [CrossRef]


Disclaimer/Publisher’s Note: The statements, opinions and data contained in all publications are solely those of the individual author(s) and contributor(s) and not of MDPI and/or the editor(s). MDPI and/or the editor(s) disclaim responsibility for any injury to people or property resulting from any ideas, methods, instructions or products referred to in the content. |
© 2025 by the authors. Licensee MDPI, Basel, Switzerland. This article is an open access article distributed under the terms and conditions of the Creative Commons Attribution (CC BY) license (https://creativecommons.org/licenses/by/4.0/).