Abstract
Using leveled books to ascertain students’ reading levels has been found to yield scores that are not sufficiently reliable and that lack criterion-related validation evidence. One reason for these findings is the sole reliance on content validation to level books. We present in this study a demonstration of an integrated leveling process for assessing the complexity of text passages. The procedure, which capitalizes on conventional test development practices such as field-testing items, contains a built-in validation process that allows for the selection of text that falls along a confirmed gradient of difficulty, from easy to advance levels of challenge. The integrated leveling process applies both well-established procedures for assessing text levels of complexity as well as a thorough item analysis of the books through pretesting. The resulting assessment tool provides rich information to identify student competencies and needs, inform instructional decisions, and document progress.
1. Introduction
Estimating the complexity or difficulty of text has been one of the more ubiquitous research topics in educational research for many decades. Since the early days of the McGuffey readers in the 1830s, several quantitative and qualitative approaches have been developed to assess text readability for the primary purpose of targeting text to a reader’s proficiency level. The importance of matching the reader and text is driven by the purpose of the task. If the goal is for instructional purposes, precision may be less critical, but if the goal is to make a high-stakes decision, such as for student screening or placement purposes, the reliability and validity of the book difficulty level are of the utmost importance.
Because there are numerous properties of text that can be considered to scale difficulty, leveling systems tend to focus on either quantitative aspects of text that can be coded and counted or qualitative features that require human judgment (Chall, 1958; Council of Chief State School Officers, 2010). Commonly used quantitative methods, such as the Flesch–Kincaid Grade Level formula (Kincaid et al., 1975) and Lexile Framework (Stenner, 2023), rely on features such as word frequency, average sentence length, sentence count, and number of prepositional phrases. Language conventionality, depth of meaning, text structure, knowledge demands, and age-related content appropriateness and interests are some features that commonly are captured by qualitative leveling models (Fisher et al., 2012).
Quantitative and qualitative text features are not duplicative, and thus, applying the respective set of features will not produce the same ordering of text from least to most complex. Chall (1958) equated the difference in readability measurement to personality assessments—some were survey-based that produced quantitative scores, while others were projective tests that provided the examiner deeper insight into the intricacies of an individual’s personality that the broad-based quantitative measures could not detect. The focus on different text features between the two approaches was documented by Cunningham et al. (2005) when they found that only 60% of the book level variance of qualitatively coded text could be explained by 18 codable text features. None of the word-level features correlated with the order of books by level. Similarly, Hiebert and Tortorelli (2022) found that no word-level features were included among the five characteristics that explained 80% of the book level variance among three qualitatively leveled systems. The most predictive metrics (semantics, syntax, structure, mean sentence length, and number of words) were those that were closely aligned with the text characteristics commonly considered in qualitative leveling procedures.
Leveling systems also vary greatly in the degree to which their reported difficulty levels have been validated. Generally, qualitative leveling systems have been subject to far fewer validation analyses than quantitative systems, leading to concerns regarding the precision of qualitative book leveling. Issues with their reliability (Fawson et al., 2006; D’Agostino et al., 2021), diagnostic and screening accuracy (Parker et al., 2015; Klingbeil et al., 2023; Klingbeil et al., 2017), and accuracy of students’ book level assignments (Burns et al., 2015) have been raised. Students’ unique background knowledge, tester idiosyncrasies, and arbitrary cutscores are likely sources of text level score error, but another important source is the lack of validation evidence for qualitative leveling systems. The goal of this study was to develop a leveling approach that begins with qualitative leveling, but that incorporates field-testing followed by statistical item analysis into the design process. We demonstrate how adding this step during design can lead to a final set of books that likely will yield more accurate student reading levels. Thus, this approach integrates formative validation evidence into the developmental process.
1.1. The Role of Validation in Text Leveling
Not only have the features of text used to scale books and reading passages differed across quantitative and qualitative leveling methods, but the emphasis placed on validation evidence and the forms of validity relied on to justify levels have also differed. The reasons for these validity differences likely stem from their respective design and data collection approaches.
Qualitative approaches tend to start with a set of written characteristics that define various levels of text (see, for example, Peterson, 1991). Subject matter experts (SMEs) are tasked with assigning a level with descriptors that best match the features of a book or text passage. In this way, qualitative procedures are akin to SMEs applying a holistic scoring rubric to judge the level of each book (Pearson & Hiebert, 2014). Once SMEs have completed their tasks and have settled their rating discrepancies, the leveling process is mostly completed. Often, there are no additional analyses to confirm the accuracy of book levels.
The qualitative design approach is similar to the first stage of test development, where items are written or chosen to represent content standards or learning objectives. In the case of qualitative leveling, the content body is commonly based on a theoretical notion of the features that define various gradations of complexity. SME decisions essentially are judgments of the content and vertical alignment of the books and text level descriptors that define a domain to be tested. Through this process, content validation evidence is obtained to justify book levels.
Validation evidence based on content has been, for decades, one of the more controversial sources of validity. According to Sireci (1998), some measurement experts question whether content analysis produces validation evidence, whereas other psychometricians have argued for its criticality in establishing that a test measures what it was designed to measure. Few would argue, nonetheless, that content alignment alone is sufficient to make definitive validation claims. Lack of additional evidence, especially the forms that rely on student performance, led Pearson and Hiebert (2014) to conclude that, “To our knowledge, no one has conducted a direct validation of any of these leveling systems to determine whether the text assigned to a level provide just the right challenge for students judged (or more likely assumed) to be reading at that level”, (p. 162). Qualitative leveling methods have lacked the standing of quantitative methods because their developers have focused almost entirely on one source of validation evidence during the design phase, which has not only been construed as insufficient but also possesses the biases inherent in human judgment.
Quantitative methods generally have adopted a different approach to establishing text difficulty levels than qualitative methods. Whereas qualitative leveling focuses on assigning levels to a finite set of books or passages using a predetermined set of text features by level, quantitative methods strive to identify the most predictive formula based on an optimal set of text characteristics. Thus, the goal is to produce a generalizable equation that can be applied to as many books and passages as possible. Generating the best algorithm typically requires a finite set of previously leveled text. Many of the earlier quantitative methods relied on the same set of graded reading passages, which came from the McCall–Crabbs Standard Test Lessons in Reading (Klare, 1974–1975). More recent validation studies have adopted criterion indicators based on the difficulty levels of reading passages based on student performance data (for example, see Cunningham et al., 2018).
In a sense, the quantitative leveling procedure is akin to conducting a criterion-related validity study, with the previously leveled text serving as the external criterion. Typically, however, in a criterion-related validity study, a previously developed test is used to predict an established criterion-indicator to evaluate the predictive accuracy of the test in a summative manner. Given the aim to develop the “test” that best predicts the criterion, quantitative leveling has a validation process that is integrated into its formative design stage.
Some contemporary quantitative approaches are developed using more theoretically driven and iterative validation procedures. The Lexile system, a quantitative method based primarily on sentence length and frequency of words in print, was built in the 1980s on a theory of semantic and syntactic components that stipulates various levels of text complexity (Stenner, 2023; Stenner et al., 1983). The developers first generated separate prediction equations for semantic and syntactic features of Peabody Test items and reading passages with known difficulty values and then combined the two equations to generate an overall algorithm, which was validated and refined through the further prediction of 400 pilot test item p-values.
The development of a more recent Lexile system designed to capture the text complexity of early-grade reading passages represents an even more direct usage of student performance data as part of the production process. Fitzgerald et al. (2015) asked teachers to judge the complexity of text passages. Using Rasch measurement, the passages were scaled from easiest to hardest based on the teachers’ judgments. The authors also scaled the text passages using primary-grade students’ responses to maze tasks while reading the text passages. The correlation between the two resulting Rasch scales was 0.79. Once the passages were scaled, the authors identified the text features that best explained the gradation of passage difficulty using forest regression. The student empirical data, therefore, were used in conjunction with the teacher judgment data as concurrent validation of the scale. Note that, because the overarching goal of quantitative approaches is to identify universal algorithms to score other text passages, the student data were not used to refine or adjust the passage difficulties estimated from the teacher judgments.
In designing the Coh-Metrix system, Graesser et al. (2011) developed a computer-based program that produced multiple scores for a body of text on numerous word-level, sentence structure, and discourse-level elements. In the development phase, they conducted an internal structural validation study in the form of principal component analyses to determine which characteristics fit together to produce the best subscores. They identified an eight-factor solution that led to eight subscales that together represented the various levels of text and discourse features. Thus, a conventional validation process was incorporated into the design of the final multidimensional model.
It is not the case that validation analysis only occurs during the development stage of text leveling. Several summative cross-validation studies have produced evidence that text levels relate well to external measures. Nelson et al. (2012) evaluated the criterion-related validity of seven quantitative approaches by comparing the known difficulty of test questions and reading passages from standardized achievement tests to the text complexity of the passages computed using the seven different methods. The correlations between the metric values of text difficulty and assigned grade level of reading passages ranged from 0.50 to 0.80 on state tests, from 0.60 to 0.80 on the SAT-9, and 0.45 to 0.86 on the Gates–MacGinitie. Correlations between the metric scores and the average difficulty of the comprehension items that followed the passages ranged from 0.70 to 0.80 on the SAT-9 and 0.37 to 0.81 on the Gates–MacGinitie.
Cunningham et al. (2018) regressed 330 reading passage difficulties spanning grades 1 to college that were derived from students’ scores on embedded cloze items on the Flesch–Kincaid and Lexile Framework formulas. The authors found that word complexity was a better predictor than sentence complexity, but overall, both tools poorly predicted the grade level of the passages, leading the authors to conclude that both systems lacked sufficient levels of criterion-related validity.
There has also been a fair degree of validation research on qualitative methods. Many Informal Reading Inventories have been subject to extensive reliability and validity analyses (see Nilsson, 2008; Spector, 2005). Hoffman et al. (2001) found that when students read harder books from a leveled series, their accuracy and fluency decreased as a function of book level, a finding that has been supported in at least one other study (Center for Research in Educational Policy [CREP], 2009). Students’ assessed reading levels derived from qualitative methods also have been found to correlate with scores from other reading measures (e.g., CREP, Gómez-Bellengé et al., 2005).
Summative validation analyses, however, rarely, if ever, are relied on to adjust the difficulty of books or text passages. Often, validation studies performed after books have been leveled are not conducted by the individuals who leveled the books, and most summative studies are not designed to yield the psychometric information necessary to modify book levels. For qualitative methods that rely on content review as the sole source of validity evidence, incorporating conventional empirical item pretesting analyses into the design phase may dramatically improve the accuracy of leveled books.
1.2. Empirically Based Item Review Analysis in Test Development
The Standards for Educational and Psychological Testing (American Educational Research Association et al., 2014) contain eight standards that pertain to item development and review. Perhaps, the key standard in that area, Standard 4.8, states that item empirical analyses (when sample size permits) should be conducted to check the psychometric properties of items, and the resulting information should be used in conjunction with expert item review judgments. Rarely are standardized tests used for higher-stakes purposes developed without regard for Standard 4.8. Pretesting items by administering them to a representative sample of eventual test takers provides important psychometric information about the items as well as the degree to which they work together to produce sufficiently reliable and valid scores.
One major purpose for item pretesting is to estimate each item’s difficulty based on student performance (Livingston, 2006). This information is especially useful in leveling because experts are not only asked to review the content of books but also to judge their difficulty and order among the other books in the set. Though the judgment of item difficulty typically is not conducted as part of item review for standardized tests, there is a growing body of evidence that experts, although good at ordering items in terms of difficulty, tend to underestimate the difficulty of items (Urhahne & Wijnia, 2021), especially easy items (Sayin & Gören, 2023).
Another critical reason to pretest items is to examine if they fit the hypothesized scale (American Educational Research Association et al., 2014). Following the tenets of item response theory, items fit the scale when students expected to perform successfully on the items do perform well most of the time, and students not expected to perform well usually do not. Deviations from these expectations often result from poorly written items or because the scale is more multidimensional than expected. In terms of leveling, some possible reasons for book misfit (or error) may be text difficulty variance from page to page, or because student performance on a text is overly dependent on prior knowledge or other features of the book cued into by the student.
Pretesting also allows the developer to assess the internal consistency of items to the intended scale and to examine dimensionality, as was performed in the design of Coh-Metrix (Graesser et al., 2011). Most qualitative leveling systems assume a unidimensional model in which books or text passages fit on one scale. If too many items misfit the proposed scale, unidimensionality cannot be assumed.
Because it is common that not all items work well to fit the scale at their expected level of difficulty, test developers typically field test twice as many items as planned for the final operational form (Schmeiser & Welch, 2006). Items with poor fit, unacceptable reliability indices, or that are unexpectedly too easy or difficult for examinees are commonly removed. Pretesting books to gather psychometric information on how each one performs can serve the same purposes, resulting in books that work together well to define a unidimensional scale. If an ample supply of books is field-tested that vary in difficulty, there is a greater chance that an interval scale can be produced with books calibrated on the scale at equally spaced distances from one another.
Based on best practices of test development, we created a leveling procedure that addresses Standard 4.8 of the Standards for Educational and Psychological Testing (American Educational Research Association et al., 2014). The process integrates empirical item analyses and content review to capitalize on the advantages of human judgment, while at the same time adjusting and confirming book levels by scaling texts based on student data.
2. Materials and Methods
The integrated book leveling process we will describe involves three steps, including book selection and expert review to assign initial book levels, pretesting the books on a sample of students, and choosing the final book set based on a consideration of the expert review and empirical data. The process was first used to create a testing packet of books for first-grade students. We will describe the sample and procedures that we followed during the design phase of the testing packet.
2.1. Participants
Eight assessors collaborated with thirteen schools located in one of nine districts in five states in the United States of America to conduct book pretesting from mid-schoolyear to spring of 2022–2023. All eight assessors were white females with an average of 36 years of teaching experience and an average of 24 years of administering leveled books to students for testing purposes. Across the 13 schools, 129 first-grade (age 5 to 6) students were tested. Sixty-five students were male and 64 were female. The racial breakdown of the students was as follows: white, 49%, Hispanic, 30%, black, 15%, and Asian, 6%. The racial distribution of the sample closely matches the population distribution among schoolchildren in the USA.
Our goal was to identify schools located near assessors, but that together represented a wide swath of student demographics. The states varied in their location in the country, from the far west, central, northeast, and southeast. Two of the nine districts were in urban areas, four were considered suburban, and three were in rural communities. The overall reading achievement levels of the schools varied considerably. The percentage of students in each school that scored at or above state proficiency levels varied from 26 to 93 percent, with the average being 51 percent. There was also a diversity of students across the schools, the percent minority status varied from 15 to 93 percent. The majority of students at some schools were Hispanic, while at other schools, most students were either African American or white.
Because we set out to develop a book level scale that spanned the first-grade achievement spectrum, we employed a block randomization method that maximized the variance among students on reading proficiency. We did this by asking the teachers in the 13 schools to rank all first-grade students in their respective schools by reading level. We then randomly selected students from multiple reading level strata to participate in the study.
2.2. Procedures
The first step in the process was essentially akin to choosing the pool of items based on content review and analysis by a team of experts. The second step follows the general processes of empirical item analysis after the books have been administered to students, while the third step entails the final selection of books for the testing packet.
2.2.1. Step 1: Choosing and Assigning Initial Levels to a Pool of Books
Our plan was to develop a set of books that measured twenty distinct levels (1 to 30, skipping odd numbered levels starting at Level 10), with one book per level. Following good test development practices, we selected more books for field-testing than we planned to include in the final testing set. We set a goal of 75 books that met our purposes to pilot test. Some levels had four books while other levels had three or five books.
We started with a collection of 178 books from five publishers who were willing to provide books to be included in the testing packet. The books were initially screened by expert reviewers who removed books that contained stereotyped characters, demeaning representations of groups of people, or subject matter that was inappropriate for first-grade students. They also screened books that did not (1) provide teachers opportunities to observe student reading processes, (2) contain adequate levels of sentence and vocabulary complexity, or (3) represent a variety of genres. Sixty-eight books were removed from the pool during the initial screening.
The remaining 110 books were sent to a second group of SMEs who were asked to assign a level to each book based on the following criteria:
Text Structure
- Is the story grammar familiar?
- Is the organization structure of the text (sequence, description, devices like compare and contrast) appropriate for the age or grade level of the reader?
Language and Vocabulary
- To what degree will the vocabulary be familiar to readers?
- To what degree does the text contain content-specific or disciplinary language?
- To what degree does the text contain literary language (figurative, descriptive)?
Complexity of Plot
- Does the plot proceed in a straightforward manner (beginning, middle, end)?
- To what extent are their complexities such as multiple problems and solutions, flashbacks, flashforwards?
Levels of Meaning
- Is the text clearly understandable, or are there multiple interpretations of the important ideas or concepts?
- To what degree is the deep meaning challenging?
Maturity of Plot
- Are the problems in the texts understandable within the life experiences of students of the age or grade level?
- Are the characters the appropriate age?
Maturity of Subject Matter
- To what degree will the subject matter be familiar to young children?
- To what degree are unfamiliar topics suitable for young children?
Levels of Abstract Ideas
- Are ideas in the text familiar to the age of the reader?
- To what degree are the ideas in the text abstract?
Fiction and Nonfiction Genre
- To what extent is background knowledge needed to comprehend the text?
- To what extent are the concepts and content familiar?
The SMEs were also asked to rate each book on whether it was easy, average, or hard within the level, and to strongly agree to strongly disagree on whether the book should be included in the final set for field-testing. The 75 books with the highest ratings of (1) agreement on book level, (2) “average” difficulty for the level, and (3) agreement that they belonged in the final set to be field-tested were selected.
A final group of SMEs met in person to look at the 75 books in their entirety. With the books physically organized by level from 1 to 30 on a table, they were tasked with reviewing the assigned book levels while considering the adjacent level books and the leveling criteria, and making any adjustments to levels if necessary. Standardized book introductions were written by the SMEs for the final set of 75 books.
2.2.2. Step 2: Empirically Field-Testing the Book Levels
The initial book levels assigned by the SMEs were not construed as numeric levels void of measurement error. Instead, each book’s initial level was considered “within a band” of the assigned levels. The multistep processes that comprised Stage 2 were required to pinpoint more accurately the specific book level. Of course, as is the case with any assessment item, the book levels after Stage 2 also were expected to contain some measurement error, but the goal was to shrink the band to a much smaller confidence interval and to render an interval-like scale.
Creating the Book Forms
Each of the 75 books was randomly assigned to one of four forms, A–D. The forms were then paired and assigned to four possible testing blocks. The blocks were designed to produce a chain of overlapping books across the students. Each form was paired directly with two other forms and indirectly with a third form to create a chain of paired forms. For example, Form A was directly paired with Forms B and C, and paired indirectly through both Forms B and C, which were directly paired with Form D. Each participating student was randomly assigned to one of four testing blocks, with about 32 students per block.
Establishing Testing Procedures
The eight assessors were trained on the testing protocol and research procedures. They coordinated with school personnel to schedule in-person testing. Students were asked to read the books from the forms they were assigned according to their block. For example, students assigned to Block 1 were asked to read books from Forms A and B. Assessors were asked to randomly choose one of the two book forms to begin testing. Roughly half of the students in Block 1 started with Form A, while the other half began with Form B to avoid possible practice or fatigue effects.
A key goal at this juncture was to ensure that (1) each book received enough student reads to optimize the book’s difficulty estimation, and (2) to ensure that each book was read by students who did not find the book far too easy or hard. It also would have been unfeasible to ask students to read all 40 books that comprised their assigned blocks. Not only would it have been too time-consuming, but the students likely would have found many of the books too easy or difficult, which would have led to many of the reads being useless to place the books in the proper order of difficulty on the scale. Instead, we created a testing situation in a similar manner to how a testing company would go about vertically equating its grades 3 through 8 assessments by having a ladder of common items on adjacent grade level tests.
Assessors were instructed to begin testing one book level below the level indicated by the students’ proficiency ranking, and to continue up the book levels (skipping levels if appropriate) until a student read a second book level at under 90% accuracy (the two sub-90% accuracy reads did not have to be consecutive). They were given the option to stop a student’s testing after one below 90% accuracy reading if the student showed signs of frustration or scored significantly below 90% with a loss of meaning and little to no self-correction. Otherwise, the assessors continued until a student read a second book below 90% accuracy. In cases in which a student read the starting book below 90% accuracy, assessors were instructed to ask the student to read the next lowest level book. If the student reads that book at less than 90 percent accuracy, assessors continue down book levels until the student reads one book at 90 percent or greater accuracy.
After testing stopped on the first assigned book form, assessors were instructed to ask the student to read three books from the second assigned book form, starting with two levels below the level for which testing was completed on the first form and finishing at the same level for which testing stopped on the first form. Figure 1 provides an example of how testing proceeded according to the protocol. The figure depicts a scenario in which the assessor commenced testing at Level 4 because the school ranking sheet indicated the student was reading at Level 5. Testing continued until Level 9, which was the level the student read below 90% the second time. The tester then asked the child to read Levels 7ߝ9 of the second form.
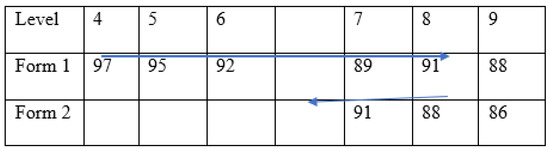
Figure 1.
Testing protocol example. The blue arrows represents the sequence of books presented to the hypothetical student, and the cell entries indicate the hypothetical accuracy score of the student.
Besides recording the accuracy of each reading, assessors scored the student’s fluency using the four-point NAEP Oral Reading Fluency Rubric (United States Department of Education, 1995). The accuracy and fluency scores from the readings served as the primary outcomes used to scale the books.
3. Results
The 129 students read an average of seven books during testing (minimum of 2, maximum of 16) for a total of 931 readings over the 75 books. The raw accuracy scores were not considered suitable for scaling directly because many of the values between 0 and 100 had no observed scores, and most of the scores tended to be clustered from about 85 to 100. To produce a more manageable accuracy scale for data analysis, the values were recoded from 0 to 100 into a 0–20 scale while maintaining score order.
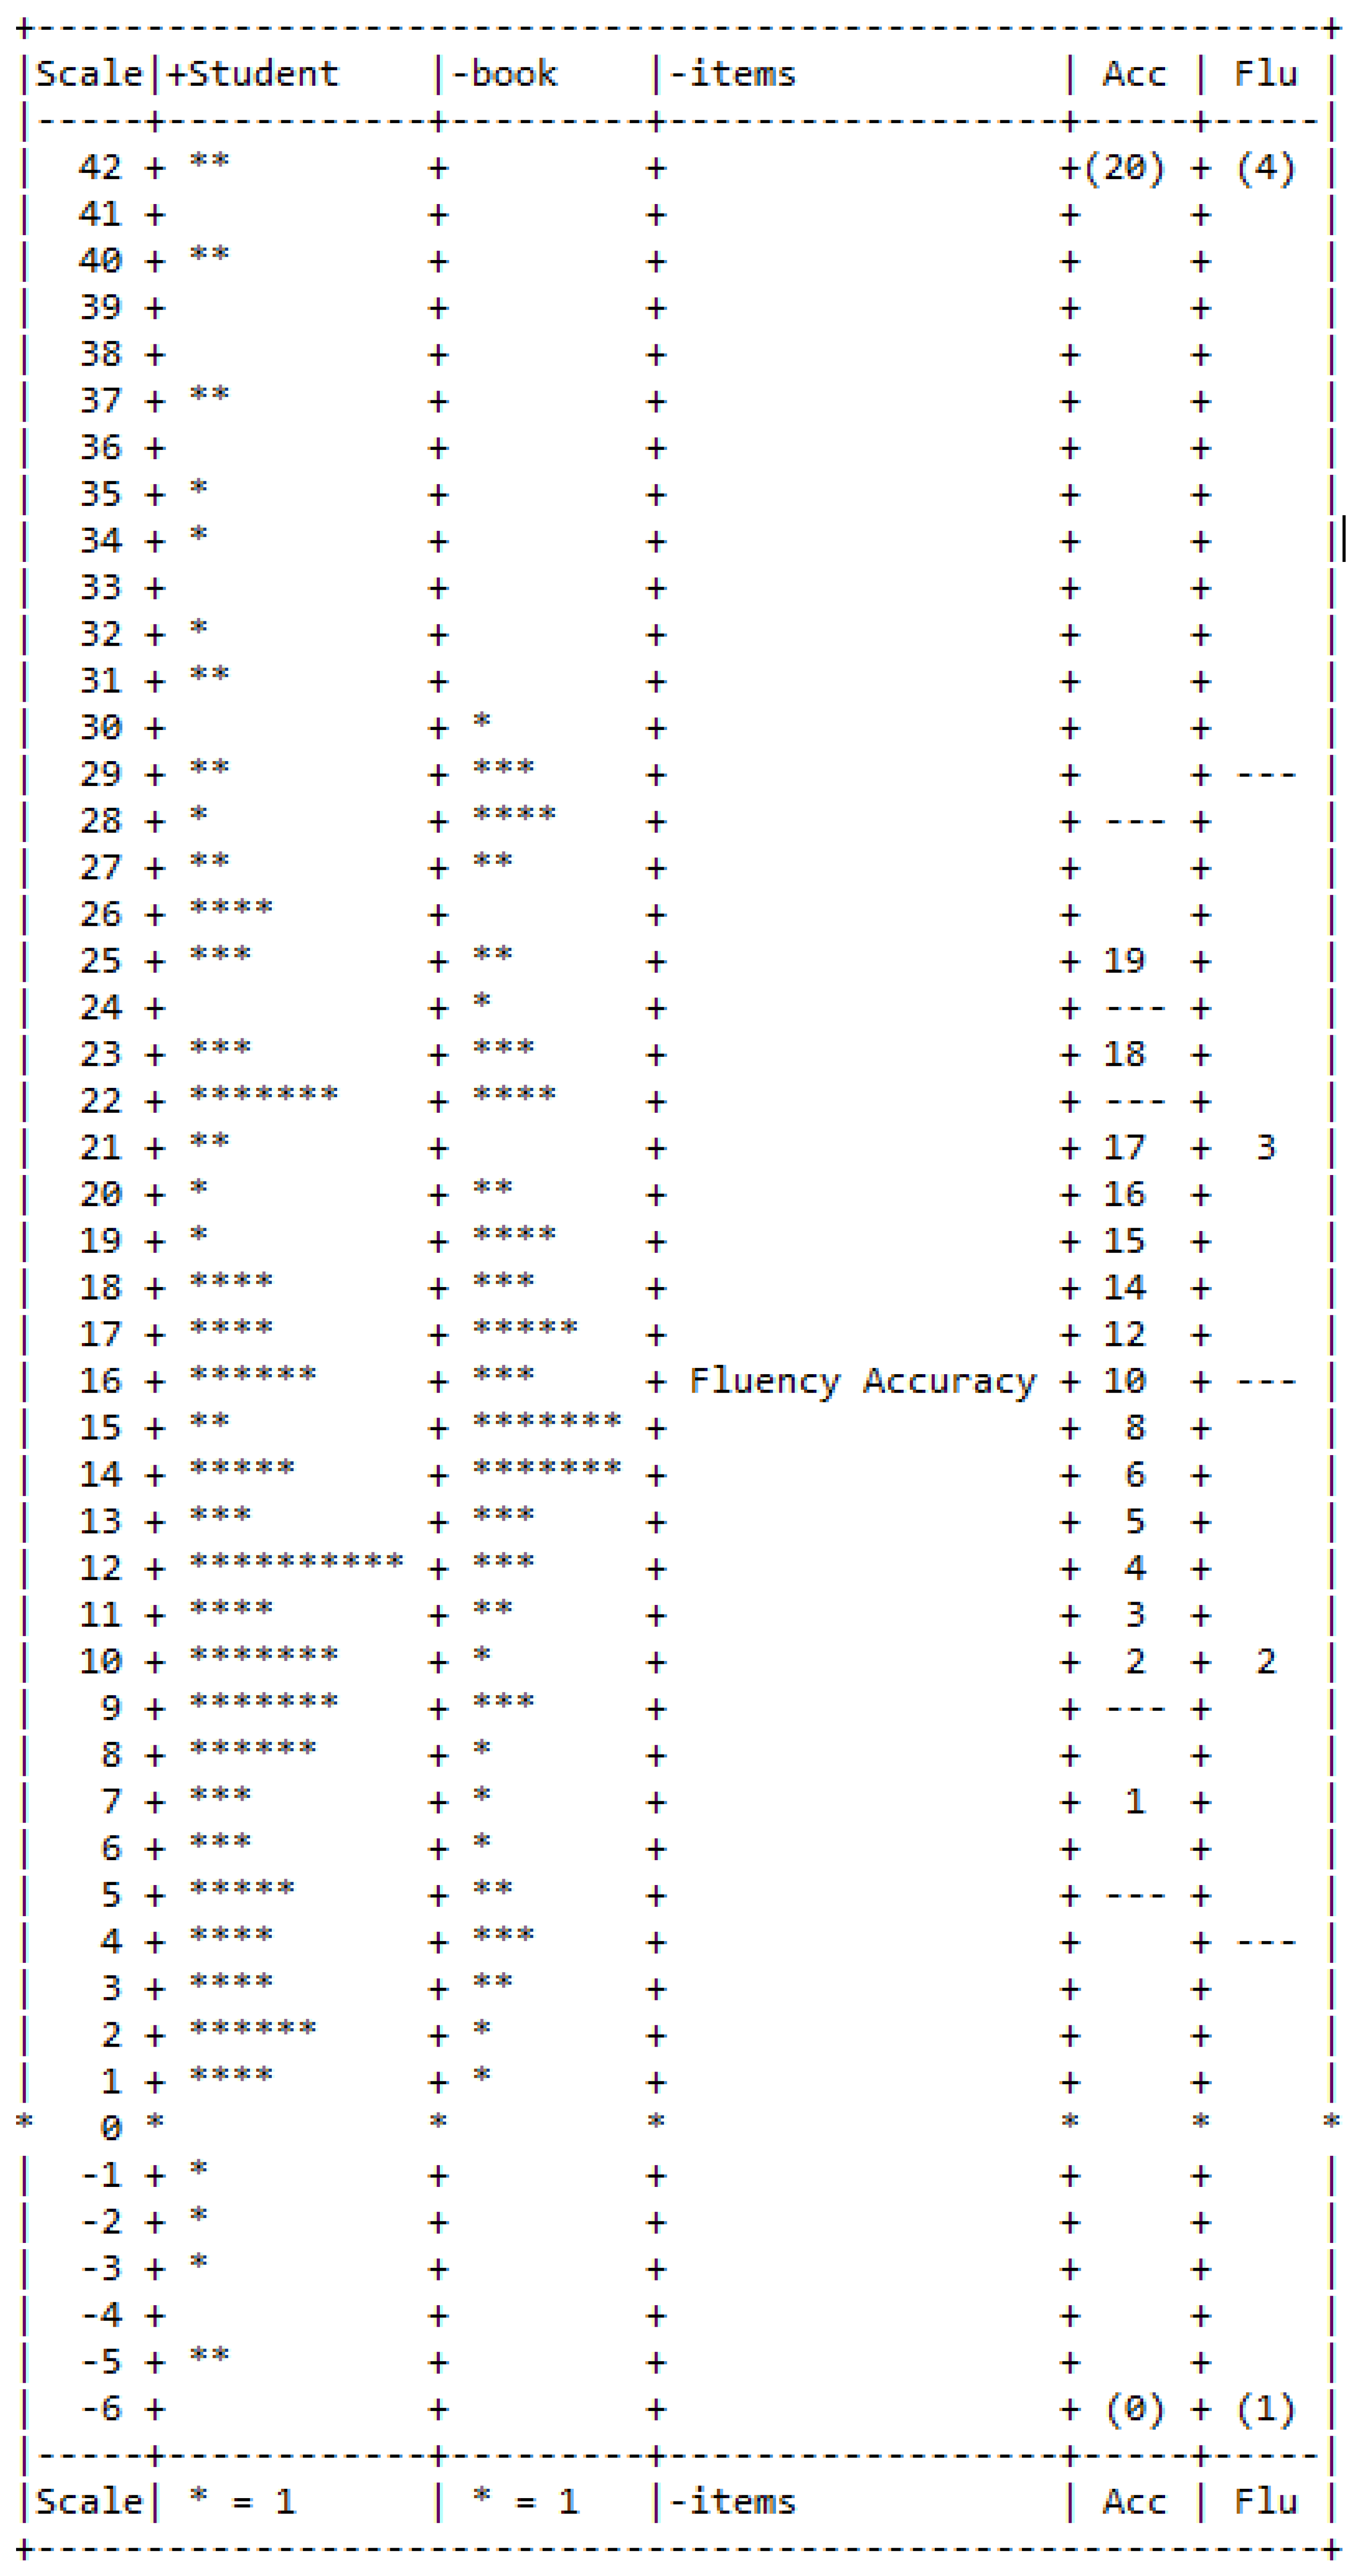
The accuracy and fluency values per reading were subjected to a Rasch-based facets analysis, with students, books, and the two outcomes (accuracy and fluency) as the specified facets. Figure 2 presents a map of the distribution of elements in each facet. The scale is presented in a vertical fashion, with the highest-scoring students and most difficult books at the top. Note that the range of student scale values (from 42 to −5) was greater than the range of book difficulty values (1–30), which indicates that student proficiency had a greater distribution than book difficulty—a desirable result if the goal is to accurately calibrate the difficulty level of books. The two columns on the far right are the accuracy and fluency score placement values on the scale. The values for both outcomes were in the expected order, with the highest possible value at the top, the lowest possible value at the bottom, and all other values falling in the correct order from highest to lowest.
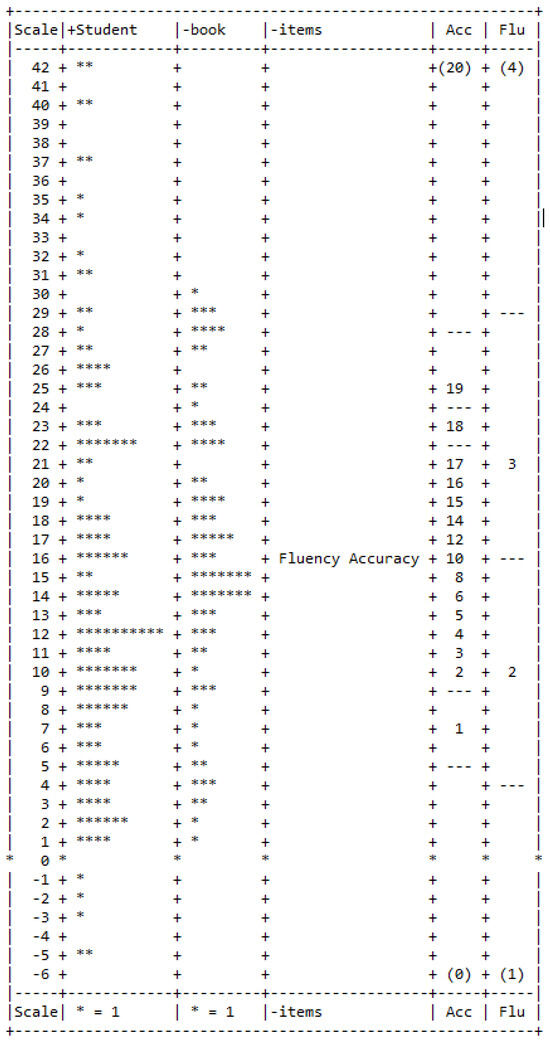
Figure 2.
Facet scale for students, books, and outcomes.
The alpha coefficient, a measure of internal consistency reliability, was 0.97 for the students, indicating that the books yielded reliable estimates of students’ proficiency levels. The book’s alpha coefficient was 0.99, which revealed that, overall, the precision of the book’s difficulty ordering was very strong.
Another set of indices to consider, which, like the alpha coefficients, indicate the degree to which the unidimensional (i.e., a single dimension) Rasch model matches the data, are the fit statistics. The key fit metrics in Rash analysis are infit and outfit statistics, with values around 1 or less indicating excellent fit, and values between 1.5 and 2.0 indicating acceptable fit. Poor fit (i.e., fit values > 2.0) results when there a numerous and/or large unexpected responses, such as when a more proficient student struggles with an easy book or vice versa.
Book, student, and outcome (accuracy and fluency) infit and outfit values were analyzed to address model fit. A book’s infit places greater weight on responses from students closer to the book on the scale, whereas a book’s outfit weighs more heavily on responses from students who are farther away from the book on the scale. The same is true for student fit values in relation to books, and the responses of students on books for each outcome. Only 15 of the 129 students had infit or outfit values that exceeded 2.0, which reflects an overall good fit of the Rasch model to the student data (it is typical to have 10–15% of students who misfit an otherwise unidimensional scale). The fit values for the two outcome measures, accuracy and fluency, were near one, indicating that the two measures worked well to create an oral reading proficiency scale.
Because the goal of the project was to place the books on a gradient, their fit values were of primary consideration. Table 1 presents the key metrics for the books ordered in the table from most to least difficult. Along with the measures, which were re-scaled from 1 to 30, each book’s standard error (SE) and fit statistics are provided. The book labels indicate the form for which the books were assigned and the initial level assignments (e.g., D28 is a book assigned to Form D that was initially considered a Level 28 text).

Table 1.
Final book statistics and books selected to represent tested levels.
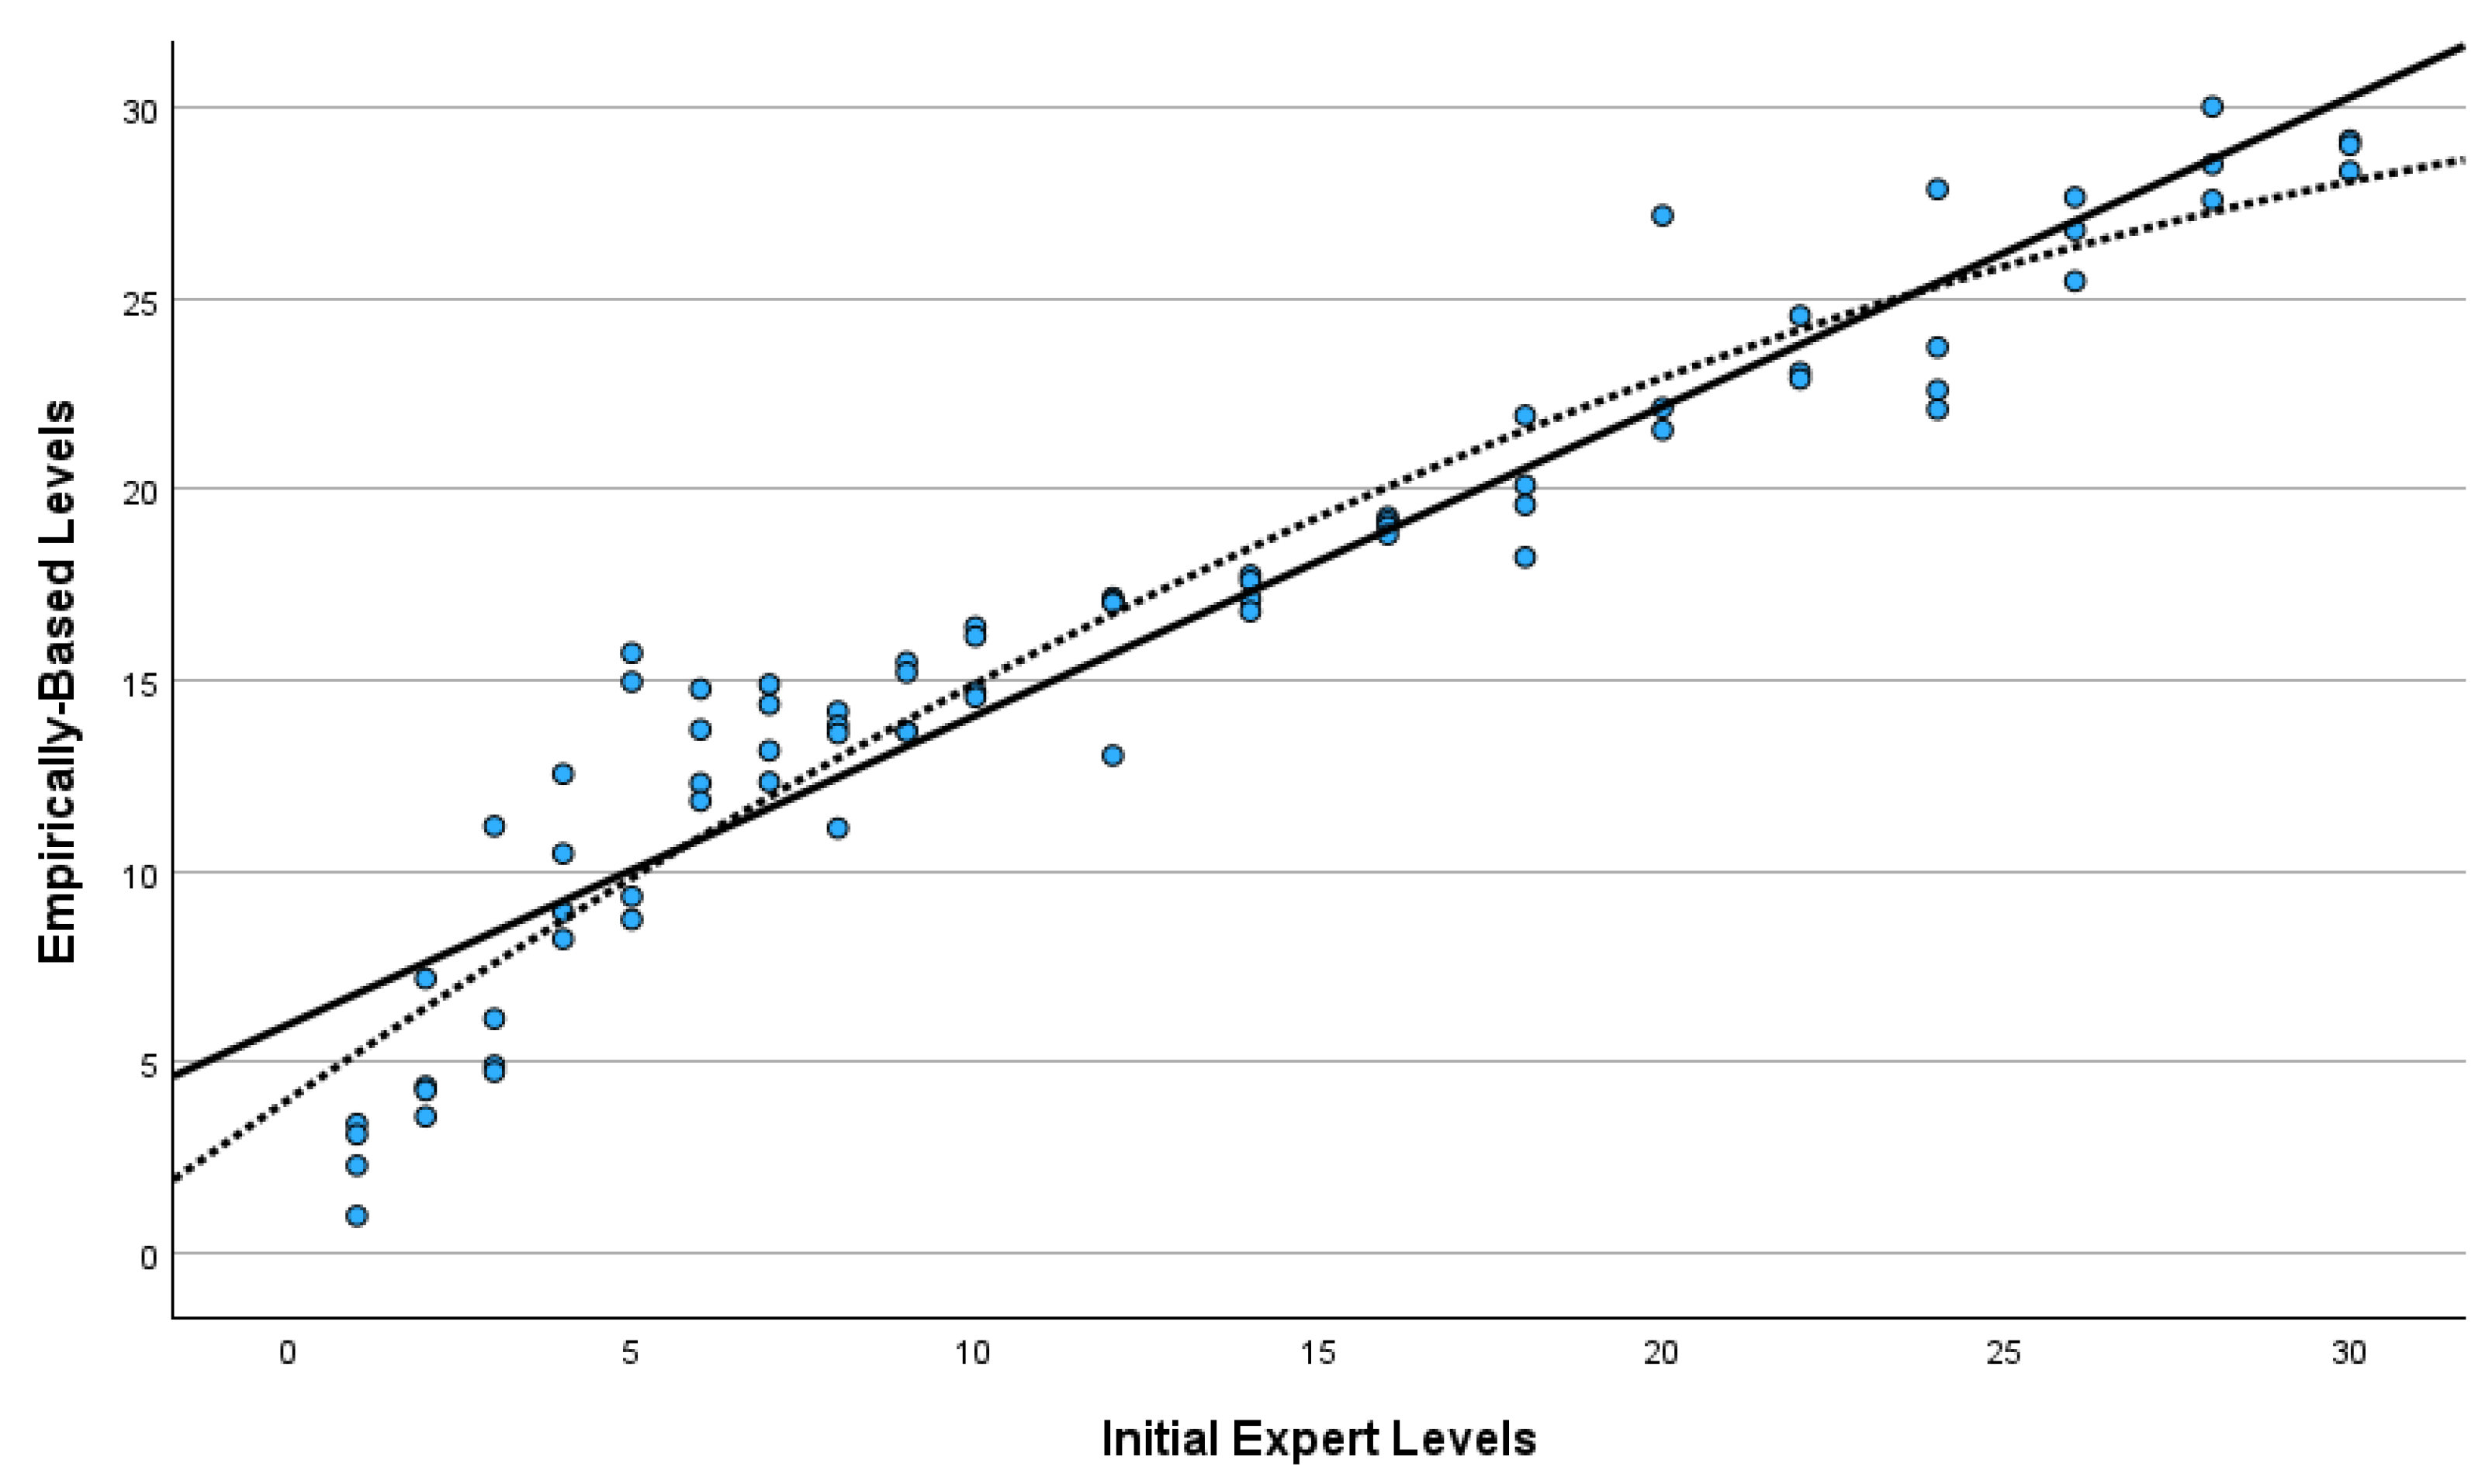
It can be seen from Table 1 that book scale values mostly coincided with the originally assigned book levels. Figure 3 presents the scatterplot of the empirically-based scale measures and the initial levels of the 75 books. Both the linear and quadratic regression lines are provided. The linear correlation between the two variables was 0.95, indicating very good correspondence. The quadratic line significantly improved the fit (increasing the R2 from 0.90 to 0.92) over the linear regression. The slope of the quadratic pattern was steeper over the first five initial book levels, indicating that the empirical data suggested more book level variance than the initial levels at the beginning of the scale. Further, in some cases, the scale positions were askew from the initial book level assignment, such as the two books considered to be at Level 5 that had empirically scaled calibration values at Levels 15 and 16, respectively.
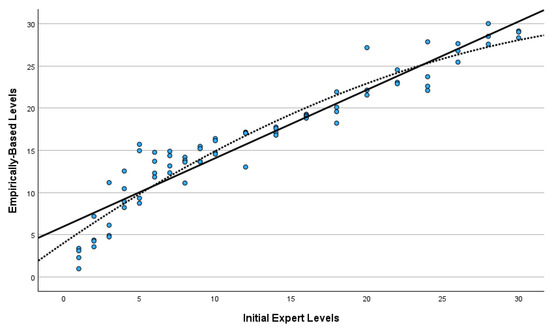
Figure 3.
Scatterplot of empirically based levels by initial expert levels.
Overall, 7 of the 75 books had greater than 2 infit or outfit values. The fit values, however, were not equivalent across the scale. Generally, model fit was better for books with scale values ranging from 11 to 30, indicating little noise in the data in that range (except for a few books, such as C20 and A16). More noise was apparent in books ranging from 1 to 11. Even though there were only three books in the lower range with greater than 2 fit values, there were a few items with misfit values that approached 2.
Step 3: Selecting Books for the Final Testing Set
From the book properties presented in Table 1, we selected 20 books that defined Levels 1–10, and even-numbered levels from 12 to 30. The 20 selected books with their final levels are noted in the far-right column of the table. We based our selection decision on the book’s empirical scale values that were closest to the SME initial levels, that had the smallest standard errors, and that had the best fit values. Although we prioritized books with scale values that matched the SME judgments, 15 of the 20 books were selected to represent levels that judges initially assigned to different levels during Step 1. Thus, Step 2 in this integrated leveling process is more than summative validity confirmation—it serves the necessary role of pinpointing with greater accuracy the order of books based on student performance data.
4. Discussion
Though the benefits of qualitative leveling systems have been acknowledged, their full potential has been limited due to questions and concerns regarding their reliability and validity. We maintain that many of the identified psychometric limitations stem from the near sole reliance on content validation methods during the leveling process, which results in human judgment error in book difficulty ordering. Using conventional empirical field-testing procedures, we presented a means of rectifying these limitations that we anticipate will yield more reliable and valid scores of students’ reading levels. The next step would be to use the final book set for operational testing purposes and examine the degree to which the new design process yielded more reliable and valid student scores.
Although the empirical difficulty values of the books and their initially assigned levels by experts correlated at 0.95, integrating an empirical pretesting phase into the design process led to the production of a more finely tuned testing packet for several reasons. One, it provided the opportunity to confirm the accuracy of the experts’ initial level assignments. In this case, the empirical evidence mainly supported the order of the initial book levels, but as revealed in Figure 3, there was variation among the books initially assigned to the same levels. For example, without the field-testing results, we would have assumed that the four books considered to be at Level 5 were all at the same difficulty level, when the field-testing revealed that two were closer to Level 10 and two were closer to Level 15.
Second, field-testing helped identify books that did not contribute to the reliability and validity of the final scale. Books with initial levels that did not match the empirical data, and books with excessive noise and poor fit were identified and not considered for the final set. Third, and because we had an ample supply of field-tested books from which to choose, field-testing allowed us to identify the books with empirical data that best matched the experts’ judgments and that represented relatively equidistant points on the scale. When the Rasch model sufficiently fits the data, which all indices converged to suggest in our study, the final scale has interval properties.
Choosing books for the final set that have the same or similar empirical data and expert judgment levels is important if one wishes to maintain the model or theory that explains the rise in text complexity. Although we prioritized selecting books with empirical levels that matched the expert’s original levels, we were only able to do so for 5 of the 20 books that we chose for the final set. The correlation, however, between the initial and empirical levels for the final 20 books was 0.98, indicating that the relative ordering of the books in the set was mainly maintained.
Most of the mismatch between initial and final levels was at the lower end of the scale, where books were the noisiest, but also where there was a steeper relationship for the first five initial levels, resulting in those levels spanning about 15 data-based levels (see Figure 3). Identifying the reasons for disparities between the two sources of information (expert and empirical) was not a goal of this study, so any proposed explanation is speculative.
For one, as evinced by the greater error among the least difficult books, the disparity in levels at the lower end of the scale could be due more to attributes of the students than book properties. For one, reading development is in greater flux among students lower on the scale than more proficient students. If lower-performing students varied more in their word knowledge levels, they may have performed better or worse than expected on books that happened to contain words they knew or did not know. Two, there may have been a greater proportion of English as a Second Language (ESL) students at the lower scale values. Assessors may have had more difficulty ascertaining their fluency levels on each reading, adding to noise in the books at lower levels.
Another possible source for the disparity among the lower-level books pertains to the leveling criteria. There may be text characteristics that are not accounted for in the leveling rubric used by the experts, which, if considered, would have distinguished between finer book levels at the lower end of the scale. This explanation is somewhat counter to Hiebert and Tortorelli’s (2022) finding that lower-level books have fewer distinguishing features, although in their study, they examined qualitatively leveled books with fewer levels at grade 1 compared to the testing packet we developed in the current study. Further, it is important to consider that our study may be the first one in the literature base that directly compares the lift in book levels as estimated by a leveling process (be it quantitative or qualitative) to the book calibrations estimated from student performance data. Hence, there is likely considerable variability in text difficulty derived from asking children to read books that existing quantitative and qualitative models do not explain.
A common practice in leveling text is to order the books based on students’ comprehension of the material. Although this approach at a minimum relies on student performance data to level text, it comes with some potential limitations. For one, measures that may be more efficient, such as cloze or maze tasks that were used in studies such as Fitzgerald et al. (2015), have been shown to provide a limited assessment of comprehension. More specifically, cloze and maze tasks may reflect within-sentence comprehension, but have little validity as measures of more global intersentential comprehension (Shanahan et al., 1982).
Secondly, oftentimes comprehension questions are specific to a reading passage, resulting in comprehension questions varying across passages. Because the questions across passages are not the same, or even if they are identical (such as “What’s the main idea?”), there is no way to equate the difficulty of the questions from passage to passage. Thus, text may be ordered less by their complexity and more by the difficulty of the specific comprehension questions associated with each passage. Instead, we used a standardized fluency rubric that was not dependent on the text. Kuhn et al. (2010) articulated that fluency and comprehension have a reciprocal relationship, with fluency serving as a bridge between decoding and comprehension. Thus, we decided to measure fluency instead of comprehension as a means of capturing students’ general understanding of each book.
The study was meant to demonstrate how field-testing books can add to the precision of book leveling, but even as a demonstration, the study had some limitations that should be considered. Perhaps the most obvious limitation is that the samples of students and books were specific to the first grade, rendering it unknown how well these methods could be applied to fine-tuning text levels at other grades. A related limitation is that we fine-tuned books that were initially leveled by SMEs using a certain set of qualitative leveling criteria designed to yield 20 distinct levels. It is yet to be determined if the same outcomes would result if another leveling system were to be used by SMEs with different criteria and a different set of leveled categories.
Although not a goal of our demonstration, we did not attempt to ascertain if certain attributes of the students influenced the leveling process, which is another study limitation. Future research that utilizes our methods should consider whether books follow the same ordered pattern for students with disabilities or ESL students, or if book difficulties function differently based on the gender or ethnicity of students. Differential item functioning (DIF) analysis, which often is conducted during test design (Schmeiser & Welch, 2006), could be employed to determine if certain books or text are significantly more difficult after controlling for overall proficiency for certain student subgroups, such as boys versus girls, ESL versus non-SEL students, or minoritized versus non-minoritized students. To increase testing fairness, those books that display DIF can be reviewed for potential bias and removed from the testing pool.
As the validity process does not cease past the development stage, we continue to investigate if the new testing packet yields student scores that can be validly used for those purposes. The next validation step is to embark on a series of studies framed within a validity argument (see Chapelle & Voss, 2021, for a set of argument-based validation studies in the closely related field of language assessment), that would involve establishing claims that would signify that valid use of the scores, and to collect evidence that either supports or refutes the claims. Ultimately, further validation evidence would be warranted to support the claims that the scores can be used effectively to (1) gain information about where to begin reading instruction with individuals or small groups of children with varied strengths and needs, (2) monitor student reading proficiency over time, (3) and to make decisions on whether students require additional instructional support for reading. As we have demonstrated in this study, the first step in that process is to create a testing packet based on field-tested empirical evidence.
Author Contributions
Conceptualization, J.V.D.; Methodology, J.V.D.; Validation, J.V.D.; Formal analysis, J.V.D.; Resources, C.B.; Data curation, J.V.D. and C.B.; Writing—original draft, J.V.D.; Visualization, J.V.D. All authors have read and agreed to the published version of the manuscript.
Funding
This research received no external funding.
Informed Consent Statement
Informed consent was obtained from all study participants.
Data Availability Statement
The original contributions presented in this study are included in the article. Further inquiries can be directed to the corresponding author(s).
Conflicts of Interest
The authors declare no conflict of interest.
References
- American Educational Research Association, American Psychological Association & National Council on Measurement in Education (Eds.). (2014). Standards for educational and psychological testing. American Educational Research Association. [Google Scholar]
- Burns, M. K., Pulles, S. M., Maki, K. E., Kanive, R., Hodgson, J., Helman, L. A., McComas, J. J., & Preast, J. L. (2015). Accuracy of student performance while reading leveled books rated at their instructional level by a reading inventory. Journal of School Psychology, 53, 437–445. [Google Scholar] [CrossRef] [PubMed]
- Center for Research in Educational Policy [CREP]. (2009). Field study of reliability and validity of the fountas and pinnell benchmark assessment systems 1 and 2. University of Memphis. [Google Scholar]
- Chall, J. S. (1958). Readability: An appraisal of research and application. (Bureau of Educational Research Monographs, No. 34). The Ohio State University. [Google Scholar]
- Chapelle, C. A., & Voss, E. (2021). Validity argument in language testing: Case studies of validation research. Cambridge University Press. [Google Scholar] [CrossRef]
- Council of Chief State School Officers. (2010). English language arts standards. Council of Chief State School Officers. [Google Scholar]
- Cunningham, J. W., Hiebert, E. H., & Mesmer, H. A. (2018). Investigating the validity of two widely used quantitative text tools. Reading and Writing, 31, 813–833. [Google Scholar] [CrossRef]
- Cunningham, J. W., Spadorcia, S. A., Erickson, K. A., Koppenhaver, D. A., Sturm, J. M., & Yoder, D. E. (2005). Investigating the instructional supportiveness of leveled texts. Reading Research Quarterly, 40, 410–427. [Google Scholar] [CrossRef]
- D’Agostino, J. V., Rodgers, E., Winkler, C., Johnson, T., & Berenbon, R. (2021). The generalizability of running record accuracy and self-correction scores. Reading Psychology, 42, 111–130. [Google Scholar] [CrossRef]
- Fawson, P. C., Ludlow, B., Reutzel, D. R., Sudweeks, R., & Smith, J. A. (2006). Examining the reliability of running records: Attaining generalizable results. The Journal of Educational Research, 100, 113–126. [Google Scholar] [CrossRef]
- Fisher, D., Frey, N., & Lapp, D. (2012). Text complexity: Raising rigor in reading. International Reading Association. [Google Scholar]
- Fitzgerald, J., Elmore, J., Koons, H., Hiebert, E. H., Bowen, K., Sanford-Moore, E. E., & Stenner, A. J. (2015). Important text characteristics for early-grades text complexity. Journal of Educational Psychology, 107, 4–29. [Google Scholar] [CrossRef]
- Gómez-Bellengé, F., Rodgers, E., Wang, C., & Schulz, M. (2005, April 1–15). Examination of the validity of the observation survey with a comparison to ITBS. Annual Meeting of the American Educational Research Association, Montreal, QC, Canada. [Google Scholar]
- Graesser, A. C., McNamara, D. S., & Kulikowich, J. M. (2011). Coh-Metrix: Providing multilevel analyses of text characteristics. Educational Researcher, 40, 223–234. [Google Scholar] [CrossRef]
- Hiebert, E. H., & Tortorelli, L. S. (2022). The role of word-, sentence-, and text-level variables in predicting guided reading levels of kindergarten and first-grade texts. The Elementary School Journal, 122, 557–590. [Google Scholar] [CrossRef]
- Hoffman, J. V., Roser, N. L., Salas, R., Patterson, E., & Pennington, J. (2001). Text leveling and “little books” in first-grade reading. Journal of Literacy Research, 33, 507–528. [Google Scholar] [CrossRef]
- Kincaid, J. P., Fishburne, R. P., Rogers, R., & Chissom, B. S. (1975). Derivation of new readability formulas (automated readability index, fog count, and flesch reading ease formula) for navy enlisted personnel. Naval Air Station Memphis. [Google Scholar]
- Klare, G. R. (1974–1975). Assessing readability. Reading Research Quarterly, 10, 62–102. [Google Scholar] [CrossRef]
- Klingbeil, D. A., Nelson, P. M., Van Norman, E. R., & Birr, C. (2017). Diagnostic accuracy of multivariate universal screening procedures for reading in upper elementary grades. Remedial and Special Education, 38, 308–320. [Google Scholar] [CrossRef]
- Klingbeil, D. A., Van Norman, E. R., Osman, D. J., Berry-Corie, K., Carberry, C. K., & Kim, J. S. (2023). Comparing AimswebPlus to Benchmark Assessment System for universal screening in upper elementary grades. Journal of Psychoeducational Assessment, 41, 194–208. [Google Scholar] [CrossRef]
- Kuhn, M. R., Schwanenflugel, P. J., & Meisinger, E. B. (2010). Aligning theory and assessment of reading fluency: Automaticity, prosody, and definitions of fluency. Reading Research Quarterly, 45, 230–251. [Google Scholar] [CrossRef]
- Livingston, S. A. (2006). Item analysis. In S. M. Downing, & T. M. Haladyna (Eds.), Handbook of test development (pp. 421–441). Larence Erlbaum Associates. [Google Scholar]
- Nelson, J., Perfetti, C., Liben, D., & Liben, M. (2012). Measures of text difficulty: Testing their predictive value for grade levels and student performance. Gates Foundation. [Google Scholar]
- Nilsson, N. L. (2008). A critical analysis of eight informal reading inventories. The Reading Teacher, 6, 526–536. [Google Scholar] [CrossRef]
- Parker, D. C., Zaslofsky, A. F., Burns, M. K., Kanive, R., Hodgson, J., Scholin, S. E., & Klingbeil, D. A. (2015). A brief report of the diagnostic accuracy of oral reading fluency and reading inventory levels for reading failure risk among second-and third-grade students. Reading & Writing Quarterly, 31, 56–67. [Google Scholar] [CrossRef]
- Pearson, P. D., & Hiebert, E. H. (2014). The state of the field: Qualitative analyses of text complexity. Elementary School Journal, 115(2), 161–183. [Google Scholar] [CrossRef]
- Peterson, B. (1991). Selecting books for beginning readers. In D. E. DeFord, C. A. Lyons, & G. S. Pinnell (Eds.), Bridges to literacy (pp. 119–138). Portsmouth, NHL Heinemann. [Google Scholar]
- Sayin, A., & Gören, S. (2023). Comparing estimated and real item difficulty using multi-facet Rasch analysis. Journal of Measurement and Evaluation in Education and Psychology, 14, 440–454. [Google Scholar] [CrossRef]
- Schmeiser, C. B., & Welch, C. J. (2006). Test development. In R. L. Brennan (Ed.), Educational measurement (4th ed., pp. 307–353). Praeger Publishers. [Google Scholar]
- Shanahan, T., Kamil, M. L., & Tobin, A. W. (1982). Cloze as a measure of intersentential comprehension. Reading Research Quarterly, 17, 229–255. [Google Scholar] [CrossRef]
- Sireci, S. G. (1998). The construct of content validity. Social Indicators Research, 45, 83–117. [Google Scholar] [CrossRef]
- Spector, J. E. (2005). How reliable are informal reading inventories? Psychology in the Schools, 42, 593–603. [Google Scholar] [CrossRef]
- Stenner, A. J. (2023). Measuring reading comprehension with the Lexile framework. In W. P. Fisher, & P. J. Massengill (Eds.), Explanatory models, unit standards, and personalized learning in educational measurement (pp. 63–88). Springer. [Google Scholar]
- Stenner, A. J., Smith, M., & Burdick, D. S. (1983). Toward a theory of construct definition. Journal of Educational Measurement, 20, 305–315. [Google Scholar] [CrossRef]
- United States Department of Education. (1995). Listening to children read aloud, 22. National Center for Education Statistics.
- Urhahne, D., & Wijnia, L. (2021). A review on the accuracy of teacher judgments. Educational Research Review, 32, 100374. [Google Scholar] [CrossRef]
Disclaimer/Publisher’s Note: The statements, opinions and data contained in all publications are solely those of the individual author(s) and contributor(s) and not of MDPI and/or the editor(s). MDPI and/or the editor(s) disclaim responsibility for any injury to people or property resulting from any ideas, methods, instructions or products referred to in the content. |
© 2025 by the authors. Licensee MDPI, Basel, Switzerland. This article is an open access article distributed under the terms and conditions of the Creative Commons Attribution (CC BY) license (https://creativecommons.org/licenses/by/4.0/).