Article

AI and Eye Tracking Reveal Design Elements’ Impact on E-Magazine Reader Engagement

by
Hedda Martina Šola
1,2,*,
Fayyaz Hussain Qureshi
1 and
Sarwar Khawaja
1,3
1
Oxford Centre for Applied Research and Entrepreneurship (OxCARE), Oxford Business College, Oxford OX1 2BQ, UK
2
Institute for Neuromarketing & Intellectual Property, Jurja Ves III spur no 4, 10000 Zagreb, Croatia
3
SK Hub The Atrium, Uxbridge UB8 1PH, UK
*
Author to whom correspondence should be addressed.
Educ. Sci. 2025, 15(2), 203; https://doi.org/10.3390/educsci15020203
Submission received: 22 November 2024 / Revised: 25 January 2025 / Accepted: 31 January 2025 / Published: 8 February 2025
(This article belongs to the Special Issue Generative AI in Education: Current Trends and Future Directions)

Abstract

:
This study investigates the impact of intelligible background speech on reading disruption utilising neuromarketing methodologies, specifically an eye-tracking webcam (Tobii Sticky) and AI eye-tracking software (Predict, v.1.0.). A cohort of 144 participants from Oxford Business College underwent emotional impact testing, while an AI eye-tracking algorithm analysed attention patterns across 180,000 eye-tracking recordings. Two articles from OxConnect Magazine were presented in varying background formats. Python-based analysis revealed that the HND article consistently outperformed OxFoodbank in maintaining reader engagement and attention. The HND’s structured content yielded higher total attention (white: 49.43%, black: 48.19%) and end attention (white: 27.58%, black: 28.43%). Emotion analysis indicated that HND elicited a more neutral (white mean difference: 0.1514, black: 0.1008) and consistent emotional response, with reduced puzzlement (white mean difference: −0.3296, black: −0.0918). Furthermore, this demonstrates the effectiveness of integrating AI eye-tracking algorithms with webcam eye trackers for comprehensive reading behaviour analysis. These findings provide valuable insights for colleges developing e-magazines, offering evidence-based strategies to enhance student engagement and information retention. By implementing well-structured, visually appealing content, educational institutions can optimise their digital publications to maintain reader attention even in the presence of background distractions, ultimately improving the effectiveness of their e-magazines as educational tools.

1. Introduction

Previous research has extensively explored various aspects of online media consumption and reader behaviour. Still, there remains a significant gap in understanding the relationship between emotional states and reading behaviour patterns in e-magazines using AI-driven eye-tracking methodologies. While studies have demonstrated the impact of emotional storytelling on audience engagement (Wahl-Jorgensen, 2020) and the effects of sharing and commenting on reader loyalty (Lischka & Messerli, 2016), the specific role of emotions in shaping reading patterns and attention in e-magazines has not been fully elucidated. Additionally, although eye-tracking technology has been utilised to estimate visual attention (Lewandowska & Olejnik-Krugly, 2021) and detect smooth pursuit movements (Mooney et al., 2018), its application in predicting human behaviour and emotional states during e-magazine consumption remains underexplored. Research has shown that emotions play a fundamental role in shaping behaviour, cognition, and physiological responses, influencing decision-making processes and individual responses to stimuli (Astudillo et al., 2018; Hille & Bakker, 2013; Straub et al., 2022). In the context of online news consumption, studies have revealed variations in consumption patterns based on individual interests and habits, with search-driven news consumption being the most prevalent (Möller et al., 2020; Sungkur et al., 2016).
Eye-tracking technology has emerged as a valuable tool for examining cognitive load and attention levels, providing insights into readers’ loyalty patterns and engagement with digital content (Arfé et al., 2023; Sungkur et al., 2016). Moreover, AI-driven eye-tracking techniques have demonstrated the potential to infer personality traits from visual behaviour on social media platforms (Woods et al., 2022), and pupil dilation has been recognised as a marker of emotional arousal (Skaramagkas et al., 2023). Studies have also shown that multimedia content in online newspapers can impact cognitive load and information retention (Astudillo et al., 2018), and emotional responses to news articles can influence readers’ evaluations (Wang & Hickerson, 2016). These findings underscore the importance of considering emotional and cognitive factors in designing and presenting e-magazine content.
Despite these advancements, several crucial questions remain unanswered. Firstly, we need to understand how emotional states influence reading behaviour patterns in e-magazines using AI-driven eye-tracking methodologies. This includes investigating the relationship between emotional arousal, visual attention, and engagement with e-magazine content (Šola et al., 2024a; van der Sluis & van den Broek, 2023). Secondly, further research is required to explore how AI-powered eye-tracking technology can effectively predict human behaviour and emotional states during e-magazine consumption. Additionally, we need to examine the potential of integrating eye-tracking data with other physiological signals to develop more comprehensive emotion recognition systems for e-magazine readers (Astudillo et al., 2018; Hille & Bakker, 2013). Finally, there is a need to investigate how the findings from AI eye-tracking and neuromarketing studies can be applied to enhance user engagement, content personalisation, and overall user experience in e-magazines (Kruikemeier et al., 2018; Šola et al., 2024b; van der Sluis & van den Broek, 2023). These insights could revolutionise how e-magazines are designed and tailored to individual readers’ preferences and emotional states.
The primary objective of this study was to examine how design elements, specifically background colour and content structure, influence reader engagement, cognitive processing, and emotional responses when interacting with e-magazine articles. We utilised advanced AI eye-tracking technology and neuromarketing techniques to provide evidence-based insights to optimise digital publication design for enhanced student engagement and information retention.

1.1. Eye-Tracking Case Studies: Emotional Responses to E-Magazine Content

Eye-tracking technology has demonstrated efficacy in measuring emotional responses to e-magazine content. A study by Zhu and Yang (Zhu & Yang, 2023) employed eye-tracking technology to analyse gaze paths, zones of interest, and heatmaps, assessing attention focus in 30 design-oriented participants. The study excluded individuals with visual impairments, allowing participants to navigate web design images naturally. The findings, corroborated by data and interviews, indicated preferences for the times new roman font, blue text, large headlines, “Banneker” layouts, underline-free links, and green backgrounds. Warmer colours were observed to attract longer focus, providing practical insights for optimising e-magazine web design to better align with user attention and comfort. Usée et al. (2020) observed that emotionally positive stimuli (such as vignettes and pictures) were rated as more positive and less arousing than emotionally negative ones. Vignettes elicited more substantial valence effects (positive vs. negative) than pictures, although no difference was observed in their impact on perceived arousal. Furthermore, positively valenced text resulted in shorter reading times than negatively valenced text, both at the lexical and sublexical levels. Chen et al. (2022) reported that readers exhibited greater attention to negative reviews than positive ones, with gender influencing this effect. Female readers demonstrated increased focus on negative reviews, while male readers focused more on positive reviews. Arapakis et al. (2014) have shown that user engagement can be predicted by analysing the sentiment and polarity of content, along with other factors influencing attention and curiosity. Their laboratory study examined how news and comments’ sentiment and polarity impacted subjective and objective engagement measures. Specifically, attention, affect, and gaze were found to vary across news content with different interest levels. Previous studies on measuring emotional responses and engagement, including research by Lee et al. (2023), have encountered several limitations. Notably, Lee et al.’s study utilised a sample composed exclusively of young adults from a single country, potentially limiting the generalizability of its findings. Future research should incorporate a more diverse and extensive dataset to enhance the practical applicability of classification models. Bagić Babac (2023) highlighted limitations associated with a specific set of news portals, each with distinct editorial policies and target audiences, potentially restricting the broader applicability of the findings. Additionally, the study focused solely on emotional reactions, omitting a more comprehensive range of cognitive and affective dimensions and the relationship between post topics and user reactions. The research was limited to a single cultural or regional context, lacking comparative insights across different cultures, regions, or countries. Liew et al. (2022) identified a significant research gap, recognising the need for further investigation into the effects of colour tones on multimedia learning. This gap may be considered a limitation of previous research. While eye tracking is gaining recognition in research, its application in detecting emotional and cognitive states remains limited. Accurately tracking reader engagement and emotional responses in real time remains a significant challenge, as emotions and focus fluctuate throughout the reading experience. Developing precise, dynamic tools to monitor these changes is essential for understanding and enhancing user interaction with digital content (Santhosh et al., 2024). This study improves our understanding of emotional responses and their effects on reader engagement and loyalty in e-magazines.

1.2. Discrepancy Between Traditional and AI Eye Tracking in Reading Behaviour

1.2.1. Intelligible Background Speech

Research has demonstrated that intelligible background speech significantly disrupts reading processes, particularly affecting post-lexical stages. This disruption manifests through increased regressions and rereading fixations, which can impair comprehension when readers are unable to revisit previous text (Meng et al., 2020). Studies have shown that meaningful background speech increases fixation times and total reading times, especially during tasks requiring semantic processing (Hyönä & Ekholm, 2016). The disruption becomes more pronounced with semantically and syntactically anomalous speech, highlighting the importance of semantic processing in reading tasks (Yan et al., 2018).

1.2.2. Neuromarketing Methodologies and Implications for Reading Interventions

Eye-tracking methodologies provide real-time data on how background speech affects reading patterns, offering insights into the cognitive processes involved (Hao & Conway, 2022; Meng et al., 2020). These methodologies can identify specific disruption points, enabling targeted interventions to improve reading comprehension in noisy environments (Hao & Conway, 2022). Interventions could focus on enhancing cognitive load management and selective attention to mitigate the impact of background speech (Winterhalter et al., 2024). However, the efficacy of interventions may be modulated by individual variations in cognitive load and working memory capacity, warranting further empirical investigation to develop comprehensive strategies that accommodate diverse reading environments and individual needs.
Recent advancements in AI-powered eye tracking have introduced significant improvements over traditional eye-tracking methods, particularly in accuracy, cost-effectiveness, and the ability to provide real-time, personalised insights. Traditional eye-tracking systems often face high costs and complexity challenges, whereas AI-powered systems leverage machine learning to enhance data interpretation and user experience. (Šola et al., 2024c). AI-powered eye tracking can achieve high accuracy levels, as demonstrated by systems integrating AI with eye tracking to predict consumer behaviours with scientific accuracy rates of 97–99% (Neurons, 2024b). Systems like SARA provide real-time, personalised assistance by identifying text segments that attract attention and offer customised solutions to enhance reading comprehension (Thaqi et al., 2024). While implementing AI in eye-tracking technology provides significant benefits, it is crucial to recognise potential constraints, such as the need for comprehensive datasets to adequately train AI models and the complexities associated with incorporating these systems into established research frameworks.
Traditional eye-tracking systems, such as those used in clinical settings, can be expensive and complex, often requiring specialised hardware and software setups. These systems may struggle with accuracy, especially in low-budget configurations (Winterhalter et al., 2024). Conversely, AI-powered eye tracking can achieve high accuracy levels, as demonstrated by systems that integrate AI with eye tracking to predict consumer behaviours with scientific accuracy rates of 97–99% (Šola et al., 2024c).
AI-powered systems like SARA provide real-time, personalised assistance by identifying text segments that attract attention and offering customised solutions to enhance reading comprehension (Thaqi et al., 2024). Traditional systems typically do not offer dynamic, personalised feedback, focusing on static data collection and analysis. AI-powered eye tracking is utilised to enhance user engagement by predicting behaviour patterns and preferences, thereby making content more engaging and user-friendly (Šola et al., 2024c). Traditional eye tracking is often limited to analysing visual attention without the added layer of AI-driven insights that can adapt to user needs in real time. Implementing artificial intelligence (AI) in eye-tracking technology offers significant benefits; however, it is imperative to recognise potential constraints, such as comprehensive datasets, to adequately train AI models and the intricacies associated with incorporating these systems into established research frameworks. To address these challenges, the current study employed an extensive AI eye-tracking dataset, comprising 180,000 samples (n = 180,000), representing the most comprehensive collection of its kind to date. The following primary hypotheses were formulated for this research:
H1. 
The design elements of e-magazine articles, specifically content structure and background colour contrast, significantly influence reader engagement, cognitive processing, and emotional responses.
H2. 
White backgrounds in e-magazine articles lead to higher sustained attention than black backgrounds.
H3. 
White backgrounds in e-magazine articles elicit more dynamic emotional responses over time than black backgrounds.
H4. 
The impact of background colour on reader engagement varies depending on the content type of the e-magazine article.
H5. 
Black backgrounds in e-magazine articles lead to higher cognitive demand than white backgrounds.
To address this central research question, the following sub-research questions were utilised:
  • RQ 1. How do content structure and background colour contrast in e-magazine articles affect readers’ sustained attention levels?
  • RQ 2. To what extent do structured content and high background contrast reduce cognitive demand compared with unstructured content and low background contrast in e-magazine articles?
  • RQ 3. What are the differences in emotional responses elicited by e-magazine articles with structured content and high background contrast versus those with unstructured content and low background contrast?
  • RQ 4. Are content structure and background colour contrast effects on reader engagement, cognitive processing, and emotional responses consistent across different article subjects?
  • RQ 5. Which specific aspects of content structure (e.g., headings, paragraphing, bullet points) have the most significant impact on reader engagement and cognitive processing?
  • RQ 6. How does the interaction between content structure and background colour contrast influence the overall reader experience in e-magazine articles?
The eye-tracking study on reading behaviour in college e-magazines holds significant importance in educational research and digital media consumption. This investigation addresses a critical gap in our understanding of how students interact with digital content, particularly in the context of academic publications. Firstly, the study’s focus on e-magazines aligns with the increasing digitalisation of educational resources, reflecting the contemporary shift towards online learning environments. By examining reading patterns in this medium, researchers can gain valuable insights into how digital formats influence information processing and retention among college students. Secondly, eye-tracking methodology offers a precise and objective measure of visual attention, allowing for a detailed analysis of reading behaviours that may not be captured through traditional self-report measures. This approach can reveal subtle patterns in gaze fixation, saccades, and scan paths, providing a comprehensive understanding of how students navigate and engage with e-magazine content. Furthermore, the study’s potential to inform the design and layout of digital educational materials is particularly noteworthy. By identifying areas of high visual interest and patterns of information scanning, publishers and educators can optimise content presentation to enhance readability, comprehension, and overall user experience. Additionally, this research may contribute to the development of personalised learning strategies. By analysing individual differences in reading behaviour, educators can tailor instructional approaches to accommodate diverse learning styles and preferences, potentially improving academic outcomes. Lastly, the findings from this study could have broader implications for digital literacy education. As students increasingly rely on digital platforms for educational and professional purposes, understanding the nuances of digital reading behaviour becomes crucial for developing effective strategies to enhance critical reading skills in online environments. In conclusion, this eye-tracking study on college e-magazine reading behaviour represents a timely and valuable contribution to educational technology and cognitive science. Its potential to inform pedagogical practices, improve digital content design, and enhance student engagement underscores its significance in the evolving landscape of higher education.

2. Materials and Methods

This research employs two distinct methodologies: human studies utilising Tobii Sticky and the AI-driven eye-tracking software ‘Predict’ (version 1.0) for predicting consumer behaviour. The software’s algorithm, developed by Neurons and Stanford University, incorporates one of the world’s most extensive consumer neuroscience databases, comprising over 100 billion consumer-behaviour data points (n = 180,000) collected using eye-tracking technology (Eye Tracker: Tobii X2-30, Tobii Pro AB, Danderyd, Sweden). Predict’s model database integrates eye-tracking, EEG (15%), and Fast Response Time test, These recordings, obtained globally across 15 diverse consumer contexts (n = 180,000), were used to train an encoder–decoder architecture (ConvNext as a pre-trained encoder), was upfront recorded heterogenic sample size m/f, 50:50 ratio, aged 18-55, with global representation as follows: USA (35%), UK (20%), Nordics (20%), DACH (10%), Southern Europe (5%), Latin America (3%), Middle East (3%), Asia (2%), Southeast Asia (2%), tested on tens of thousands of assets. Ethical requirements have been fulfilled as all tested subjects provided prior consent for using their data in the AI algorithm. In total, this database comprises approximately 210 billion raw data points. 85% of the data are from testing online, where half of these are with webcam eye-tracking. online, where half of these are with webcam eye-tracking. These data are still lower in temporal resolution but still yield around 15.000 data points per person, which provides a database of over 3.8 million raw datapoints (Neurons, 2024a, 2024b). Importantly, this software trains AI models on reliable metrics. For FRT (Fast Response Time Test)-based metrics, they require a minimum of 100 participants to have a reliable measure of asset response, and for eye-tracking and EEG, they achieve this with 30 participants. The same results are obtained if consumer responses to advertisements are tested in two groups of 100 (with FRT) or 30 (with EEG/ET) in each group. The database undergoes continuous expansion, with annual upgrades incorporating data from over 50,000 participants and extending to various consumer contexts as the AI learns from each study. The provider reports a predicate accuracy rate of 97–99% for attention, which is purportedly the highest in the industry, attributed to the software’s collaboration with Stanford University (Neurons, 2024a, 2024b). This level of reliability has been achieved and constitutes the foundation for the data underlying all our artificial intelligence model training (Ramsøy, 2019; Ramsøy et al., 2023).
The Predict model is designed to measure several aspects of user experience in our tested magazines: 1. Attention (start-end): Predicts consumers’ focal points over 2 s, aiming to provide precise, human-like attention behaviour predictions. 2. Engagement: Assesses reader excitement and immersion during magazine reading. 3. Focus: Examines attentive readers’ attention while engaging with magazine content. 4. Clarity: Evaluates the comprehensibility of visual materials, determining whether viewers perceive the content as lucid or ambiguous. 5. Cognitive demand: Measures the amount of information viewers process while reading the magazines, assessing whether the visual content is overloaded with details. Tobii Sticky is an online software for large-scale quantitative research using eye tracking. The platform is integrated with online survey engines and panel companies with global reach, enabling distributed data collection set-up and a quick turnaround time. With Tobii Sticky, we can measure the gaze data, emotions, mouse clicks and survey responses captured in real time. Despite the use of online research with a webcam-based eye tracking solution (15 Hz), the results exemplify how very accurate and valuable marketing insights of the consumer’s subconscious on the website’s perceived process and preferences can be obtained. According to the results, Sticky’s average gaze error in a real-world (non-lab) environment is 1.6 to 1.8 degrees (~5% of the screen width and 7% of screen height) on a laptop, which is considered sufficiently accurate for robust outcomes. Only recordings labelled as “usable” in Tobii Sticky were utilised to mitigate potential data quality issues arising from the non-laboratory setting. The Institute for Neuromarketing and the IP ethics committee approved this research and supervised the study to ensure compliance with local and international ethical guidelines. Following the British Educational Research Association’s ethical guidelines for educational research (BERA, 2018) and the Berlin Declaration, all participants were informed about the study and provided written, informed consent in digital form before participating (more about research ethics available at the www.neuromarketinginstitut.com). Consent was obtained directly through the Tobii Sticky software, automatically rejecting participants who did not provide consent. Participants’ data were treated under the General Data Protection Regulation (GDPR) and the European Code of Ethics for Research.

2.1. Research Methods

This study employed two official articles from the e-magazine “Oxconnect” (June–August 2021) with the following headlines: “New HND West London Campus” (hereafter referred to as the “HND article”) and “Oxford Business College Updates on Oxfoodbank” (hereafter referred to as “Oxfoodbank”). One article utilised white text on a black background, while the other employed black text on a white background. In addition to their original design versions, colour inversions were created for both articles (Appendix B Figure A2a,b and Figure A3a,b). The articles were resized to ensure readability on computer screens without magnification. The HND article comprised two columns with 199 words across 32 lines, averaging 6.2 words per line. Conversely, the Oxfoodbank article consisted of two columns with 166 words across 27 lines, averaging 5.9 words per line. Neuromarketing pretesting was not conducted before publication; a post-publication neuromarketing test was implemented to obtain the most reliable outcomes. The e-magazine was published live online at ISSU and the OBC website. The complete study was conducted over three weeks. Two weeks were allocated for collecting online emotional responses from OBC students using Tobi Sticky, followed by one week for conducting the study in Predict and cleaning and sorting the data for analysis. These methodologies were selected to comprehensively assess how the background colour and content structure influence reader engagement, cognitive demand, and emotional responses, which aligns with the study’s primary objective.
The utilisation of advanced neuroimaging and behavioural measurement techniques, including functional magnetic resonance imaging (fMRI), steady-state topography (SST), and eye-tracking methodologies, has provided valuable insights into unconscious consumer responses, which are essential for elucidating the cognitive and affective mechanisms underlying purchasing decisions (Ben Nasr, 2014). This study investigated the impact of manipulating background stimuli (white versus black) in electronic magazine content on readers’ emotional responses, attentional processes, and recall performance. Prior research has demonstrated that background colour can significantly influence attention, with white text on black backgrounds exhibiting enhanced perceived message effectiveness compared with black text on white backgrounds, suggesting that aesthetic elements may play a crucial role in content reception (King et al., 2021). The question of whether readers’ attention and recall of electronic magazine content vary significantly between white and black background stimuli is complex, encompassing readability, cognitive processing, and aesthetic preferences (Guo et al., 2022; Hall & Hanna, 2004). The analysis was conducted using Python (version 3.10.12) within a Jupyter Notebook environment (version 6.5.5). This computational framework facilitated the execution of data processing and analytical procedures. Python’s machine-learning capabilities have significantly enhanced neuromarketing research by providing sophisticated tools for analysing complex neuro data (Glova & Mudryk, 2020). These advanced techniques offer deeper insights into consumer behaviour that are not readily apparent through traditional methods, thereby providing a scientific basis for understanding consumer reactions to marketing stimuli (Daily et al., 2017; Smit et al., 2015).

2.1.1. Research Methods for Attention Analysis

We employed the ‘Predict’ model to assess attention and evaluate the HND and OxFoodbank articles. A sample size of 50 to 70 respondents can be considered a reasonable benchmark for detecting significant differences in visual attention in eye-tracking studies. This range is frequently employed in controlled experimental settings to balance statistical power and practical constraints. Studies conducted by Vacas et al. and Hansen et al. utilised sample sizes of 58 and 55, respectively, to investigate visual attention differences in specific contexts, including developmental disorders and factuality checking in news headlines. These sample sizes were sufficient to detect significant patterns and differences in visual attention within their specific experimental frameworks (Hansen et al., 2020; Vacas et al., 2024). Meyerhoff and Papenmeier’s research on individual differences in visual attention employed a sample size of approximately 50, indicating that this number can reliably capture individual differences in controlled settings, mainly when the task is well defined and the sample is relatively homogeneous (Meyerhoff & Papenmeier, 2020). The present study employs a novel approach utilising AI-powered eye-tracking technology. This methodology builds upon an extensive foundation of previous eye-tracking research, incorporating data from a substantial sample size of 180,000 participants. The innovative application of AI eye-tracking algorithms to analyse this comprehensive dataset represents a pioneering advancement in the field. Consequently, this research offers significant merit in elucidating eye-tracking effect sizes and contributes to the broader understanding of visual attention patterns.
To comprehend how the presented content influences readers, we measured total attention, start attention, end attention, cognitive demand, clarity, and engagement. Total attention quantifies the proportion of the asset that attracts attention. Start attention measures the AI focus on the areas of interest (AOIs) in the initial 2 s, while end attention measures the AI focus on the AOIs in the final 2 s. The initiation and termination of attentional processes (start and end of attention) are crucial in identifying cognitive states, including interest and distraction. This understanding is fundamental for developing predictive models of reading behaviour and implementing effective distraction management strategies (Vadiraja et al., 2021). Cognitive demand, which refers to the quantity of information a viewer must process within a given asset, can be evaluated through various metrics, including eye movements and pupillometry. These measures provide valuable insights into the cognitive effort expended during text processing (Zagermann et al., 2018). Research has demonstrated that text complexity significantly influences eye movement patterns, with more challenging texts resulting in prolonged fixation durations and reduced reading speeds (Bayat & Pomplun, 2016). Clarity, which predicts consumers’ perceived comprehensibility of an asset, is paramount in enhancing reading outcomes within educational contexts. Empirical evidence suggests that clear instructional communication and strategic reading behaviours can improve comprehension and learning outcomes across various educational settings, including traditional and online learning environments (Locher & Philipp, 2023; Riapina et al., 2023). Engagement, defined as the anticipated level of excitement and immersion experienced by consumers when exposed to an asset, can be measured with precision using eye-tracking technology. Given the nature of the data generated by the AI-driven eye-tracking software ‘Predict’, statistical analysis could not be conducted, as the results produced a single score for each metric per article version (HND White, HND Black, OxFoodbank White, OxFoodbank Black). Consequently, spider chart visualisation was deemed the most appropriate method for analysing the impact of content structure and background colour contrast on reader engagement, cognitive processing, and emotional responses. This advanced approach captures detailed gaze patterns that reflect underlying cognitive processes, enabling the assessment of various aspects of reading behaviour, such as comprehension, interaction with feedback, and thought patterns. Consequently, eye tracking provides valuable insights into how readers engage with textual content (Pattemore & Gilabert, 2023; van der Sluis & van den Broek, 2023).

2.1.2. Research Methods for Emotional Analysis

To assess the emotional impact of readers while reading the e-magazines, ’Tobii Sticky’ was employed to test eye tracking and emotional responses. Webcam-based eye-tracking technology offers significant potential for understanding reading behaviours on digital platforms. Researchers can obtain valuable insights into text processing, identify reading challenges, and develop targeted interventions to enhance reading comprehension and focus by utilising eye-tracking technology to capture real-time data on ocular movements (Ikermane & Mouatasim, 2023). To compare the emotional responses, the analysis methods encompassed calculating the mean difference between emotional and mood responses to the two distinct backgrounds (white versus black) utilising paired sample t-tests. This methodology facilitated the determination of whether the differences in emotional and mood responses were statistically significant across the two versions. Physiological responses, including arousal and impulsivity, are influenced by colours. Whilst hue has a more pronounced effect on arousal, chroma primarily impacts impulsivity. Research demonstrates that varying hues and chroma levels can modify reaction times and error frequencies, suggesting a direct connection between colour and emotional stimulation (Duan, 2017). For each metric, the mean difference was calculated as the response to the white background minus the response to the black background, with the results presented alongside their respective t-statistics and p-values to evaluate statistical significance. The mean difference indicates the overall change in emotions or mood between the two versions by demonstrating whether participants’ emotional responses increased or decreased in one condition relative to the other. The paired t-test was selected because it is specifically designed to compare two related samples, such as the emotional responses of the same participants to two different article backgrounds. The t-test evaluates whether the observed differences in emotions or mood across the two conditions are statistically significant, indicating whether the differences are likely attributable to the background rather than random variation. By employing the t-test, we can ascertain if any observed differences in mean emotional responses are meaningful and consistent across participants. In addition to statistical testing, visualisations of emotional and mood trends were generated for both article versions, depicting how emotions fluctuated over the 12 s test period. The process of emotional comprehension whilst reading engages both the neural networks associated with reading and brain areas linked to emotional stimuli. For instance, the anterior insula, activated by particular emotions such as disgust, responds as swiftly as 200 ms following exposure to emotive words (Ponz et al., 2014). Line graphs for each emotional metric were produced to capture the dynamic changes in user emotional states, facilitating the identification of particular emotions that were more intense or sustained across different backgrounds. These graphs illustrated key patterns and identified which emotional and mood responses were most affected by background colour during the user experience. In addition to the t-test, Cohen’s d was calculated to quantify the effect size of the observed differences. Cohen’s d provides a standardised measure of the magnitude of the mean difference, facilitating the interpretation of the practical significance of the results. For paired samples, Cohen’s d is calculated by dividing the mean difference by the standard deviation of the differences, offering a precise indication of the meaningfulness of changes across the two conditions. Effect sizes were categorised as small, medium, or large to provide further context regarding the strength of the observed effects. While the t-test evaluates whether the observed differences are statistically significant—i.e., unlikely to be due to random variation—Cohen’s d complements this analysis by assessing the practical importance of these differences. Together, the t-test and Cohen’s d enable the determination of not only whether the differences in emotional and mood responses are meaningful and consistent across participants but also the extent to which they impact participants’ overall emotional experiences.

2.2. Testing on Human Studies—Setup

A sample of 144 participants (both genders, 18–50) from Oxford Business College was recruited to test the emotional impact on readers. Of these, 93 recordings were captured, while 51 were disqualified due to low quality. The study lasted ten days and was accessed via a pop-up banner created explicitly for study purposes and distributed by the OBC marketing department among their students. A priori power analysis was conducted using G*Power software (v.3.1.9.7.) (Faul et al., 2007, 2009) to determine the required sample size for this neuromarketing study. Given the typical small to medium effect sizes reported in neuromarketing research on stimuli, an effect size of 0.3 was selected. The power was set at 0.8, adhering to the expected standard of ensuring an 80% probability of detecting an actual effect if present. With a two-sided significance level of 5%, the G*Power output (Appendix A Figure A1) indicated a minimum required sample size of 90 participants for a paired t-test. This sample size is sufficient to achieve the desired statistical power and significance level, thereby enhancing the reliability and validity of the results obtained from the paired t-test analysis in this neuromarketing investigation. The high costs associated with neuromarketing research equipment often result in limited sample sizes due to financial constraints. Nevertheless, researchers have suggested that employing artificial intelligence and neural networks could be more economical, potentially enabling larger sample sizes without sacrificing data quality (Awadh et al., 2022). Participants were recruited from the student database of Oxford Business College. Participation was voluntary, and no incentives were provided. The experimental procedure began with a 5-point eye-tracker calibration, lasting 27 s. Participants were then given the following task: “Hello, in the current study, you will see different articles. Your task is to read each article as you typically would. You can advance to the other article with a mouse click whenever you finish reading. We appreciate your help. Start the study by pressing the spacebar.” Participants could not skip specific parts of the research, but mouse clicks were measured to determine how many participants wished to terminate the study prematurely. These data indicated the total number of participants interested in the content. Research by Wilcox et al. (2023) has revealed that the mouse tracking for reading (MoTR) instrument can measure reading times through mouse movements, offering an affordable alternative to eye-tracking technology for analysing reading engagement. The total duration of the study was a maximum of 10 min; however, participants could complete it sooner. We determined a study length of 10 min due to individual participants’ diverse reading patterns and behaviours, notably as we measured behaviour across four articles. Due to our focus on capturing emotions exclusively in this study, we did not concentrate on other metrics gathered from this research.

2.3. Testing with AI Eye Tracking—Setup

The HND and OxFoodbank articles with inverted backgrounds were subjected to analysis using AI eye-tracking software. Four articles were examined: two with original backgrounds for HND and OxFoodbank and two with inverted backgrounds in black. Areas of interest (AOIs) were selected in identical positions for the HND article with inverted background to accurately measure total attention, start/end attention, engagement, clarity, time spent and percentage seen (Appendix B Figure A4a). For the OxFoodbank article, AOIs were similarly positioned on both backgrounds to precisely measure the same metrics as those utilised for the HND article (Appendix B Figure A4b). Visual analytics can reveal reading strategies by examining sequential patterns in eye-tracking data. This technique can be employed to investigate the impact of inverted backgrounds on reading behaviours, offering valuable insights into how various visual presentations influence comprehension and information retention (Yang, 2020).

3. Attentional Processing Results

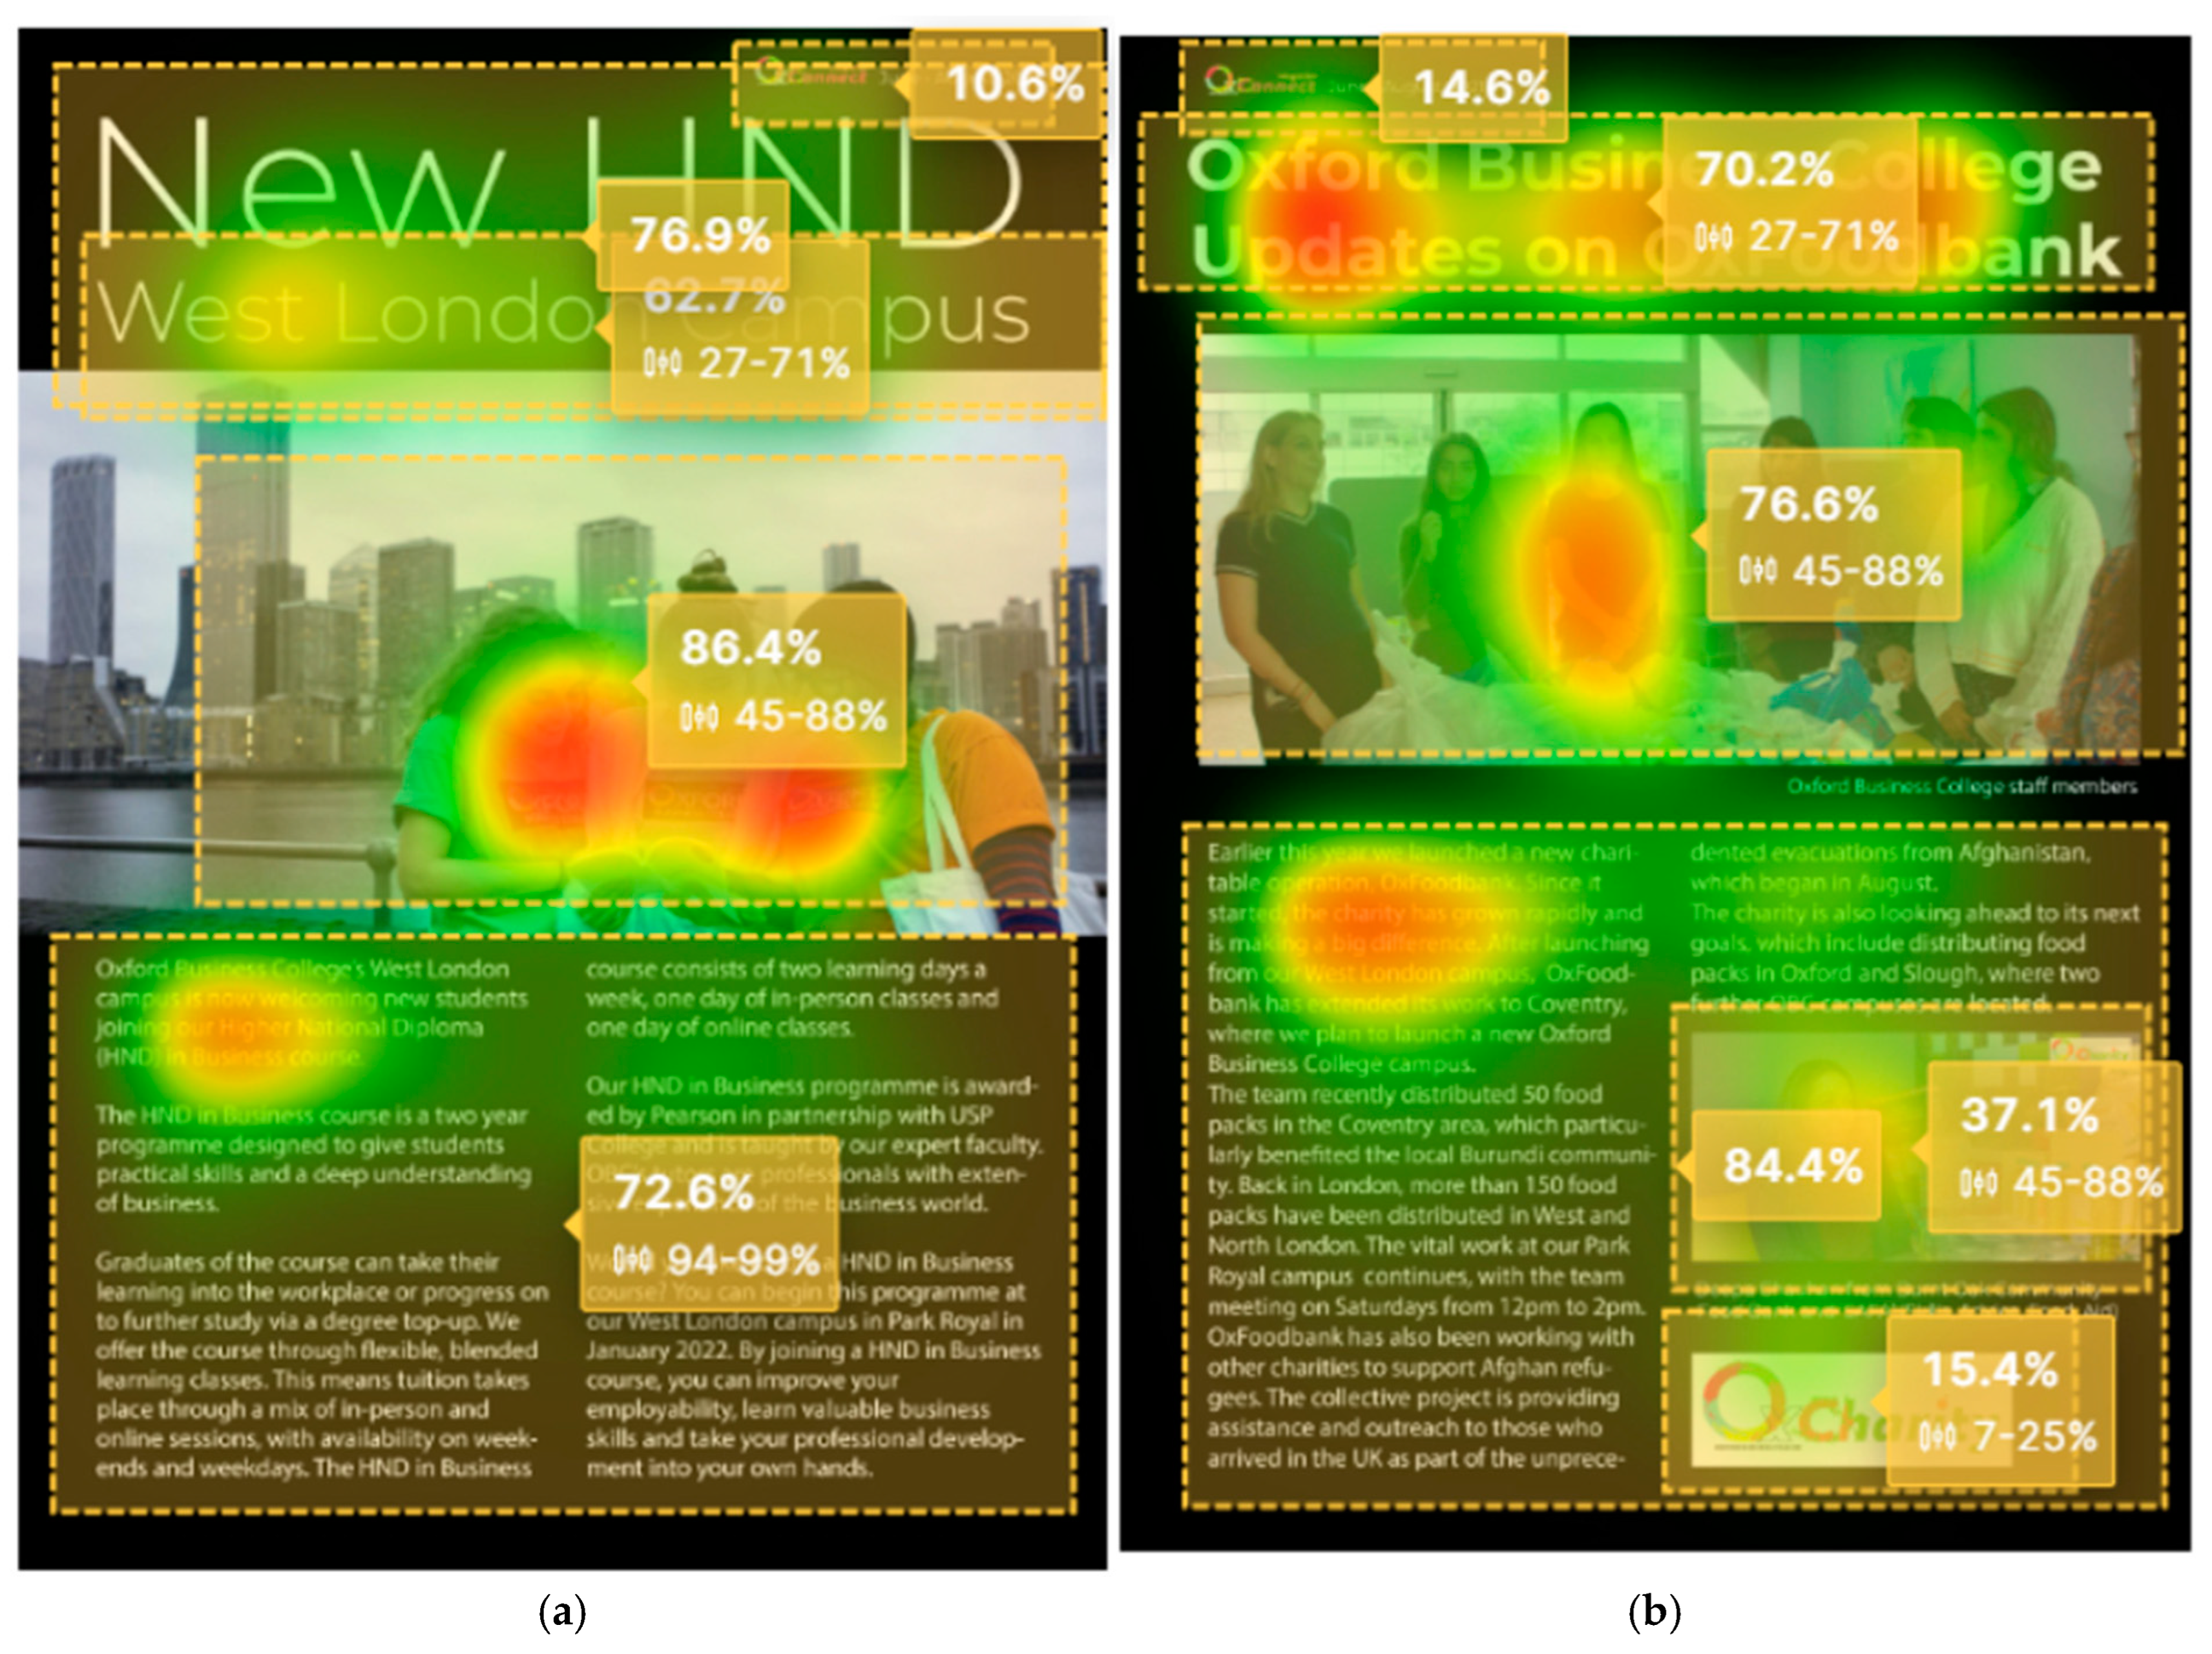
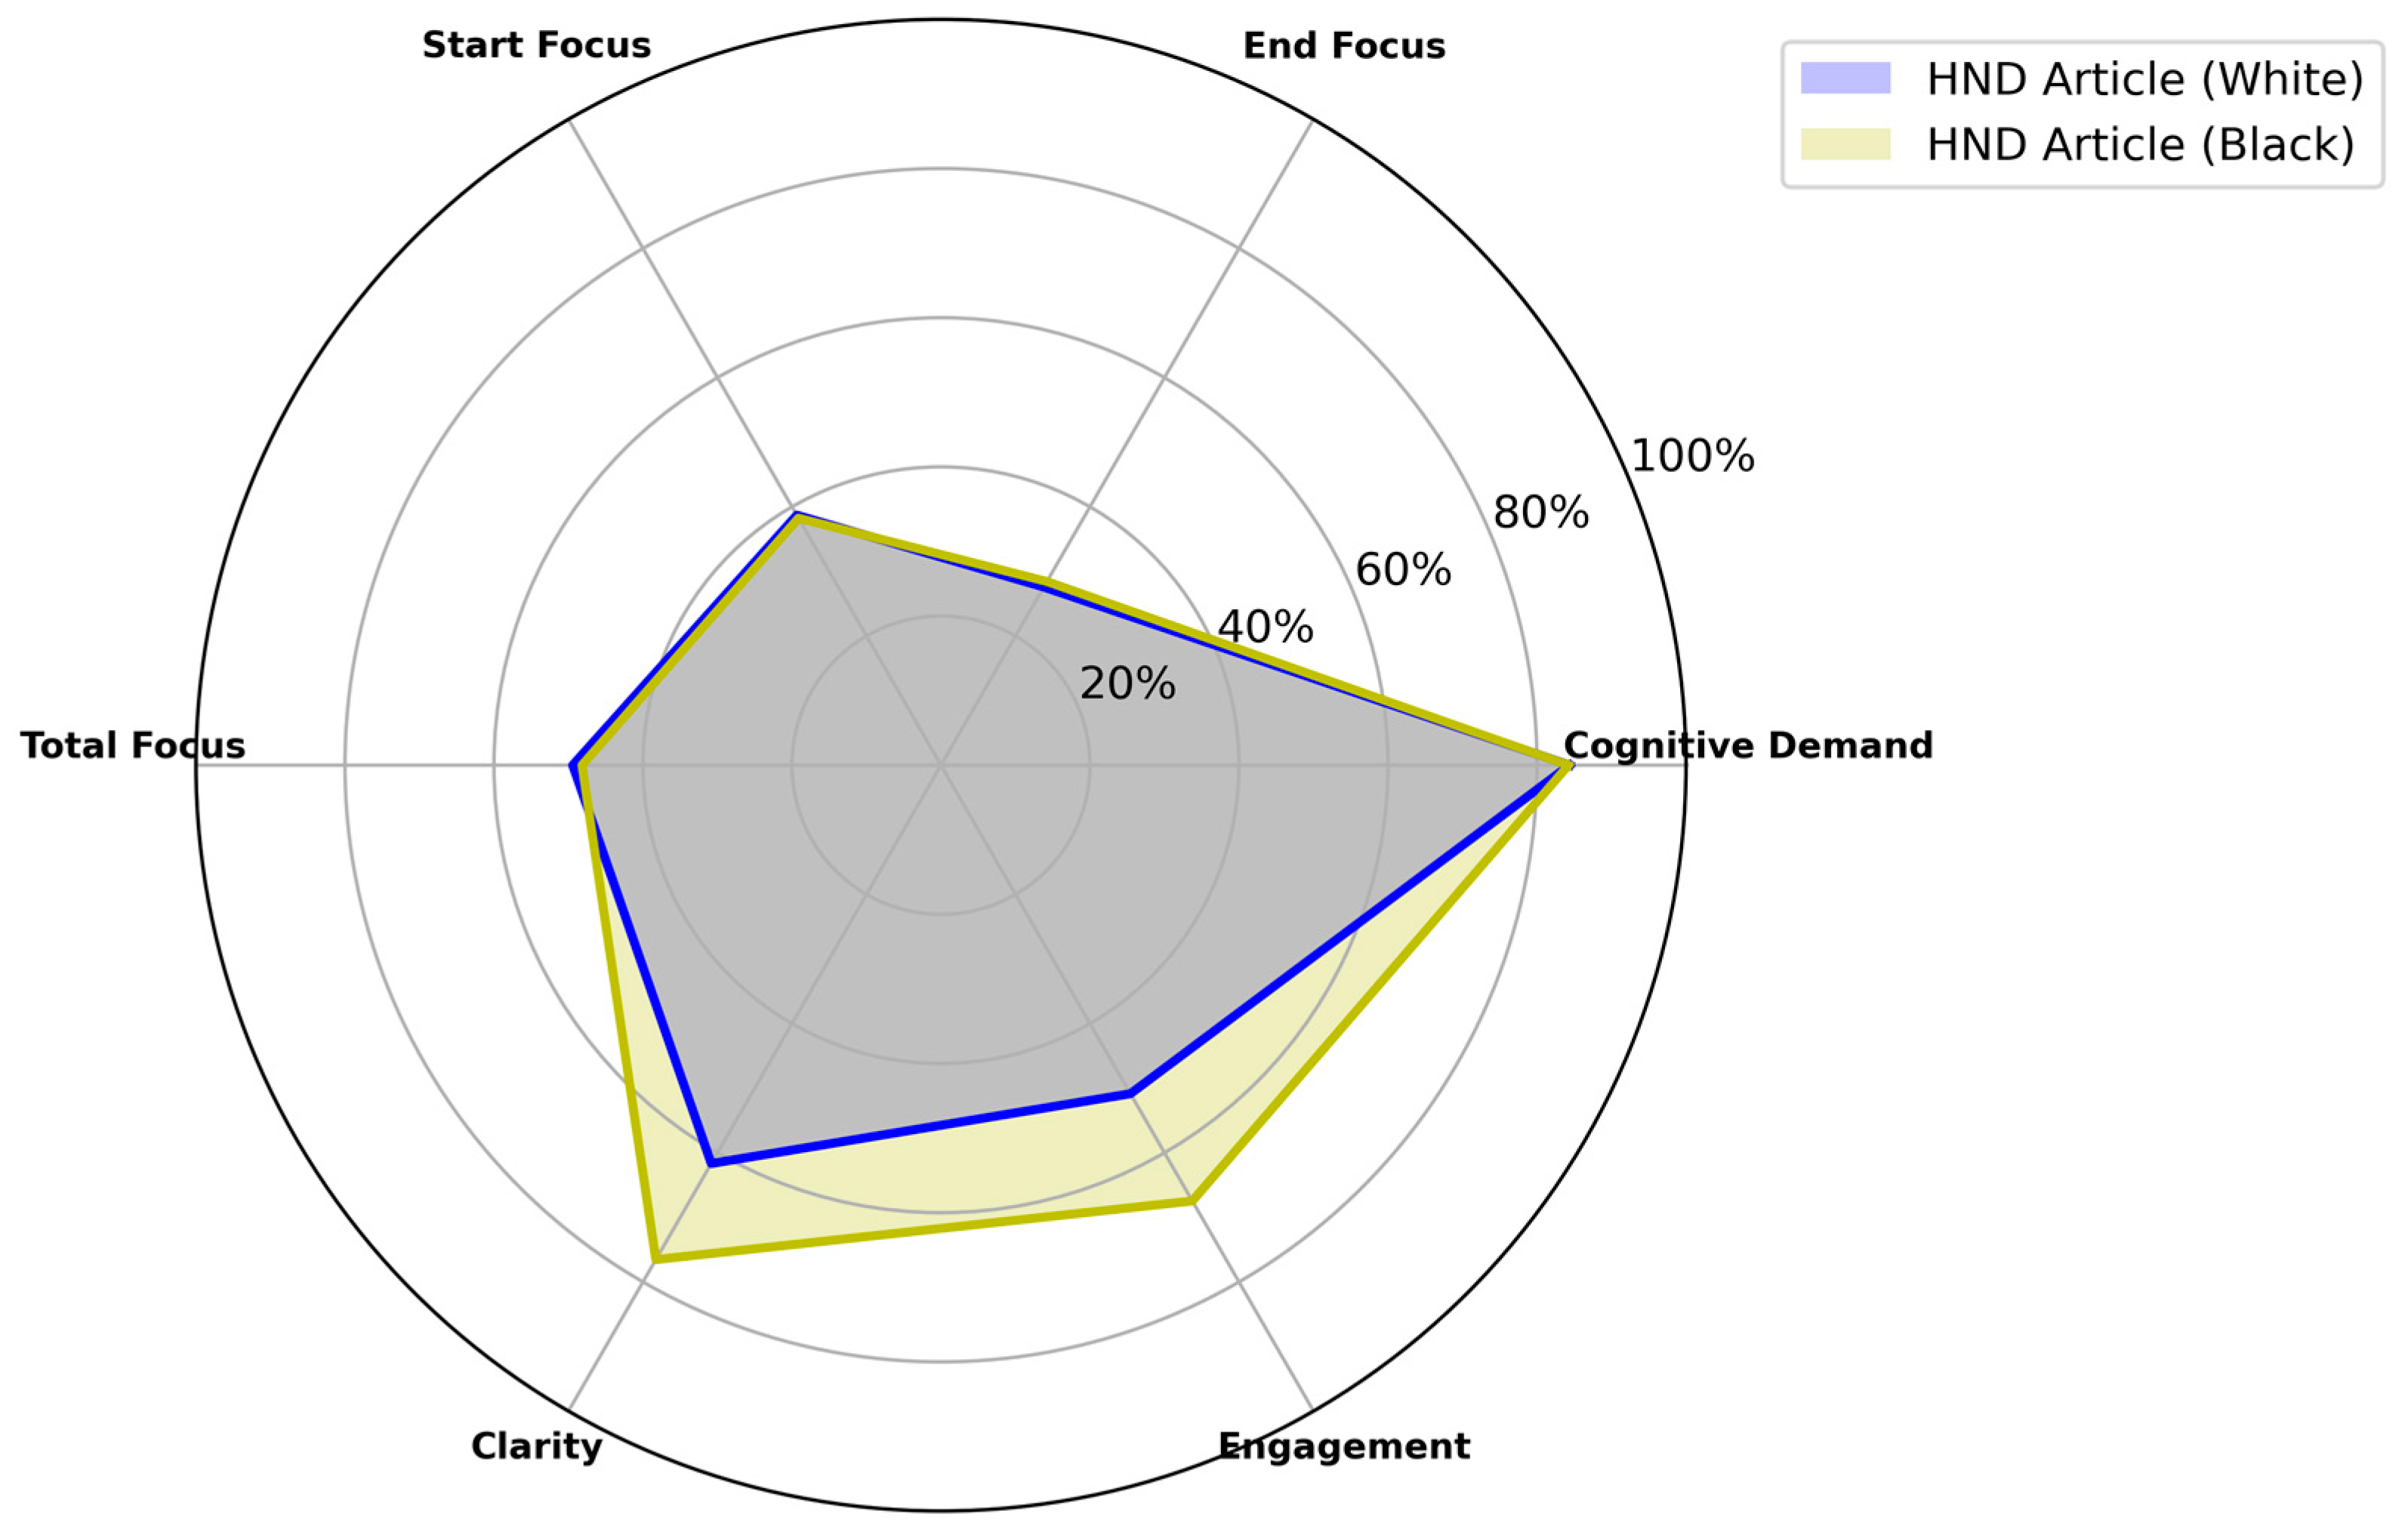
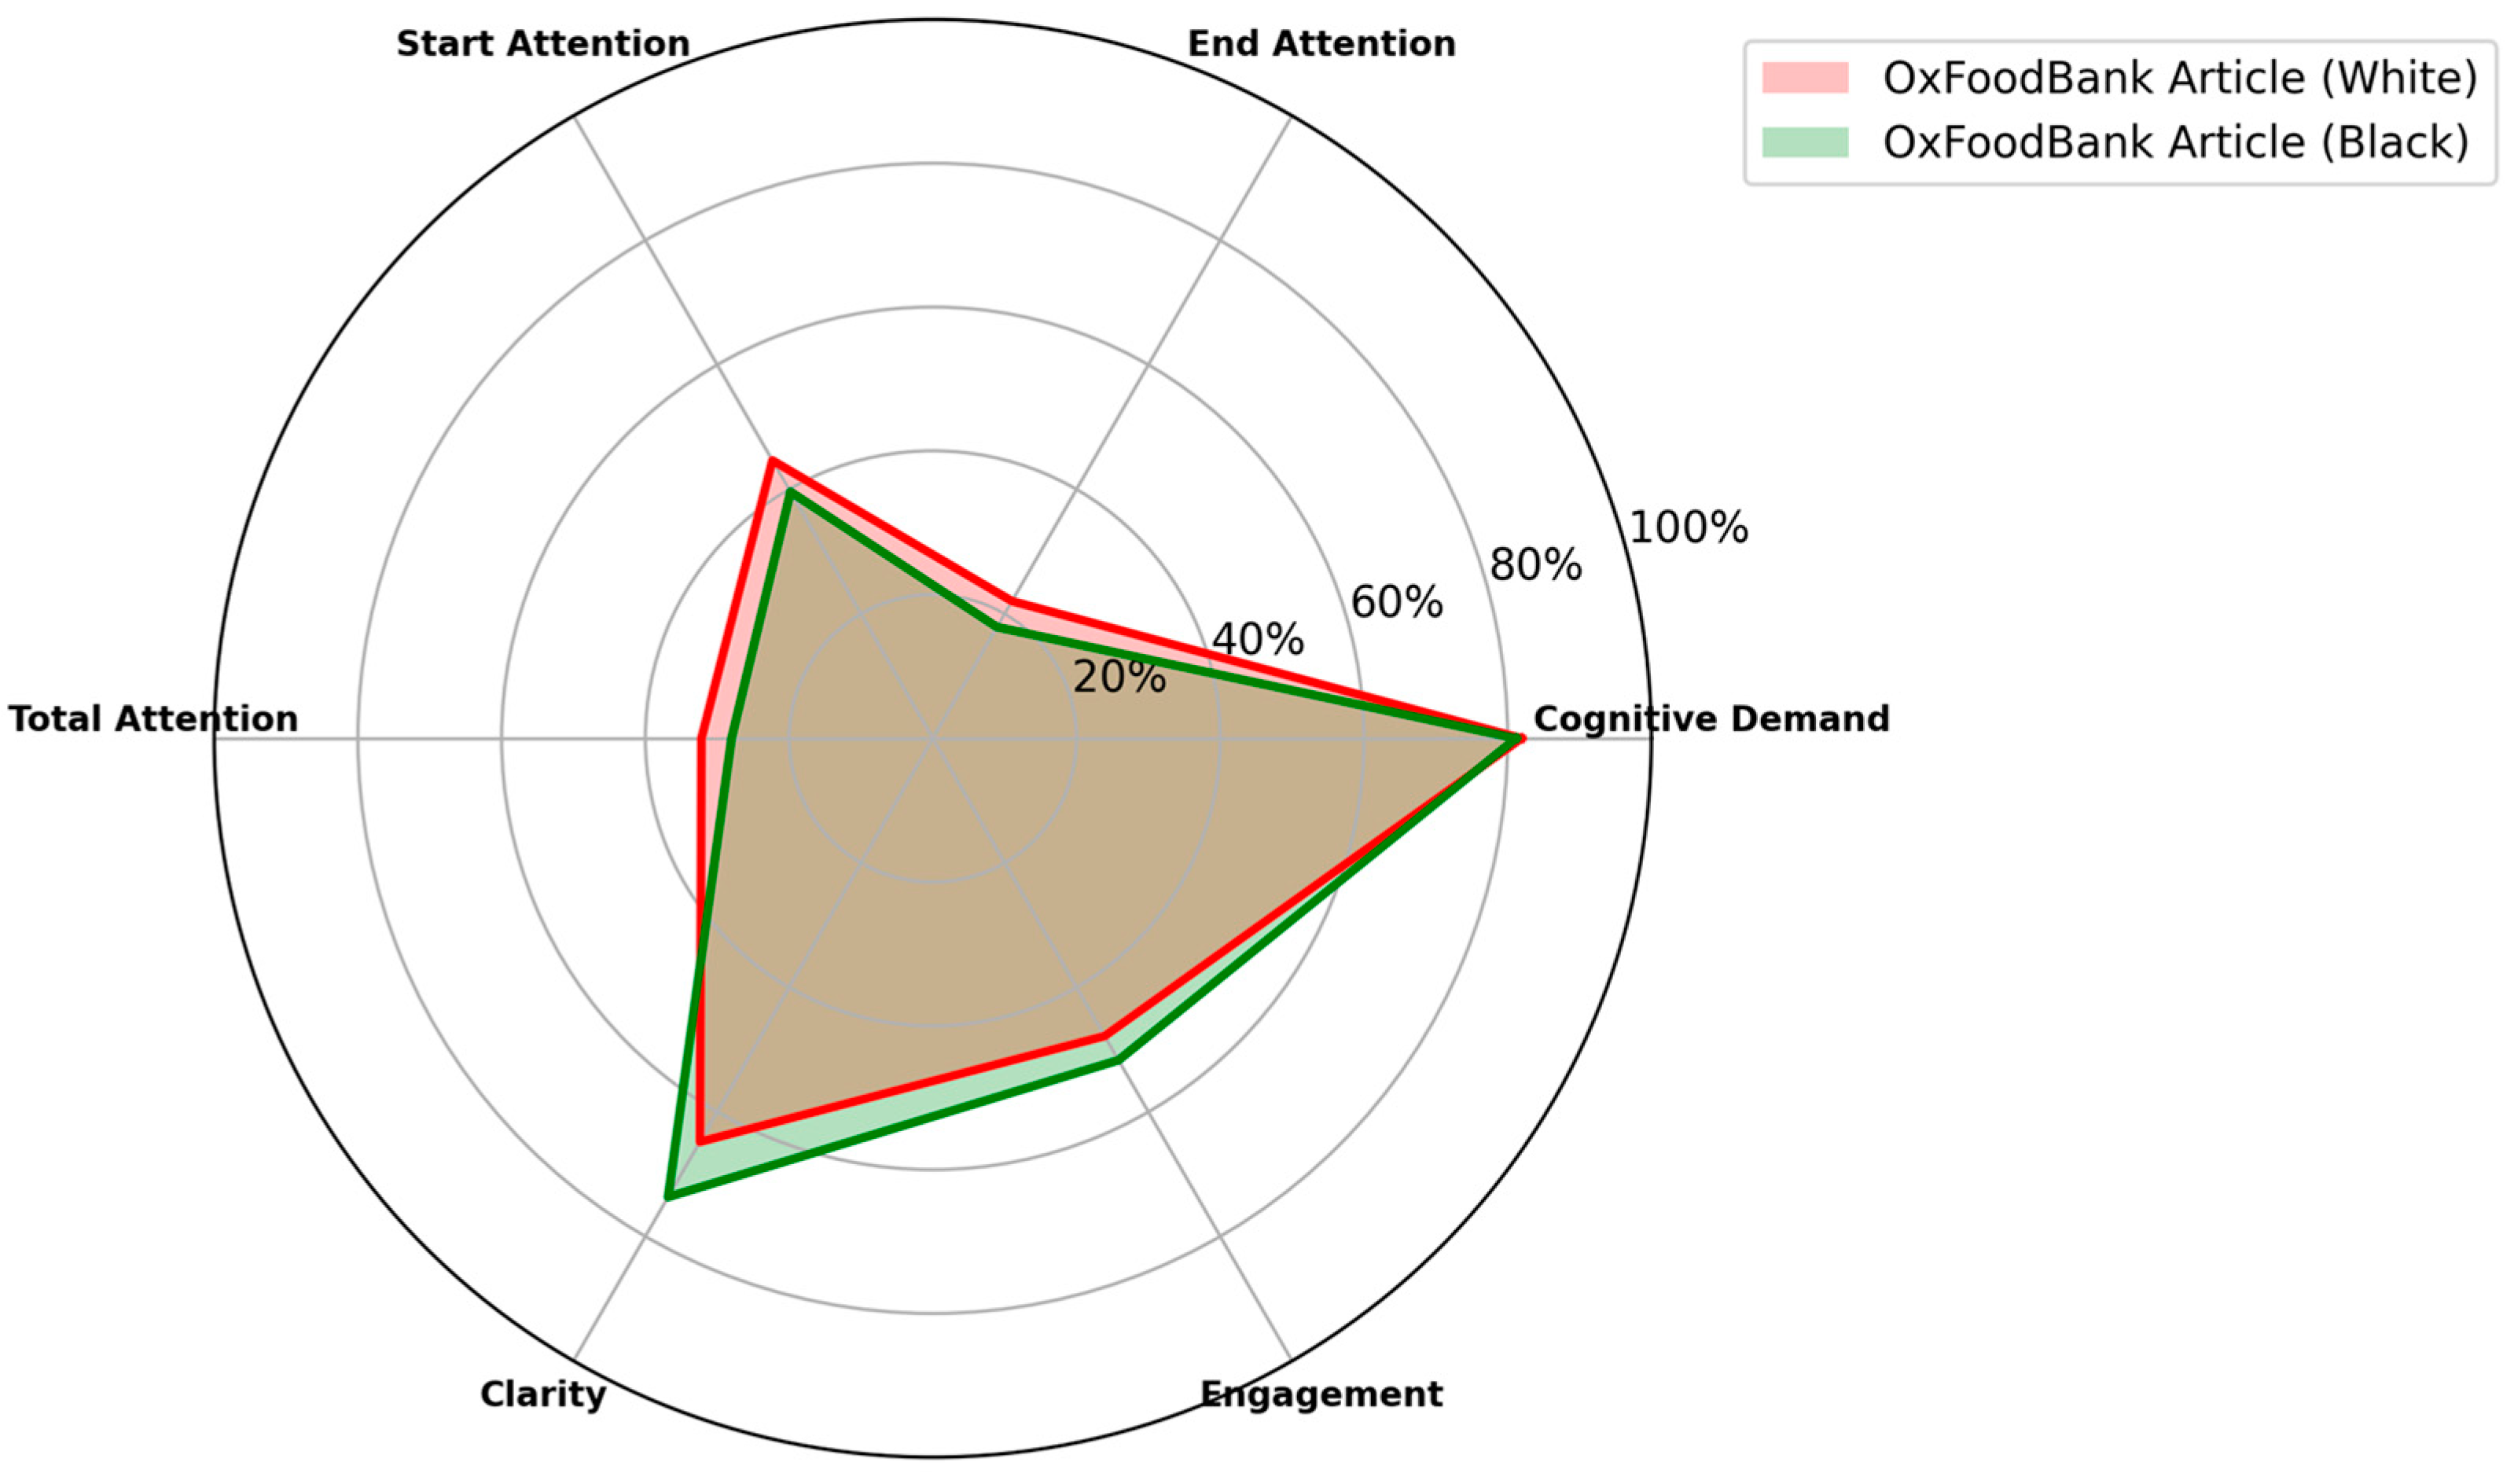
3.1. A Comparative Analysis on Key Attention Metrics Between HND and OxFood Article

The radar chart (Figure 1) compares the six key attention metrics: total focus, start focus, end focus, cognitive demand, clarity, and engagement for the HND article presented with both a white and black background. The overall configuration of the chart indicates that the two versions perform similarly across most metrics; however, notable differences can be observed in clarity and engagement.
Regarding total focus, the white background version achieved a value of 49.44% compared with 48.20% for the black background, indicating closely aligned performance with minimal variation. Similarly, start focus values were 38.71% for the white background and 38.25% for the black background, while end focus values were 27.58% and 28.43%, respectively. These results suggest that the background colour did not significantly influence the duration of participants’ focus on the content or the direction of their attention at the commencement or conclusion of the reading process. For cognitive demand, the white background scored 84.37%, compared with 84.21% for the black background, further demonstrating consistency in the mental effort required to process the content across the two designs. Attention capture is strengthened when cues are consistently valid, while predictably invalid cues reduce capture. This indicates that cognitive approaches can shape the initial capture and subsequent maintenance of attention during the reading process (Whitehead et al., 2019).
However, more substantial differences are evident in the clarity and engagement metrics. For clarity, the black background scored considerably higher (76.54%) compared with the white background (61.67%), indicating that participants found the content more comprehensible when presented against the black background. This could be attributed to the enhanced contrast provided by the black background, rendering the text more legible and visually distinct. Similarly, engagement was higher for the black background, scoring 67.47% compared with 50.86% for the white background. This suggests that participants were more involved or invested in the content when it was presented in this format, potentially due to the immersive nature of the black background.
In conclusion, while both versions perform similarly on metrics such as total focus and cognitive demand, the black background leads to significant improvements in clarity and engagement, rendering it a potentially superior choice for enhancing the reading experience without increasing cognitive load. These findings highlight the importance of compelling headlines and images for initial engagement but emphasise the critical role of informative body text in sustaining reader interest. The necessity for succinct, relevant information at the outset of articles is highlighted by the swift transition to content engagement within two seconds, aiming to capitalise on readers’ attention spans. A trend towards digital magazines is emerging, which, whilst seemingly minor, could impact overall user interaction. Additionally, there is an increasing focus on the importance of superior visual elements, which has become a prominent trend. Selecting appropriate visual content is crucial, yet this alone may be insufficient. Other aspects, such as content arrangement and placement, are equally vital. Studies indicate that readers associate information when presented with stimuli, making it essential to position visual and textual elements in close proximity (Šola et al., 2024c).
With regard to total focus, start focus, and end focus, the two background versions exhibit minor variations. The OxFoodbank white background version demonstrates a higher capacity to capture readers’ attention compared with its black counterpart, with total focus measuring 32.20% versus 28.02%, start focus at 44.65% versus 39.61%, and end focus at 22.04% versus 17.88% (Figure 2). These findings indicate that the white background is more efficacious in sustaining attention throughout the reading process. However, the black background demonstrates superior performance in terms of clarity, achieving a score of 73.68% compared with 64.82% for the white background. This suggests that participants perceived the content as more comprehensible and visually distinct when presented on a black background. The elevated Clarity score may be attributed to the high contrast of the black background, which potentially mitigates distractions and enhances text legibility. Engagement is also marginally higher for the black background, with a score of 51.70% compared with 47.83% for the white background. This implies that readers exhibited greater engagement or investment in the content when presented in this format, potentially indicating that the black background creates a more immersive or attention-capturing reading environment. The cognitive demand metric is nearly identical across both versions, with a score of 81.93% for the white background and 81.19% for the black background. This indicates that the mental effort required to process the content remained consistent, irrespective of the background colour. In conclusion, these insights suggest that, while the white background is more effective in eliciting initial and sustained focus, the black background may provide a more engaging and clearer reading experience overall.

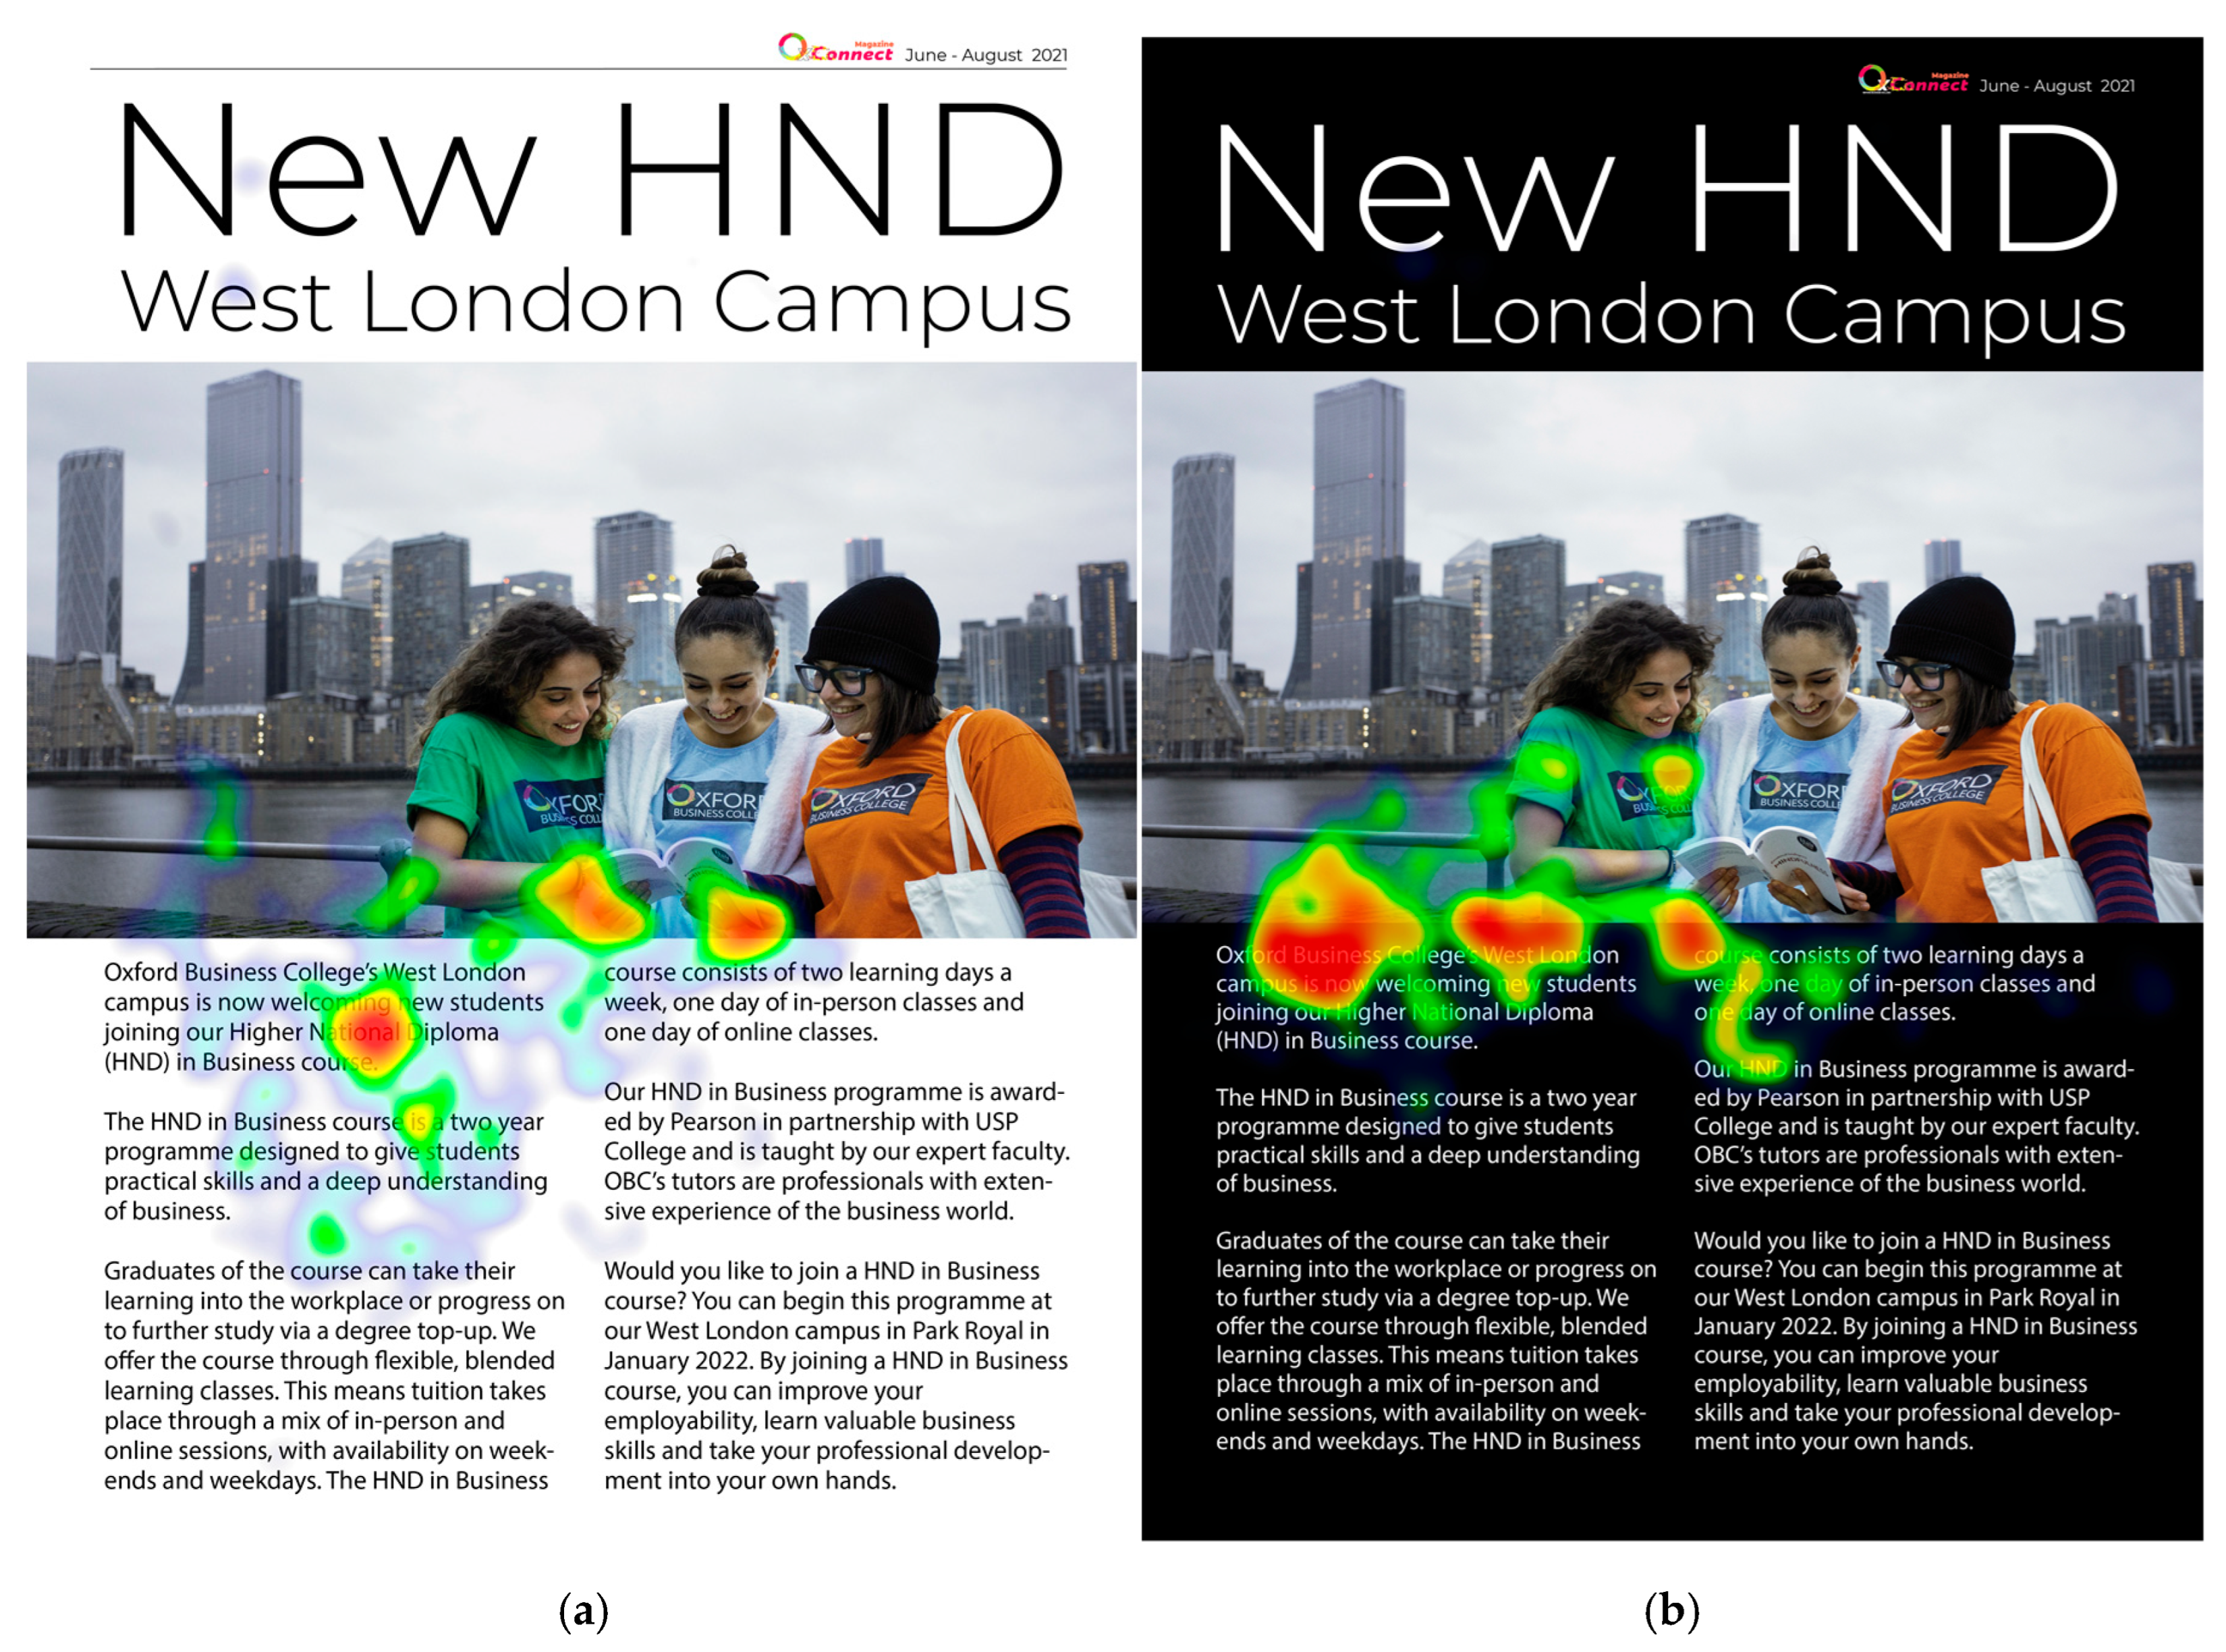
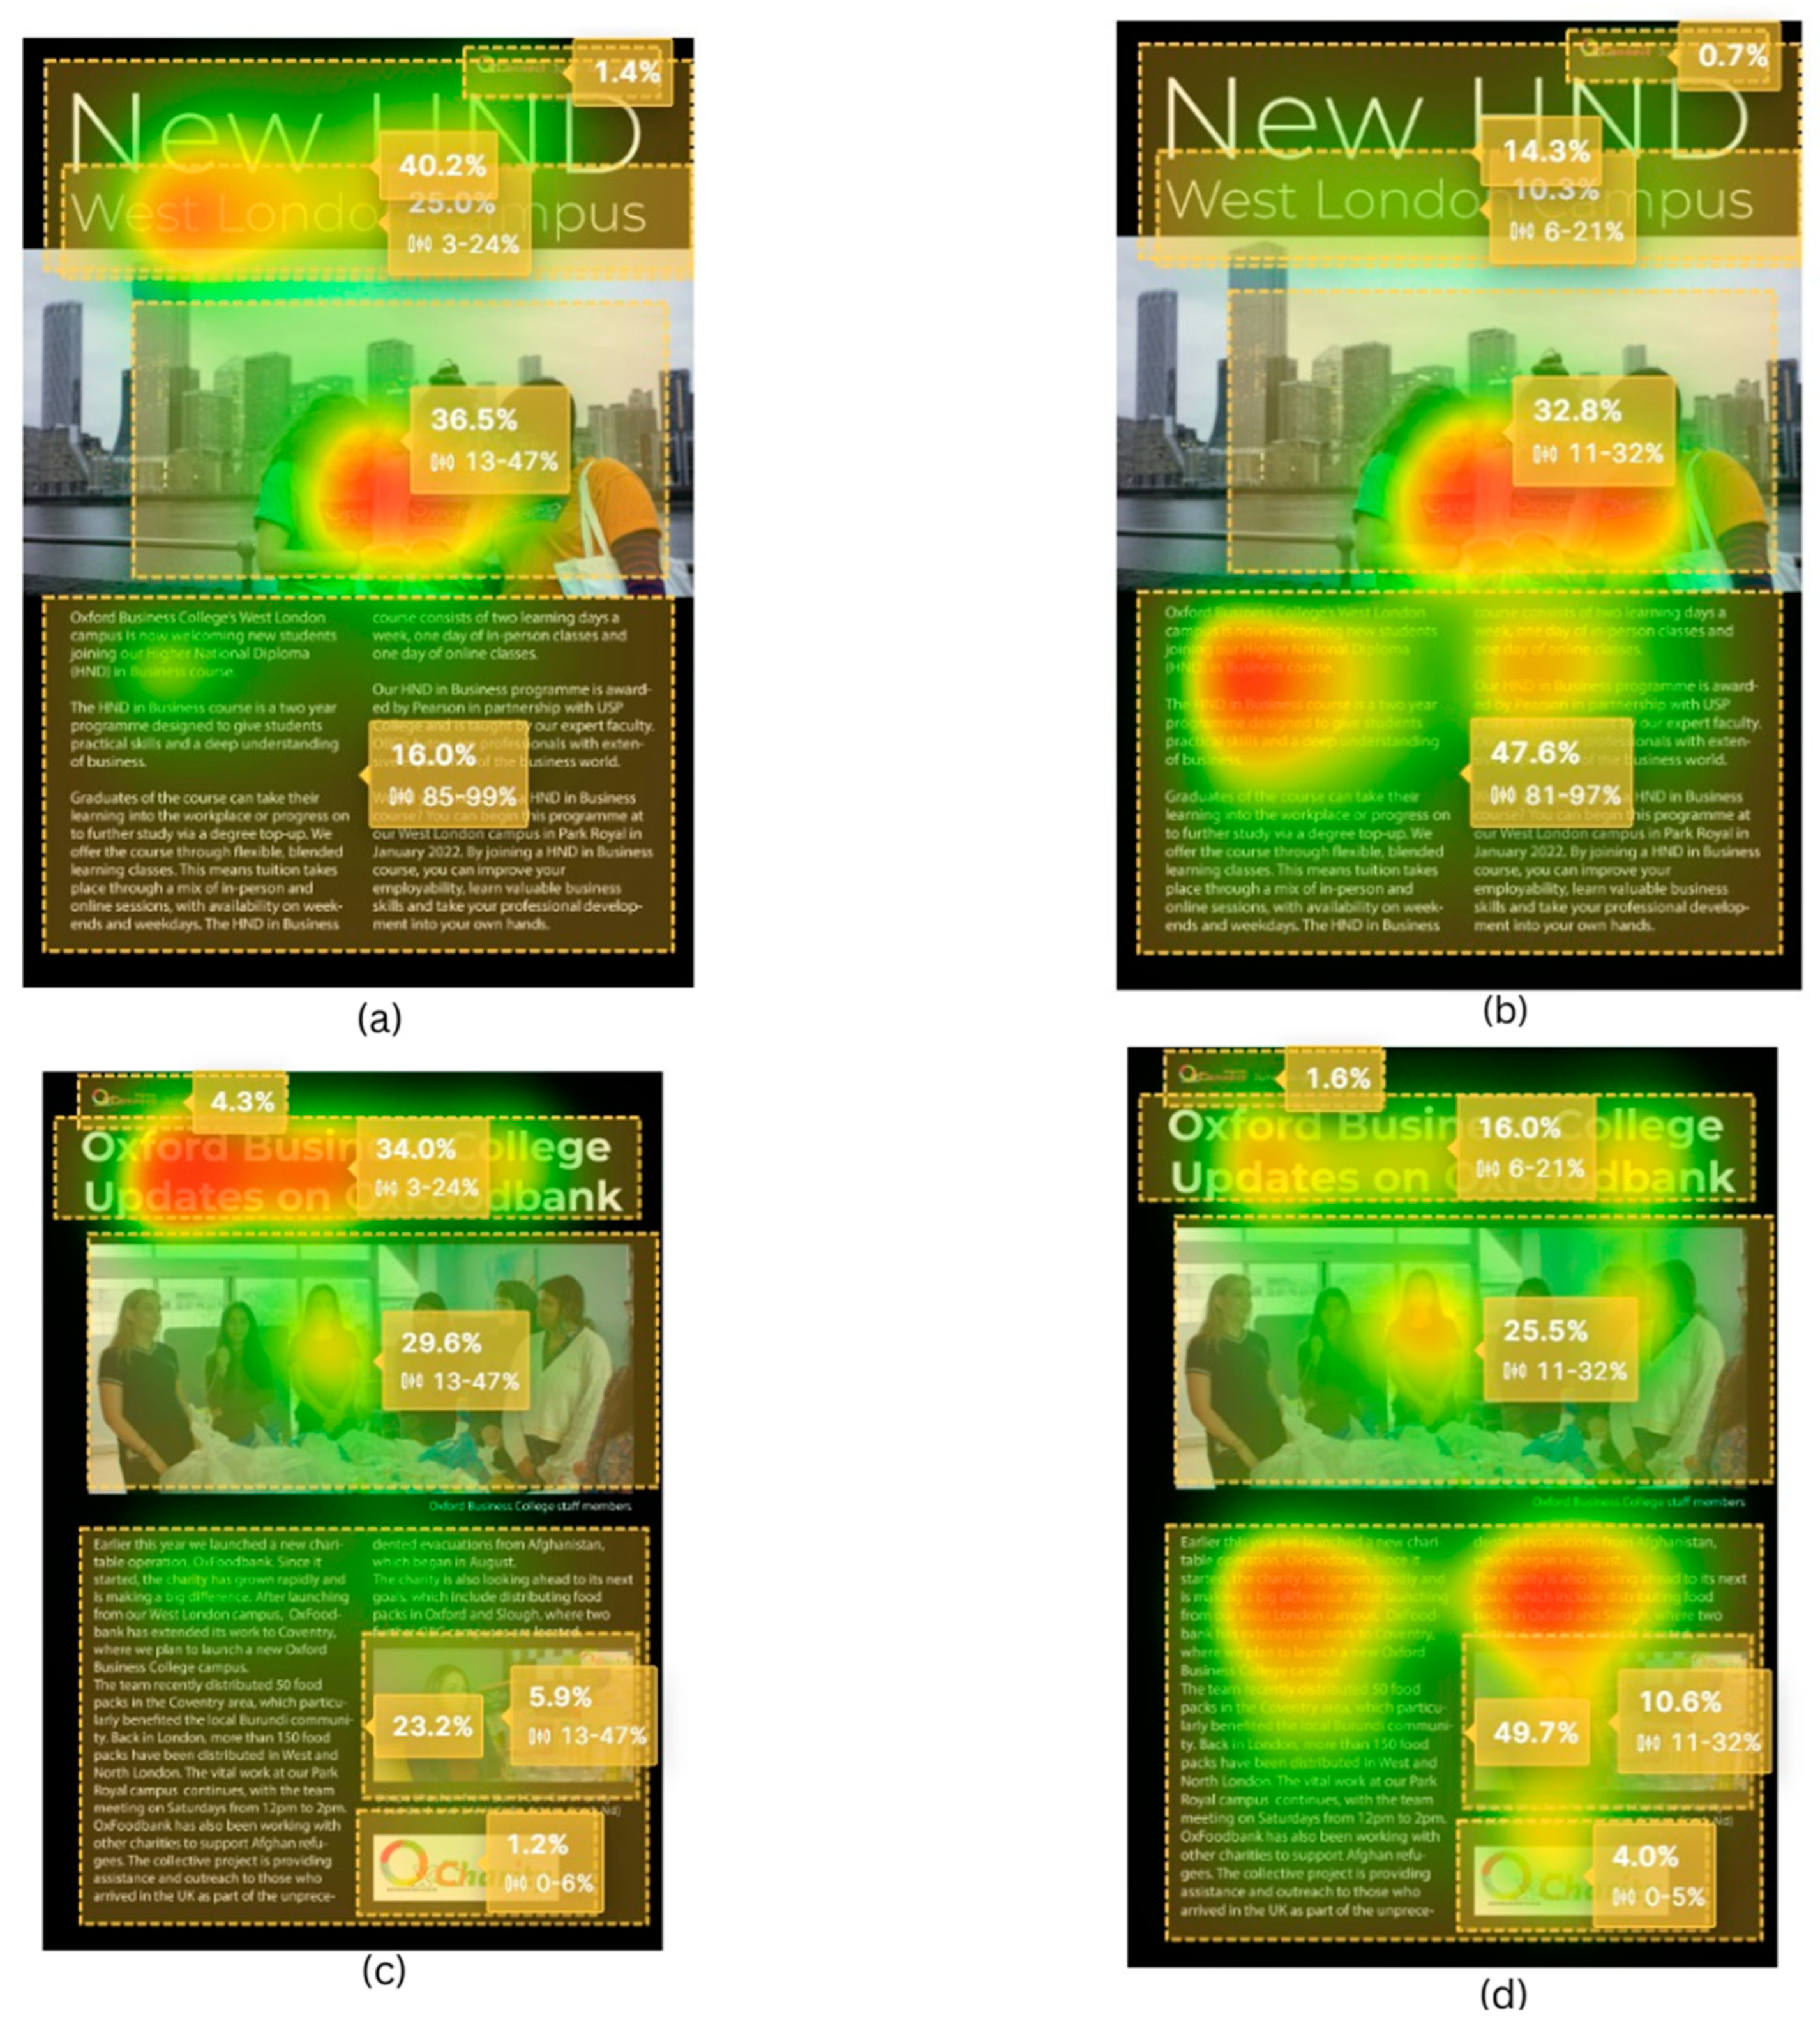
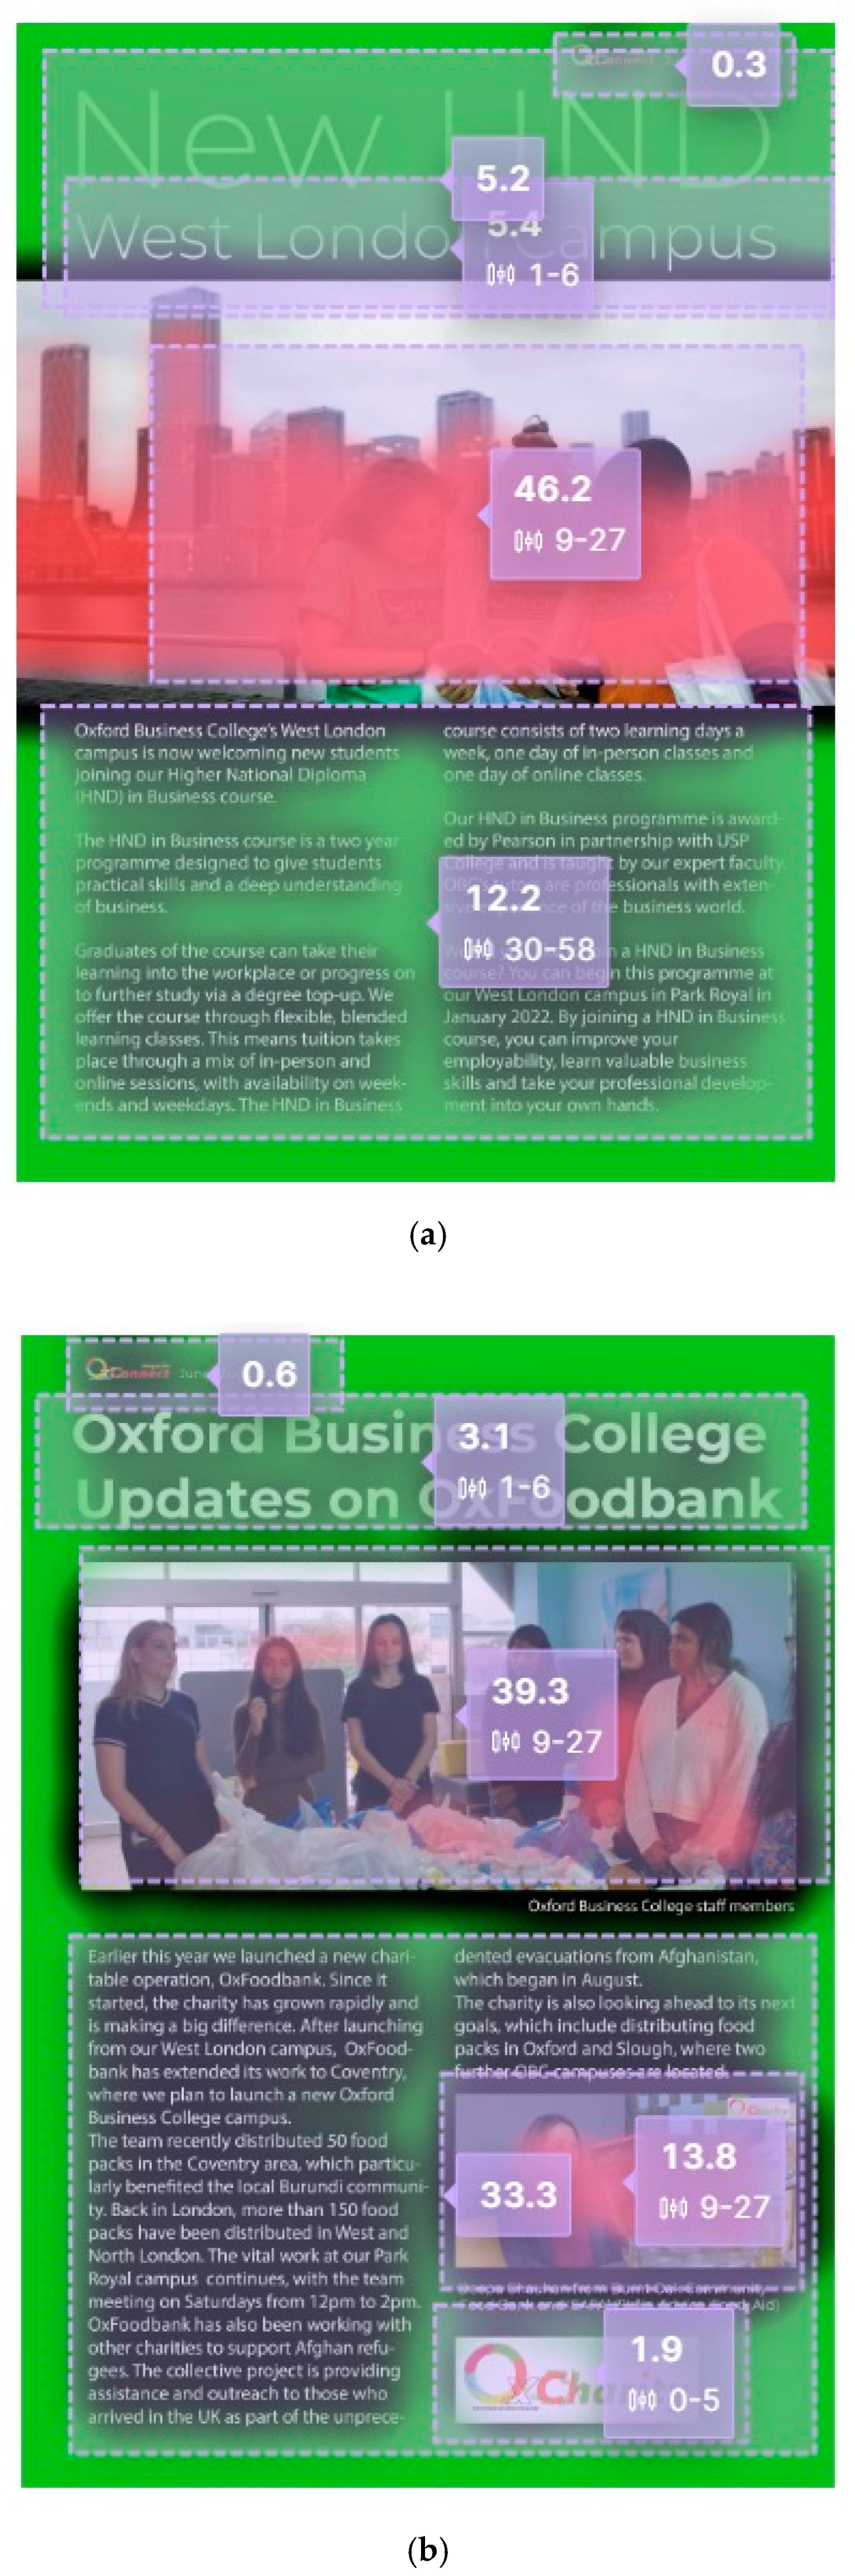
3.2. Reading Patterns in HND and OxFoodbank Articles with White Background

Analysing attention patterns in the HND and OxFoodbank articles reveals intriguing insights into predicting reader engagement. The most striking finding is the substantial shift in attention from visual elements to body text in both articles, indicating a progression from initial visual scanning to more in-depth content engagement. In the HND article, attention to the body text increased dramatically from 18.1% to 46.8% within the first two seconds (Figure 3a,b). This significant shift suggests that readers quickly moved beyond the headline and central image to engage with the article’s main content. The headline “New HND West London Campus” and the accompanying central image initially captured strong focus, as evidenced by the red areas in the heatmaps, effectively serving as entry points for reader engagement. Similarly, the OxFoodbank article demonstrated a notable increase in attention to the body text, particularly in the area detailing the charity’s work, with focus rising from 23.9% to 50.4% (Figure 3c,d). This pattern underscores readers’ interest in substantive information about the charity’s activities. Interestingly, the article’s last text segment also gained considerable attention, increasing from 7.4% to 14.9%, suggesting that readers were engaged throughout the content. A unique observation in the OxFoodbank article was the significant increase in attention to specific details, such as a community member’s name (2.6% increase) and the “OxCharity” logo (1.6% increase). This finding indicates readers’ interest in personal and organisational identifiers within the charity context. In both articles, the “OxConnect” logo experienced a decrease in attention, more pronounced in the OxFoodbank article (from 3.5% to 1.0%) compared with the HND article (from 0.8% to 0.4%). This trend suggests that, while branding elements initially capture some attention, readers quickly prioritise content over logos. These findings highlight the importance of compelling headlines and images for initial engagement but emphasise the critical role of informative body text in sustaining reader interest. The necessity for succinct, relevant information at the outset of articles is highlighted by the swift transition to content engagement within two seconds, aiming to capitalise on readers’ attention spans. A trend towards digital magazines is emerging, which, whilst seemingly minor, could impact overall user interaction. Additionally, there is an increasing focus on the importance of superior visual elements, which has become a prominent trend. Selecting appropriate visual content is crucial, yet this alone may be insufficient. Other aspects, such as content arrangement and placement, are equally vital. Studies indicate that readers associate information when presented with stimuli, making it essential to position visual and textual elements in close proximity (Šola et al., 2024c). The analysis of cognitive demand heatmaps for the HND and OxFoodbank white-background articles reveals intriguing patterns in reader engagement and information processing (Figure 4a,b). The most striking finding is the contrasting distribution of cognitive demand between the two articles. The HND article exhibits a concentrated cognitive demand in a single body text section (12.8%), whereas the OxFoodbank article demonstrates a more dispersed pattern across multiple sections. In the OxFoodbank article, the headline “Oxford Business College Updates on OxFoodbank” elicits moderate cognitive engagement (4.5%), suggesting that it effectively captures attention without imposing significant mental strain. The body text on the left side demands substantial cognitive resources, peaking at 28.2%. This high value indicates information-rich content or potentially challenging readability, possibly due to limited paragraph spacing. According to research, the absence of spaces between words negatively impacts reading efficiency and text processing. This phenomenon occurs because it interferes with the natural division of words, thereby making it more difficult for readers to isolate and focus on individual words (Drieghe et al., 2017).
The right side of the text exhibits moderate cognitive demand (3.9%), implying slightly less complex or more easily digestible information. Interestingly, both articles show minimal cognitive demand for logos, sub-images, and descriptions (0.2% to 2.1%), indicating that these elements contain non-essential information or receive limited focus from readers. The main images in both articles also require minimal cognitive effort (0.5% to 0.7%), suggesting that they serve more as visual anchors than informational elements. The temporal analysis of attention patterns reveals a consistent trend across both articles. Readers initially focus on headlines and visuals before transitioning to the main text. This pattern underscores the importance of well-crafted headlines and strategically placed visuals in guiding reader engagement. The importance of headlines in influencing readers’ choices and interaction with news content cannot be overstated. Research on selective news consumption has shown that headlines are more influential than visual elements in determining which news stories readers opt to explore (Powell et al., 2019). Over time, attention shifts more deeply into the body text, particularly in sections likely containing critical information. In conclusion, while both articles demonstrate effective content hierarchy, guiding readers from initial visual elements to detailed text, they differ significantly in cognitive demand distribution. The HND article presents a more streamlined, user-friendly reading experience, efficiently directing readers to a critical text area. In contrast, the OxFoodbank article requires sustained engagement across multiple sections, indicating more complex or diverse content. These findings highlight the importance of content structure and information distribution in shaping reader engagement and cognitive load in online articles.

3.3. Reading Patterns in HND and OxFoodbank Articles with Black Background

Analysing attention patterns for the HND and OxFoodbank articles reveals distinct engagement trends across visual and textual elements (Figure 5a–d). Research utilising eye-tracking technology demonstrates that attention, as indicated by the fixation and duration of eye movements, is linked to the ability to discern information, influencing how individuals interact with and understand written content (Pointon et al., 2023). For the HND article with a black background, the “OxConnect” logo experienced a decline in attention over time (initial: 1.4%, final: 0.7%). The headline “New HND West London Campus” initially captured significant focus, while the student image maintained consistent engagement. Body text attention increased substantially from 16% to 47.6%, indicating a shift from visual elements to detailed content, particularly in the upper sections containing crucial course information. In contrast, the OxFoodbank article’s black background version showed greater initial attention to the “OxConnect” logo (initial: 4.3%, final: 1.6%). The headline “Oxford Business College Updates on OxFoodbank” commanded a strong initial focus (39.6%), which decreased to 19% by the end. Unlike the HND article, the accompanying image received minimal attention (0.2% to 0.7%). Body text engagement in the OxFoodbank article was more evenly distributed. The first paragraph’s attention increased from 9.3% to 15.6%, the second from 2.4% to 11%, and the last from 6.8% to 13.6%. The sub-image slightly increased (0.7% to 1.0%), while its description garnered more than double the attention (1.2% to 3.2%). The “OxCharity” logo received minimal focus (0.1% to 1.6%). Notably, total attention for the entire text section in the OxFoodbank article more than doubled, rising from 23.5% to 50.1%. This progression suggests an initial captivation by the headline, followed by comprehensive engagement with the content, particularly sections detailing charity operations. These findings highlight the dynamic nature of visual attention in digital content consumption, emphasising the importance of strategically placing critical information and the interplay between visual and textual elements in maintaining reader engagement. The cognitive demand heatmaps for the HND and OxFoodbank articles with black backgrounds reveal distinct engagement patterns (Figure 6a,b). For content creators striving to communicate effectively, it is essential to strike a balance between clarity and cognitive stimulation in their writing (van der Wel et al., 2022) Analysis indicates low cognitive demand for the “OxConnect” logo in both articles, with values of 0.3% and 0.5% for HND and OxFoodbank, respectively. The HND article demonstrates concentrated cognitive demand (12.2%) in the lower text sections, comparable to its white background counterpart. In contrast, the OxFoodbank article exhibits a more widespread distribution of cognitive demand. The OxFoodbank headline, “Oxford Business College Updates on OxFoodbank”, elicits moderate cognitive demand (3.8%), suggesting effective reader engagement without overwhelming attention. The main image below the headline shows relatively low cognitive demand (0.5% to 0.7%). Notably, the text section commands the highest overall cognitive demand (33.3%), with individual paragraphs scoring 5.8%, 9.0%, and 5.0%, respectively. This indicates sustained reader engagement throughout the body text. The sub-image, description and the “OxCharity” logo require minimal cognitive effort (0.3% to 2.1%), mirroring the white background version. These findings highlight the HND article’s linear structure, guiding viewers to specific content areas. In contrast, the OxFoodbank article demands more continuous cognitive involvement, potentially due to its lack of paragraph spacing. This analysis underscores the importance of content structure and presentation in influencing reader engagement and cognitive processing. Comprehending the mental processes that occur during digital reading can inform the content development of content designed to boost reader engagement. Methods include adapting reading techniques to suit the particular context and leveraging digital tools to enrich the overall reading experience (Liao et al., 2024).

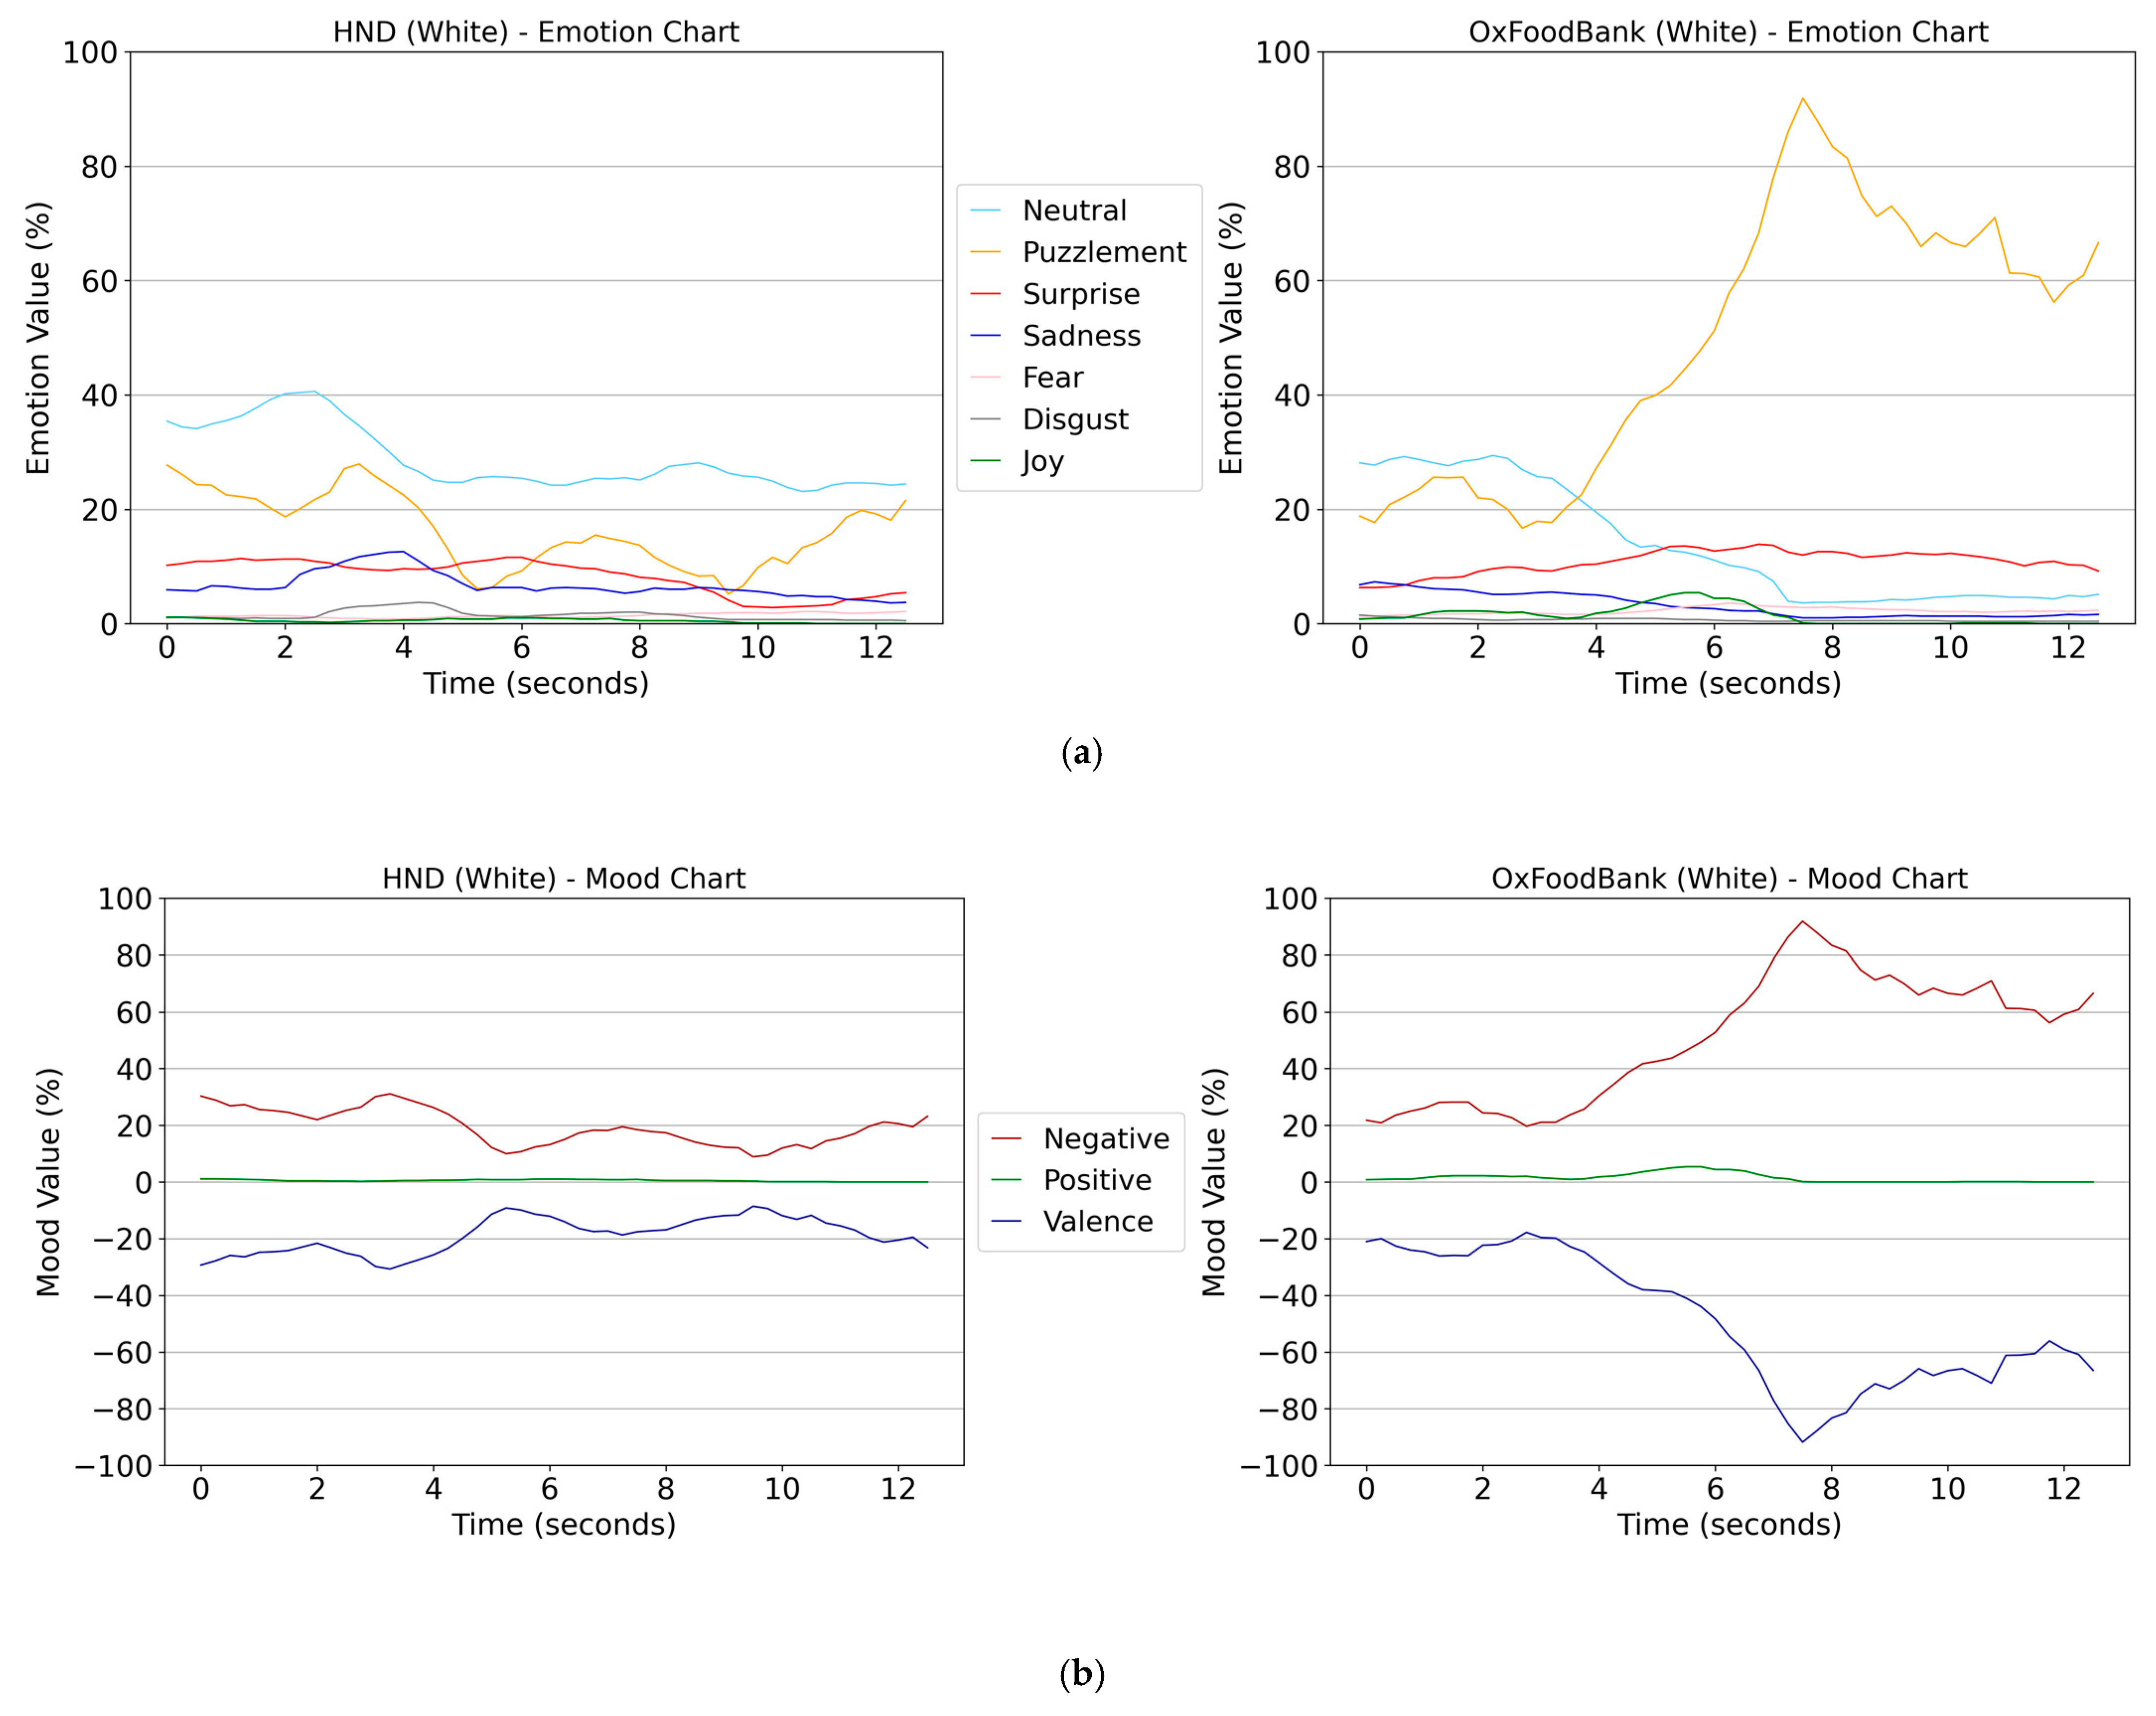
4. Emotional Processing Results

Analysis of emotional responses to white background designs reveals statistically significant differences across all metrics based on a paired t-test (Table 1). Participants exhibited a less neutral response to the OxFoodbank compared with the HND white background article, with a 15.14% positive mean difference (d = 2.65, large effect). This exceptionally large effect size not only highlights a statistically significant result but also underscores the practical importance of the HND white background in eliciting a more neutral emotional state, which may be particularly relevant for designing content intended to minimise emotional biases.
Conversely, the OxFoodbank white background induced a higher level of puzzlement, as evidenced by a −32.96% negative mean difference (d = −1.17, large effect). This large effect size indicates that the OxFoodbank design elicited significantly stronger feelings of confusion or cognitive conflict compared with the HND design. The data also indicate subtle but notable variations in other emotional responses. Surprise was marginally higher for OxFoodbank (−2.52% negative mean difference, d = −0.63, large effect), suggesting that, while this emotional response was less pronounced, it still holds practical significance due to its considerable effect size. Conversely, sadness exhibited a more pronounced effect with HND White (3.52% mean difference, d = 1.64, large effect), underscoring that even ostensibly positive design elements can elicit heightened emotional responses contingent upon contextual nuances.
Fear and joy were slightly elevated in response to OxFoodbank White (d = −1.21 and d = −0.65, both large effects). These results suggest that the OxFoodbank design may inadvertently evoke emotional states that could influence the reader’s perception of the content. Similarly, disgust was marginally higher for HND (0.82% mean difference, d = 0.97, large effect), indicating that, while these differences may be subtle in percentage terms, their large effect size reveals a meaningful emotional impact. Regarding mood metrics, both positive and negative moods showed minor negative mean differences (d = −0.65 for both), reflecting consistent emotional shifts in response to OxFoodbank White.
However, the valence metric, representing the overall mood tone, was significantly higher for HND, with a 30.35% positive mean difference (d = 1.11, large effect). This result highlights the HND design’s capacity to evoke a more positive emotional state, a finding that aligns with prior research on the importance of visual design elements in modulating mood. The large effect sizes observed across multiple metrics emphasise the meaningful and consistent impact of design elements, suggesting that these differences are not only statistically significant but also have substantial real-world implications for emotional engagement.
Analysing emotional responses to the HND and OxFoodbank white background reveals distinct patterns in reader engagement and cognitive processing (Figure 7a). The HND article elicited a more stable neutral emotion, fluctuating between 24.4% and 40.6%, while OxFoodbank induced a significant decline in neutrality from 28.1% to 8.9%. This suggests that the HND article with a white background maintained a more consistent emotional state among participants. Notably, the OxFoodbank article triggered a substantial increase in puzzlement, rising from 27.1% to a peak of 91.9% before settling at 66.6%. This sharp elevation indicates that the OxFoodbank with white background content may have introduced more complex or challenging information, potentially leading to cognitive dissonance. Other emotional responses, including surprise, sadness, fear, disgust, and joy, remained relatively low (<20%) and stable for both articles, suggesting minimal impact on these affective states. Mood analysis (Figure 7b) further differentiates the two articles with white backgrounds. HND demonstrated a stable negative mood pattern, slightly decreasing from 30.3% to 23.2%. In contrast, the OxFoodbank article dramatically increased negative mood, escalating from 21.8% to approximately 80% before declining to 69.2%. This heightened negative effect on OxFoodbank may be attributed to the increased puzzlement it generated. Positive mood remained consistently low across both articles, while valence hovered near 0%, indicating that neither background significantly influenced positive affect during the experiment. The findings suggest that HND’s white background version maintains sustained focus and engagement, while OxFoodbank demonstrates strengths in initial clarity and attention capture. HND’s capacity to retain reader focus over an extended period implies a more immersive reading experience, aligning with its marginally higher engagement scores and lower cognitive demand. Conversely, OxFoodbank’s superior initial clarity attracts immediate attention but struggles to maintain this engagement over time. Furthermore, HND’s white background outperformed OxFoodbank in mitigating puzzlement and eliciting a more dynamic emotional response, enhancing the overall reader experience. These insights indicate that HND’s content structure and presentation may be more effective in sustaining reader engagement and maintaining a stable mood over prolonged periods, making it particularly suitable for content requiring sustained attention. Meanwhile, OxFoodbank’s clarity and initial attention capture strengths suggest its potential efficacy in contexts where immediate engagement is paramount. Studies indicate that the initial attention capture is notably more pronounced than subsequent encounters with the same distracting stimulus, emphasising the crucial role of first impressions in attracting attention (Adam et al., 2023).
The analysis of emotional responses to the HND and OxFoodbank articles with black backgrounds yielded several significant findings (Table 2). Participants demonstrated a more neutral stance towards the HND black background, with a positive mean difference of 10.08% compared with the OxFoodbank black background (d = 1.53, large effect). The large effect size suggests that the HND design had a substantial impact on reducing emotional variance, resulting in a more neutral emotional state. This finding may have practical implications for the presentation of content that aims to minimise emotional bias or distraction. Conversely, the HND black background elicited less puzzlement and surprise, as evidenced by negative mean differences of 9.18% (d = −0.81, large effect) and 4.13% (d = −2.74, large effect), respectively. While puzzlement shows a notable reduction, the extremely large effect size for surprise indicates a significant and consistent impact of the HND background in reducing unexpected emotional responses. This could be particularly relevant for contexts where clarity and predictability are essential, such as instructional or technical content. The t-test results for sadness (d = 0.17, small effect) and fear (d = −0.38, medium effect) were not statistically significant, suggesting minimal or no effect of the black versions of the articles on these emotional responses. The small and medium effect sizes for these metrics indicate that, though differences exist, they are relatively minor and may not warrant practical consideration. However, disgust (d = −0.87, large effect) and joy (d = −0.66, large effect) exhibited significant differences, with participants reporting stronger emotional responses when viewing the OxFoodbank black background. The large effect sizes for both metrics suggest that these emotional states are meaningfully impacted by the design, underscoring the potential of background colour to evoke divergent emotional responses. This aligns with previous research demonstrating that strong emotional states, such as disgust and joy, influence cognitive and attentional processing in distinct ways. The interplay between these emotional states may reflect participants’ evaluative and affective reactions to the contrasting designs. Eye-tracking studies have demonstrated that distinct emotional states elicit unique patterns of visual attention (Usée et al., 2020). This technology enables the differentiation of emotions by analysing various ocular features, including pupil diameter, saccades, and fixations. However, while fear and sadness are more readily identifiable, the differentiation of joy and disgust requires further investigation (Collins & Davies, 2023). As specific emotional states, disgust and joy modulate gaze behaviour in divergent ways. Research indicates that disgusted facial expressions tend to enhance the processing of averted gaze, whereas happy facial expressions facilitate the processing of direct gaze, suggesting the presence of an approach/avoidance mechanism in emotional gaze processing (van der Wel et al., 2022). Notably, the difference in fearful response was negligible, with a mean difference of only −0.35% and d = −0.38, a medium effect size. This indicates that, while the design differences were sufficient to elicit some variation in fear, the effect was moderate and less consistent across participants. Regarding mood, both positive (d = −0.66, large effect) and negative (d = −0.96, large effect) moods were higher for the OxFoodbank black background, indicating a notable duality in emotional impact. The large effect sizes for both metrics highlight the extent to which the OxFoodbank design amplifies both extremes of emotional valence, suggesting a design that may elicit more polarising responses. Interestingly, the valence value was higher for the HND black background (d = 0.90, large effect), indicating a more positive overall impact on participants’ moods. This aligns with the earlier finding of a more neutral emotional response, further suggesting that the HND design fosters a more balanced and favourable mood state. The large effect size for valence underscores the robustness of this finding and highlights the potential of the HND design to create a more engaging yet emotionally stable experience.
Analysing emotional responses to HND Black and OxFoodbank with a black background reveals distinct trends over 12 s (Figure 8a). HND exhibited a steady decline in neutral emotion from 48.5% to 20.3%, while OxFoodbank showed fluctuations, starting at 32.4%, dipping to 16.3%, and rising to 27.5%. Puzzlement increased significantly in both versions of articles, with OxFoodbank consistently higher (30–40%) compared with HND, which saw a rise only in the final four seconds (25.4% to 40%). Other emotions remained low (under 20%) and stable across both versions. Negative mood patterns aligned with puzzlement trends (Figure 8b). OxFoodbank demonstrated consistently high negative mood, increasing from 13.6% to 54.4%. In contrast, HND showed a notable increase only in the last four seconds, from 27.7% to 42.8%. Valence remained near 0% for both versions, indicating minimal impact on positive emotional response. The findings suggest that HND with a black background outperforms OxFoodbank in sustaining reader engagement, providing more explicit content, and maintaining appropriate cognitive demand. While OxFoodbank excels in initial attention-grabbing, it struggles to maintain engagement throughout the reading process. HND’s black background reduces puzzlement and facilitates more dynamic emotional shifts during the testing process. The cognitive mechanisms underlying the advantage in reducing perplexity and facilitating dynamic emotional shifts during the testing process in reading behaviour encompass several interconnected processes. These mechanisms include the modification of emotional processing biases, the testing effect on memory retrieval, cognitive control in attention, inferential flexibility, and cognitive distancing (Dercon et al., 2024; Hoppitt et al., 2010; Perlman & Mor, 2022; van den Broek et al., 2016). These processes contribute to a more adaptive and dynamic emotional response during reading and testing. These cognitive mechanisms enhance the reader’s ability to navigate complex textual information, potentially leading to improved comprehension and emotional regulation during the reading and testing processes. In conclusion, HND’s superior performance in maintaining attention and managing readers’ emotional experiences highlights its effectiveness in delivering immersive content. These results underscore the importance of design elements in shaping reader engagement and comprehension in digital media platforms. From the content comparison, the HND article focused on opening a new campus location and providing information about educational programs and student opportunities. In contrast, the Oxfoodbank article discussed charitable activities and community support initiatives. This difference in subject matter may have influenced reader engagement and emotional responses. High-quality content is crucial for engaging readers, providing entertainment and informative value. This dual aspect of content quality significantly impacts user engagement and retention (He et al., 2024).
For each emotion and mood metric presented (Table 3), the difference between the mean value for HND White and the mean value for HND Black was computed. This calculation facilitated the quantification of the average change in emotional responses among participants when transitioning from the white background to the black one. The analysis also incorporated Cohen’s d, which provides a standardised measure of the magnitude of these differences, offering insights into the practical significance of the results. Regarding the key findings of the HND article, participants exhibited reduced neutrality when viewing the white background compared with the black background, as evidenced by a negative mean difference of 5.87% (d = −1.05d = −1.05d = −1.05, large effect). The large effect size suggests that the white background significantly diminished neutrality, potentially fostering more engaged and emotionally varied responses. Similarly, participants demonstrated less puzzlement with a white background than a black one, with a significantly negative mean difference of 9.72% (d = −0.56, large effect). This indicates that the white background effectively reduced cognitive conflict, which may contribute to enhanced clarity or comprehension of the content. Conversely, the surprise mean value was higher for the white background (mean difference = 3.58%, d = 1.67, large effect). The very large effect size underscores the white background’s capacity to evoke a stronger sense of novelty or unexpectedness, suggesting its potential suitability for contexts requiring attention capture or emotional engagement. Fear also exhibited a significant difference, with users experiencing increased fearfulness on the black background (mean difference = −0.73%, d = −1.49, large effect). While the mean difference is relatively small, the large effect size indicates a consistent increase in fear across participants, potentially reflecting the black background’s capacity to amplify intense emotional states. Additionally, disgust was marginally higher with the white background (mean difference = 0.59%, d = 0.65, large effect). Although the difference may appear minor in magnitude, the large effect size suggests that this response is consistent and meaningful across participants. In contrast, there were no statistically significant differences in sadness (mean difference = 0.27%, p = 0.1864, d = 0.19, small effect) or joy (mean difference = −0.12%, p = 0.2951, d = −0.15, small effect) between the white and black backgrounds, indicating that background colour had minimal to no impact on these specific emotional responses. Regarding participants’ mood, positive mood showed no significant difference between the two backgrounds (mean difference = −0.12%, d = −0.15, small effect). However, negative mood was significantly reduced on the white background (mean difference = −9.19%, d = −0.57, large effect), indicating that the white background contributed to the minimisation of negative emotional states. Additionally, valence mood was more positive on the white background (mean difference = 9.07%, d = 0.55, large effect). This suggests that participants experienced a more favourable overall mood tone when engaging with content presented on a white background, further reinforcing the positive emotional impact of this design choice.
To elucidate the impact of background stimuli of the HND article over time, two line graphs (were generated to compare the emotional responses elicited with a white background and a black background (Figure 9a) over a 12 s period. It is evident that neutral and puzzlement represent the highest proportions among the emotions. The neutral value fluctuates in the white version (from approximately 25% to more than 40%), while it demonstrates a consistent decline in the black version (from nearly 50% initially to approximately 20% at the conclusion). This suggests that, while users’ neutral responses decrease in both versions, the black background induces a more pronounced shift away from neutrality over time. Puzzlement exhibits a marked contrast between the two backgrounds. The white version displays inconsistent fluctuations, while the black version shows significant increases in puzzlement (from 12.9% initially to 40% at the conclusion). This may indicate that, as participants spend more time interacting with HND article content in the black version, their level of puzzlement increases. Regarding surprise, the figure for the white background was higher than the black version in the first nine seconds; however, it subsequently declined to the same level as the black version. This may suggest that the white background initially acts as a stimulant for the content to surprise the reader, but that this effect is not sustained. Sadness, fear, disgust, and joy remain relatively low and stable in both versions (below 15%), suggesting that the background colour does not have a significant effect on these particular emotions during this test period.
To elucidate the impact of the background stimuli of the HND article over time, two line graphs were generated to compare the emotional responses elicited with a white and a black background (Figure 9a) over a 12 s period. It is evident that neutral and puzzlement represent the highest proportions among the emotions. The neutral value fluctuates in the white version (from approximately 25% to more than 40%), while it demonstrates a consistent decline in the black version (from nearly 50% initially to approximately 20% at the conclusion). This suggests that, while users’ neutral responses decrease in both versions, the black background induces a more pronounced shift away from neutrality over time. Puzzlement exhibits a marked contrast between the two backgrounds. The white version displays inconsistent fluctuations, while the black version shows significant increases in puzzlement (from 12.9% initially to 40% at the conclusion). This may indicate that, as participants spend more time interacting with the HND article content in the black version, their level of puzzlement increases. Regarding surprise, the figure for the white background was higher than the black version in the first nine seconds; however, it subsequently declined to the same level as the black version. This may suggest that the white background initially acts as a stimulant for the content to surprise the reader, but that this effect is not sustained. Sadness, fear, disgust, and joy remain relatively low and stable in both versions (below 15%), suggesting that the background colour does not have a significant effect on these particular emotions during this test period. The mood charts for the HND article with white and black backgrounds demonstrate notable differences in mood variation over the 12 s test period (Figure 9b). The white background exhibits dynamic fluctuations in negative mood (ranging from approximately 10% to more than 30%), whereas the black background shows a progressive amplification of negative emotions as the test progresses (from nearly 18% initially to 40% at the conclusion). Positive mood, conversely, remains close to 0% in both conditions, displaying no significant variation, which suggests that the background colour has minimal impact on positive mood responses. Regarding mood valence (representing the overall emotional tone), both backgrounds maintain predominantly negative valence throughout the period. This analysis indicates that, while both backgrounds evoke predominantly negative moods, the white background results in more dynamic mood shifts, whereas the black background elicits a more consistently negative experience.
Regarding the key findings of the OxFoodbank article (Table 4), participants exhibited significantly reduced neutrality when viewing the white background compared with the black background, as evidenced by a negative mean difference of 10.93% (d = −1.96, large effect). The substantial effect size indicates a considerable shift in participants’ emotional state towards more engaged and less neutral responses when exposed to the black background. However, participants demonstrated increased puzzlement with the white background, with a positive mean difference of 14.06% (d = 0.66, large effect). This suggests that the white background elicited greater confusion or cognitive dissonance, contrasting markedly with the HND findings where puzzlement was higher in the black version. Surprise levels were marginally higher for the white background, with a mean difference of 1.97% (d = 0.5, large effect), indicating that the white background introduced a modest element of novelty or unexpectedness. Conversely, sadness decreased slightly on the white background (mean difference = −2.81%, d = −1.08, large effect), suggesting that the black background evoked more sadness. Similarly, fear and disgust exhibited small but statistically significant decreases on the white background, with negative mean differences of 0.29% (d = −0.61, large effect) and 0.74% (d = −1.19, large effect), respectively. These findings indicate that the black background more consistently amplified these negative emotional states across participants. Joy was the sole emotion that demonstrated no significant difference between the two backgrounds, with a mean difference of 0.46% (d = 0.26, medium effect, p = 0.0711), suggesting that background colour had minimal impact on participants’ joyful responses. Regarding participants’ mood, positive mood showed no significant difference between the two backgrounds (mean difference = 0.46%, d = 0.26, medium effect), indicating that both backgrounds elicited similar levels of positive emotional engagement. However, negative mood was notably higher on the black background (mean difference = 12.17%, d = 0.59, large effect), suggesting that the black background significantly heightened negative emotional responses. Additionally, valence (overall mood tone) was more positive on the white background, with a mean difference of −11.67% (d = −0.56, large effect). This indicates that participants experienced more positive overall affect when exposed to the white background, reinforcing its potential to create a more favourable emotional environment.
To elucidate the impact of background stimuli of the OxFoodbank article over time, two charts were generated to compare the emotional responses elicited by white and black backgrounds over a 12 s period (Figure 10a). It is evident that neutral and puzzlement account for the highest proportions among the emotions, similar to the HND article. Neutral fluctuates in the white version before declining significantly, while in the black version, it demonstrates a consistent decline throughout the test. Puzzlement exhibits a clear contrast between the two backgrounds. In the white version, puzzlement increases sharply, reaching a peak of over 80% by the 7 s mark before decreasing. On the black background, puzzlement rises steadily but peaks at a lower level, approximately 40%, and remains relatively stable towards the end of the test. This suggests that participants experienced significantly more puzzlement in the white background version, albeit for a brief duration, while puzzlement in the black background developed more gradually and persisted. Regarding surprise, the white background consistently displays higher values during the initial part of the test, but it declines over time, converging with the black background by the conclusion. This may indicate that the white background initially elicits more surprising responses, but that this effect diminishes over time. Sadness in the black version was observed to be generally higher and peaked at the end of the test at 15.5%. Meanwhile, sadness, fear, disgust, and joy remain low and stable in both versions (below 10%), suggesting that the background colour has minimal impact on these specific emotions during the test period. Overall, the white background evokes stronger initial emotional responses, while the black background produces more consistent emotional engagement, particularly in terms of neutrality and puzzlement. The mood charts for the OxFoodbank article (Figure 10b) reveal notable differences in mood variation over the 12 s test period. Negative mood is significantly high on both backgrounds but follows distinct patterns. In the white background, negative mood starts at a moderate level and sharply rises, peaking at around 90%, before decreasing in the later seconds of the test. In contrast, the black background shows a more gradual and steady rise in negative mood, peaking at around 50%, suggesting that participants exhibit a more extreme negative mood in the white version while the black background progressively amplifies negative emotions but at a slower pace. Positive mood remains near 0% in both conditions, with the white version exhibiting a flat peak from the fourth second to the seventh second. For mood valence (representing the overall emotional tone), both backgrounds exhibit predominantly negative valence. However, the white background shows a more dynamic pattern, where valence declines sharply and fluctuates more dramatically.

5. Discussion

The attention analysis results provide compelling evidence supporting the central hypothesis that design elements, specifically content structure and background colour contrast, significantly influence reader engagement, cognitive processing, and emotional responses in e-magazine articles (H1). This study’s significance lies in its innovative approach to understanding reader interaction with digital content, particularly in educational settings. Analysis of attention metrics revealed that the HND article consistently outperformed the OxFoodbank article in maintaining reader engagement and sustaining attention over time. HND demonstrated higher total attention (white version: 49.43%, black version: 48.19%) and end attention (white version: 27.58%, black version: 28.43%) compared with OxFoodbank (Figure 2). Emotion and mood analysis further corroborated these findings. HND elicited a more neutral (white version mean difference: 0.1514, black version: 0.1008) and consistent emotional response while exhibiting lower levels of puzzlement (white version mean difference: −0.3296, black version: −0.0918) and a more stable mood profile (Table 3). The fusion of AI eye-tracking technology with conventional webcam eye-tracking devices represents a significant advancement in neuromarketing research. This novel approach, utilizing an extensive database of 180,000 eye-tracking recordings, provides unprecedented insights into reader behaviour and engagement. The combination of these technologies has the potential to revolutionize the measurement of user experience in e-magazines, potentially establishing new standards in educational promotions. Temporal analysis of emotional responses over the 12 s test period provided additional evidence supporting H1. HND consistently outperformed OxFoodbank in maintaining neutral emotions with both black and white backgrounds, while OxFoodbank induced higher levels of puzzlement across both background colours (Figure 9 and Figure 10). Moreover, negative moods were consistently more prevalent for OxFoodbank (Figure 7b and Figure 8b). Content structure analysis reinforced these findings, revealing that HND’s structured content and straightforward flow resulted in higher total attention and end attention. OxFoodbank’s denser content format induced more significant cognitive dissonance among readers, as evidenced by the cognitive demand heatmaps (Figure 4 and Figure 6). Regarding background colour impact, results partially supported H2, which posited that white backgrounds lead to higher levels of sustained attention. While the white background was more efficacious in sustaining attention throughout the reading process for the OxFoodbank article (Figure 2), the black background demonstrated superior performance in terms of clarity for both articles (HND: 76.54% vs. 61.67%; OxFoodbank: 73.68% vs. 64.82%). H3, which hypothesized that white backgrounds elicit more dynamic emotional responses over time, was supported by the data presented in Figure 9 and Figure 10. Both articles exhibited more pronounced fluctuations in emotional responses and mood valence with white backgrounds compared with black backgrounds. The varying impact of background colour on reader engagement depending on content type (H4) was evidenced by the contrasting results between the HND and OxFoodbank articles. For instance, the white background reduced puzzlement for the HND article (Table 3) but increased it for the OxFoodbank article (Table 4). H5, which posited that black backgrounds lead to higher cognitive demand, was not fully supported by the data. Cognitive demand patterns were similar for both white and black backgrounds in the HND article (Figure 4 and Figure 6), suggesting that cognitive demand distribution varies between articles rather than being consistently higher for black backgrounds. In conclusion, this study’s significance lies in its comprehensive approach to understanding the complex interplay between design elements and reader engagement in digital educational content. By leveraging advanced neuromarketing technologies, it provides actionable insights for optimizing e-magazine design in educational settings. The fusion of AI eye-tracking with conventional eye tracking remote methods sets a new standard for user experience measurement, offering potential for more effective and engaging digital educational materials. Future research should focus on expanding the scope to include prolonged exposure times, diverse content types, and broader demographic groups to further refine our understanding of these complex interactions.

6. Proposed Additional Neuromarketing Analyses for Enhanced Insights

To enhance the depth of insights from this study, several additional analyses and neuromarketing metrics warrant consideration:
  • Electroencephalography (EEG) Analysis:
    EEG measurements would enable a more direct assessment of cognitive load and attention. This methodology could elucidate the neural correlates of engagement and cognitive demand during reading tasks. Metrics such as frontal theta power and alpha band suppression could be analysed to quantify cognitive workload and attentional processes.
  • Galvanic Skin Response (GSR):
    Incorporating GSR measurements would allow for the assessment of physiological arousal levels. This metric could provide supplementary data on emotional engagement and stress responses during reading, complementing the existing eye-tracking and emotional response data.
  • Heart Rate Variability (HRV):
    Measuring HRV would enable the assessment of cognitive load and emotional states. Changes in HRV can indicate shifts in cognitive effort and emotional engagement, providing an additional layer of physiological data to corroborate eye-tracking findings.
  • Fixation-Related Potentials (FRPs):
    Combining EEG with eye-tracking would facilitate the analysis of FRPs. This technique could provide insights into the cognitive processes occurring during specific fixations, offering a more temporally precise understanding of information processing.
  • Text Linguistics Analysis:
    Conducting a detailed linguistic analysis of the articles would involve examining factors such as sentence complexity, vocabulary difficulty, and coherence. This could elucidate differences in cognitive demand and engagement between the articles.
  • Individual Differences Analysis:
    Investigating how individual differences in reading ability, prior knowledge, and cognitive style influence engagement and comprehension would be beneficial. This could involve administering standardised tests and correlating results with eye-tracking and neurophysiological data.
  • Multimodal Data Fusion:
    Employing advanced machine learning techniques to integrate data from multiple modalities (eye tracking, EEG, GSR, etc.) would be advantageous. This approach could provide a more comprehensive understanding of the cognitive and emotional processes of reading and comprehension.
  • Semantic Gaze Mapping:
    Utilising semantic gaze mapping techniques would enable the analysis of how readers’ gaze patterns relate to specific semantic content within the articles. This could provide insights into which types of information attract and maintain attention most effectively.
These additional analyses and metrics provide a more comprehensive understanding of the cognitive and emotional processes involved in reading and comprehension, potentially elucidating subtle effects that may not be apparent from eye-tracking data alone.

7. Recommendations for Future Research

Future research endeavours should consider expanding the scope of this study to encompass prolonged exposure times, thereby facilitating a more comprehensive examination of the temporal evolution of emotional responses. Prolonged exposure to textual material has been demonstrated to significantly influence reading comprehension and retention, with multiple variables contributing to these outcomes. Increased text exposure generally enhances reading speed and accuracy, particularly for sentence structures predominantly encountered in written language. This suggests that extended exposure leads to improved comprehension and retention due to increased familiarity and practice with textual structures (Stoops & Montag, 2023). Furthermore, subsequent investigations could address the limitation of participant homogeneity by incorporating demographic variables such as age, sex, and educational background into the analysis. In older adults, age has been associated with baseline health literacy, and its impact was observed to increase over time, suggesting that reading habits and literacy levels can evolve with age (Verney et al., 2019). Gender differences in reading habits have been documented, with females generally exhibiting higher reading frequency and engagement, while males tend to demonstrate a larger reading volume (Ao & Zhang, 2024). This approach would enable a more nuanced segmentation of participants, potentially revealing group-specific patterns or variations in emotional responses to reading patterns. Future studies should systematically vary article topics while controlling for length and structure. This would allow a more direct assessment of how subject matter influences reader engagement and emotional responses in e-magazine contexts. Additionally, incorporating reader interest surveys could help quantify the relationship between personal relevance and engagement metrics.
Such refinements in methodology could yield more robust and generalisable findings, contributing to a deeper understanding of the underlying mechanisms and factors influencing emotional dynamics in this context.

Author Contributions

Conceptualization, H.M.Š.; methodology, H.M.Š.; writing—original draft preparation, H.M.Š., F.H.Q. and S.K. software: H.M.Š.; formal analysis, H.M.Š.; supervision: H.M.Š.; resources, H.M.Š. and F.H.Q.; funding acquisition, H.M.Š., F.H.Q. and S.K.; reviewing, H.M.Š., F.H.Q. and S.K.; editing: H.M.Š., F.H.Q. and S.K.; visualization, H.M.Š. All authors have read and agreed to the published version of the manuscript.

Funding

It was supported by the Institute for Neuromarketing & Intellectual Property, Zagreb, Croatia (research activities included designing and conducting research utilising neuromarketing software and analysing the data) and the Oxford Business College (paying the article processing charges for this publication).

Institutional Review Board Statement

The study was conducted in accordance with the Declaration of Helsinki, and approved by the Institutional Review Board of Institute for Neuromarketing & Intellectual Property (protocol code IRBJINIP2024-1v, 3 September 2024), for studies involving humans.

Informed Consent Statement

The research complied with ethical standards by obtaining digital consent from all subjects through the Tobii Sticky platform. The segment utilising Predict, an AI Eye Tracking tool designed to anticipate human behaviour, was exempt from ethical review and approval. The AI algorithm incorporates previously recorded eye tracking and EEG data, which had received prior written authorisation from Stanford University and Neurons company. These recordings were subsequently integrated into the AI system to facilitate the prediction of human behaviour.

Data Availability Statement

The data supporting this study’s findings are available in Figshare at DOI 10.6084/m9.figshare.27880221. These data were published under CC BY 4.0. Deed Attribution 4.0. International license.

Acknowledgments

We thank Thang Nam Anh Nguyen, Data Analyst from the Institute for Neuromarketing & Intellectual Property for his invaluable contribution to Python coding and analytical support for this study. Additionally, we acknowledge the significant contributions of Andrea Pekić, Research Assistant at the Institute for Neuromarketing & Intellectual Property, for her help in relevant bibliography research, which was instrumental to this study.

Conflicts of Interest

The authors declare no conflicts of interest.

Abbreviations

OBCOxford Business College
PREDICT AI eye-tracking software for predicting human behaviour
HNDArticle
OxFoodBank Article
CDCognitive demand
AOIArea of interest

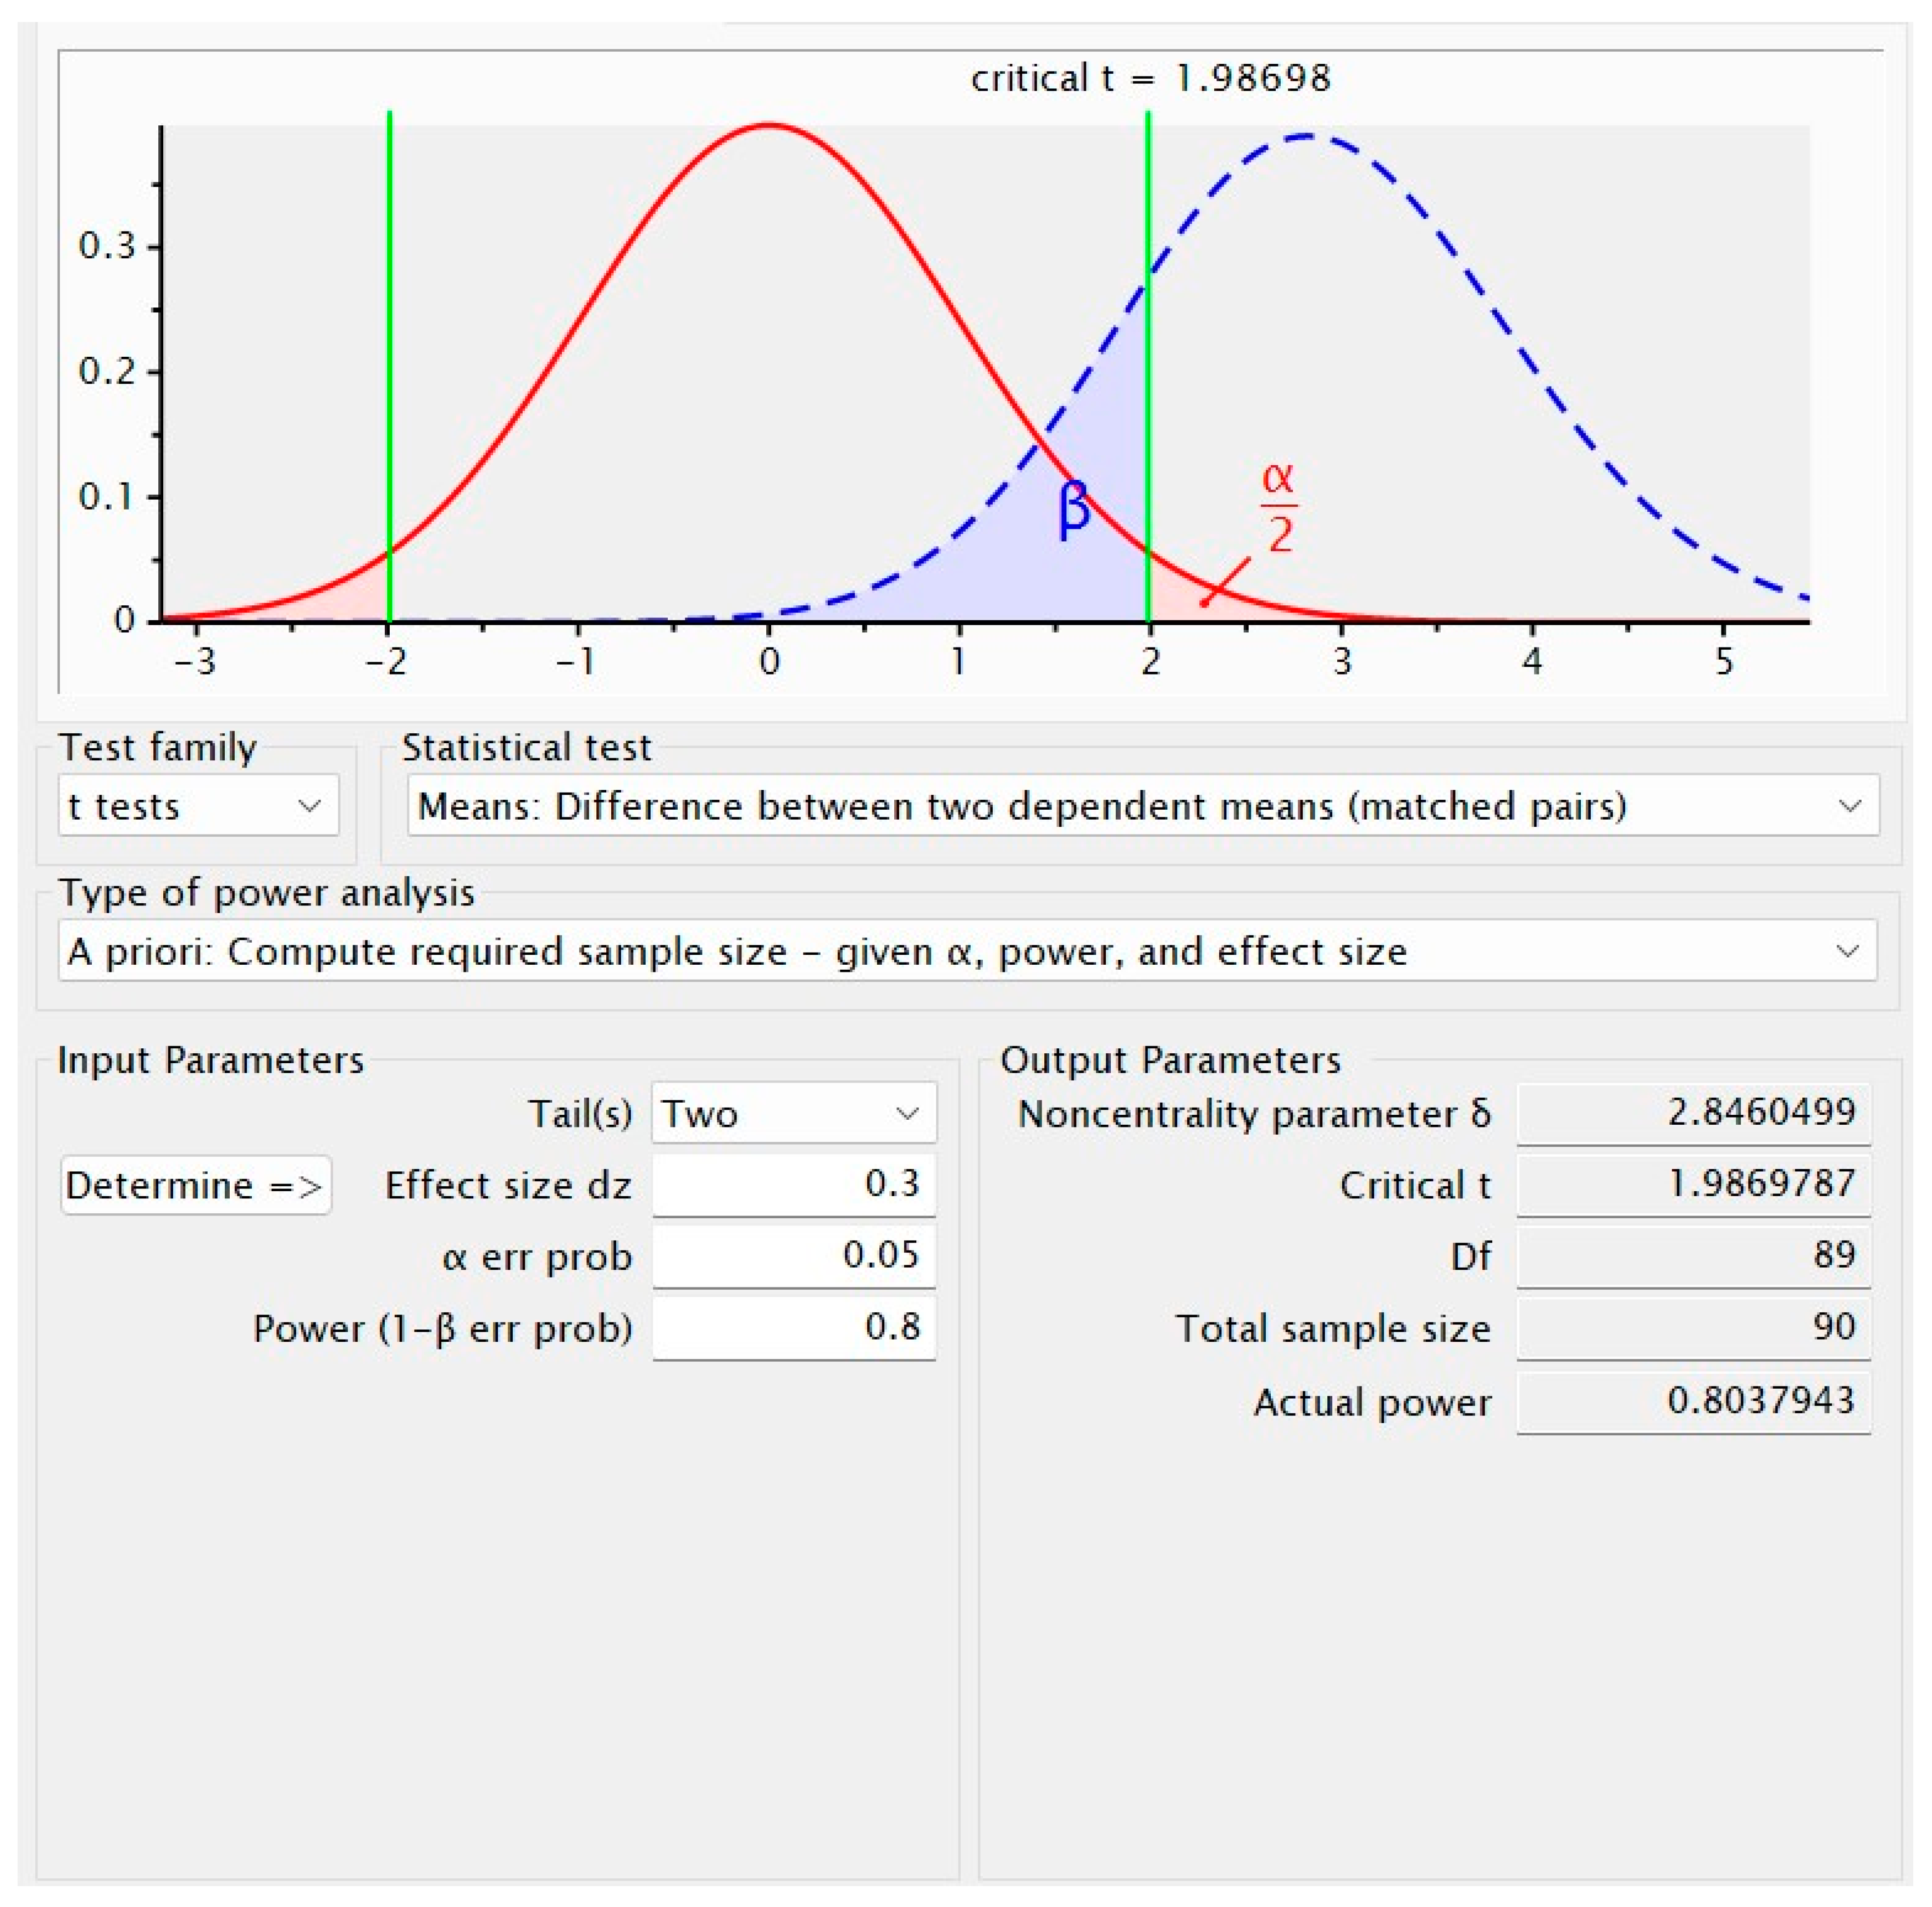
Appendix A. G*Power Software Results

Figure A1. According to the G*power analysis, to detect a small-to-medium effect with 80% statistical power and a two-sided % significance level of 5%, a sample size of n = 90 is required to identify the attention and emotion difference between the two background stimuli. The green lines at −2 and 2 are reference points near the critical t-values (~±1.987). These indicate the rejection regions in a two-tailed t-test with an alpha level of 0.05.
Education 15 00203 g0a1

Appendix B. Selected Articles for Research

Figure A2. (a) The original HND article with a heatmap overlay based on a study conducted with human participants. (b) The inverted background of the article with a heatmap overlay, similarly derived from research involving human participants. The colour range from green through yellow to red indicates the cumulative time of eye fixations to each region of an image. Warmer colours indicate more attention.
Education 15 00203 g0a2
Figure A3. (a) The original OxFoodbank article with a gaze point overlay based on a study conducted with human participants. (b) The inverted background of the article with a gaze point overlay, similarly derived from research involving human participants. Gaze Plot is a visualization showing all individual data points connected with lines per participant. The colour range from green to blue where warmer colours indicate more attention.
Education 15 00203 g0a3
Figure A4. (a) The inverted background article with selected AOIs and measuring percentage seen, based on a study conducted with AI eye tracking. (b) The inverted background of the OxFoodbank article with selected AOIs and measuring percentage seen, based on a study conducted with AI eye tracking.
Education 15 00203 g0a4

References

  1. Adam, K. C. S., Yang, Z., & Serences, J. (2023). First encounters: Estimating the initial magnitude of attentional capture. arXiv. [Google Scholar] [CrossRef]
  2. Ao, N., & Zhang, M. (2024). Unravelling the relationship between English reading habits and individual, family and school factors: A Chinese perspective. European Journal of Education, 59(3), e12668. [Google Scholar] [CrossRef]
  3. Arapakis, I., Lalmas, M., Cambazoglu, B. B., Marcos, M., & Jose, J. M. (2014). User engagement in online N ews: Under the scope of sentiment, interest, affect, and gaze. Journal of the Association for Information Science and Technology, 65(10), 1988–2005. [Google Scholar] [CrossRef]
  4. Arfé, B., Delatorre, P., & Mason, L. (2023). Effects of negative emotional valence on readers’ text processing and memory for text: An eye-tracking study. Reading and Writing, 36(7), 1743–1768. [Google Scholar] [CrossRef]
  5. Astudillo, C., Muñoz, K., & Maldonado, P. E. (2018). Emotional content modulates attentional visual orientation during free viewing of natural images. Frontiers in Human Neuroscience, 12, 459. [Google Scholar] [CrossRef]
  6. Awadh, F. H. R., Zoubrinetzky, R., Zaher, A., & Valdois, S. (2022). Visual attention span as a predictor of reading fluency and reading comprehension in Arabic. Frontiers in Psychology, 13, 868530. [Google Scholar] [CrossRef]
  7. Bagić Babac, M. (2023). Emotion analysis of user reactions to online news. Information Discovery and Delivery, 51(2), 179–193. [Google Scholar] [CrossRef]
  8. Bayat, A., & Pomplun, M. (2016, December 14–15). The influence of text difficulty level and topic on eye-movement behavior and pupil size during reading. 2016 2nd International Conference of Signal Processing and Intelligent Systems (ICSPIS) (pp. 1–5), Tehran, Iran. [Google Scholar] [CrossRef]
  9. Ben Nasr, L. (2014, April 23–26). Neuroscience techniques and priming processes significance to neuromarketing advertising. 1st Mediterranean Interdisciplinary Forum on Social Sciences and Humanities (pp. 255–267), Beirut, LebanonAvailable online: https://www.researchgate.net/profile/Kujtim-Bytyqi/publication/263661555_Principles_of_State-Building_The_case_of_Kosovo/links/0f31753b9889103c56000000/Principles-of-State-Building-The-case-of-Kosovo.pdf#page=266 (accessed on 15 October 2024).
  10. Chen, T., Samaranayake, P., Cen, X., Qi, M., & Lan, Y.-C. (2022). The impact of online reviews on consumers’ purchasing decisions: Evidence from an eye-tracking study. Frontiers in Psychology, 13, 865702. [Google Scholar] [CrossRef]
  11. Collins, M. L., & Davies, T. C. (2023, July 24–27). Emotion differentiation through features of eye-tracking and pupil diameter for monitoring well-being. 2023 45th Annual International Conference of the IEEE Engineering in Medicine & Biology Society (EMBC) (pp. 1–4), Sydney, Australia. [Google Scholar] [CrossRef]
  12. Daily, S. B., James, M. T., Cherry, D., Porter, J. J., Darnell, S. S., Isaac, J., & Roy, T. (2017). Affective computing: Historical foundations, current applications, and future trends. In Emotions and affect in human factors and human-computer interaction (pp. 213–231). Elsevier. [Google Scholar] [CrossRef]
  13. Dercon, Q., Mehrhof, S. Z., Sandhu, T. R., Hitchcock, C., Lawson, R. P., Pizzagalli, D. A., Dalgleish, T., & Nord, C. L. (2024). A core component of psychological therapy causes adaptive changes in computational learning mechanisms. Psychological Medicine, 54(2), 327–337. [Google Scholar] [CrossRef] [PubMed]
  14. Drieghe, D., Fitzsimmons, G., & Liversedge, S. P. (2017). Parafoveal preview effects in reading unspaced text. Journal of Experimental Psychology: Human Perception and Performance, 43(10), 1701–1716. [Google Scholar] [CrossRef]
  15. Duan, Y. (2017). The impact of colour on impulsivity, arousal and emotion [Ph.D. thesis, University of Leeds]. Available online: https://etheses.whiterose.ac.uk/17468/ (accessed on 1 October 2024).
  16. Faul, F., Erdfelder, E., Lang, A.-G., & Buchner, A. (2007). G*Power 3: A flexible statistical power analysis program for the social, behavioral, and biomedical sciences. Behavior Research Methods, 39(2), 175–191. [Google Scholar] [CrossRef] [PubMed]
  17. Faul, F., Erdfelder, E., Buchner, A., & Lang, A.-G. (2009). Statistical power analyses using G*Power 3.1: Tests for correlation and regression analyses. Behavior Research Methods, 41, 1149–1160. Available online: https://www.psychologie.hhu.de/fileadmin/redaktion/Fakultaeten/Mathematisch-Naturwissenschaftliche_Fakultaet/Psychologie/AAP/gpower/GPower31-BRM-Paper.pdf (accessed on 21 October 2024). [CrossRef]
  18. Glova, B., & Mudryk, I. (2020, August 21–25). Application of deep learning in neuromarketing studies of the effects of unconscious reactions on consumer behavior. 2020 IEEE Third International Conference on Data Stream Mining & Processing (DSMP) (pp. 337–340), Lviv, Ukraine. [Google Scholar] [CrossRef]
  19. Guo, H., Wang, W., Song, F., Liu, Y., Liu, H., & Bo, Z. (2022). The effect of color combinations on the efficiency of text recognition in digital devices. International Journal of Human–Computer Interaction, 40(5), 1317–1326. [Google Scholar] [CrossRef]
  20. Hall, R. H., & Hanna, P. (2004). The impact of web page text-background colour combinations on readability, retention, aesthetics and behavioural intention. Behaviour & Information Technology, 23(3), 183–195. [Google Scholar] [CrossRef]
  21. Hansen, C., Hansen, C., Simonsen, J. G., Larsen, B., Alstrup, S., & Lioma, C. (2020, July 25–30). Factuality checking in news headlines with eye tracking. 43rd International ACM SIGIR Conference on Research and Development in Information Retrieval (pp. 2013–2016), Pisa, Italy. [Google Scholar] [CrossRef]
  22. Hao, H., & Conway, A. R. A. (2022). The impact of auditory distraction on reading comprehension: An individual differences investigation. Memory & Cognition, 50(4), 852–863. [Google Scholar] [CrossRef]
  23. He, J., Gao, B., & Wang, Y. (2024). From attraction to retention: How vlogger attributes, vlog news content quality, and platform features affect continuance intention of vlog news. International Journal of Human–Computer Interaction, 2024, 1–22. [Google Scholar] [CrossRef]
  24. Hille, S., & Bakker, P. (2013). I like news. Searching for the ‘Holy Grail’ of social media: The use of Facebook by Dutch news media and their audiences. European Journal of Communication, 28(6), 663–680. [Google Scholar] [CrossRef]
  25. Hoppitt, L., Mathews, A., Yiend, J., & Mackintosh, B. (2010). Cognitive mechanisms underlying the emotional effects of bias modification. Applied Cognitive Psychology, 24(3), 312–325. [Google Scholar] [CrossRef]
  26. Hyönä, J., & Ekholm, M. (2016). Background speech effects on sentence processing during reading: An eye movement study. PLoS ONE, 11(3), e0152133. [Google Scholar] [CrossRef] [PubMed]
  27. Ikermane, M., & Mouatasim, A. E. (2023). Dyslexia deep clustering using webcam-based eye tracking. IAES International Journal of Artificial Intelligence (IJ-AI), 12(4), 1892. [Google Scholar] [CrossRef]
  28. King, J. L., Simper, C., Razzouk, J., & Merten, J. W. (2021). The impact of varying warning color on E-cigarette advertisements: Results from an online experiment among young adults. Nicotine & Tobacco Research, 23(9), 1536–1541. [Google Scholar] [CrossRef]
  29. Kruikemeier, S., Lecheler, S., & Boyer, M. M. (2018). Learning from news on different media platforms: An eye-tracking experiment. Political Communication, 35(1), 75–96. [Google Scholar] [CrossRef]
  30. Lee, C.-L., Pei, W., Lin, Y.-C., Granmo, A., & Liu, K.-H. (2023). Emotion detection based on pupil variation. Healthcare, 11(3), 322. [Google Scholar] [CrossRef] [PubMed]
  31. Lewandowska, A., & Olejnik-Krugly, A. (2021). Do background colors have an impact on preferences and catch the attention of users? Applied Sciences, 12(1), 225. [Google Scholar] [CrossRef]
  32. Liao, S., Yu, L., Kruger, J.-L., & Reichle, E. D. (2024). Dynamic reading in a digital age: New insights on cognition. Trends in Cognitive Sciences, 28(1), 43–55. [Google Scholar] [CrossRef] [PubMed]
  33. Liew, T. W., Tan, S.-M., Gan, C. L., & Pang, W. M. (2022). Colors and learner’s gender evoke different emotional and cognitive effects in multimedia learning. Human Behavior and Emerging Technologies, 2022, 1–15. [Google Scholar] [CrossRef]
  34. Lischka, J. A., & Messerli, M. (2016). Examining the benefits of audience integration. Digital Journalism, 4(5), 597–620. [Google Scholar] [CrossRef]
  35. Locher, F. M., & Philipp, M. (2023). Measuring reading behavior in large-scale assessments and surveys. Frontiers in Psychology, 13, 1044290. [Google Scholar] [CrossRef]
  36. Meng, Z., Lan, Z., Yan, G., Marsh, J. E., & Liversedge, S. P. (2020). Task demands modulate the effects of speech on text processing. Journal of Experimental Psychology: Learning, Memory, and Cognition, 46(10), 1892–1905. [Google Scholar] [CrossRef]
  37. Meyerhoff, H. S., & Papenmeier, F. (2020). Individual differences in visual attention: A short, reliable, open-source, and multilingual test of multiple object tracking in PsychoPy. Behavior Research Methods, 52(6), 2556–2566. [Google Scholar] [CrossRef]
  38. Mooney, S. W. J., Hill, N. J., Tuzun, M. S., Alam, N. M., Carmel, J. B., & Prusky, G. T. (2018). Curveball: A tool for rapid measurement of contrast sensitivity based on smooth eye movements. Journal of Vision, 18(12), 7. [Google Scholar] [CrossRef]
  39. Möller, J., van de Velde, R. N., Merten, L., & Puschmann, C. (2020). Explaining online news engagement based on browsing behavior: Creatures of habit? Social Science Computer Review, 38(5), 616–632. [Google Scholar] [CrossRef]
  40. Neurons. (2024a). Predict Datasheet.
  41. Neurons. (2024b). Predict Tech Paper.
  42. Pattemore, M., & Gilabert, R. (2023). Using eye-tracking to measure cognitive engagement with feedback in a digital literacy game. The Language Learning Journal, 51(4), 472–490. [Google Scholar] [CrossRef]
  43. Perlman, B., & Mor, N. (2022). Cognitive bias modification of inferential flexibility. Behaviour Research and Therapy, 155, 104128. [Google Scholar] [CrossRef] [PubMed]
  44. Pointon, M., Walton, G., Turner, M., Lackenby, M., Barker, J., & Wilkinson, A. (2023). Information discernment and online reading behaviour: An experiment. Online Information Review, 47(3), 522–549. [Google Scholar] [CrossRef]
  45. Ponz, A., Montant, M., Liegeois-Chauvel, C., Silva, C., Braun, M., Jacobs, A. M., & Ziegler, J. C. (2014). Emotion processing in words: A test of the neural re-use hypothesis using surface and intracranial EEG. Social Cognitive and Affective Neuroscience, 9(5), 619–627. [Google Scholar] [CrossRef]
  46. Powell, T. E., Van der Meer, T. G. L. A., & Peralta, C. B. (2019). Picture power? The contribution of visuals and text to partisan selective exposure. Media and Communication, 7(3), 12–31. [Google Scholar] [CrossRef]
  47. Ramsøy, T. Z. (2019). Building a foundation for neuromarketing and consumer neuroscience research: How researchers can apply academic rigor to the neuroscientific study of advertising effects. Journal of Advertising Research, 59(3), 281–294. [Google Scholar] [CrossRef]
  48. Ramsøy, T. Z., Plassmann, H., Yoon, C., & Devlin, J. T. (2023). Consumer neuroscience—Foundation, validation, and relevance. Available online: https://www.frontiersin.org/research-topics/10200/consumer-neuroscience---foundation-validation-and-relevance (accessed on 1 October 2024).
  49. Riapina, N., Permyakova, T., & Balezina, E. (2023). Approbation of pedagogical communication scales for educational online interaction in Russian universities. Voprosy Obrazovaniya/Educational Studies Moscow, 2023, 2. [Google Scholar] [CrossRef]
  50. Santhosh, J., Pai, A. P., & Ishimaru, S. (2024). Toward an interactive reading experience: Deep learning insights and visual narratives of engagement and emotion. IEEE Access, 12, 6001–6016. [Google Scholar] [CrossRef]
  51. Skaramagkas, V., Giannakakis, G., Ktistakis, E., Manousos, D., Karatzanis, I., Tachos, N., Tripoliti, E., Marias, K., Fotiadis, D. I., & Tsiknakis, M. (2023). Review of eye tracking metrics involved in emotional and cognitive processes. IEEE Reviews in Biomedical Engineering, 16, 260–277. [Google Scholar] [CrossRef]
  52. Smit, E. G., Boerman, S. C., & van Meurs, L. (2015). The power of direct context as revealed by eye tracking. Journal of Advertising Research, 55(2), 216–227. [Google Scholar] [CrossRef]
  53. Stoops, A., & Montag, J. L. (2023). Effects of individual differences in text exposure on sentence comprehension. Scientific Reports, 13(1), 16812. [Google Scholar] [CrossRef] [PubMed]
  54. Straub, E. R., Schmidts, C., Kunde, W., Zhang, J., Kiesel, A., & Dignath, D. (2022). Limitations of cognitive control on emotional distraction—Congruency in the color stroop task does not modulate the emotional stroop effect. Cognitive, Affective, & Behavioral Neuroscience, 22(1), 21–41. [Google Scholar] [CrossRef]
  55. Sungkur, R. K., Antoaroo, M. A., & Beeharry, A. (2016). Eye tracking system for enhanced learning experiences. Education and Information Technologies, 21(6), 1785–1806. [Google Scholar] [CrossRef]
  56. Šola, H. M., Qureshi, F. H., & Khawaja, S. (2024a). AI-powered eye tracking for bias detection in online course reviews: A udemy case study. Big Data and Cognitive Computing, 8(11), 144. [Google Scholar] [CrossRef]
  57. Šola, H. M., Qureshi, F. H., & Khawaja, S. (2024b). Exploring the untapped potential of neuromarketing in online learning: Implications and challenges for the higher education sector in europe. Behavioral Sciences, 14(2), 80. [Google Scholar] [CrossRef]
  58. Šola, H. M., Qureshi, F. H., & Khawaja, S. (2024c). Predicting behaviour patterns in online and PDF magazines with AI eye-tracking. Behavioral Sciences, 14(8), 677. [Google Scholar] [CrossRef]
  59. Thaqi, E., Mantawy, M. O., & Kasneci, E. (2024, June 4–7). SARA: Smart AI reading assistant for reading comprehension. 2024 Symposium on Eye Tracking Research and Applications (pp. 1–3), Glasgow, UK. [Google Scholar] [CrossRef]
  60. Usée, F., Jacobs, A. M., & Lüdtke, J. (2020). From abstract symbols to emotional (In-)sights: An eye tracking study on the effects of emotional vignettes and pictures. Frontiers in Psychology, 11, 905. [Google Scholar] [CrossRef]
  61. Vacas, J., Antolí, A., Sánchez-Raya, A., Pérez-Dueñas, C., & Cuadrado, F. (2024). Eye-tracking methodology to detect differences in attention to faces between developmental language disorder and autism. Journal of Speech, Language, and Hearing Research, 67(9), 3148–3162. [Google Scholar] [CrossRef] [PubMed]
  62. Vadiraja, P., Santhosh, J., Moulay, H., Dengel, A., & Ishimaru, S. (2021, September 21–26). Effects of counting seconds in the mind while reading. Adjunct Proceedings of the 2021 ACM International Joint Conference on Pervasive and Ubiquitous Computing and Proceedings of the 2021 ACM International Symposium on Wearable Computers (pp. 486–490), Virtual. [Google Scholar] [CrossRef]
  63. van den Broek, G., Takashima, A., Wiklund-Hörnqvist, C., Karlsson Wirebring, L., Segers, E., Verhoeven, L., & Nyberg, L. (2016). Neurocognitive mechanisms of the “testing effect”: A review. Trends in Neuroscience and Education, 5(2), 52–66. [Google Scholar] [CrossRef]
  64. van der Sluis, F., & van den Broek, E. L. (2023). Feedback beyond accuracy: Using eye-tracking to detect comprehensibility and interest during reading. Journal of the Association for Information Science and Technology, 74(1), 3–16. [Google Scholar] [CrossRef] [PubMed]
  65. van der Wel, R., Böckler, A., Breil, C., & Welsh, T. (2022). What’s in gaze, what’s in a face? Emotion expression modulates direct gaze processing. Journal of Vision, 22(14), 4278. [Google Scholar] [CrossRef]
  66. Verney, S. P., Gibbons, L. E., Dmitrieva, N. O., Kueider, A. M., Williams, M. W., Meyer, O. L., Manly, J. J., Sisco, S. M., & Marsiske, M. (2019). Health literacy, sociodemographic factors, and cognitive training in the active study of older adults. International Journal of Geriatric Psychiatry, 34(4), 563–570. [Google Scholar] [CrossRef]
  67. Wahl-Jorgensen, K. (2020). An emotional turn in journalism studies? Digital Journalism, 8(2), 175–194. [Google Scholar] [CrossRef]
  68. Wang, X., & Hickerson, A. (2016). The role of presumed influence and emotions on audience evaluation of the credibility of media content and behavioural tendencies. Journal of Creative Communications, 11(1), 1–16. [Google Scholar] [CrossRef]
  69. Whitehead, P. S., Ooi, M. M., Egner, T., & Woldorff, M. G. (2019). Neural dynamics of cognitive control over working memory capture of attention. Journal of Cognitive Neuroscience, 31(7), 1079–1090. [Google Scholar] [CrossRef]
  70. Wilcox, E. G., Ding, C., Jäger, L. A., & Sachan, M. (2023). Mouse tracking for reading (MoTR): A new naturalistic incremental processing measurement tool. Journal of Memory and Language, 138, 104534. [Google Scholar] [CrossRef]
  71. Winterhalter, L., Kofler, F., Ströbele, D., Othman, A., & von See, C. (2024). AI-assisted diagnostics in dentistry: An eye-tracking study on user behavior. Journal of Clinical and Experimental Dentistry, 16(5), e547–e555. [Google Scholar] [CrossRef] [PubMed]
  72. Woods, C., Luo, Z., Watling, D., & Durant, S. (2022). Twenty seconds of visual behaviour on social media gives insight into personality. Scientific Reports, 12(1), 1178. [Google Scholar] [CrossRef]
  73. Yan, G., Meng, Z., Liu, N., He, L., & Paterson, K. B. (2018). Effects of irrelevant background speech on eye movements during reading. Quarterly Journal of Experimental Psychology, 71(6), 1270–1275. [Google Scholar] [CrossRef]
  74. Yang, C.-K. (2020, June 2–5). Identifying reading patterns with eye-tracking visual analytics. ACM Symposium on Eye Tracking Research and Applications (2020, pp. 1–3), Stuttgart, Germany. [Google Scholar] [CrossRef]
  75. Zagermann, J., Pfeil, U., & Reiterer, H. (2018, April 21–26). Studying eye movements as a basis for measuring cognitive load. Extended Abstracts of the 2018 CHI Conference on Human Factors in Computing Systems (pp. 1–6), Montreal, QC, Canada. [Google Scholar] [CrossRef]
  76. Zhu, T., & Yang, Y. (2023). Research on mobile learning platform interface design based on college students’ visual attention characteristics. PLoS ONE, 18(7), e0283778. [Google Scholar] [CrossRef] [PubMed]
Figure 1. Attention radar chart for HND article (white version versus black version). Data visualization: Python.
Education 15 00203 g001
Figure 2. Attention radar chart for the OxFoodbank article (white version versus black version). Data visualization: Python.
Education 15 00203 g002
Figure 3. (a,b) Visualization of attention patterns in article analysis. (a) Start attention distributions for the HND article, displayed on a white background. (b) End attention distributions for the HND article are displayed on a white background. (c,d) Start and end attention distributions for the OxFoodbank article are displayed on a white background. (c) Start attention distributions for the OxFoodbank article, displayed on a white background. (b) End attention distributions for the OxFoodbank article are displayed on a white background. Attention patterns were generated using AI eye-tracking consumer behaviour predictive software. The colour range from green through yellow to red indicates the cumulative time of eye fixations to each region of an image. Warmer colours indicate more attention.
Education 15 00203 g003
Figure 4. (a) Cognitive demand analysis for the HND article with a white background. (b) Cognitive demand analysis for the OxFoodbank article with a white background. The Cognitive Demand score is a measure of visual complexity and, therefore, characterizes the amount of information in an image that a customer has to process. The Cognitive Demand heatmap helps customers understand what elements are contributing most significantly to the Cognitive Demand score, thereby providing some clear guidelines on how to reduce the Cognitive Demand (if necessary or desired). Colour indicator shows which areas are contributing more (red) and less (green) to the total Cognitive Demand score.
Education 15 00203 g004
Figure 5. (a,b) Visualization of attention patterns in article analysis. (a) Start attention distributions for the HND article, displayed on a black background. (b) End attention distributions for the HND article are displayed on a black background. (c,d) Start and end attention distributions for the OxFoodbank article are displayed on a black background. (c) Start attention distributions for the OxFoodbank article, displayed on a black background. (d) End attention distributions for the OxfoodBank article are displayed on a black background. Attention patterns were generated using AI eye-tracking consumer behaviour predictive software. The colour range from green through yellow to red indicates the cumulative time of eye fixations to each region of an image. Warmer colours indicate more attention.
Education 15 00203 g005
Figure 6. (a) Cognitive demand analysis for the HND article with a black background. (b) Cognitive demand analysis for the OxFoodbank article with a black background. Colour indicator shows which areas are contributing more (red) and less (green) to the total Cognitive Demand score.
Education 15 00203 g006
Figure 7. (a) Temporal comparison of emotional fluctuations during a 12-s test period between HND and OxFoodbank articles (white background). (b) Temporal comparison of mood fluctuations during a 12-s test period in the HND and OxFoodbank articles (white background). Data visualization: Python.
Education 15 00203 g007
Figure 8. (a) The comparison of emotional variation trends in a 12 s test period between HND and OxFoodbank articles with black backgrounds. (b) The mood variation trend comparison in a 12 s test period in HND and OxFoodbank with a black background. The data visualisation was generated using Python, and both panels were displayed against a black background to enhance contrast and readability.
Education 15 00203 g008
Figure 9. (a) The comparison of emotional variation trends in a 12 s test period between HND articles with white vs. black backgrounds. (b) The mood variation trend comparison in a 12 s test period in HND article with white vs. black background. The data visualisation was generated using Python.
Education 15 00203 g009
Figure 10. (a) The comparison of emotional variation trends in a 12 s test period between Oxfoodbank articles with white vs. black backgrounds. (b) The mood variation trend comparison in a 12 s test period in the Oxfoodbank article with a white vs. a black background.
Education 15 00203 g010aEducation 15 00203 g010b
Table 1. A comparative analysis of emotions and mood between HND and OxFoodbank articles with white background (mean difference and paired t-test).
Mean DifferenceT-Statisticp-ValueCohen’s dEffect Size Interpretation
Emotions
Neutral0.151418.890.0000 *2.65Large
Puzzlement−0.3296−8.330.0000 *−1.17Large
Surprise−0.0252−4.510.0000 *−0.63Large
Sadness0.035211.690.0000 *1.64Large
Fear−0.0079−8.610.0000 *−1.21Large
Disgust0.00826.940.0000 *0.97Large
Joy−0.0093−4.620.0000 *−0.65Large
Mood
Positive−0.0093−4.620.0000 *−0.65Large
Negative−0.3130−8.270.0000 *−1.16Large
Valence0.30357.900.0000 *1.11Large
* Represents the significance at the 1% level.
Table 2. A comparative analysis of emotions and mood between the HND and OxFoodbank articles with black background (mean difference and paired t-test).
Mean DifferenceT-Statisticp-ValueCohen’s dEffect Size Interpretation
Emotions
Neutral0.100810.930.0000 *1.53Large
Puzzlement−0.0918−5.790.0000 *−0.81Large
Surprise−0.0413−19.590.0000 *−2.74Large
Sadness0.00441.240.22200.17Small
Fear−0.0034−2.720.0089 *−0.38Medium
Disgust−0.0051−6.220.0000 *−0.87Large
Joy−0.0035−4.720.0000 *−0.66Large
Mood
Positive−0.0035−4.720.0000 *−0.66Large
Negative−0.0993−6.820.0000 *−0.96Large
Valence0.09616.430.0000 *0.90Large
* Represents the significance at the 1% level.
Table 3. A comparative analysis of emotions and mood between the HND article with a white vs. a black background (mean difference and paired t-test).
Mean DifferenceT-Statisticp-ValueCohen’s dEffect Size Interpretation
Emotions
Neutral−0.0587−7.530.0000 *−1.05Large
Puzzlement−0.0972−4.030.0002 *−0.56Large
Surprise0.035811.920.0000 *1.67Large
Sadness0.00271.340.18640.19Small
Fear−0.0073−10.660.0000 *−1.49Large
Disgust0.00594.640.0000 *0.65Large
Joy−0.0012−1.060.2951−0.15Small
Mood
Positive−0.0012−1.060.2951−0.15Small
Negative−0.0919−4.080.0002 *−0.57Large
Valence0.09073.900.0003 *0.55Large
* Represents the significance at the 1% level.
Table 4. A comparative analysis of emotions and mood between the OxFoodbank article with a white vs. black background (mean difference and paired t-test).
Mean DifferenceT-Statisticp-ValueCohen’s dEffect Size Interpretation
Emotions
Neutral−0.1093−13.970.0000 *−1.96Large
Puzzlement0.14064.730.0000 *0.66Large
Surprise0.01973.580.0008 *0.50Large
Sadness−0.0281−7.690.0000 *−1.08Large
Fear−0.0029−4.370.0001 *−0.61Large
Disgust−0.0074−8.510.0000 *−1.19Large
Joy0.00461.840.07110.26Medium
Mood
Positive0.00461.840.07110.26Medium
Negative0.12174.240.0001 *0.59Large
Valence−0.1167−4.000.0002 *−0.56Large
* Represents the significance at the 1% level.
Disclaimer/Publisher’s Note: The statements, opinions and data contained in all publications are solely those of the individual author(s) and contributor(s) and not of MDPI and/or the editor(s). MDPI and/or the editor(s) disclaim responsibility for any injury to people or property resulting from any ideas, methods, instructions or products referred to in the content.

