Article

Unveiling Students’ Voices: An Exploratory Study of Portuguese Students’ Feelings

Research Centre of Human Development, Faculty of Education and Psychology, Universidade Católica Portuguesa, 4169-005 Porto, Portugal
*
Author to whom correspondence should be addressed.
Educ. Sci. 2025, 15(10), 1403; https://doi.org/10.3390/educsci15101403 (registering DOI)
Submission received: 21 September 2025 / Revised: 11 October 2025 / Accepted: 17 October 2025 / Published: 19 October 2025
(This article belongs to the Section Education and Psychology)

Abstract

Understanding students’ feelings about daily school life can be a tool for schools to enhance their learning experience and sense of belonging. Despite the abundant research on achievement and engagement, few studies jointly examine the effect of students’ over-age status considering the grade attended, gender, and school level within a multi-domain framework of student feelings. Even rarer are studies that examine how these variables interrelate to identify predictors of students’ feelings about the learning experience, the aim of this study. Then, adopting a quantitative research approach, data were collected through a 1012-participant survey to map the students’ feelings about school life. The data were analyzed using t-tests, ANOVA, and linear regression statistics to identify causes and associations with the schooling experience. The findings indicate that students who did not disclose their gender or are over-age, considering the grade attended, exhibited less-positive feelings. Additionally, positive feelings decrease along the school path, and six predictors—assessment, school climate, teacher support, emotional discomfort, relationship with peers, and grade—explain the learning experience feelings, with relevance to their interaction effect. The findings highlight the need for coordinated school interventions that promote students’ positive feelings through inclusive, student-centred, and context-sensitive practices.

1. Introduction

Today’s young people face unprecedented uncertainty due to existential threats such as climate change, growing wealth disparities, geopolitical conflicts, pandemics, biodiversity loss, and habitat destruction (McDiarmid, 2023). In addition to these multiple stress factors, academic pressures within the framework of an educational system that is still performative—marked by intense competition to access university, focused on academic marks, teaching and learning standardization, and standardized national exams—have translated into stress, depression, and feelings of devaluation on the part of students (Arbuthnot, 2017; McDiarmid, 2023). According to PISA data (OECD, 2025), the average number of adolescents who were satisfied with their lives has fallen substantially, by ten percentage points, from nearly 36% in 2015 to 26% in 2022. Moreover, 18% of young people reported low life satisfaction in 2022, compared to nearly 12% in 2015. In addition, one in four 15-year-olds expressed dissatisfaction with school-related factors (learning at school, life at school, and relationships with teachers), and 26% of young people said they feel overwhelmed by schoolwork. Therefore, the growing perception of academic pressure may be contributing to a decline in young people’s overall satisfaction with life.
The authors of the self-determination theory, Ryan and Weinstein (2009), argue that cognitive competence does not necessarily lead to greater progress unless students simultaneously experience autonomy in learning and supportive relationships with teachers and peers. Therefore, the starting point for change requires a return to questions about the purpose of education and the concept of student well-being. Damásio (2020) explains that one cannot know without feeling and that in the practice of feeling there is also knowledge, because “feelings protect our lives, make us aware of dangers and opportunities and give us the incentive to act accordingly” (p. 141). This idea is vital for future education, which, beyond cognition, must cultivate empathy, care, healing, and respectful treatment (Alvarez, 2021). In this sense, education must extend beyond limited objectives, such as academic performance, to actively promote the well-being of students. This is because children and young people need to develop the social and emotional skills necessary to successfully face the challenges in later life and become productive citizens (Klapp et al., 2024). Thus, in the last decade, innovative self-determination theory-based interventions emerged, targeting students’ intrinsic motivation and basic psychological needs (Y. Wang et al., 2024), and well-being has become an instructional goal for school organizations and one of the primary outcomes of public education (Opre et al., 2018).
Emotions play a crucial role in shaping individuals’ behavior, influencing students’ academic success and learning (Hargreaves et al., 2018; Ovalle et al., 2024; Ibrahim & El Zataari, 2020; Klapp et al., 2024; Li & Xue, 2023), motivation (Koca, 2016; LoCasale-Crouch et al., 2018), and well-being (Zheng, 2022). Given this centrality, it is essential to examine the emotions experienced by students. Understanding these emotions can help schools adjust teaching practices, strengthen student-teacher relationships, promote students’ sense of belonging, and cultivate a more inclusive and emotionally supportive environment. In this context, this study uses the Exploratory Students’ School Experience Scale (ESSES), developed by Serra et al. (2025), to capture the essence of Portuguese students’ emotional experiences. This study is grounded in two theoretical lenses: the two perspectives of well-being, hedonic and eudaimonic (Clarke, 2023), and the self-determination theory (Ryan & Weinstein, 2009).
Building on Moeller et al. (2020), who defined feelings as the affective states reported by students, this study employs an exploratory approach to investigate the following research questions: What feelings do students experience in the school environment? How do students’ age, gender, and grade level influence their experience of these feelings? To what extent are students’ feelings about the learning experience associated with their perceptions of assessment, teacher support, peer relationships, and emotional discomfort? Hence, this study aims to jointly examine the effects of gender, age, and grade level within a multidimensional framework that considers learning, assessment, relationships with teachers and peers, and emotional discomfort. In the literature, there is a lack of studies focused on how these domains interact to shape students’ overall emotional experience of schooling. Hence, this study serves as the starting point for exploring associations related to these factors, aiming to close a literature gap, as most studies treat those domains and demographics in isolation. This integrative approach may pinpoint which combinations are most important and offer a more holistic understanding of students’ feelings, guiding targeted school actions and further investigations.

2. Theoretical Framework

2.1. Well-Being and Self-Determination Theory

Students’ well-being is considered an emotional state influenced by various factors, both within and outside the classroom, and it can have a positive impact on their learning and academic outcomes (Zheng, 2022). School well-being is also multidimensional, comprising three key aspects: psychological, referring to students’ emotions; cognitive, related to individuals’ intellectual capacity; and social, regarding supportive social relationships (Klapp et al., 2024). In fact, according to self-determination theory, people are enthusiastic and emotionally well-adjusted when they can satisfy three basic needs: relatedness, autonomy, and competence (Ryan & Weinstein, 2009; Y. Wang et al., 2024). Thus, students’ well-being will depend on the development of close social relationships, a sense of independence and control over one’s behavior, as well as the need to feel effective in performing individual obligations, being competent, and demonstrating knowledge (Deci & Ryan, 2000; Ryan & Weinstein, 2009). Therefore, to increase students’ well-being, educational environments should meet these three requirements (Zheng, 2022), as motivation and basic psychological needs are core elements of the self-determination theory that can improve it (Y. Wang et al., 2024).
According to Clarke (2023), well-being also results from the overlap of two different but complementary experiences: hedonia (feeling) and eudaimonia (doing well). Thus, hedonia refers to experiences of low negative or high positive emotions, as well as satisfaction with life. In turn, eudaimonia implies exercising one’s talents and becoming self-fulfilled, which, according to self-determination theory, presupposes that the individual perceives their innate needs (to feel competent, autonomous, and related to others) have been met. Therefore, eudaimonia does not only result from achieving good academic results, but requires opportunities in one’s environment to discover, cultivate, and express one’s talents in line with one’s life goals (Zheng, 2022). In short, to increase students’ well-being, educational environments must be nurtured to meet their needs for relationships, competence, and interdependence. This can be achieved through investment in social relationships with teachers and peers, as well as in more active pedagogical practices and a less performative educational system.

2.2. Well-Being and Classroom Climate

The classroom environment, a multifaceted and complex construct, comprises three basic components related to the interactions between teachers and students: socio-emotional support, instructional support, and classroom organization and management (M. Wang et al., 2020). These dimensions are featured in theoretical models and empirical findings, and their impact on student well-being is discussed subsequently.

2.2.1. Socio-Emotional Support

Socio-emotional support refers to classroom characteristics that support emotional well-being, including affection, safety, connectedness, and the quality of interactions with teachers and peers (M. Wang et al., 2020).
Teacher-student relationships are recognized to have a significant impact on an individual’s development throughout their education (Sointu et al., 2017). For a positive teacher-student relationship to develop, there must be mutual understanding and appreciation for each other’s efforts, commitment, respect, and care, along with a balanced power relationship (Ibrahim & El Zataari, 2020). According to several studies, a relationship based on respect, empathy, affection, openness, and cooperation can promote the development of the student’s identity, sense of belonging, and, consequently, their performance at school (Koca, 2016; LoCasale-Crouch et al., 2018; Looker et al., 2023; Martín de Hijas-Larrea et al., 2025; Sun, 2021). Additionally, teacher-student positive relationships can prevent student alienation, making them more likely to engage in school activities (Looker et al., 2023). This, in turn, encourages students to open up, listen to their teacher, and take intellectual risks, thereby motivating them to learn (Koca, 2016). However, as students advance, heavier demands can strain teacher–student relationships. Despite teachers’ importance during identity formation, this erosion of a sense of belonging can harm behavioral, psychological, and academic outcomes (Ibrahim & El Zataari, 2020).
Although the relationship with teachers is a primary element of the academic environment that has a significant impact on students’ development (Jiang & Zhang, 2021), the relationship with peers is also essential. Relationships with peers, individuals who share similar demographic and social characteristics, when marked by empathy, encouragement, and support, can have positive effects on students’ psychosocial development, engagement in learning, and academic performance (Chiu et al., 2021; Shao & Kang, 2022), stimulating active thinking and influencing creativity (Zhang et al., 2023). Good relationships with peers can prevent conflicts, reduce bullying, and promote engagement with learning (Terlektsi et al., 2020), and positively influence the ability to cope with stress (Corominas et al., 2022; Hoferichter et al., 2022), protecting students from the risk of suicidal ideation (Nakano et al., 2022). Bearing in mind that relationships with peers play an important role both in students’ well-being and academic performance, it is pertinent to implement collaborative activities, shared learning scenarios, and peer feedback in daily classroom routines to trigger consistent and fruitful interactions (Hoferichter et al., 2022).

2.2.2. Support for Learning

Learning support emphasizes pedagogical practices that challenge traditional approaches, expand learning opportunities, foster connections between prior and current knowledge, offer quality feedback, enhance critical thinking, and communicate high academic expectations to students (M. Wang et al., 2020). In this sense, it is essential, necessary, and urgent to substantially reduce the predominant teacher-centered methodology and verbal presentation, which lead to indiscipline, young people’s disenchantment with school, and boredom (Breidenstein, 2007; Perrenoud, 1996). Active methodologies offer benefits, including enjoyment and involvement, while also combating formalism and lack of realism in school tasks, thereby satisfying a need for reflection and inner dialogue about problems (Abdullah et al., 2022; Ribeiro-Silva et al., 2022).
However, the neoliberal educational paradigm prioritizes mastery of existing knowledge, which is essential for performing well in assessments, over the skills and dispositions required to create new knowledge and solutions. Standardized tests have been linked to reduced creativity and increased stress and anxiety among young people (McDiarmid, 2023), while also undermining well-being and social support through heightened competition (Cefai et al., 2021). Such practices run counter to the principles of eudaimonic well-being (Ryan & Weinstein, 2009). Therefore, broadening the concept of well-being involves changing the performative school and promoting human flourishing rather than molding children to adapt to the job market (Clarke, 2023). On the other hand, promoting a supportive environment in the classroom involves using effective feedback that helps students understand what mistakes they made, why they made them, and what they can do to avoid them (Wisniewski et al., 2020). Feedback with these characteristics will increase the student’s sense of autonomy and self-efficacy, promoting identification with the school, greater involvement in the tasks (Monteiro et al., 2021), and, consequently, reinforcing well-being.

2.2.3. Classroom Organization and Management

Classroom organization and management involve practices that teachers use to establish daily routines, including the precise application of rules, providing positive behavioral support, fairly managing disruptive behavior, and implementing preventive strategies to reduce punitive events. A classroom with effective organization presents a stimulating and well-functioning environment that supports students’ needs for competence and autonomy, helping them remain engaged in learning (M. Wang et al., 2020) and, therefore, be more creative (Richardson & Mishra, 2018).
However, in an environment marked by teacher criticism and reprimands, students will experience negative emotions and learning behaviors, such as tiredness, absenteeism, and emotional anxiety, and therefore, their participation in learning will be reduced (Li & Xue, 2023). Çetin et al. (2021) concluded, among other factors, that noise (chaos) in the classroom, uncertainty, and lack of planning provoke negative emotions. Classroom environments driven by performance and standardized assessments rather than learning end up feeding negativity and fragmentation, as they trigger competition rather than solidarity, with students left behind, becoming alienated, demotivated, and losing sight of their goal (Ibrahim & El Zataari, 2020). Students’ negative attitude towards learning becomes increasingly evident as they progress through the school system, as the classroom environment becomes increasingly impersonal, formal, evaluative, competitive, and with an increasing emphasis on social comparison (Harter, 2009).
In short, a better classroom environment requires a combination of effective instruction, positive interactions, and organized behavior management to ensure satisfaction of the psychological needs for competence, autonomy, and relatedness, which contribute to students’ well-being (Deci & Ryan, 2000). Higher perceptions of well-being may produce an enriching and valuable learning experience. The need for competence is met when students feel that the classroom environment is appropriately structured and they are aware of what they need to succeed (M. Wang et al., 2020).

2.3. Current Study and Hypothesis

Drawing on the literature, this study aims to model the schooling experience. This second-order construct encompasses six first-order dimensions: learning, assessment, teacher support, school climate, peer relationships, and emotional status (Figure 1). Learning experience is a central piece of the schooling experience, and it focuses on capturing how positive, supportive, fair, and emotionally manageable day-to-day life in school feels. Then, the students’ feelings regarding their learning experience are the students’ affective appraisal of classroom learning—signifying how enjoyable, meaningful, safe, and manageable it feels—and are being shaped by several drivers: classroom practices and classroom management, which influence the student-teacher relationship, interactions with peers, educational environment, and students’ emotional status. In this study, these four drivers are used as independent variables.
This study consisted of an exploratory quantitative investigation developed to map students’ feelings regarding their specific contexts. It provides a foundation for identifying actionable signs—such as age, gender, and grade level—that may aid in identifying effects and interventions, as well as serve as a stepping-stone toward correlational studies. Then, the following hypotheses were equated:
H1. 
Over-age students report less favourable feelings about their schooling experience than students who are age-aligned with their school grade.
H2. 
The feelings towards the schooling experience differ between students attending different cycles (2nd cycle, 3rd cycle, and secondary level).
H3. 
The students’ feelings towards the schooling experience vary by gender.
H4. 
The students’ feelings toward the learning experience are correlated with their feelings regarding assessment, teacher support, peer relationships, and emotional discomfort.

3. Materials and Methods

3.1. Data Collection, Instrument, and Participants

The survey employed the ESSES scale (Serra et al., 2025) to assess students’ feelings about school. It included a six-factor questionnaire and used a five-point scale, ranging from the highest level of disagreement to the highest level of agreement. Five factors demonstrated good internal reliability, with Cronbach’s alphas ranging between 0.817 and 0.889. The learning experience is a four-item factor, in which students reported feelings such as “I like to participate in tasks proposed by teachers” and “I feel motivated to learn new things in each subject.” The second factor concerns feelings about the assessment experience, which includes five items, such as “I feel that assessment usually helps me to learn better.” The third is a four-item factor named feelings about teacher support, which considers items such as “I feel that teachers worry about me”. School climate comprises six items and assesses aspects such as “I like to be at school” and “School is a place where I feel respected.” The feelings about the relationship with peers is a four-item factor, including items such as “I feel that my colleagues accept me”. The last factor, feelings about emotional discomfort, includes three items and has a Cronbach’s alpha of 0.627. This value is below the conventional threshold, which is conditioned by the low number of items for the factor. Still, the confirmatory factor analysis demonstrated an acceptable model fit and the theoretical relevance of the factor (Serra et al., 2025), suggesting that it can be considered in this study [χ2(278) = 596.278, p < 0.001; CFI = 0.925; TLI = 0.913; RMSEA = 0.062; SRMR = 0.092]. The questionnaire also included the question “I am well during classes” to assess how the students felt globally.
Additionally, the questionnaire included questions to describe the sample, namely, age, gender, grade, and school attended by students. The questionnaire was applied online and anonymously in May 2025 at six Portuguese school clusters: four located in the northern part of the country and two in the central region (Table 1). The survey was approved by the school’s principals and targeted students who attended middle and high school. The 1012 students who responded to the questionnaire were aged between 9 and 20 years old, with a mean age of 14.18. Most of the students were age-appropriate for their grade (90.9%), but 92 students exceeded that age by 1 to 4 years. The Portuguese system is organized in a kindergarten, primary school, 2nd and 3rd cycles, and secondary level (SL). 20.5% of the participants in this study attended the 2nd cycle (5th and 6th grades), 45.4% the 3rd cycle (7th to 9th grades), and 33.8% the SL (10th to 12th grades). A similar number of female and male students responded to the questionnaire.

3.2. Data Analysis

Mapping students’ feelings included a statistical descriptive analysis of the students’ responses for each questionnaire item and factor. Before the hypothesis testing, the internal consistency of each factor was determined using Cronbach’s alpha.
Focusing on understanding the factors that influence students’ feelings about school, differences across gender, age, and schooling level were analyzed through an inferential statistical approach. Parametric tests—t-test and ANOVA—were used in this study to examine group differences, given the large sample size and their greater power, even in cases of normality violation (Blanca et al., 2017). This option is advised because, in large samples of over 1000 participants, the Central Limit Theorem ensures that parametric methods remain robust even when data are not perfectly normal (Lumley et al., 2002).
Hypothesis testing considered all six factors of the scale. Testing the H1 hypothesis involves comparing students who are age-aligned with those attending a grade above their age. Given the unequal group sizes, Welch’s independent samples t-test was used to compare the means of the two groups. To test hypotheses H2 and H3, an ANOVA was used to compare means across variables with more than two groups, namely, gender (male, female, and unspecified) and schooling level (2nd cycle, 3rd cycle, and SL). Partial eta-squared was used to determine the effect size of different variables in the ANOVA. A post hoc Honest Significant Difference (HSD) Tukey test was used to identify groups that statistically differ when variances are homogeneous, and a Games-Howell test was used otherwise. For planned non-pairwise contrasts, we used Scheffé’s procedure. When statistically significant differences existed among groups, violin plots were used to analyze the data distribution.
For testing hypothesis H4, a backward multiple linear regression model was run. In the backward regression, the model is run with all the variables, and one by one, those that do not significantly contribute to the regression model are eliminated (Pestana & Gageiro, 2014). The linear regression considered two dependent variables: the first refers to the item included in the questionnaire, “I am well during classes”, an indicator of well-being in classes; the second refers to the latent variable “Feelings about the learning experience”. The effect of the following independent variables was forecasted: age, grade, age-for-grade status, gender, and feelings about teacher support, assessment, relationship with peers, school climate, and emotional discomfort. The cut-off levels of significance applied were 0.05 and 0.10 for entry and variable removal, respectively. For both models tested, the following criteria were checked: variation inflation factor (VIF) to assess collinearity among the independent variables; F-test ANOVA to determine the regression model’s fit, with a 95% confidence interval; and t-test to analyze the statistical significance of the independent variables in predicting the dependent ones.

4. Results and Discussion

4.1. Mapping Students’ Feelings

The 26-item questionnaire, organized into six factors, revealed five constructs with good reliability, with Cronbach’s alpha ranging from 0.823 to 0.897 (Table 2). Their inter-item correlations are above 0.30 and below 0.80, indicating that the items are appropriately related and contribute to a consistent measurement of the underlying constructs. The construct “feelings about emotional discomfort” evidenced a questionable Cronbach’s alpha of 0.632 and a relatively low inter-item correlation, which the small number of items can justify (Watkins, 2018). Then, with caution, given the theoretical importance of the construct, it will be considered in the subsequent analysis.
The students’ perception of assessment and teacher support is moderately positive, though not as positive as their feelings about the learning experience, as shown by most items scoring at the median point of the five-point scale used (Table 2). Students identify less favourable aspects, including concentration in classes (M = 3.22), the relevance of learning issues (M = 3.30), motivation (M = 3.34), assessment for learning (M = 3.32), perceived validity of the assessment process (M = 3.36), and teachers’ care for students (M = 3.38). The favourable contours of teaching, learning, and assessment, as perceived by students, refer to participation in classroom tasks (M = 3.60), comprehension of the assessment criteria (M = 3.83), direct appeal to teachers’ support (M = 3.80), and respect in the relationship (M = 3.60). Regarding assessment, the data indicate that students perceive the acknowledgment of assessment criteria as more robust than feedback, which is closer to neutrality. This suggests that assessment strategies need to be nurtured, even though Schildkamp et al. (2020) refer to the fact that over 30% of the feedback was not recognized by students, which can explain the neutral students’ perception. In the schools that participated in the survey, the mean scores exceeded neutrality yet fell short of strong agreement, indicating generally positive—but not robust—perceptions of teaching and learning. In this line of reasoning, assessment must be reinforced to grasp the feelings regarding the learning experience. This is supported by Brandmo and Gamlem (2025), who found evidence that teacher feedback can influence students’ motivation and learning.
Concerning school climate, students’ feelings are above neutral (3.0), but below a strong endorsement (4.0 or higher). Perceptions regarding a calm and pleasant school climate (M = 3.06) and liking being in school (M = 3.18) are neutral, indicating a need for targeted actions to strengthen the sense of belonging and the day-to-day school climate. Aspects such as safety (M = 3.46), respect (M = 3.25), fair treatment by adults (M = 3.44), and school common areas climate (M = 3.62) have better scores, but still require improvement. The literature highlights the importance of students feeling listened to and being in a safe and trusting environment to achieve better perceptions of well-being (Guedes et al., 2023; Martín de Hijas-Larrea et al., 2025; Williams et al., 2018).
Students’ feelings about their relationships with peers yield more robust results, with a mean value of 3.98, indicating a better school experience in this regard. The lowest-scoring feeling concerns the peaceful resolution of conflicts with colleagues (M = 3.48), indicating that relational skills need to be strengthened through mediation and restorative practices. These results suggest that friendship in the Portuguese schools studied may contribute to strengthening the sense of belonging. However, the population fringe represented by students with problematic friendships, who report lower feelings, should be a target of school-based interventions (Fan & Bellmore, 2023), in defence of building a more inclusive school.
Regarding students’ emotional discomfort, students reported near-neutral levels of in-class anxiety (M = 2.94) and below-neutral levels of perceived exclusion (M = 2.43). This suggests generally low emotional discomfort, although a meaningful minority still experiences notable difficulties. Test anxiety (M = 3.63) stands out as a broad concern, warranting targeted assessment and classroom climate supports, representing a result aligned with the literature (Kandemir, 2013; Tan et al., 2025).
Globally, the mapping of feelings revealed that the students’ hedonic or happiness set point, a term introduced by Lykken and Tellegen (1996), tends to be neutral, with a level of satisfaction regarding the school experience that does not translate to complete well-being. The practical implications of these findings suggest that in the schools studied, moving toward a high-quality education requires designing a school-wide intervention focused on improving the school climate to increase belongingness and prevent negative behaviors that decrease well-being. Another practical consideration is that positive relationships can have a positive impact on students’ psychosocial development, engagement in learning, and academic performance (Chiu et al., 2021; Shao & Kang, 2022), as they can stimulate active thinking and thereby promote creativity (Zhang et al., 2023). Additionally, the findings highlight the need to promote positive, low-stakes assessment practices that reduce test anxiety and foster a supportive classroom climate conducive to learning.

4.2. H1 to H3 Hypotheses Testing

Hypothesis testing for studying the factors that influence students’ feelings about school through t-test and ANOVA requires that the data follow a normal distribution. The Kolmogorov–Smirnov test with the Lilliefors correction, with a p < 0.001, attests that the assumption of normality was violated for the constructs: feelings about the learning experience, D(1012) = 0.086; feelings about the assessment experience, D(1012) = 0.072; feelings about the teacher support, D(1012) = 0.093; feelings about the school climate, D(1012) = 0.063; feelings about relationship with peers, D(1012) = 0.107; feelings about emotional, D(1012) = 0.090; feelings about how well students feel during classes, D(1012) = 0.242. However, given the large sample size (N = 1012) and the robustness of the t-test and ANOVA to deviations from normality, the analyses were considered appropriate (Blanca et al., 2017). Then, the effects of age alignment with the grade attended, gender, and level of schooling attended were examined.

4.2.1. Effect of Age by Reference to the Grade Attended

Considering the variable feelings about relationships with peers, Levene’s test was statistically significant (p ≤ 0.05), indicating unequal variances between the two groups: students attending a grade with and without the aligned age (Table 3). The t-test for unpaired samples revealed statistically significant differences between groups, t(1010) = 4.186, with p < 0.001, mean difference = 0.4669, and 95% CI [0.2457, 0.6880]. Students older than the expected age for their grade (M = 3.47) and those on time (M = 3.94) both reported positive feelings regarding their relationships with peers; however, the latter group evidenced better perceptions.
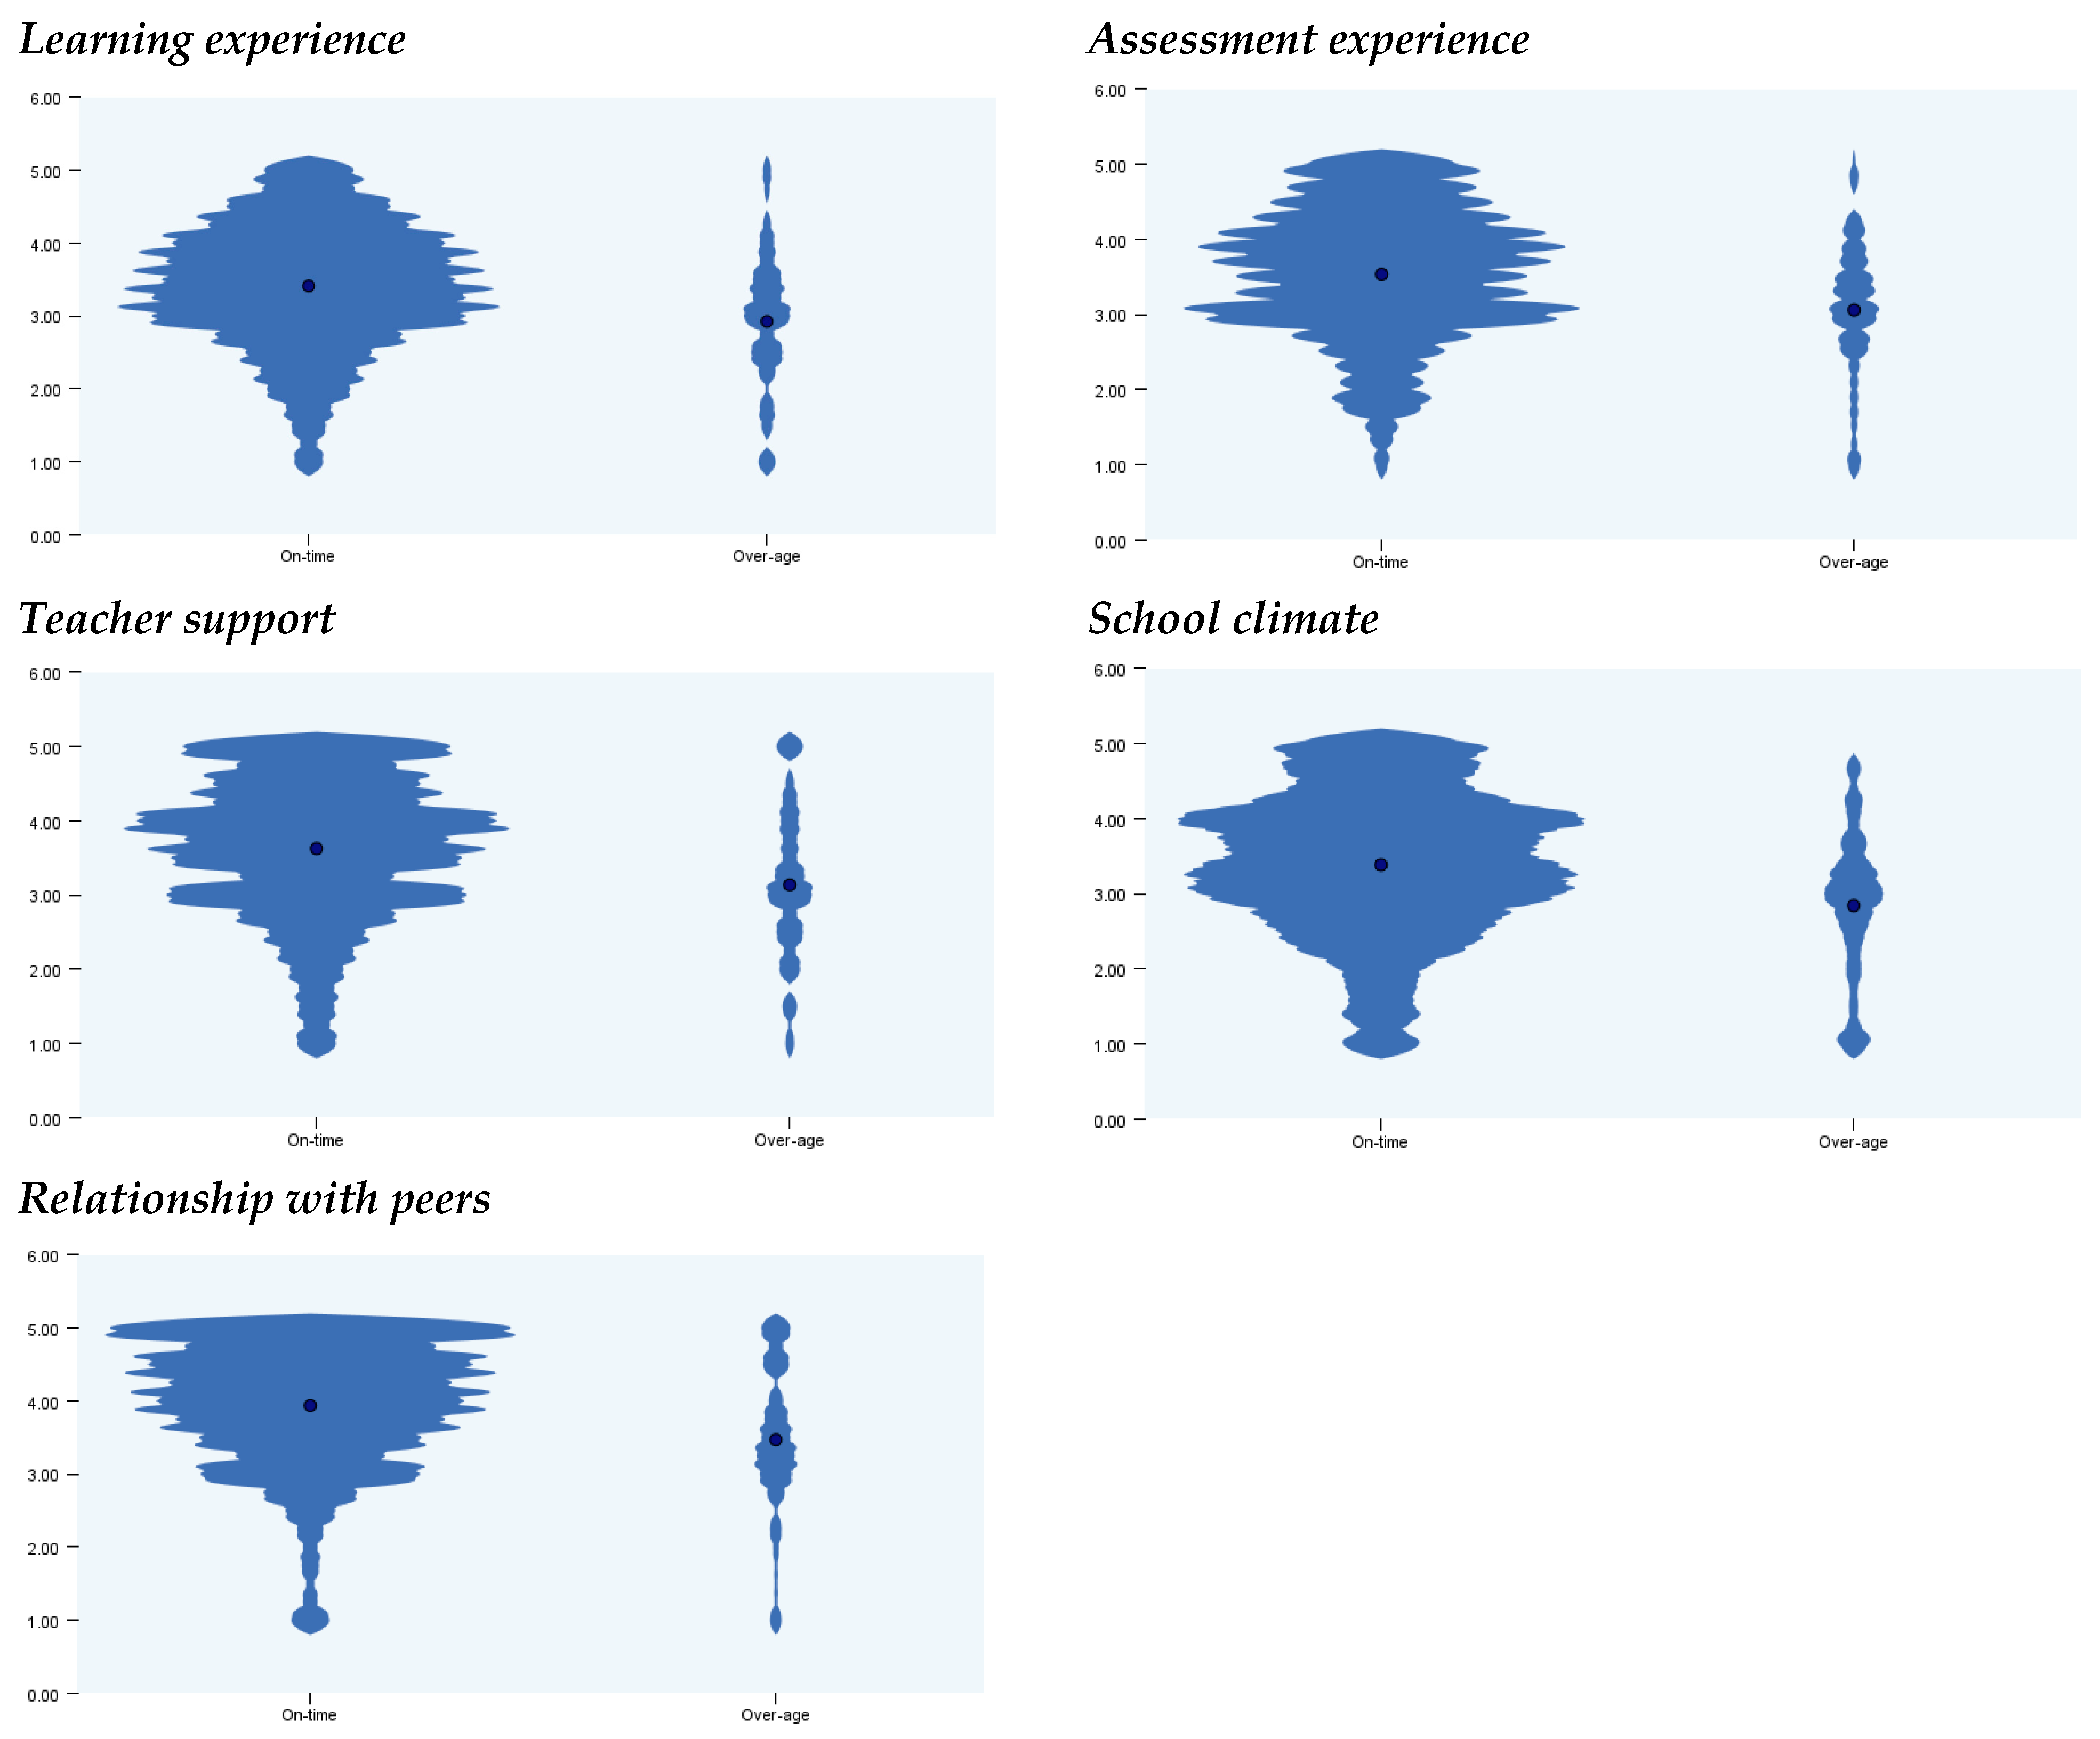
Regarding the variables’ feelings about the learning experience, assessment, teacher support, and school climate, a non-significant Levene’s test points out homocedasticity. The Welch-corrected t-test was statistically significant (Table 3) for the four variables, indicating differences in perceived feelings between over-age students and the group with an aligned age to the grade attended. This is translated by the statistics obtained for the learning experience (t(1010) = 5.184, p < 0.001, mean difference = 0.4861, 95% CI [0.3021, 0.6702]), assessment experience (t(1010) = 4.976, p < 0.001, mean difference = 0.4757 95% CI [0.2881, 0.6632]), teacher support (t(1010) = 4.750, p < 0.001, mean difference = 0.4897, 95% CI [0.2874, 0.6920]), and school climate (t(1010) = 5.174, p < 0.001, mean difference = 0.5416, 95% CI [0.3362, 0.7471]). Then, over-age students tend to have around 0.5 points less favorable perception concerning the four variables and slightly below-neutral views regarding the learning experience and the school climate. The same difference occurs regarding feelings about assessment and teacher support, even though they tend to be neutral.
Regarding the variable feelings about emotional discomfort, Levene’s test was not statistically significant (p > 0.05), so equal variances were assumed between the two groups: students attending a grade with and without the aligned age. The t-test with the Welch correction also did not indicate significant differences between the mean values of the two groups, t(1010) = 0.719, with p = 0.236, mean difference = 0.0815, and 95% CI [−0.1410, 0.3041].
This study’s findings highlight a consistent gap between on-time students and those who exceed the expected age by 1 to 4 years, considering the grade they attend. Those differences regard the school climate (2.84 vs. 3.38), teacher support (3.14 vs. 3.63), learning (2.92 vs. 3.41), assessment (3.06 vs. 3.53), and peer relationships (3.47 vs. 3.94). Then, five areas signal risk concerning the fringe of students’ over-age status, and interventions are needed regarding belonging, safety, teacher-student relationships, and assessment strategies to foster a more inclusive school environment. These are essential aspects for academic success and are reflected in the students’ well-being and quality of life (Guedes et al., 2023; Hopwood et al., 2025; Moeller et al., 2020).
The analysis of the distributions of the responses through the violin plots (Figure 2) adds that: on-time students showed a ceiling effect, with a noticeably higher concentration of “5” ratings concerning the relationship with peers and teacher support in comparison with feelings regarding the school climate, and the learning and assessment experiences; over-age students present a tail effect regarding the school climate, corresponding to responses aligned with “1” rating. Hence, since the data support hypothesis 1, interventions should include improving school climate ratings (especially for over-age students) and nudging learning and assessment perceptions upward. Additionally, further research is needed to investigate the causes of lower well-being among over-age students, as well as the threats they pose to learning. Considering that being overage is a consequence of disapproval, the adverse effects on self-esteem and the desire to learn remain unanswered.
In terms of practical implications, the findings indicate that schools should offer targeted emotional and academic support for over-age students, such as mentoring, tutoring, and peer-integration programs, to enhance their sense of belonging and engagement. Flexible learning paths and positive teacher–student relationships can also help counteract negative feelings and promote inclusion.

4.2.2. Effect of the Schooling Level

Considering the 5-point scale used in this study, Table 4 shows that feelings about the learning experience differed by schooling level, with a medium magnitude effect [F(2, 1009) = 41.336, p < 0.001, η2 = 0.076]. Students in the 2nd cycle reported higher feelings (M = 3.82) than those in the 3rd cycle (M = 3.31; mean difference = 0.512, p < 0.001) and the SL (M = 3.17; mean difference = 0.651, p < 0.001). The 3rd cycle and SL groups did not significantly differ.
Regarding the feelings about the assessment experience, differences exist between students from different schooling levels [F(2, 1009) = 48.509, p < 0.001, η2 = 0.088] (medium magnitude). The post hoc Games-Hommel test revealed significant differences among the three groups, with the lowest perception among students from the SL (M = 3.27), followed by those from the 3rd cycle (M = 3.44) and the 2nd cycle (M = 3.98), the most favourable. With the increase in educational level, the decline in well-being related to assessments can be explained by the pressure of national exams and the academic results needed for university admission. Several authors document test anxiety (Tan et al., 2025), with a higher impact on high-performing students (D’Agostino et al., 2022; Klapp et al., 2024), which poses the risk of decreasing engagement and lower-quality teacher-student relationships among students due to poor academic performance (Patrick et al., 2019). These interactions can lead to a snowball effect that increases detachment.
Feelings about teacher support show similar and median perceptions for students from 7th to 12th grades (M = 3.43, M = 3.54), but differ significantly from those in the 2nd cycle, which are more positive (M = 3.98). These differences, clarified by post hoc Games-Hommel test, are sustained by ANOVA [F(2, 1009) = 25.480, p < 0.001, η2 = 0.048].
Concerning the school climate, significant differences among students from different scholarship levels are supported by an F(2, 1009) = 15.825, with a p < 0.001, and η2 = 0.030. Tukey HSD results revealed significant differences between students from the 2nd cycle (M = 3.64) and the 3rd cycle (M = 3.19), as well as between the 2nd cycle and the SL (M = 3.35). The 3rd cycle and SL groups did not differ significantly. Better perceptions regarding the relationship with peers are reported, with significant differences between groups according to ANOVA, but with a low magnitude effect [F(2, 1009) = 5.827, p = 0.003, η2 = 0.011]. The 3rd cycle and SL groups did not differ significantly from each other. The Games-Howell test revealed that the perception of the 2nd cycle’s students (M = 4.07) differs from that of the older students attending the 3rd cycle (M = 3.82) and the SL (M = 3.88). The probability of the ANOVA rejecting a false null hypothesis for the five variables concerning students’ feelings, which revealed a significant statistical difference among groups, is negligible, given the power values observed (higher than 0.80—Table 4).
The one-way ANOVA revealed no significant difference in emotional discomfort across groups, F(2, 1009) = 1.469, with p = 0.231, η2 = 0.003, and means indicating neutral perceptions.
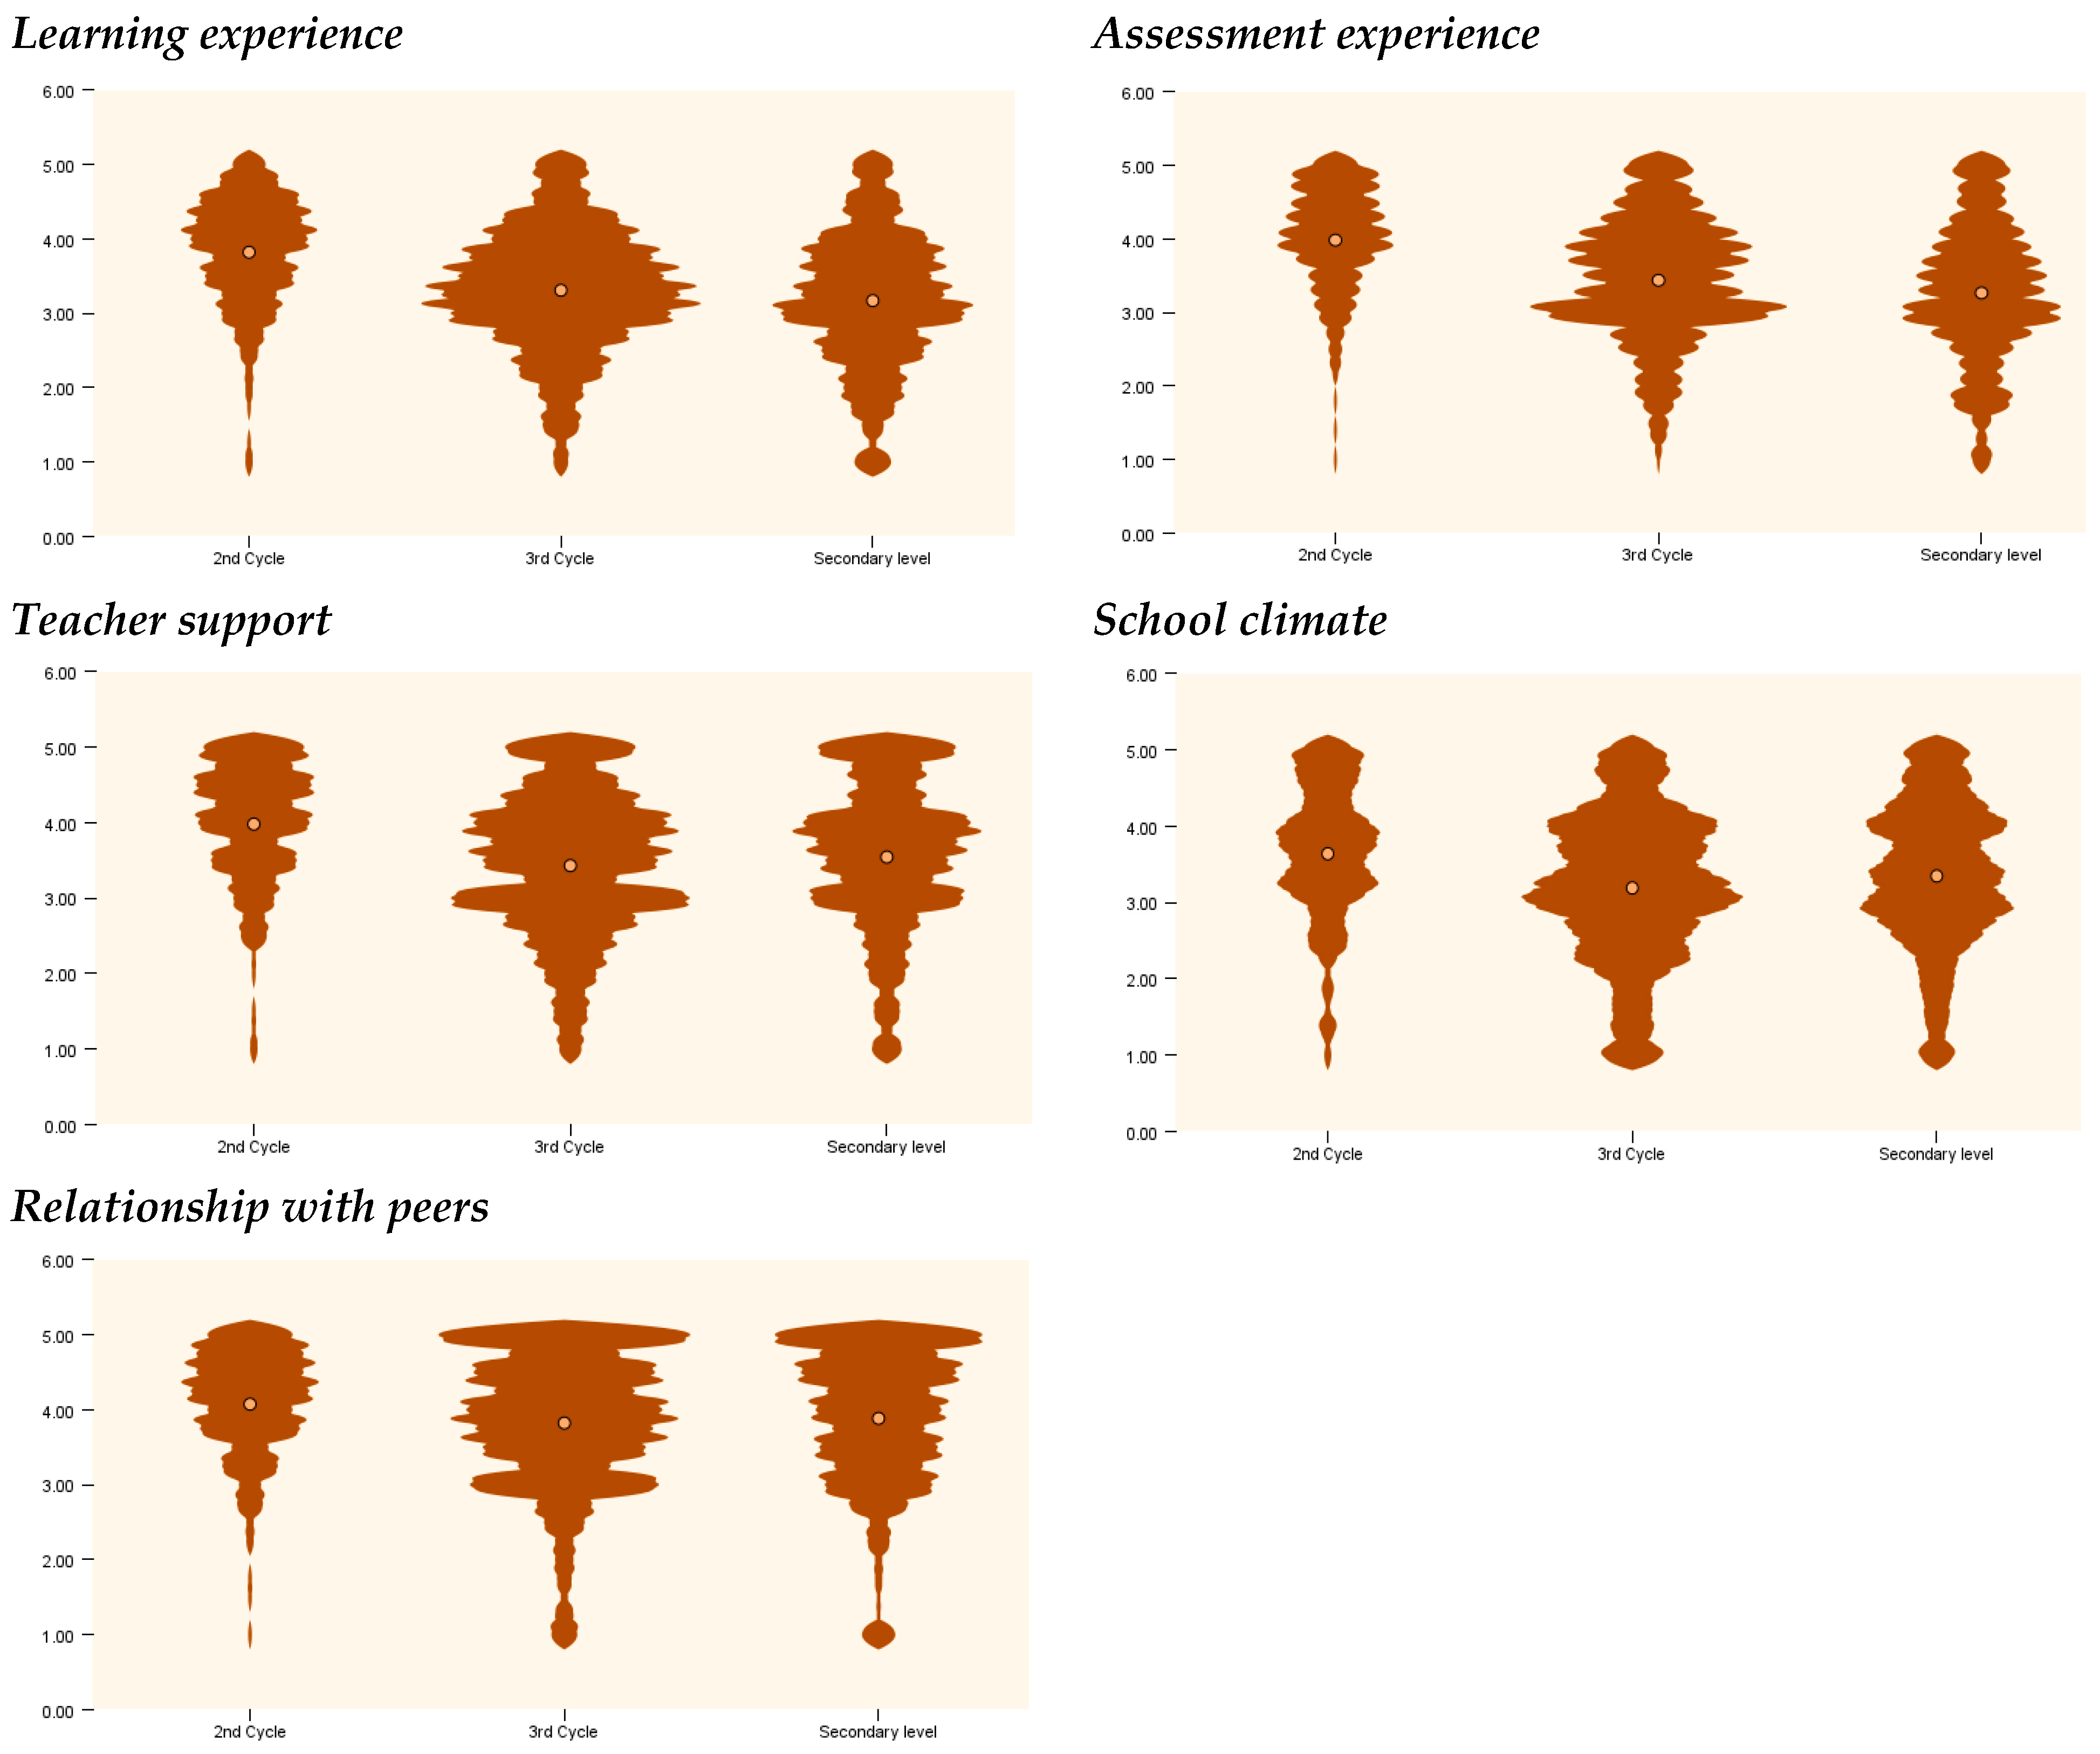
In short, stronger endorsement regarding feelings about the school exists among students who attend the 5th and 6th grades. Older students tend to exhibit neutral feelings regarding teaching, learning, assessment, and the school climate. The relationship with peers is a positive aspect of the school’s day-to-day reality. Then, H2 is partially supported by the data, as the differences in feelings observed between the 2nd cycle and the two remaining groups of students—the 3rd cycle and the SL—share similar perceptions of the schooling experience.
Globally, as education increases, a sort of disenchantment with the school emerges regarding learning, assessment, experiences, teacher support, and the school climate. Huebner et al. (2009) highlighted the influence of educational stage on learners’ well-being, and this study extends that finding by showing that the decline in positive feelings starts in the 3rd cycle. The disenchantment with the school is especially evident in the responses to the items “I feel that what I learn is helpful for my life” (M = 3.30), “I feel motivated to learn new things in each subject” (M = 3.34), and “I like to be at school” (M = 3.18).
The violin plots (Figure 3) frame the situational squaring of data. The 2nd-cycle students exhibit a lined tail signature, due to a lack of responses rated “1” and “2”, and a larger corpus that persists until “5”, with feelings ranging from neutral to high positive perceptions of the school. Violin plots for older students reveal larger tails and even small tail effects in SL students regarding their learning experience, teacher support, relationship with peers, and school climate. Most responses are neutral, trending downward in direction toward a “5” rating, particularly in areas of learning, assessment, and school climate. These results align with those of Harter (2009), who noted that negative perceptions increase as students progress through the system. The relationship with peers and teacher support indicates a ceiling effect, with considerable responses aligned with the “5” rating. These three responses and the distribution signature represented in the violin plots are good indicators of the status of the student-school relationship and the need to strengthen relevance, motivation, school climate, and the learning and assessment experiences. This aligns with Hargreaves et al. (2018), who state that less positive feelings can interfere with the cognitive process of learning. Given that the effects of schooling are partly characterized by the feelings students experience at school (Moeller et al., 2020), this study’s findings have important practical implications, highlighting the need to address the emotional status of fringe student groups and to strengthen the overall school environment.

4.2.3. Effect of Gender

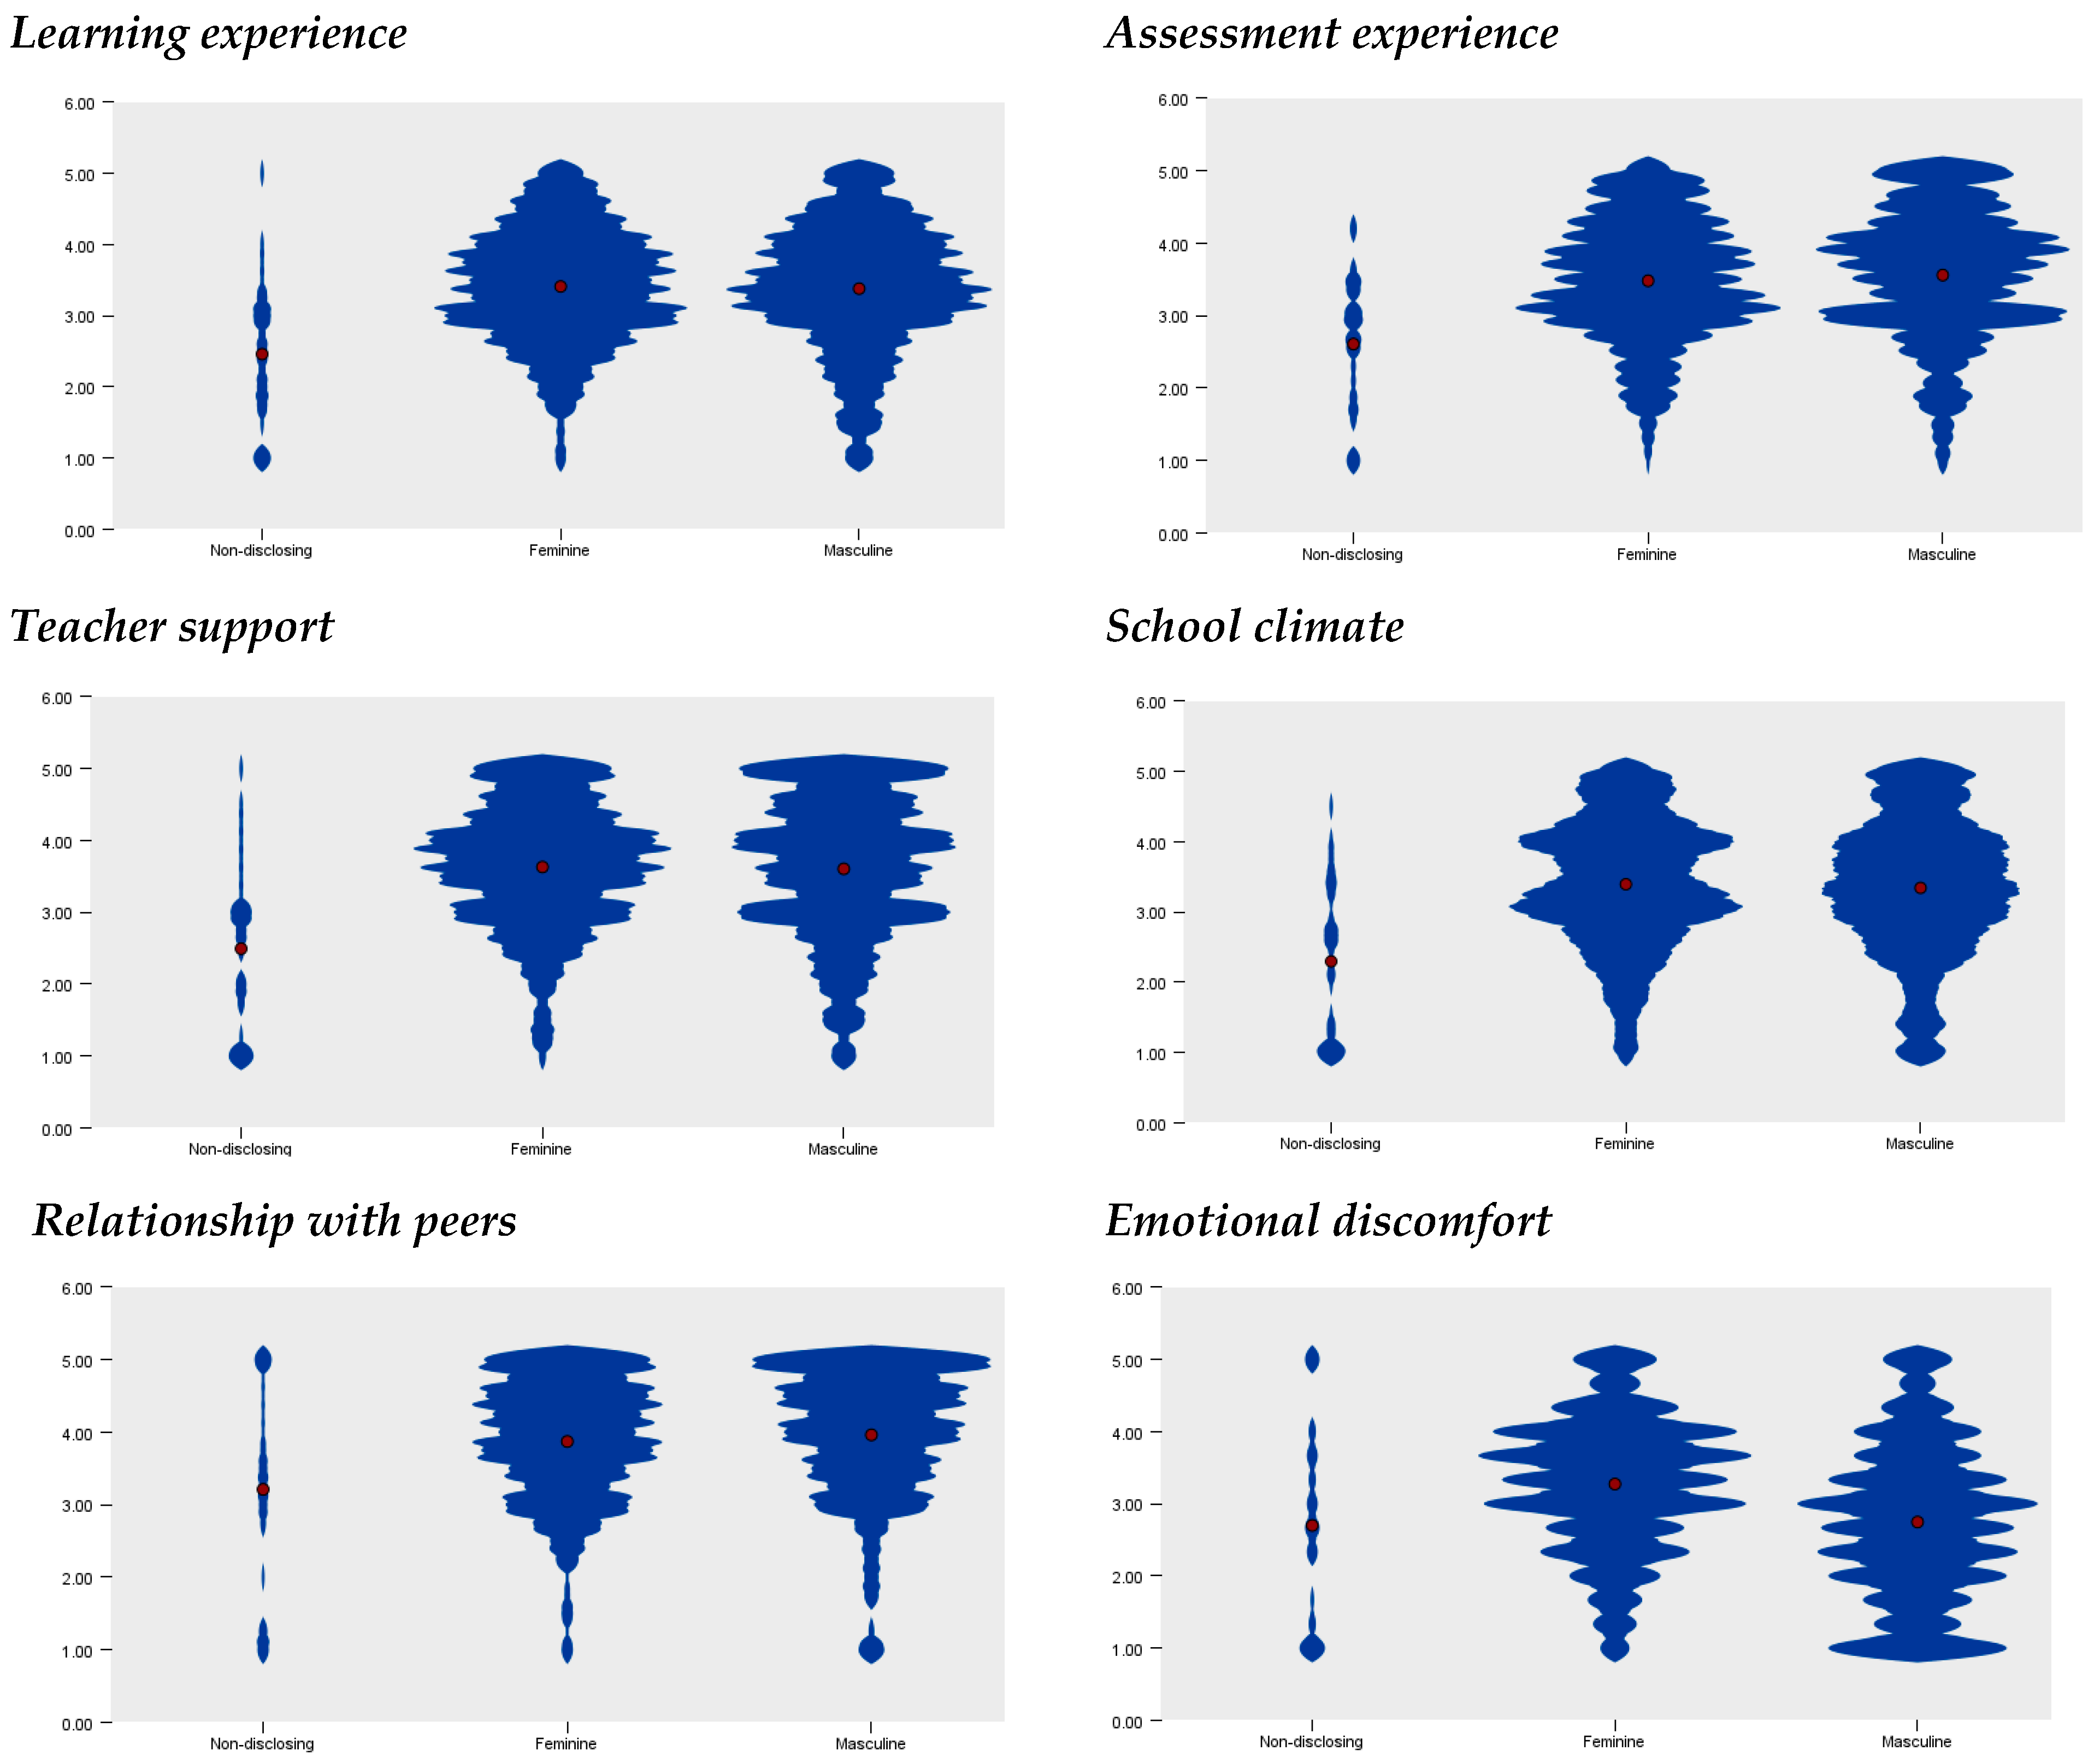
A study developed by Marquez (2024) using data from PISA from 47 countries indicates that multiple factors may influence the life satisfaction of girls and boys in the school context. Then, analyzing students’ feelings about the overall learning experience per gender is relevant. Differences in feelings regarding the six dimensions studied, as presented in Table 5, revealed that emotional discomfort was the only dimension with statistically significant differences between male and female students. One-way ANOVA report F(2, 2009) = 35,116, with p < 0.001, η2 = 0.065 (medium magnitude), and the post hoc Tukey HSD signaled differences between genders (M = 2.74 for males; M = 3.27 for females), but lacked significant differences with the group of students that did not disclose (ND) their gender. These results are aligned with the ones obtained by Marquez (2024), who reported more negative feelings concerning school anxiety among girls in comparison with boys. The violin box plot (Figure 4) reveals a considerable tail effect in male students, indicating a high positive perception. In contrast, among females, many responses range from “3” to “4”, interpreted as less favorable.
Conversely, the group constituted by ND students presented lower, negative, and significantly different from male and female students, regarding feelings about: (i) learning experience [F(2, 2009) = 18,147, p < 0.001, η2 = 0.035]; (ii) assessment experience [F(2, 2009) = 17,514, p < 0.001, η2 = 0.034]; (iii) teacher support [F(2, 2009) = 21,847, p < 0.001, η2 = 0.042]; school climate [F(2, 2009) = 19,392, p < 0.001, η2 = 0.037]; relationship with peers [F(2, 2009) = 10,995, p < 0.001, η2 = 0.021]. Post hoc tests revealed no significant differences between female and male students in terms of these five variables. Across outcomes, the effect of gender on the five dependent variables was minimal, with partial η2 values ranging from 0.021 to 0.042. We therefore interpret these differences as statistically reliable, albeit modest in practical terms. Because the group sizes were highly unbalanced and variances were sometimes unequal, we used Welch’s ANOVA with Games–Howell pairwise test when assumptions were violated. Significant omnibus effects were driven by the smallest group (ND); the two larger groups did not differ on five of the six variables examined (all p > 0.05). Thus, where differences existed, they were small to modest and concentrated in comparisons involving the ND group. The violin plot analysis (Figure 4) reveals a tail effect, more pronounced in relation to teacher support and school climate, as well as a fine-lined pattern regarding favorable perceptions in the six variables studied. In practical terms, the issue of emotions across gender must be strategically addressed by schools.

4.3. H4 Hypothesis Testing

This study estimated multiple linear regression models to examine the predictors of students’ in-class emotional and learning experiences. Model fit was evaluated with r2 and the overall F-test, and the unique contribution of each exogenous predictor was assessed via standardized β and semi-partial r2. The results are summarized in Table 6. Given the observed effects related to gender, schooling level, and age, these variables were also considered for control purposes.
The assumptions of linear regression were tested before interpretation. Multicollinearity diagnostics of both models indicated tolerances ≥ 0.36 and VIFs ≤ 2.76 across predictors, under the threshold of 5, suggesting no serious concerns (James et al., 2017). In both models, the Pearson correlation between the predictor and outcome of the tested models is large by standard benchmarks (Pestana & Gageiro, 2014), given the r of 0.737 and 0.755, indicating that it explains 54% of the variance in the students’ feelings during classes and 57% of the students’ learning experience. Finally, the examination of standardized residual plots confirmed the assumptions of linearity and homoscedasticity, as the residuals were randomly distributed around zero.
The ANOVA F-test indicates that the exogenous variables significantly predict the dependent variable (p < 0.001). For the dependent variable, feeling well during classes, the model obtained was statistically significant (Y = 0.914 + 0.336LE + 0.140AE + 0.114TS + 0.176SC + 0.068RwP − 0.063ED − 0.059AGS − 0.066G; p < 0.05) and had an r2 = 0.543. Then, according to the correlation results (Table 6), feeling well during classes is influenced in 4.8% by the feeling about the learning experience, 1.3% by the school climate, and the remaining variables—assessment experience, relationship with peers, emotional discomfort, grade, and age-for grade status—exercise an influence inferior to 1%. The predictive sum effect of the set of significant independent variables is 8.7%, although their combined effect represents 45.2%.
Regarding the feelings about the learning experience, the model was statistically significant (Y = 0.912 + 0.364AE + 0.178TS + 0.236SC + 0.050RwP + 0.050ED − 0.108G; p < 0.05) and had an r2 = 0.571. The correlation results indicate that the learning experience depends on the assessment experience (5.4%), school climate (2.5%), teacher support (1.3%), grade (1.1%), emotional discomfort (0.3%), and relationship with peers (0.1%). The cumulative effect of these independent variables represents 10.7%, and their interaction effect 46.4%.
The models and results obtained support H4, indicating an association between students’ feelings about their learning experience and assessment, teachers’ support, peer relationships, and emotional discomfort. Given the effects of each predictor, the results suggest that unique effects are minor, so interventions to improve the overall learning experience must arise from synergies carefully built through interactions concerning the predictors. These results align with the concept of complexity, which encompasses emotional and relational, cognitive and motivational, individual and social aspects, as well as context-sensitive factors, all of which underlie students’ feelings and the issue of academic learning (Op’t Eynde & Turner, 2006). These findings highlight important practical implications: improving students’ learning experiences requires comprehensive, context-sensitive interventions that integrate emotional, relational, cognitive, and motivational dimensions rather than isolated actions.

4.4. Study’s Limitations

This study has limitations that must be acknowledged. First, this study surveys students in six school clusters, which, although diverse, do not represent a systematic examination of Portuguese students’ feelings and how these feelings differ across demographic groups. Then, generalization to the entire Portuguese population is limited. Future research should expand the sample to include schools of different sizes, geographical areas, and socio-economic contexts. Second, the investigation included minority fringe groups of the population, whose study is of remarkable interest, but the limited number of students may have reduced the reliability of comparisons. Hence, in-depth research is advised to ensure broader representativeness. Third, this study adopted a purely quantitative approach, relying on self-reported survey data and focusing objectively on the aims achieved through the questionnaire. Although the general patterns of the students’ feelings were identified, it might not have captured the contextual and subjective nuances of their feelings or experiences. Future studies could benefit from combining quantitative and qualitative analysis to achieve a deeper and more holistic understanding. Then, given the exploratory nature of this study, it should be considered a starting point for further approaches to understanding the reality of the Portuguese context.

5. Conclusions

Globally, this study shows that the students’ happiness set point tends to be neutral, with a level of satisfaction regarding the school experience that does not translate to complete well-being. Feelings about the assessment experience and teacher support are moderately neutral, but they are better than those regarding the learning experience and the school climate. Emotional discomfort cannot be neglected, even though feelings about students’ relationships were robustly positive. This signature of the students’ feelings highlights critical areas of the schooling experience that may require attention: students’ concentration, perceived relevance of the curricula, motivation, assessment for learning, school climate pleasantness, perceived fairness of treatment, and school appreciation.
Concerning the demographic factors, the findings suggest the following: (i) an association regarding age, where students older than the expected age for the grade they attend show less positive feelings regarding five of the variables studied, namely learning and assessment experiences, teacher support, school climate, and relationship with peers; (ii) an association regarding grade, with 5th and 6th grade students showing more positive feelings regarding the dimensions learning and assessment experiences, teacher support, school climate, and relationship with peers; (iii) the decline in students’ feelings about the schooling experience appears to begin in the 3rd cycle (12 to 15 years old students); (iv) students’ feelings from the 7th to 12th grades are similar and near neutral with exception to relationship with peers, which is more favorable; (v) SL students show lower perceptions of assessment, reflecting a more performative schooling level; (vi) differences between genders exist only regarding emotional discomfort, rating higher in female students compared with male; (vii) students who did not disclose their gender expressed more negative feelings regarding learning experience, assessment experience, teacher support, school climate, and relationship with peers.
Both over-age students and those who did not disclose gender reported low levels of satisfaction with the school experience, characterized by low hedonic adaptational mechanisms, which in turn lead to low eudaimonic positions and reduced tendencies to become self-fulfilled. These two fringe groups of the population represent sensitive dimensions of the context that require caution, because building inclusive schools involves nurturing a sense of belonging and ensuring a positive schooling experience for all students.
Concerning the explanatory factors of the learning experience, six predictors were identified, accounting together for 10.7%, namely assessment experience, school climate, teacher support, emotional discomfort, relationship with peers, and grade. The interaction of the six predictors together explained 46.4% of the variance. The evaluation of how students feel during classes included seven predictors: learning experience (the most important), assessment experience, school climate, teacher support, emotional discomfort, relationship with peers, age-for-grade status, and grade. The predictors’ single effects accounted for 8.7% and in interaction explained 45.2% of the variance. The relatively small unique contributions and larger combined variance highlight the complexity of designing effective school interventions.
These findings suggest practical implications for schools aiming to enhance students’ feelings toward their schooling experience. Such efforts should include the following: the design of combined interventions such as cross formative assessment with student-centred teaching and learning processes; targeting population minorities, namely over-age students, students with gender identity issues, and upper grades attendance students, and developing grade-specific and over-age-focused supports, such as mentoring programs and scaffolded transitions; providing professional development for teachers on emotional awareness and empathy; developing a monitoring and evaluation program for students’ feelings and the programs on the field; establishing a bottom line strategy that is context-sensitive, coordinated by dynamic, interactive, and proactive leaderships.

Author Contributions

Conceptualization, L.S., J.M.A., and G.P.; methodology, L.S. and J.M.A.; software, L.S.; validation, L.S., J.M.A., and G.P.; formal analysis, L.S.; investigation, L.S.; resources, L.S., J.M.A., and G.P.; data curation, L.S.; writing—original draft preparation, L.S. and G.P.; writing—review and editing, L.S., J.M.A., and G.P.; supervision, J.M.A.; project administration, J.M.A.; funding acquisition, L.S. and J.M.A. All authors have read and agreed to the published version of the manuscript.

Funding

This research received no external funding.

Institutional Review Board Statement

This study was conducted in accordance with the Declaration of Helsinki and approved by the Code of Ethics and Conduct of the Portuguese Catholic University (protocol code NR/R/1419/2015 and date of approval: 1 December 2015).

Informed Consent Statement

Informed consent was obtained from all subjects involved in this study.

Data Availability Statement

The raw data supporting this study will be made available by the corresponding author upon reasonable request.

Conflicts of Interest

The authors declare no conflicts of interest.

Abbreviations

The following abbreviations are used in this manuscript:
SLSecondary Level
LELearning experience
AEAssessment experience
TSTeacher support
SCSchool climate
RwPRelationship with peers
EDEmotional discomfort
AGSAge-for-grade status
GGrade
VIFVariation Inflation Factor

References

  1. Abdullah, M. I., Inayati, D., & Karyawati, N. N. (2022). Nearpod use as a learning platform to improve student learning motivation in an elementary school. Journal of Education and Learning (EduLearn), 16(1), 121–129. [Google Scholar] [CrossRef]
  2. Alvarez, L. (2021). António Nóvoa: Aprendizagem precisa considerar o sentir. Available online: https://revistaeducacao.com.br/2021/06/25/Antonio-Novoa-Aprendizagem-Sentir/ (accessed on 20 July 2025).
  3. Arbuthnot, K. (2017). Global perspectives on educational testing: Examining fairness, high-stakes and policy reform. Emerald Publishing Limited. [Google Scholar]
  4. Blanca, M. J., Alarcón, R., Arnau, J., Bono, R., & Bendayan, R. (2017). Non-normal data: Is ANOVA still a valid option? Psicothema, 29(4), 552–557. [Google Scholar] [CrossRef] [PubMed]
  5. Brandmo, C., & Gamlem, S. M. (2025). Students’ perceptions and outcome of teacher feedback: A systematic review. In Frontiers in education (Vol. 10). Frontiers Media SA. [Google Scholar] [CrossRef]
  6. Breidenstein, G. (2007). The meaning of boredom in school lessons. Participant observation in the seventh and eighth form. Ethnography and Education, 2(1), 93–108. [Google Scholar] [CrossRef]
  7. Cefai, C., Simões, C., & Carvita, S. (2021). A systemic, whole-school approach to mental health and well-being in schools in the EU. NESET. [Google Scholar] [CrossRef]
  8. Chiu, K., Clark, D. M., & Leigh, E. (2021). Prospective associations between peer functioning and social anxiety in adolescents: A systematic review and meta-analysis. Journal of Affective Disorders, 279, 650–661. [Google Scholar] [CrossRef] [PubMed]
  9. Clarke, T. (2023). Do scores ‘define’ us? Adolescents’ experiences of wellbeing as ‘welldoing’ at school in England. Review of Education, 11(1), e3393. [Google Scholar] [CrossRef]
  10. Corominas, M., González-Carrasco, M., & Casas, F. (2022). Children’s school subjective Well-Being: The importance of schools in perception of support received from classmates. Psicologia Educativa, 28(2), 99–109. [Google Scholar] [CrossRef]
  11. Çetin, A., Gül, M., & Doğanay, A. (2021). How students feel at school: Experiences and reasons. International Journal of Psychology and Educational Studies, 8(2), 232–245. [Google Scholar] [CrossRef]
  12. D’Agostino, A., Schirripa Spagnolo, F., & Salvati, N. (2022). Studying the relationship between anxiety and school achievement: Evidence from PISA data. Statistical Methods and Applications, 31(1), 1–20. [Google Scholar] [CrossRef]
  13. Damásio, A. (2020). Sentir & Saber—A caminho da consciência, temas e debates (1st ed.). Círculo de leitores. [Google Scholar]
  14. Deci, E. L., & Ryan, R. M. (2000). The “what” and “why” of goal pursuits: Human needs and the self-determination of behavior. Psychological Inquiry, 11(4), 227–268. [Google Scholar] [CrossRef]
  15. Fan, T., & Bellmore, A. (2023). Connecting Feelings of school belonging to high school students’ friendship quality profiles. Journal of Social and Personal Relationships, 40(8), 2488–2511. [Google Scholar] [CrossRef]
  16. Guedes, F. B., Cerqueira, A., Gaspar, S., Gaspar, T., Moreno, C., & de Matos, M. G. (2023). Quality of life and Well-Being of adolescents in Portuguese schools. Child Indicators Research, 16(4), 1381–1394. [Google Scholar] [CrossRef]
  17. Hargreaves, E., Elhawary, D., & Mahgoub, M. (2018). ‘The teacher who helps children learn best’: Affect and authority in the traditional primary classroom. Pedagogy, Culture and Society, 26(1), 1–17. [Google Scholar] [CrossRef]
  18. Harter, S. (2009). Teacher and classmate influences on scholastic motivation, self-esteem, and level of voice in adolescents. In Social motivation (pp. 11–42). Cambridge University Press. [Google Scholar] [CrossRef]
  19. Hoferichter, F., Kulakow, S., & Raufelder, D. (2022). How teacher and classmate support relate to students’ stress and academic achievement. Frontiers in Psychology, 13, 992497. [Google Scholar] [CrossRef]
  20. Hopwood, N., Palmer, T. A., Koh, G. A., Lai, M. Y., Dong, Y., Loch, S., & Yu, K. (2025). Understanding student emotions when completing assessment: Technological, teacher and student perspectives. International Journal of Research and Method in Education, 48(2), 194–209. [Google Scholar] [CrossRef]
  21. Huebner, E. S., Gilman, R., Reschly, A., & Hall, R. (2009). Positive school, in handbook of positive psychology (S. J. Lopez, Ed.). Plenum. [Google Scholar]
  22. Ibrahim, A., & El Zataari, W. (2020). The teacher–student relationship and adolescents’ sense of school belonging. International Journal of Adolescence and Youth, 25(1), 382–395. [Google Scholar] [CrossRef]
  23. James, G., Witten, D., Hastie, T., & Tibshirani, R. (2017). An introduction to statistical learning. In R. Koenker, V. Chernozhukov, X. He, & L. Peng (Eds.), Handbook of quantile regression (8th ed.). Springer. [Google Scholar] [CrossRef]
  24. Jiang, A. L., & Zhang, L. J. (2021). University teachers’ teaching style and their students’ agentic engagement in EFL learning in China: A self-determination theory and achievement goal theory integrated perspective. Frontiers in Psychology, 12, 704269. [Google Scholar] [CrossRef] [PubMed]
  25. Kandemir, M. (2013). A model explaining test anxiety: Perfectionist personality traits and performance achievement goals. International Journal of Academic Research, 5(5), 272–277. [Google Scholar] [CrossRef]
  26. Klapp, T., Klapp, A., & Gustafsson, J. E. (2024). Relations between students’ well-being and academic achievement: Evidence from Swedish compulsory schools. European Journal of Psychology of Education, 39(1), 275–296. [Google Scholar] [CrossRef]
  27. Koca, F. (2016). Motivation to learn and teacher-student relationship. Journal of International Education and Leadership, 6(2), 2–20. [Google Scholar]
  28. Li, J., & Xue, E. (2023). Dynamic interaction between student learning behaviour and learning environment: Meta-analysis of student engagement and its influencing factors. Behavioral Sciences, 13(1), 59. [Google Scholar] [CrossRef]
  29. LoCasale-Crouch, J., Jamil, F., Pianta, R. C., Rudasill, K. M., & DeCoster, J. (2018). Observed quality and consistency of fifth graders’ teacher–student interactions: Associations with feelings, engagement, and performance in school. SAGE Open, 8(3), 215824401879477. [Google Scholar] [CrossRef]
  30. Looker, B., Kington, A., & Vickers, J. (2023). Close and conflictual: How pupil–teacher relationships can contribute to the alienation of pupils from secondary school. Education Sciences, 13(10), 1009. [Google Scholar] [CrossRef]
  31. Lumley, T., Diehr, P., Emerson, S., & Chen, L. (2002). The importance of the normality assumption in large public health data sets. Annual Review of Public Health, 23, 151–169. [Google Scholar] [CrossRef]
  32. Lykken, D., & Tellegen, A. (1996). Happiness is a stochastic phenomenon. Psychological Science, 7(3), 186–189. [Google Scholar] [CrossRef]
  33. Marquez, J. (2024). Gender differences in school effects on adolescent life satisfaction: Exploring cross-national variation. Child and Youth Care Forum, 53(2), 389–409. [Google Scholar] [CrossRef]
  34. Martín de Hijas-Larrea, L., de Anda-Martín, I. O., & Díaz-Iso, A. (2025). Teaching with ears wide open: The value of empathic listening. Education Sciences, 15(3), 356. [Google Scholar] [CrossRef]
  35. McDiarmid, G. W. (2023). What really matters: Prioritizing youth mental health in an age of growing uncertainty. Educational Research for Policy and Practice, 24(1), 137–145. [Google Scholar] [CrossRef]
  36. Moeller, R. W., Seehuus, M., & Peisch, V. (2020). Emotional intelligence, belongingness, and mental health in college students. Frontiers in Psychology, 11, 93. [Google Scholar] [CrossRef]
  37. Monteiro, V., Carvalho, C., & Santos, N. N. (2021). Creating a Supportive classroom environment through effective feedback: Effects on students’ school identification and behavioral engagement. Frontiers in Education, 6, 661736. [Google Scholar] [CrossRef]
  38. Nakano, M., Yamazaki, C., Teshirogi, H., Kubo, H., Ogawa, Y., Kameo, S., Inoue, K., & Koyama, H. (2022). How worries about interpersonal relationships, academic performance, family support, and classmate social capital influence suicidal ideation among adolescents in Japan. Tohoku Journal of Experimental Medicine, 256(1), 73–84. [Google Scholar] [CrossRef]
  39. OECD. (2025, July 25). OECD Statistics blog. Available online: https://oecdstatistics.blog/2025/04/08/from-Data-to-Action-Enhancing-Childrens-Lives-through-Better-Insights/?Utm_source=chatgpt.Com (accessed on 20 July 2025).
  40. Opre, D., Pintea, S., Opre, A., & Bertea, M. (2018). Measuring adolescents’ subjective well-being in an educational context: Development and validation of a multidimensional instrument. Journal of Evidence-Based Psychotherapies, 18(2), 161–180. [Google Scholar] [CrossRef]
  41. Op’t Eynde, P., & Turner, J. E. (2006). Focusing on the complexity of emotion issues in academic learning: A dynamical component systems approach. Educational Psychology Review, 18(4), 361–376. [Google Scholar] [CrossRef]
  42. Ovalle, H., Nussbaum, M., Claro, S., Espinosa, P., & Alvares, D. (2024). Happiness at school and its relationship with academic achievement. Education Sciences, 14(12), 1321. [Google Scholar] [CrossRef]
  43. Patrick, B. C., Stockbridge, S., Roosa, H. V., & Edelson, J. S. (2019). Self-silencing in school: Failures in student autonomy and teacher-student relatedness. Social Psychology of Education, 22(4), 943–967. [Google Scholar] [CrossRef]
  44. Perrenoud, P. (1996). Métier d’élève et Sens du Travail Scolaire. ESF. [Google Scholar]
  45. Pestana, M. H., & Gageiro, J. N. (2014). Análise de Dados para Ciências Sociais: A complementariedade do SPSS (6th ed.). Edições Silabo. [Google Scholar]
  46. Ribeiro-Silva, E., Amorim, C., Aparicio-Herguedas, J. L., & Batista, P. (2022). Trends of active learning in higher education and students’ well-being: A literature review. Frontiers in Psychology, 13, 844236. [Google Scholar] [CrossRef] [PubMed]
  47. Richardson, C., & Mishra, P. (2018). Learning environments that support student creativity: Developing the SCALE. Thinking Skills and Creativity, 27, 45–54. [Google Scholar] [CrossRef]
  48. Ryan, R. M., & Weinstein, N. (2009). Undermining quality teaching and learning: A self-determination theory perspective on high-stakes testing. Theory and Research in Education, 7(2), 224–233. [Google Scholar] [CrossRef]
  49. Schildkamp, K., van der Kleij, F. M., Heitink, M. C., Kippers, W. B., & Veldkamp, B. P. (2020). Formative assessment: A systematic review of critical teacher prerequisites for classroom practice. International Journal of Educational Research, 103, 101602. [Google Scholar] [CrossRef]
  50. Serra, L., Alves, J. M., & Pinheiro, G. (2025). Development and validation of a scale to measure students’ feelings about school: An exploratory and confirmatory factor analysis approach. American Journal of Education and Learning, 10(2), 190–206. [Google Scholar] [CrossRef]
  51. Shao, Y., & Kang, S. (2022). The association between peer relationship and learning engagement among adolescents: The chain mediating roles of self-efficacy and academic resilience. Frontiers in Psychology, 13, 938756. [Google Scholar] [CrossRef]
  52. Sointu, E. T., Savolainen, H., Lappalainen, K., & Lambert, M. C. (2017). Longitudinal associations of student–teacher relationships and behavioural and emotional strengths on academic achievement. Educational Psychology, 37(4), 457–467. [Google Scholar] [CrossRef]
  53. Sun, Y. (2021). The effect of teacher caring behavior and teacher praise on students’ engagement in EFL classrooms. Frontiers in Psychology, 12, 746871. [Google Scholar] [CrossRef] [PubMed]
  54. Tan, S. H., Cassady, J. C., Wong, J. K. C., Khng, K. H., & Leong, W. S. (2025). A systematic review of test anxiety identification and leveling in children and adolescents. Psychology in the Schools, 62(8), 2373–2389. [Google Scholar] [CrossRef]
  55. Terlektsi, E., Kreppner, J., Mahon, M., Worsfold, S., & Kennedy, C. R. (2020). Peer relationship experiences of deaf and hard-of-hearing adolescents. Journal of Deaf Studies and Deaf Education, 25(2), 153–166. [Google Scholar] [CrossRef] [PubMed]
  56. Wang, M., Te, L., Degol, J., Amemiya, J., Parr, A., & Guo, J. (2020). Classroom climate and children’s academic and psychological well-being: A systematic review and meta-analysis. Developmental Review, 57, 100912. [Google Scholar] [CrossRef]
  57. Wang, Y., Wang, H., Wang, S., Wind, S. A., & Gill, C. (2024). A systematic review and meta-analysis of self-determination-theory-based interventions in the education context. Learning and Motivation, 87, 102015. [Google Scholar] [CrossRef]
  58. Watkins, M. W. (2018). Exploratory factor analysis: A guide to best practice. Journal of Black Psychology, 44(3), 219–246. [Google Scholar] [CrossRef]
  59. Williams, S., Schneider, M., Wornell, C., & Langhinrichsen-Rohling, J. (2018). Students’ perceptions of school safety: It is not just about being bullied. Journal of School Nursing, 34(4), 319–330. [Google Scholar] [CrossRef]
  60. Wisniewski, B., Zierer, K., & Hattie, J. (2020). The Power of feedback revisited: A meta-analysis of educational feedback research. Frontiers in Psychology, 10, 3087. [Google Scholar] [CrossRef]
  61. Zhang, J., Yang, Y., Ge, J., Liang, X., & An, Z. (2023). Stimulating creativity in the classroom: Examining the impact of sense of place on students’ creativity and the mediating effect of classmate relationships. BMC Psychology, 11(1), 432. [Google Scholar] [CrossRef] [PubMed]
  62. Zheng, F. (2022). Fostering students’ well-being: The mediating role of teacher interpersonal behavior and student-teacher relationships. Frontiers in Psychology, 12, 796728. [Google Scholar] [CrossRef] [PubMed]
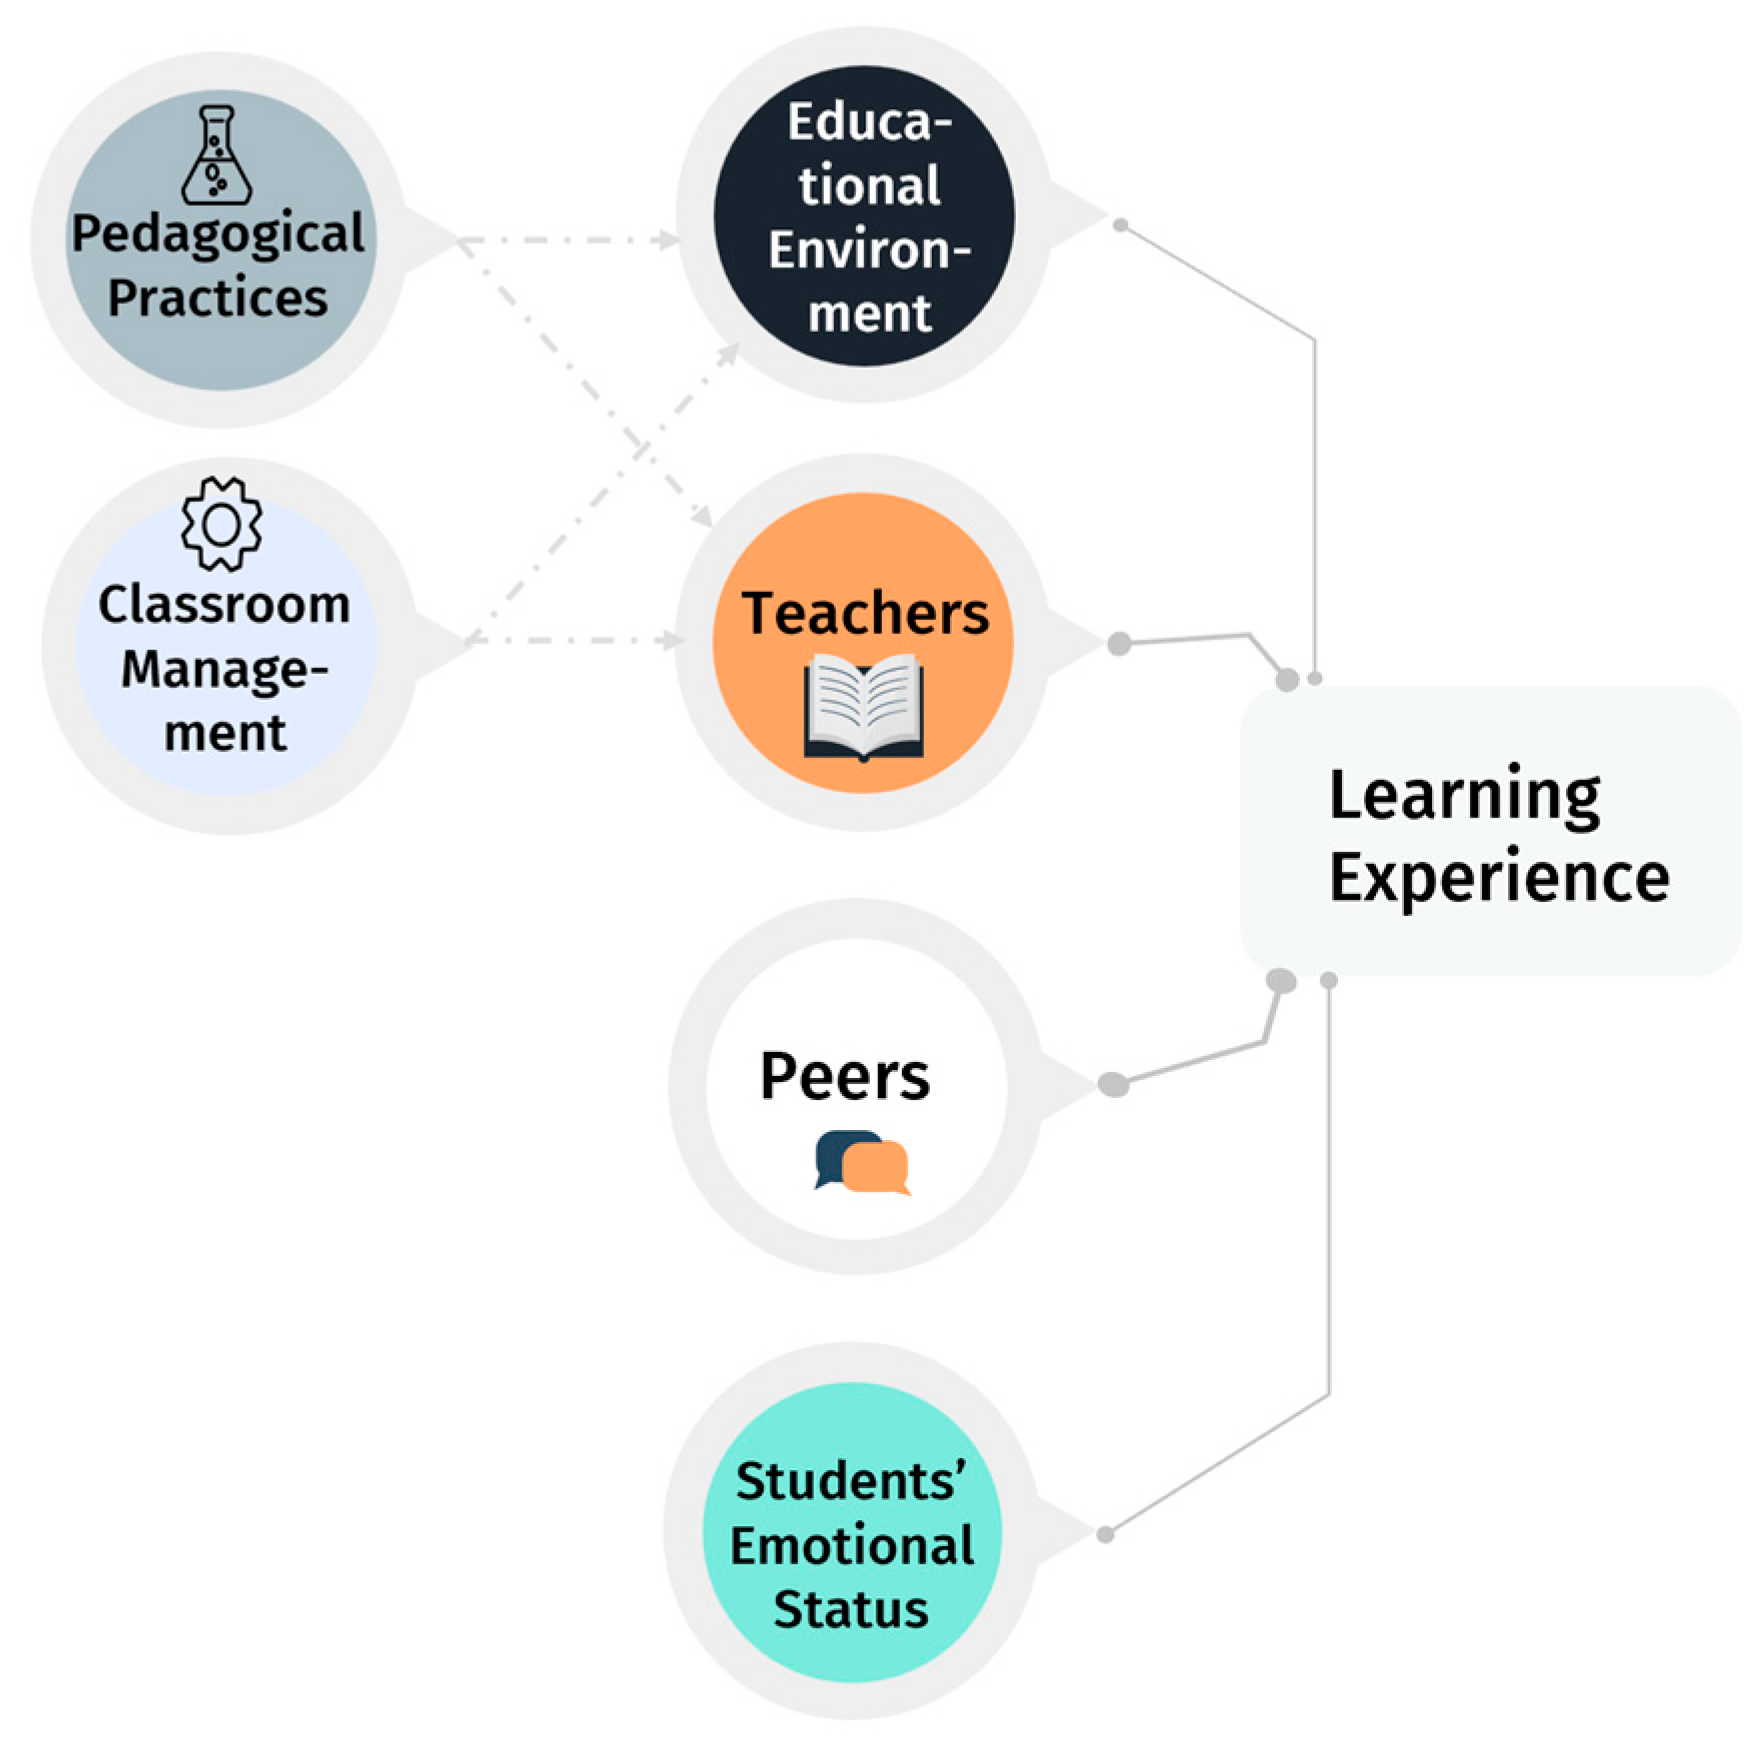
Figure 1. Conceptual model of drivers influencing students’ learning experience.
Education 15 01403 g001
Figure 2. Violin plots concerning the feelings of on-time and over-age students for the dimensions of the schooling experience. (Note: The shape of the violin shows the data’s kernel density, and the black dot the median.).
Education 15 01403 g002
Figure 3. Violin plots of the variation in students’ feelings according to the level attended for the dimensions of the schooling experience. (Note: The shape of the violin shows the data’s kernel density, and the orange dot the median).
Education 15 01403 g003
Figure 4. Violin plots of the variation in students’ feelings according to gender for the dimensions of the schooling experience. (Note: The shape of the violin shows the data’s kernel density, and the red dot the median).
Education 15 01403 g004
Table 1. Descriptive statistics and demographic characteristics of the student sample (N = 1012).
Minimum–MaximumMeanStandard
Deviation
SkewnessKurtosis
Age9–2014.182.2490.056−0.756
Age-for-grade-status 1 0–40.120.4024.18821.220
Frequencies No%
Direct school path 92090.9%
GenderNon-disclosing313.1%
Female48748.1%
Male49448.8%
School year5th grade818.0%
6th grade12712.5%
7th grade13613.4%
8th grade14314.1%
9th grade18117.9%
10th grade14714.5%
11th grade13012.8%
12th grade676.6%
1 Number of years over the expected age.
Table 3. T-Test results concerning the grouping variable age-for-grade status across dimensions of the schooling experience.
MeanStandard DeviationTp
On-TimeOver-AgeOn-TimeOver-Age
I. Feelings about the learning experience3.412.920.8480.9465.184 a<0.001
II. Feelings about the assessment experience3.533.060.8720.8934.976 a<0.001
III. Feelings about the teacher support3.633.140.9331.0364.750 a<0.001
IV. Feelings about the school climate3.382.840.9560.9775.174 a<0.001
V. Feelings about relationship with peers3.943.470.8631.0344.186 b<0.001
VI. Feelings about emotional discomfort3.012.931.0341.0710.719 a0.236
a Levene’s test p-value > 0.05; equal variances assumed. b Levene’s test p-value ≤ 0.05; equal variances not assumed. N (on-time) = 920; N (over-age) = 92.
Table 2. Descriptive and reliability statistics for the items and factors of the ESSES scale.
ItemMeanStandard
Deviation
Alfa Cronbach If Item ExcludedMeanStandard
Deviation
Range of
Inter-Item Correlation
Cronbach’s Alpha
Factor I: Feelings about the learning experience
It13.601.0270.7893.370.8690.442–0.6360.823
It23.221.0250.796
It33.301.1750.794
It43.341.0640.728
Factor 2: Feelings about the assessment experience
It53.831.0200.8503.490.8840.448–0.6440.859
It63.361.1750.822
It73.511.0950.813
It83.421.1030.839
It93.321.1320.822
Factor 3: Feelings about teacher support
It103.381.1310.8433.580.9550.580–0.7150.879
It113.511.0830.822
It123.801.0750.842
It133.631.1590.871
Factor 4: Feelings about the school climate
It143.181.2860.8933.330.9700.502–0.6970.897
It153.461.2080.872
It163.061.1810.871
It173.251.1310.870
It183.621.1730.875
It193.441.1780.891
Factor 5: V. Feelings about the relationship with peers
It204.251.0350.7733.890.8890.350–0.7090.823
It214.031.0780.730
It223.821.0850.742
It233.481.1980.855
Factor 6: Feelings about emotional discomfort
It242.941.3960.3863.001.0370.239–0.4870.632
It252.431.3600.655
It263.631.3440.531
Table 4. ANOVA’s results regarding the grouping variable scholarship level across dimensions of the schooling experience.
ANOVAPost Hoc (Mean Difference)
MeanFpPartial Eta SquareObserved Power3rd CycleSL
I. Feelings about the learning experience (b)
2nd Cycle 3.8241.336<0.0010.0761.0000.5116 *0.6511 *
3rd Cycle 3.31 0.1395 ns.
SL3.17
II. Feelings about assessment (b)
2nd Cycle 3.9848.509<0.0010.0881.0000.5463 *0.7185 *
3rd Cycle 3.44 0.1723 ***
SL
III. Feelings about teacher support (b)
2nd Cycle 3.9825.480<0.0010.0481.0000.5502 *0.4367 *
3rd Cycle 3.43 −0.1135 ns.
SL
IV. School climate (a)
2nd Cycle 3.6415.825<0.0010.0301.0000.4486 *0.2914 **
3rd Cycle 3.19 −0.1573 ns.
SL3.35
V. Relationship with peers (b)
2nd Cycle 4.075.8270.0030.0110.8720.2516 *0.1896 ***
3rd Cycle 3.82 −0.0620 ns.
SL3.88
VI. Emotional discomfort (b)
2nd Cycle 3.051.4690.2310.0030.3150.1175 ns.0.0089 ns.
3rd Cycle 2.94 −0.1086 ns.
SL3.05
N (2nd cycle) = 208; N (3rd cycle) = 460; N (SL) = 344. * p < 0.001; ** p < 0.01; *** p < 0.05; ns.—nonsignificant. (a) Levene’s test p-value > 0.05; equal variances assumed; post hoc multiple comparison analysis used the Scheffe test. (b) Levene’s test p-value ≤ 0.05; equal variances not assumed; post hoc analysis used the Games-Howell test.
Table 5. ANOVA’s results regarding the grouping variable gender across dimensions of the schooling experience.
ANOVAPost Hoc (Mean Difference)
MeanFpPartial Eta SquareObserved Power3rd CycleSL
I. Feelings about the learning experience (b)
ND2.4618.147<0.0010.0351.000−0.9500 *−0.9199 *
Female3.41 0.0301 ns.
Male3.38
II. Feelings about assessment (b)
ND2.6117.514<0.0010.0341.000−0.8732 *−0.9514 *
Female3.48 −0.0782 ns.
Male3.56
III. Feelings about teacher support (b)
ND2.4921.847<0.0010.0421.000−1.1364 *−1.1108 *
Female3.63 0.0256 ns.
Male3.60
IV. School climate (a)
ND2.3019.392<0.0010.0371.000−1.0979 *−1.0464 *
Female3.39 0.0515 ns.
Male3.34
V. Relationship with peers (b)
ND3.2110.995<0.0010.0210.991−0.6604 **−0.7519 **
Female3.87 −0.0914 ns.
Male3.96
VI. Emotional discomfort (b)
ND2.7035.116<0.0010.0651.000−0.5735 ns.−0.0474 ns.
Female3.27 0.5261 *
Male2.74
N (ND) = 31; N (female) = 487; N (male) = 494. * p < 0.001; ** p < 0.05; ns.—nonsignificant. (a) Levene’s test p-value > 0.05; equal variances assumed; post hoc multiple comparison analysis used the Scheffe test. (b) Levene’s test p-value ≤ 0.05; equal variances not assumed; post hoc analysis used the Games-Howell test.
Table 6. Results of linear regression regarding students’ feelings about the learning experience and how well they feel during classes.
ANOVACoefficientCollinearityPartial
Correlation
Effect *
rr2FSig.ΒTSig.ToleranceVIF
Dependent variable: Feeling well during classes
0.7370.543149.155<0.001
Constant0.9145.267<0.001
Learning experience (LE) 0.33610.311<0.0010.4292.3300.3104.84%
Assessment experience (AE) 0.1403.947<0.0010.3622.7620.1240.71%
Teacher support (TS)0.1143.331<0.0010.3922.5510.1050.50%
School climate (SC)0.1765.329<0.0010.4192.3840.1661.30%
Relationship with peers (RwP)0.0682.4340.0150.5801.6970.0770.27%
Emotional discomfort (ED)−0.063−2.9470.0030.9871.014−0.0930.34%
Age-for-grade status AGS)−0.058−2.6620.0080.9551.047−0.0840.33%
Grade (G)−0.066−2.8920.0040.8651.156−0.0910.38%
Independent variables interaction 45.23%
Dependent variable: Feelings about the learning experience
0.7550.571222.702<0.001
Constant0.9126.518<0.001
Assessment experience (AE) 0.36411.257<0.0010.4082.4530.3355.429%
Teacher support (TS) 0.1785.464<0.0010.4042.4780.1701.28%
School climate (SC) 0.2367.630<0.0010.4462.2440.2342.50%
Relationship with peers (RwP) 0.0501.8470.0650.5931.6830.0580.14%
Emotional discomfort (ED) 0.0502.3950.0170.9921.0080.0750.25%
Grade (G) −0.108−4.920<0.0010.9011.110−0.1031.06%
Independent variables interaction 46.44%
* Calculated from the part correlation, a measure of the unique contribution of one predictor to the dependent variable.
Disclaimer/Publisher’s Note: The statements, opinions and data contained in all publications are solely those of the individual author(s) and contributor(s) and not of MDPI and/or the editor(s). MDPI and/or the editor(s) disclaim responsibility for any injury to people or property resulting from any ideas, methods, instructions or products referred to in the content.