1. Introduction
Mathematical proportional reasoning understanding is considered critical in students’ ability to excel in secondary science, technology, and engineering, as well as in upper-level mathematics such as algebra, geometry, and calculus (
Lobato et al., 2010). The middle grades, in particular, have been identified as the most adequate academic stage for the development of proportional reasoning skills in students, as it is the grade band within which students are generally introduced to the concepts of numeric and geometric proportionality in the formal mathematics classroom (
Ben-Chaim et al., 2012). Furthermore, proportionality is considered one of the most difficult mathematical concepts for middle-grade students to fully grasp, procedurally and conceptually (
Lobato et al., 2010). The Framework for K-12 Science Education: Practices, Crosscutting Concepts, and Core Ideas identifies proportional reasoning as a skill that extends beyond mathematics and is necessary for the development of STEM practices such as scientific modeling, engineering design, and digital modeling (
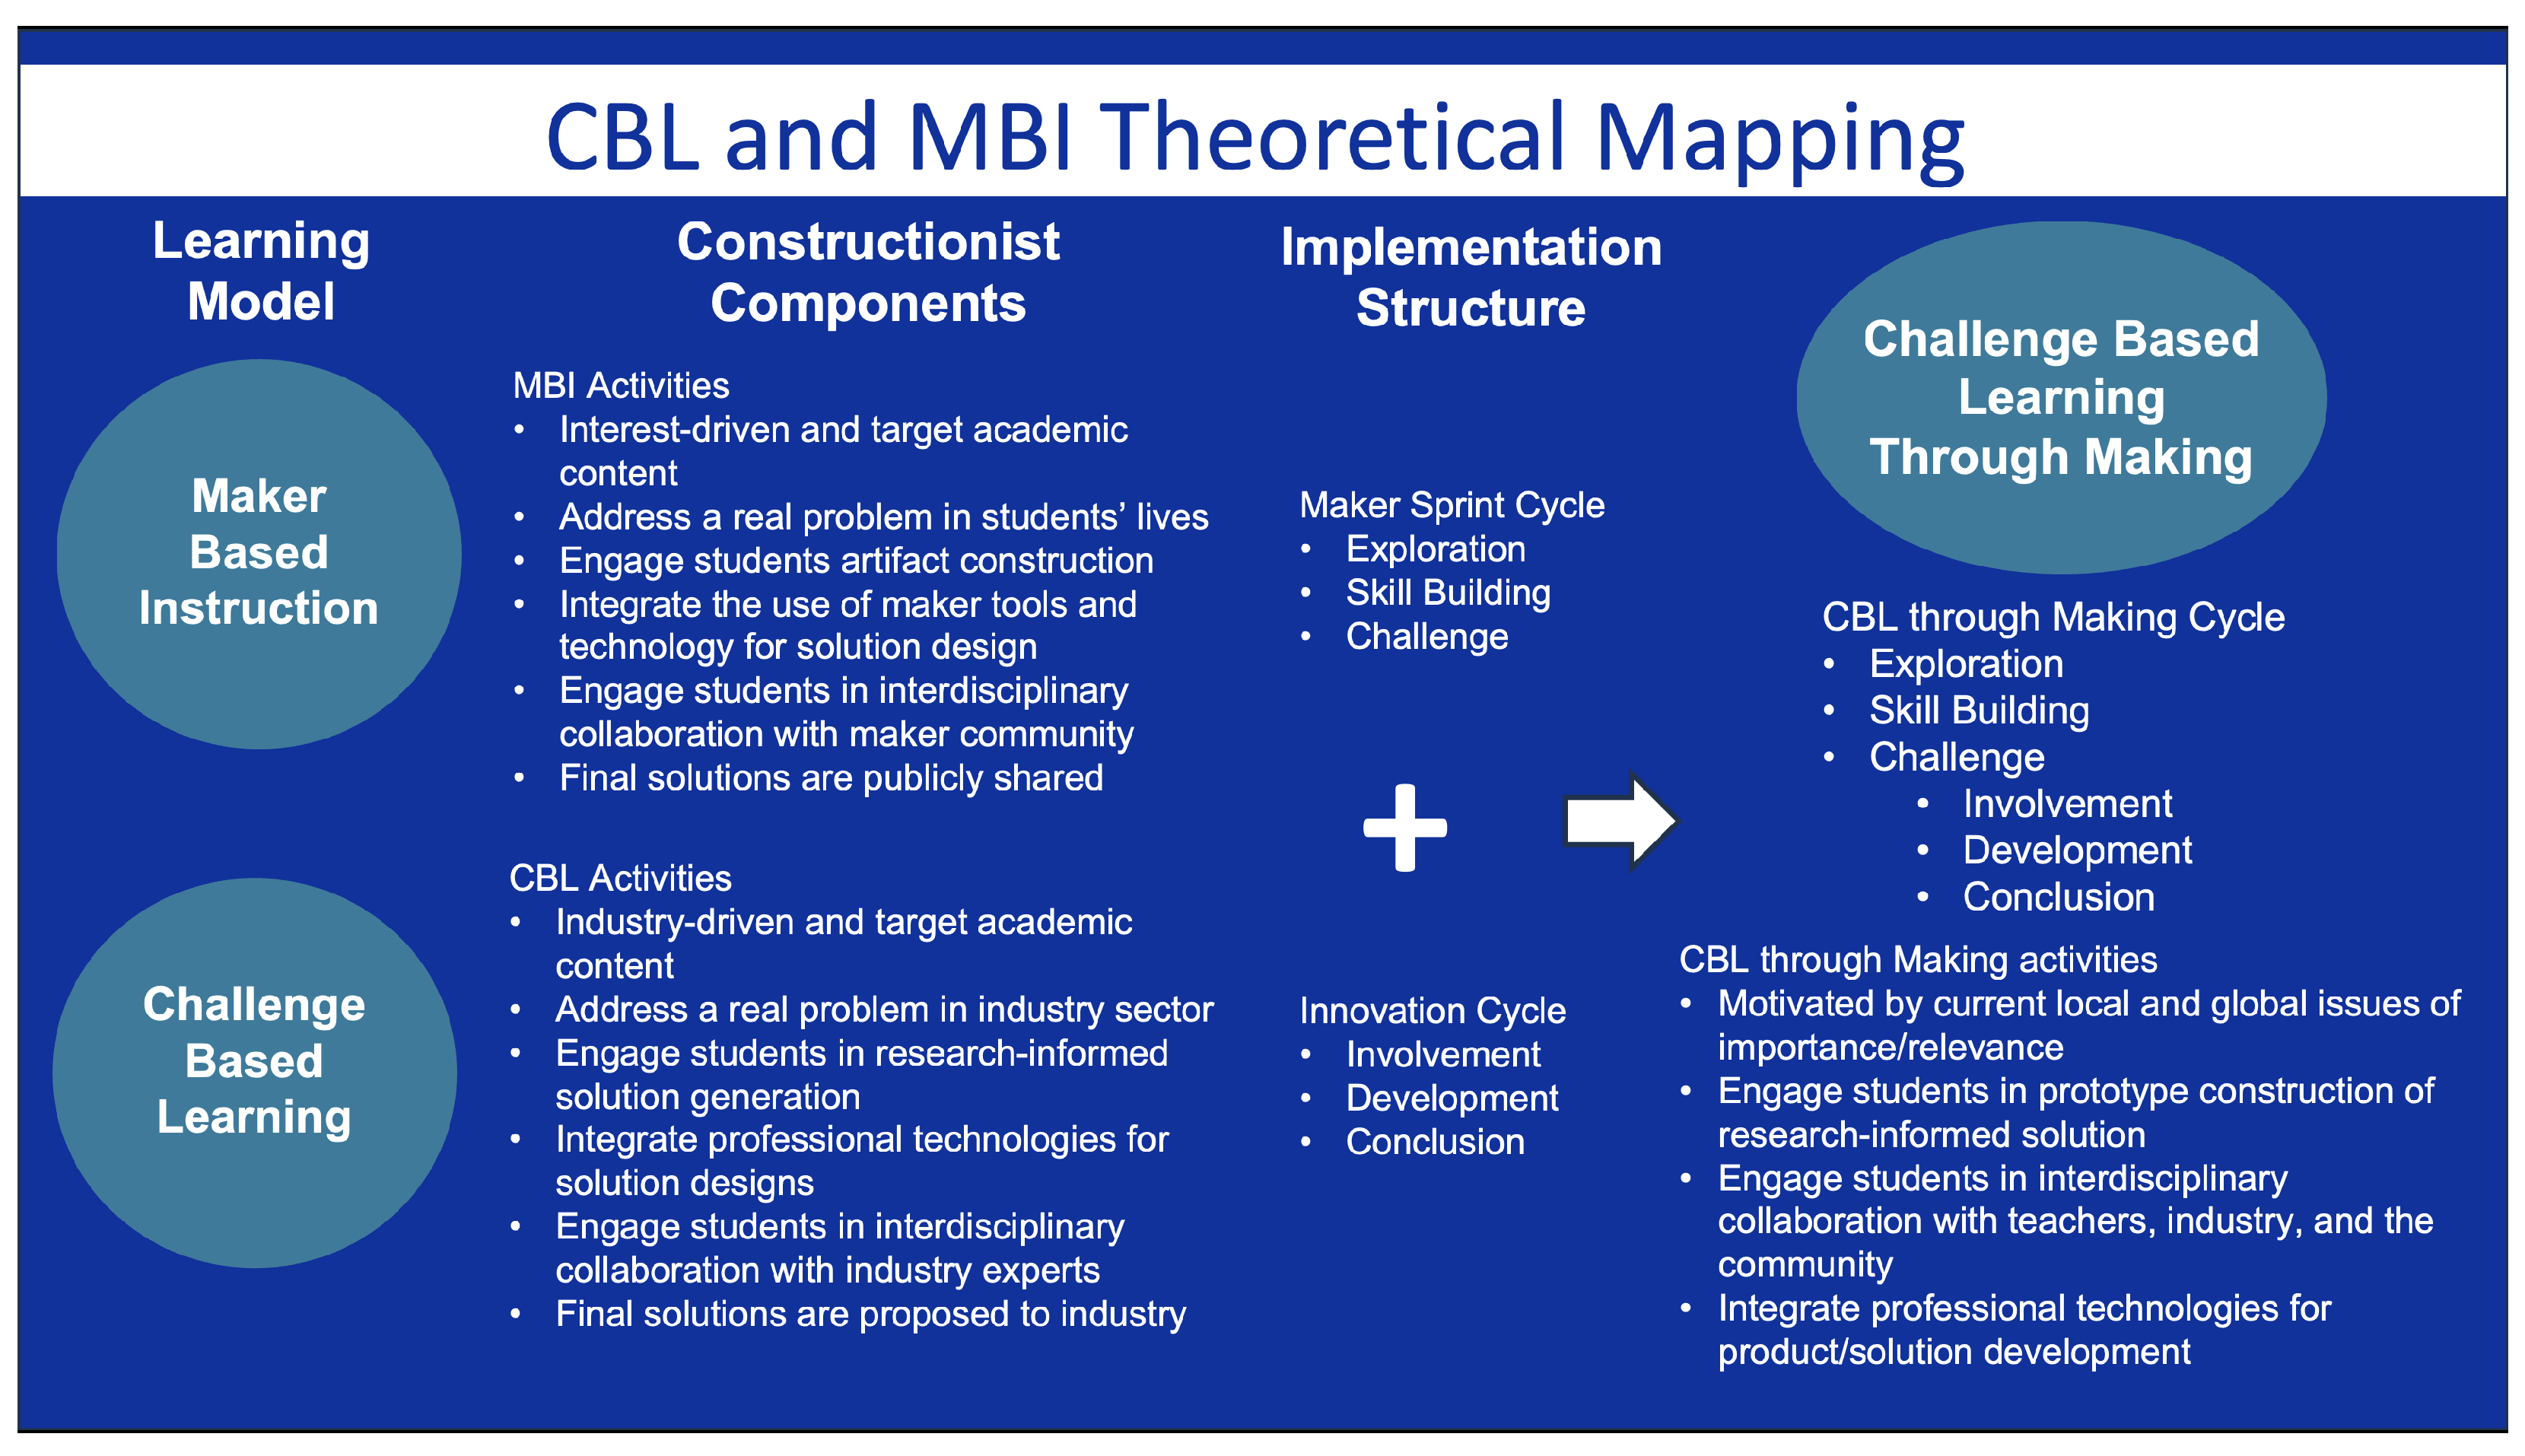
National Research Council, 2012). The identification of proportionality as a STEM crosscutting concept called for the implementation of instructional approaches in K-12 STEM education that can foster students’ understanding of scale, proportion, quantity, and modeling, beyond the mathematics classroom. One promising instructional approach is Challenge-Based Learning through Making.
In the present work, we conducted a qualitative exploratory study involving 20 seventh-grade students enrolled in an exploring engineering class, implementing our Challenge-Based Learning through Making instructional model, at a public all-girls school in Southwest United States. Students participated in a nine-week STEM design challenge, where knowledge of grade-level proportional reasoning standards was an integral component. The challenge itself and its solutions were developed with the mentorship of experts, facilitated by the teacher, in collaboration with other students, and within the context of a school makerspace. Data in the form of written reflections, physical and digital artifacts, and oral presentations were collected and analyzed to answer the following research question: How do middle school students represent their understanding of proportional reasoning through designing and making in a Challenge-Based Learning through Making project?
3. Materials and Methods
3.1. Context and Participants
To investigate our research question, we conducted a qualitative exploratory study (
Creswell, 2014) situated within the context of a seventh-grade engineering class at a public all-girls school in Southwest United States. The study participants were the 20 students enrolled in the class, their STEM teacher, a civil engineer, and a real estate expert. The Challenge-Based Learning through Making project for the study was collectively developed by all study participants and took place at their school makerspace, the designated classroom for the engineering class. Over the span of nine weeks, students engaged in the challenge activities, meeting twice a week for two hours each session. The experts worked with the students at least once a week throughout the duration of the challenge.
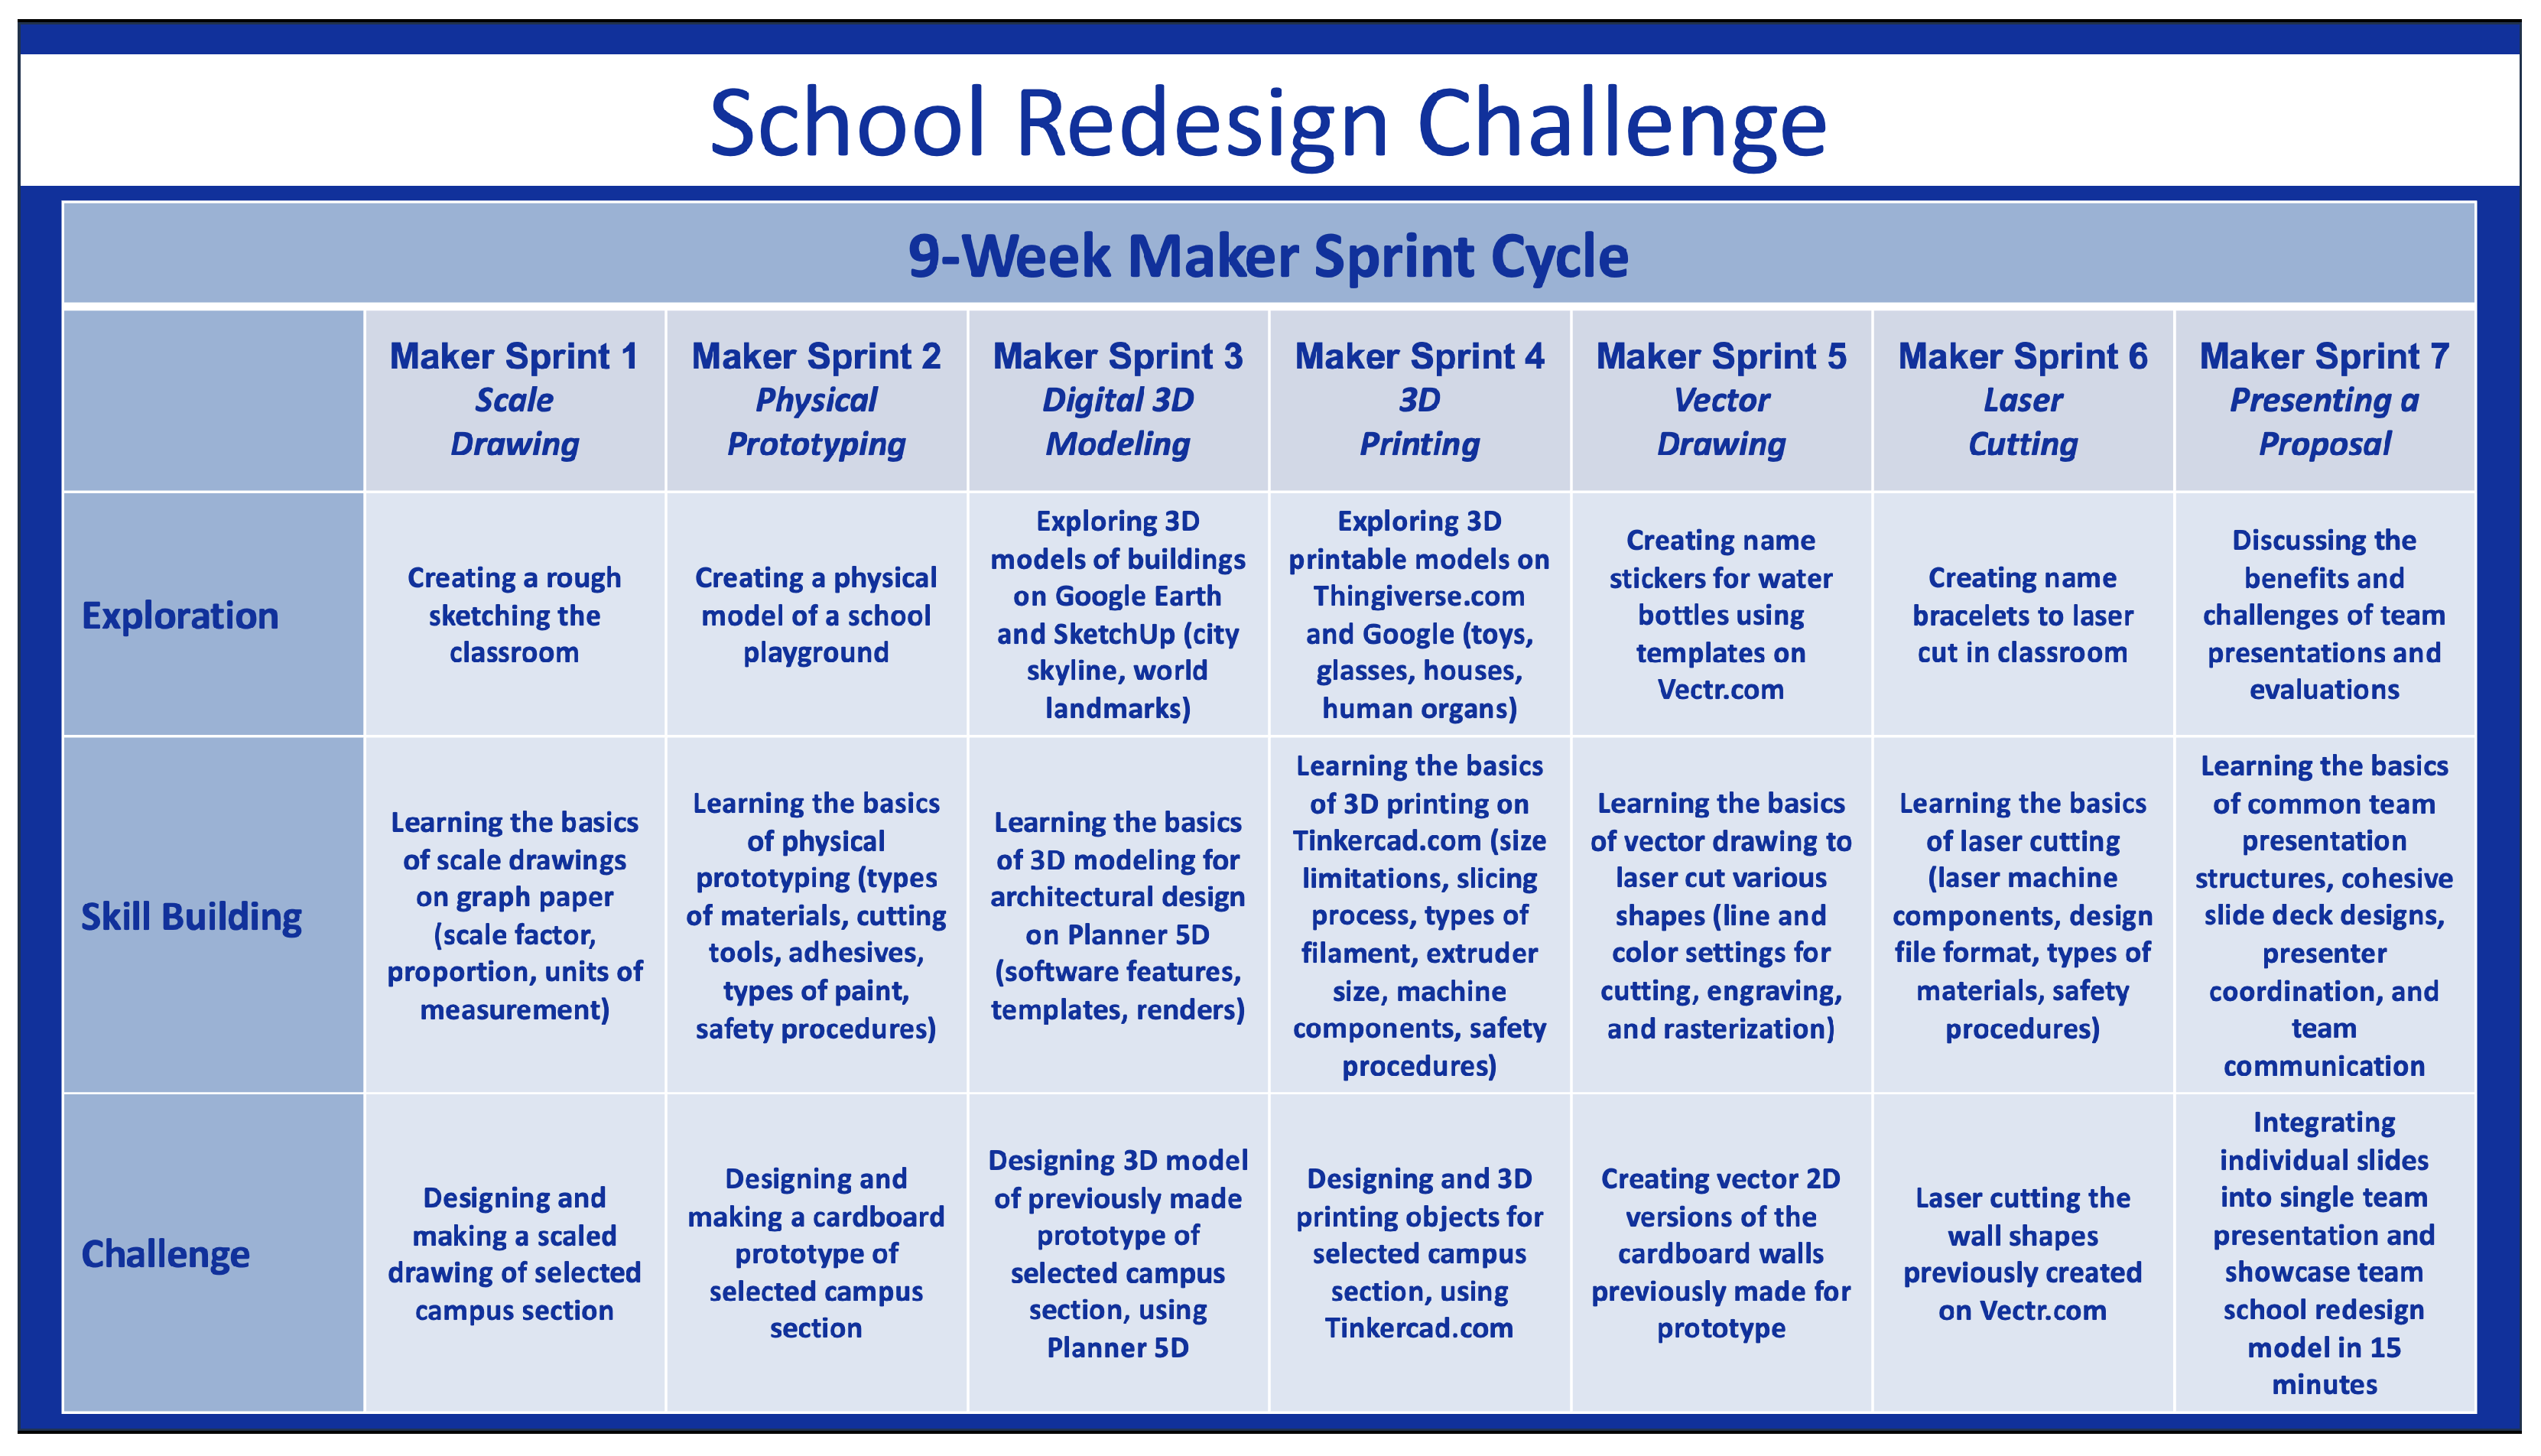
The goal of the challenge was to propose a redesigned version of their current campus building to meet the needs of their growing student population and create a digital and physical model of their designs using the tools and materials in the school makerspace (
Figure 2). The building was previously a primary school, with classrooms and facilities designed for a much younger student population. The engineering class believed the classrooms, cafeteria, and bathrooms should be resigned to meet the needs of students who are physically growing into young adults, thinking specifically about themselves as they progress from grade seven to grade twelve. To accomplish this task, students created three different groups to divide the campus into three sections: a redesigned first floor, an extended second floor, and the proposal of a third floor. All groups had the general constraint that the building could only be expanded vertically and had to maintain fixed structures such as the elevator, stairwells, and plumbing system.
The process students were asked to follow and document in their digital portfolios to generate their solutions was as follows:
Understand the dimensions of the current building and the sections that could be easily redesigned (e.g., walls between classrooms, patio areas, cafeteria, etc.);
Create simple sketches of their initial redesign ideas;
Create scaled drawings of their selected sections;
Prototype the first physical model of their designs;
Create a digital 3D model using a professional real estate design software;
Utilize a digital vector program to design and laser cut the walls for their final physical model;
3D print the objects they wanted to include in their physical model;
Fully integrate their physical and digital models to present as a team to their school principals and district administrators.
During the Skill Building stages of the project, students learned how to create accurate scale drawings of their designs on graph paper and how to use those drawings to create a digital 3D version of those designs on Planner 5D (the professional design software the experts taught them how to use). Students were only taught the basics of the software and were consistently encouraged to try other features of the design platform and share their utility with each other. Similarly, students were first introduced to the basics of 3D printing by exploring items on Thingiverse.com to learn about the various things that could be 3D printed, using the materials and technology available in their school makerspace. After exploring the objects relevant to the challenge on Thingiverse, students were taught the basics of 3D modeling for 3D printing on TinkerCAD.com. During this stage, students received guidance from the experts on scaling the dimensions of their objects to match the scale of their team’s design, as well as the process to slice, export, and send their objects to the 3D printers.
During each stage of the process, students consistently received feedback from the experts, teacher, and their peers through gallery walks and progress update discussions held at the end of each class session. Students were also encouraged to seek assistance from their peers in other teams any time they found it necessary. Although expert feedback and mentorship were essential components of the challenge, the solutions students designed were entirely constructed by the students themselves without the assistance of the experts. This dynamic placed the experts and the teacher as mentors throughout the duration of the challenge.
3.2. Data Collection and Analysis
The data collected from the challenge included the students’ individual digital portfolios and team presentation slides and video recording. Each digital portfolio contained sections displaying the student’s initial sketches on plain paper, scale drawings on graph paper, cardboard prototypes, digital 3D models, laser cutting vector files, and photos of the finalized painted models. The artifacts in each section included written descriptions and reflections on the project’s progress at each stage. For the team presentation, students consolidated their digital portfolio sections to fit on one slide to allow the audience to see how each team member contributed to the overall team design. Each student presented their own slides and gave the audience a virtual tour of their 3D models using the virtual reality feature on Planner 5D. The video recording included all team presentations.
All collected data was analyzed on Atlas.ti, a qualitative analysis software that allowed us to code the video, image, and written data in one project file. We took a directed content analysis approach to inductively analyze the data (
Hsieh & Shannon, 2005), where a set of codes was derived from an established coding scheme for the qualitative analysis of proportional reasoning representation in physical and digital artifacts, reflective writings, and verbal descriptions (
Torralba & Rouse, 2024). To avoid double coding, individual images from the digital portfolios found in the video recording were omitted, allowing us to focus on the oral presentation itself and the connections made by the students when referring to the juxtaposed images of their work.
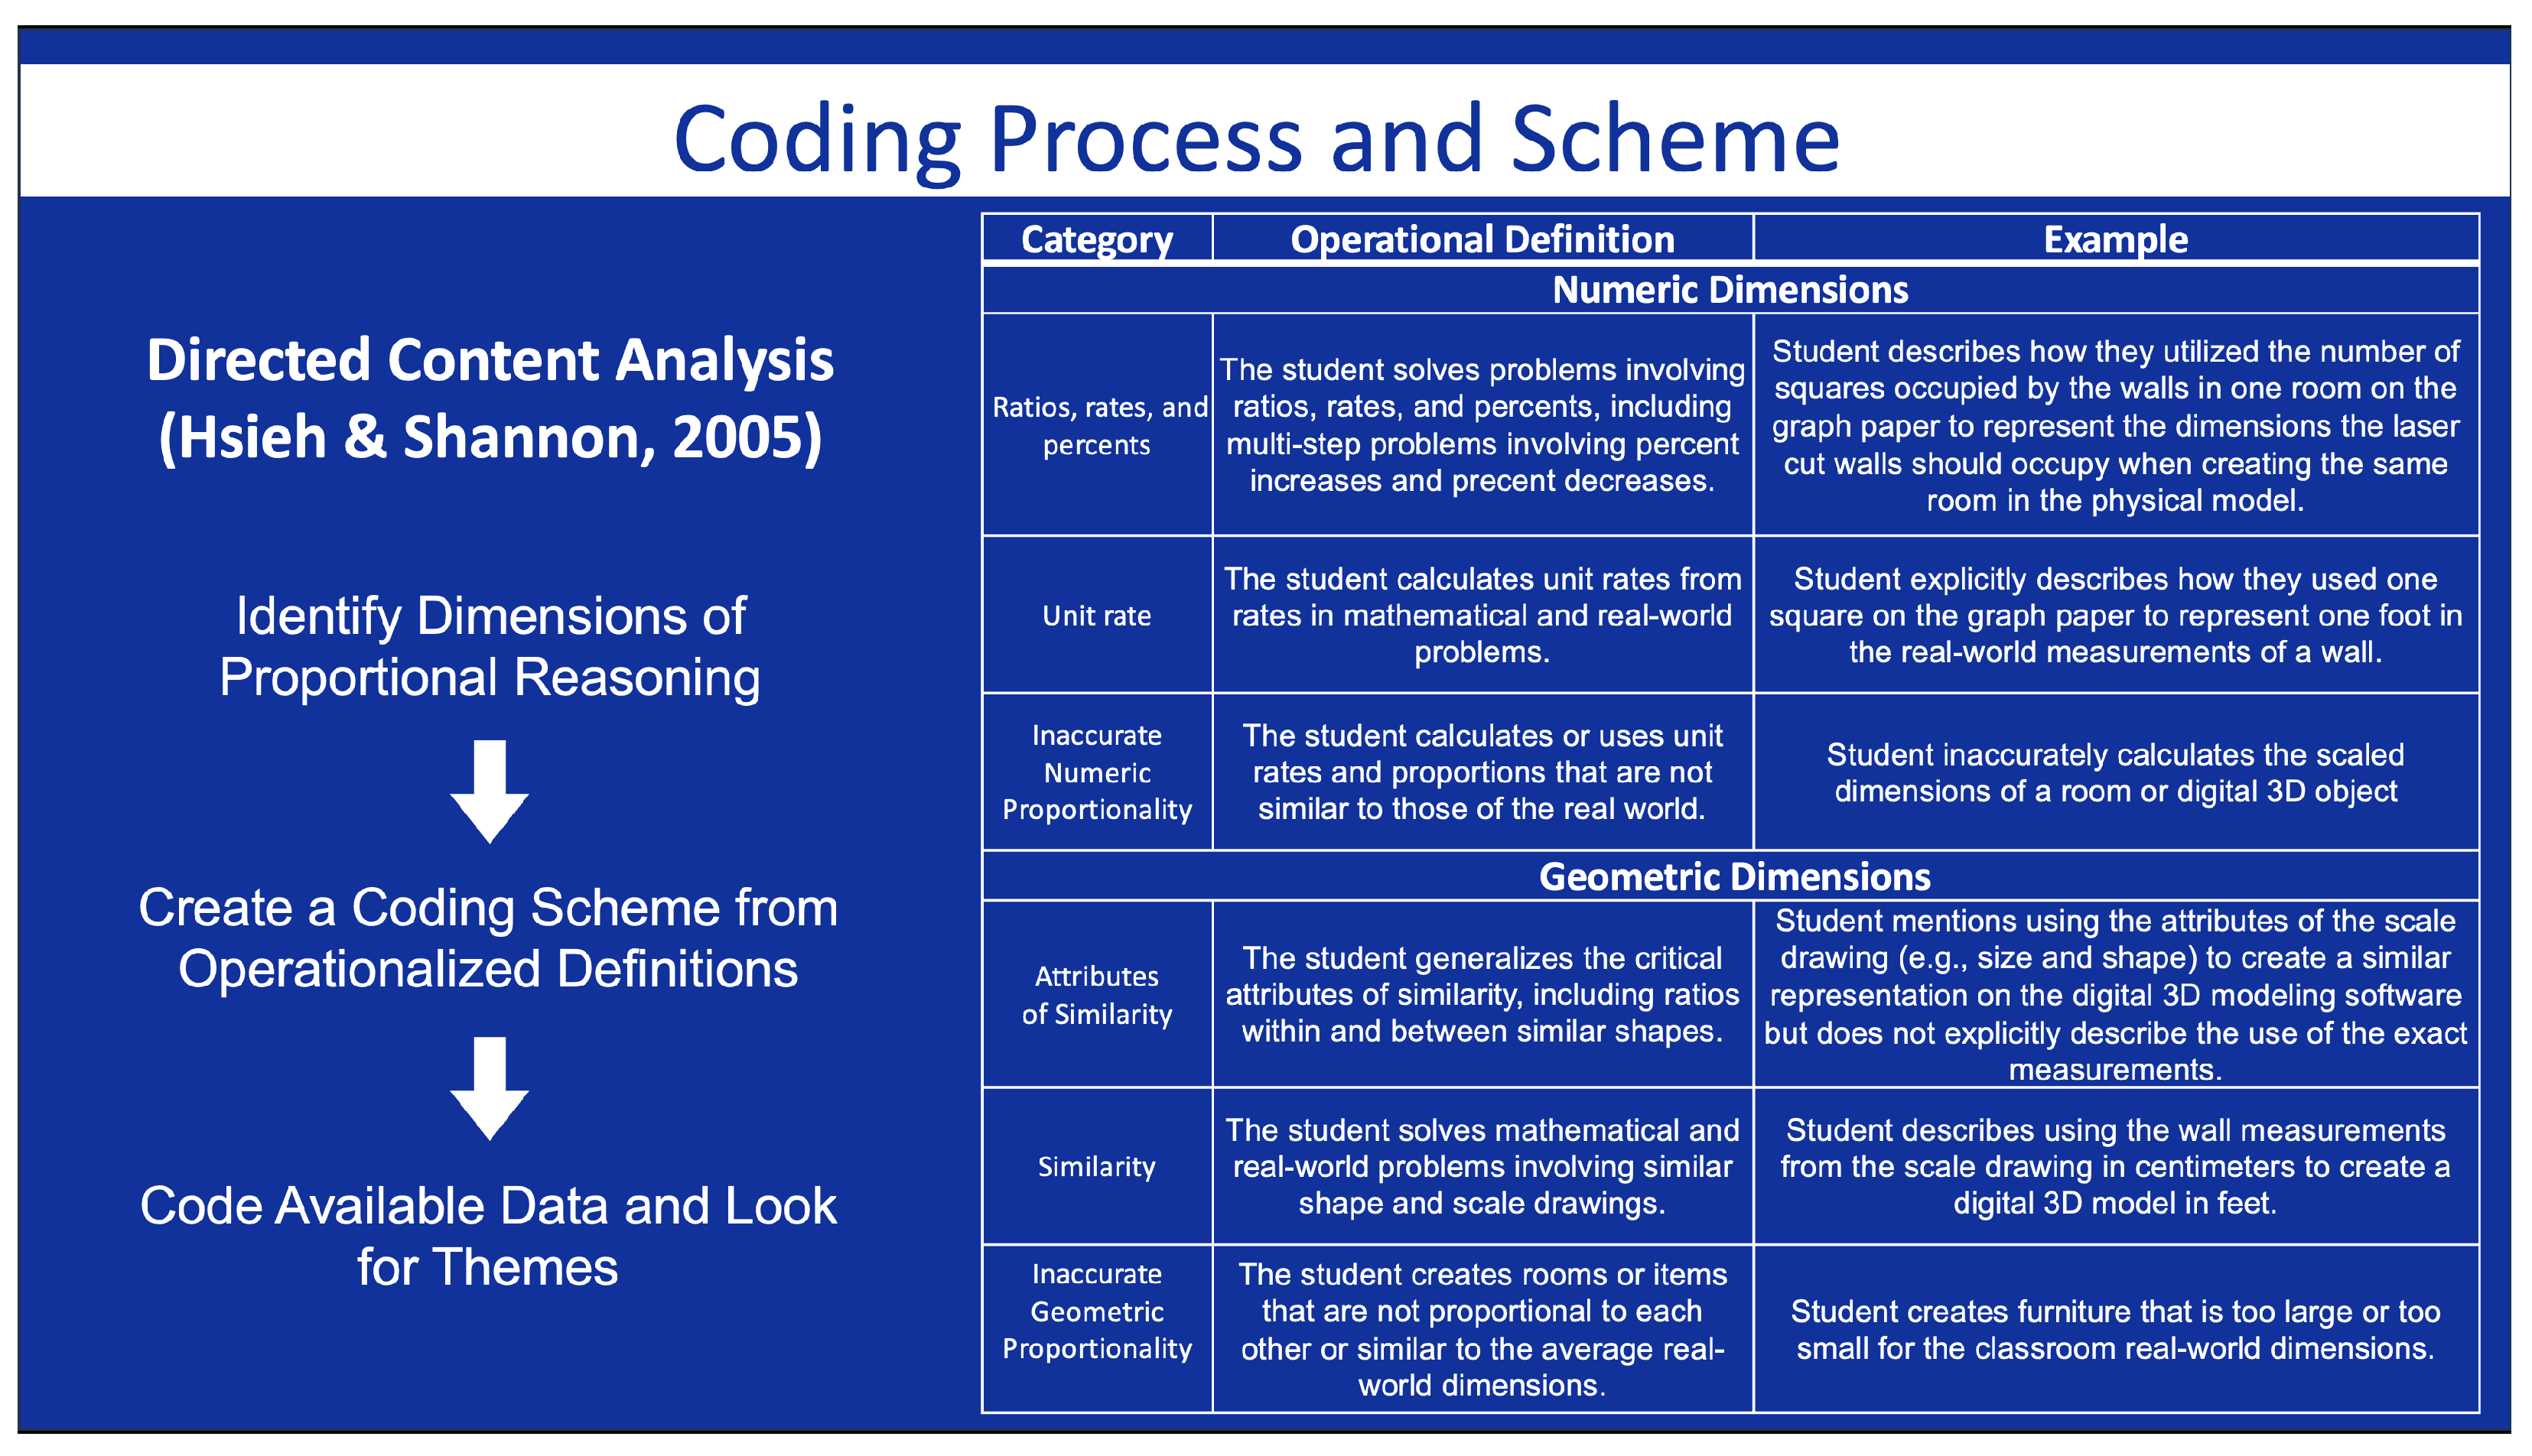
The coding scheme was composed of two dimensions of proportionality derived from the Texas Essential Knowledge and Skills state standards for seventh grade mathematics (
Figure 3): geometric proportionality and numeric proportionality. The dimension of geometric proportionality included the codes and attributes of similarity representation. Similarity representation was operationalized as instances where the student solves mathematical and real-world problems involving similar shapes and scale drawings. For example, when students described using the wall measurements from the scale drawing in centimeters to create a digital 3D model in feet. The attributes of similarity representation were operationalized as instances where the student generalizes the critical attributes of similarity to describe proportional relationships, including ratios within and between similar shapes; for example, when students mention using the attributes of the scale drawing (e.g., size and shape) to create a similar representation on the digital 3D modeling software, but do not explicitly describe the use of the exact measurements.
The dimension of numeric proportionality included unit rates representation and ratios, rates, and percents representation. Unit rates representation was operationalized as instances where the student calculates unit rates from rates in mathematical and real-world problems. For example, when students explicitly describe how they used one square on the graph paper to represent one foot in the real-world measurements of a wall. Ratios, rates, and percents representation was operationalized as instances where the student solves problems involving ratios, rates, and percents, including but not limited to multi-step problems involving percent increase and percent decrease, and financial literacy problems. For example, when students describe how they utilized the number of squares occupied by the walls in one room on the graph paper to represent the dimensions the laser cut walls should occupy when creating the same room in the physical model.
Once all available data was coded on Atlas.ti by the first author, a portion of the data set was sent to an external researcher to be analyzed and coded a second time for trustworthiness. Results from the two analyses were compared and discussed until any and all disagreements were settled. Instances in which a data sample was coded by one researcher but not by the other were discussed until 100% agreement was reached. Codes for which mutual agreement was not reached were excluded for the final results (
Shenton, 2004).
4. Results
In our investigation of how middle school students represented their understanding of proportional reasoning through making in a Challenge-Based Learning project, our analysis showed that all students accurately represented their understanding of proportional reasoning in one modality or another. Only one instance of apparent inaccurate geometric proportionality representations was identified in the data, out of the 75 instances coded. Of the two dimensions of proportionality analyzed, geometric proportionality was the most represented dimension in all three modalities (written, verbal, and artifact), with 47 instances identified, compared to 19 instances of the numeric dimension. Within the geometric dimension, coded instances of similarity representations and attributes of similarity representations were fairly similar, with 25 and 22 instances, respectively. Within the numeric dimension, ratios, rates, and percents representation instances were more prevalent than unit rates representations, with 13 and 6 instances, respectively. In addition to these findings, eight instances of geometric proportionality estimation were identified in the oral presentations. Each of these instances were explicitly stated by different students, accounting for almost half of the participants engaging in geometric proportionality estimation. Though proportional estimation was not part of our coding scheme, their occurrence was high enough to be included and discussed as incidental findings.
Collectively, our analysis showed that of all the identified instances of proportional reasoning representations in the data, 75% were of the geometric dimension and 25% of the numeric dimension. Of the geometric dimension instances, 33% were of similarity representation, 30% of attributes of similarity representations, 11% of geometric proportionality estimation, and 1% of inaccurate geometric proportionality representations. Of the numeric dimension, 17% of the instances were of ratios, rates, and percents representations and 8% of unit rates representations.
Although all students represented their understanding of proportionality in one modality or another, most student representations were of the geometric dimension of proportionality. This may be due to the fact that students had more opportunities to represent their understanding of such dimension through the creation of several artifacts, with less opportunities to engage in the numeric dimension through explicit calculations or explanations that could be captured qualitatively.
Figure 4 shows the only instance in which a student, Ana, wrote their calculations on the artifacts themselves, provided a written description of the calculations in the captions, and verbally shared their calculations during their presentation. Interestingly, this student’s design was for a section of the building that did not exist but could be built within the limitations given at the beginning of the project. At the start of the project, Ana utilized a measuring tool to physically obtain the accurate measurements of the space in meters. For the remainder of the project, they referred to those measurements using the measuring feature on Google Maps. During her presentation, Ana shared that she “converted the initial measurements to be able to do the design on Planner 5D. Then, I modeled it after how I wanted it to look like.” Though units of measurement conversion would generally fall under a mathematical category different than proportionality, Ana converted her measurements from meters to feet because her initial measurements from the field and Google Maps were in meters and her design on Planner 5D was set to feet as the unit of measurement. Her measurement conversion was focused on creating a proportional digital representation of her scaled drawing, rather than on simply changing the units of measurement from meters to feet for the purposes of understanding the dimensions.
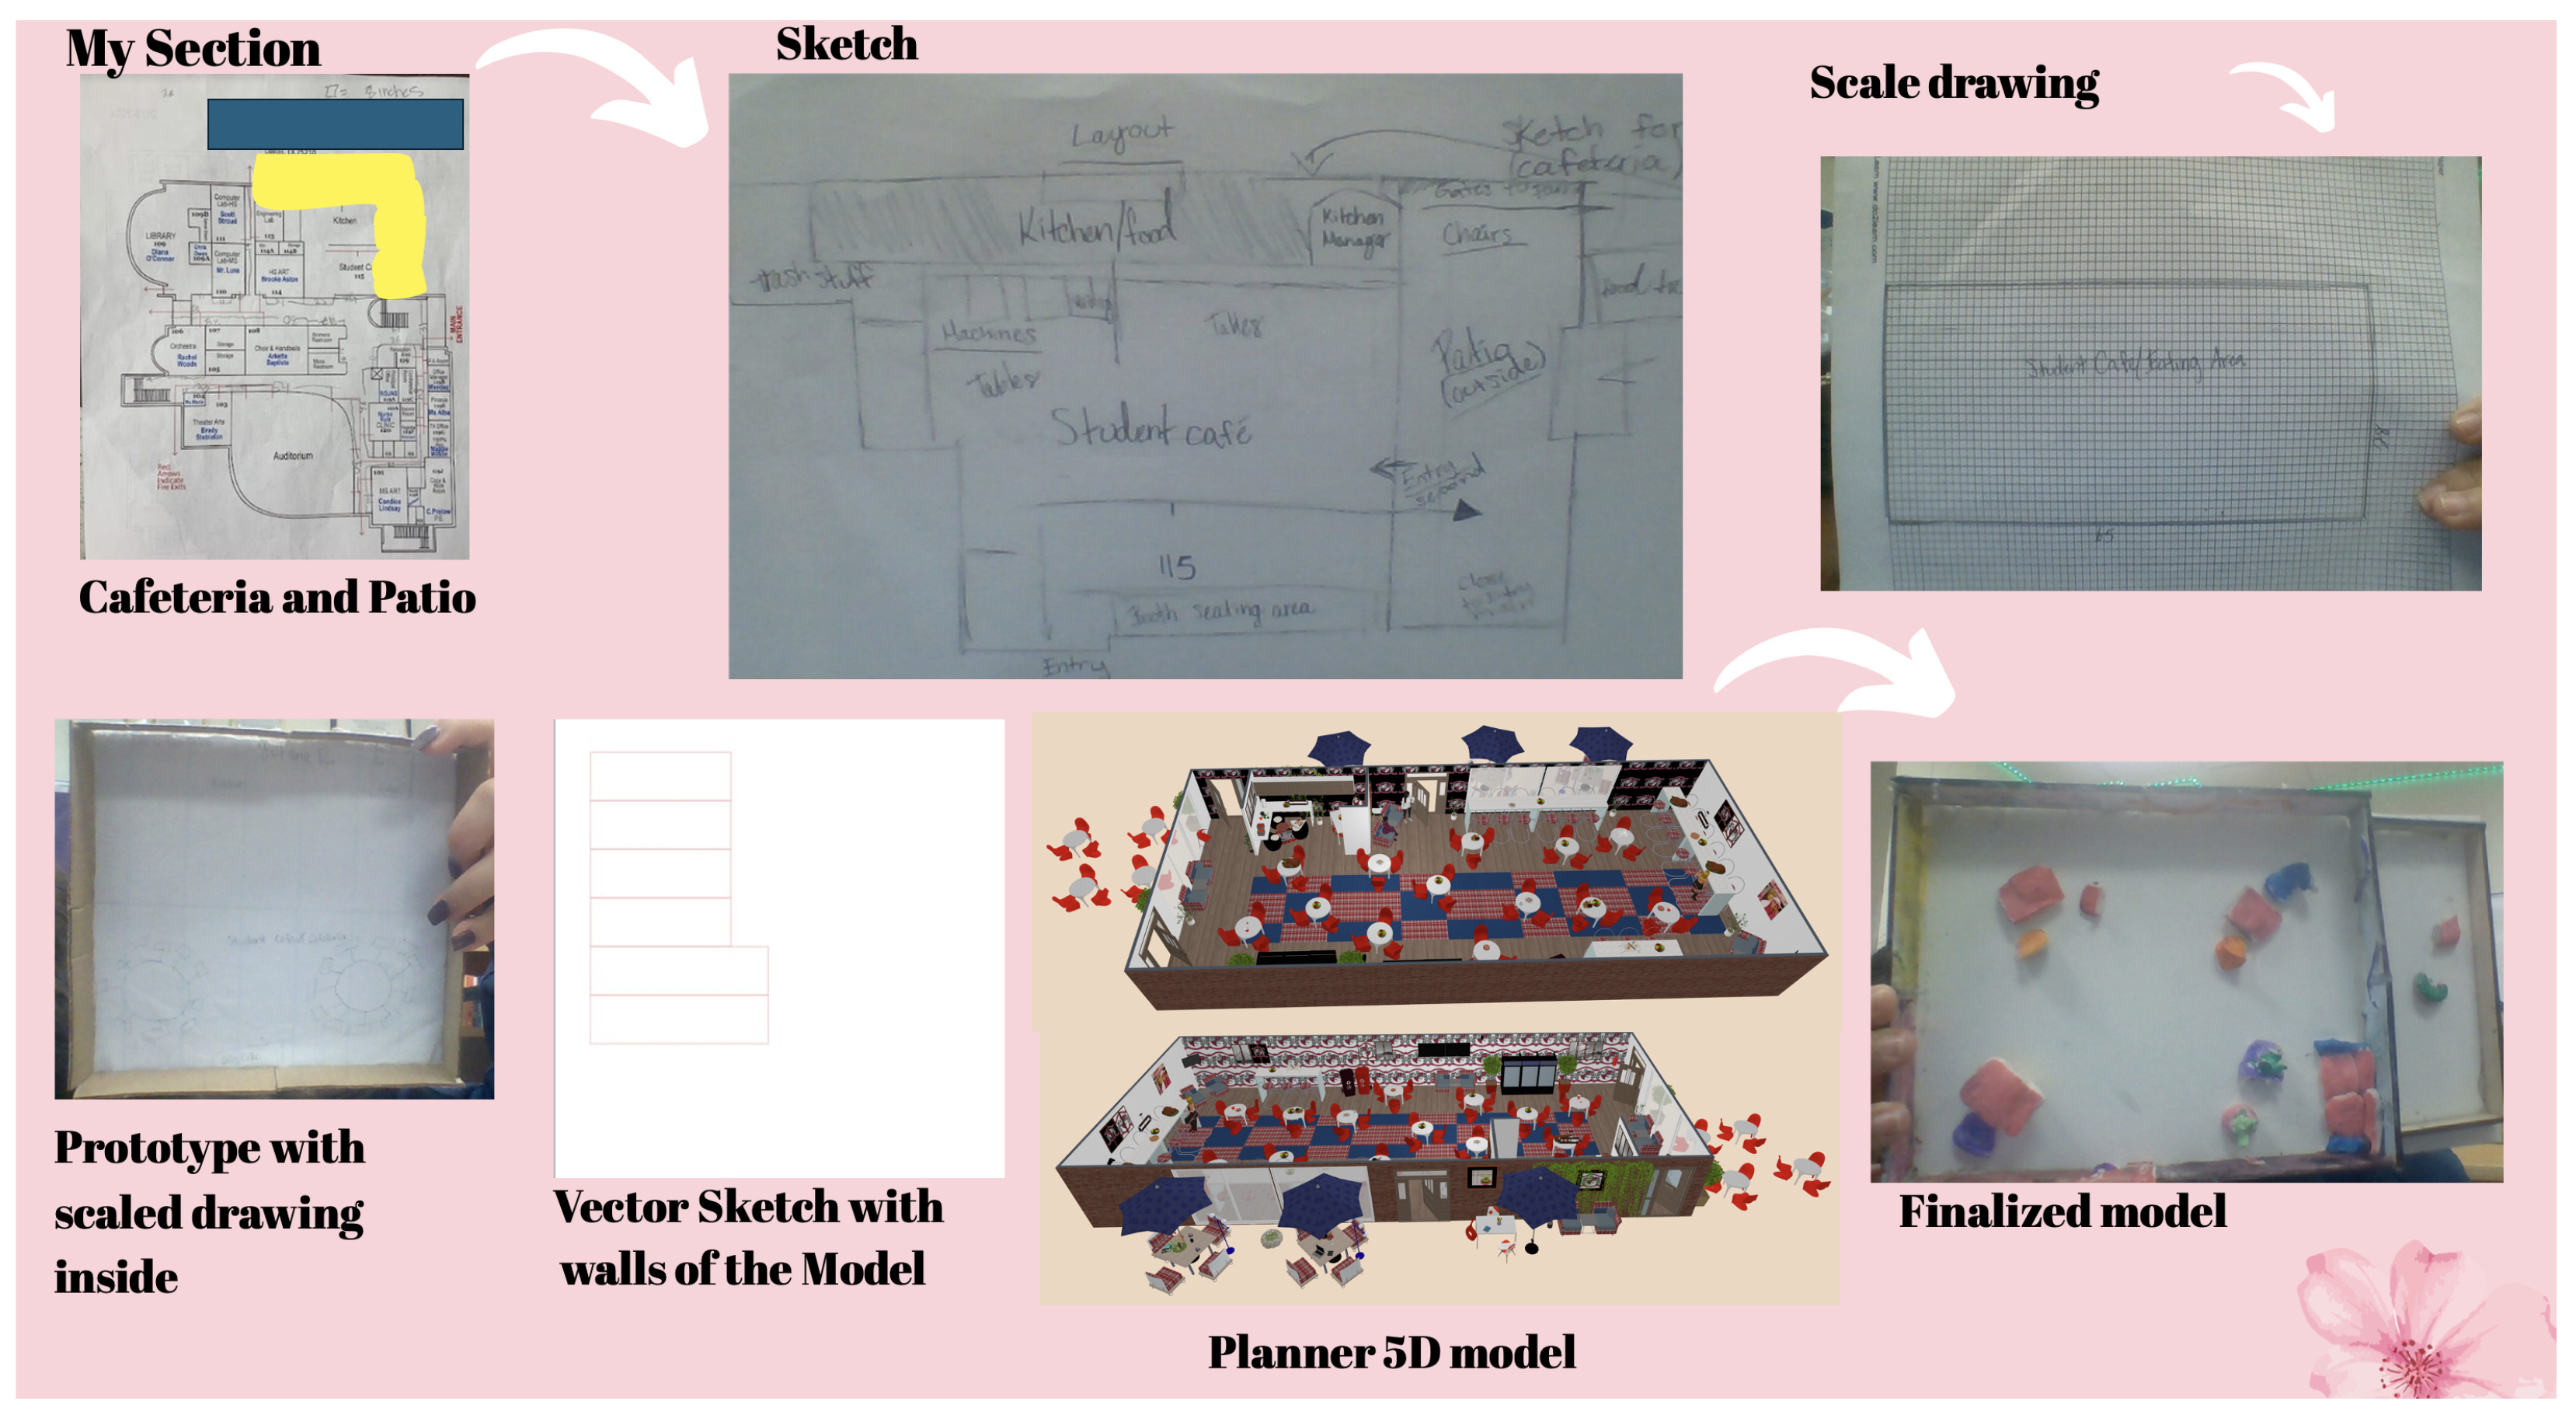
Other students also proposed the addition of sections to the existing building. However, these students explicitly described their use of geometric proportionality estimation to create their models.
Figure 5 provides an example of such design made by Linda. During her presentation, Linda pointed to her initial sketch and shared that her “first sketch of the model is not right at all, it’s not accurate. I just basically sketched what it looked like in my imagination, then I got the right measurements for the scaled drawing.” This instance is interesting as neither her prototype nor her final physical model are very detailed. However, her digital 3D model on Planner 5D is the most elaborate and mathematically accurate than any other in the data sample.
In contrast,
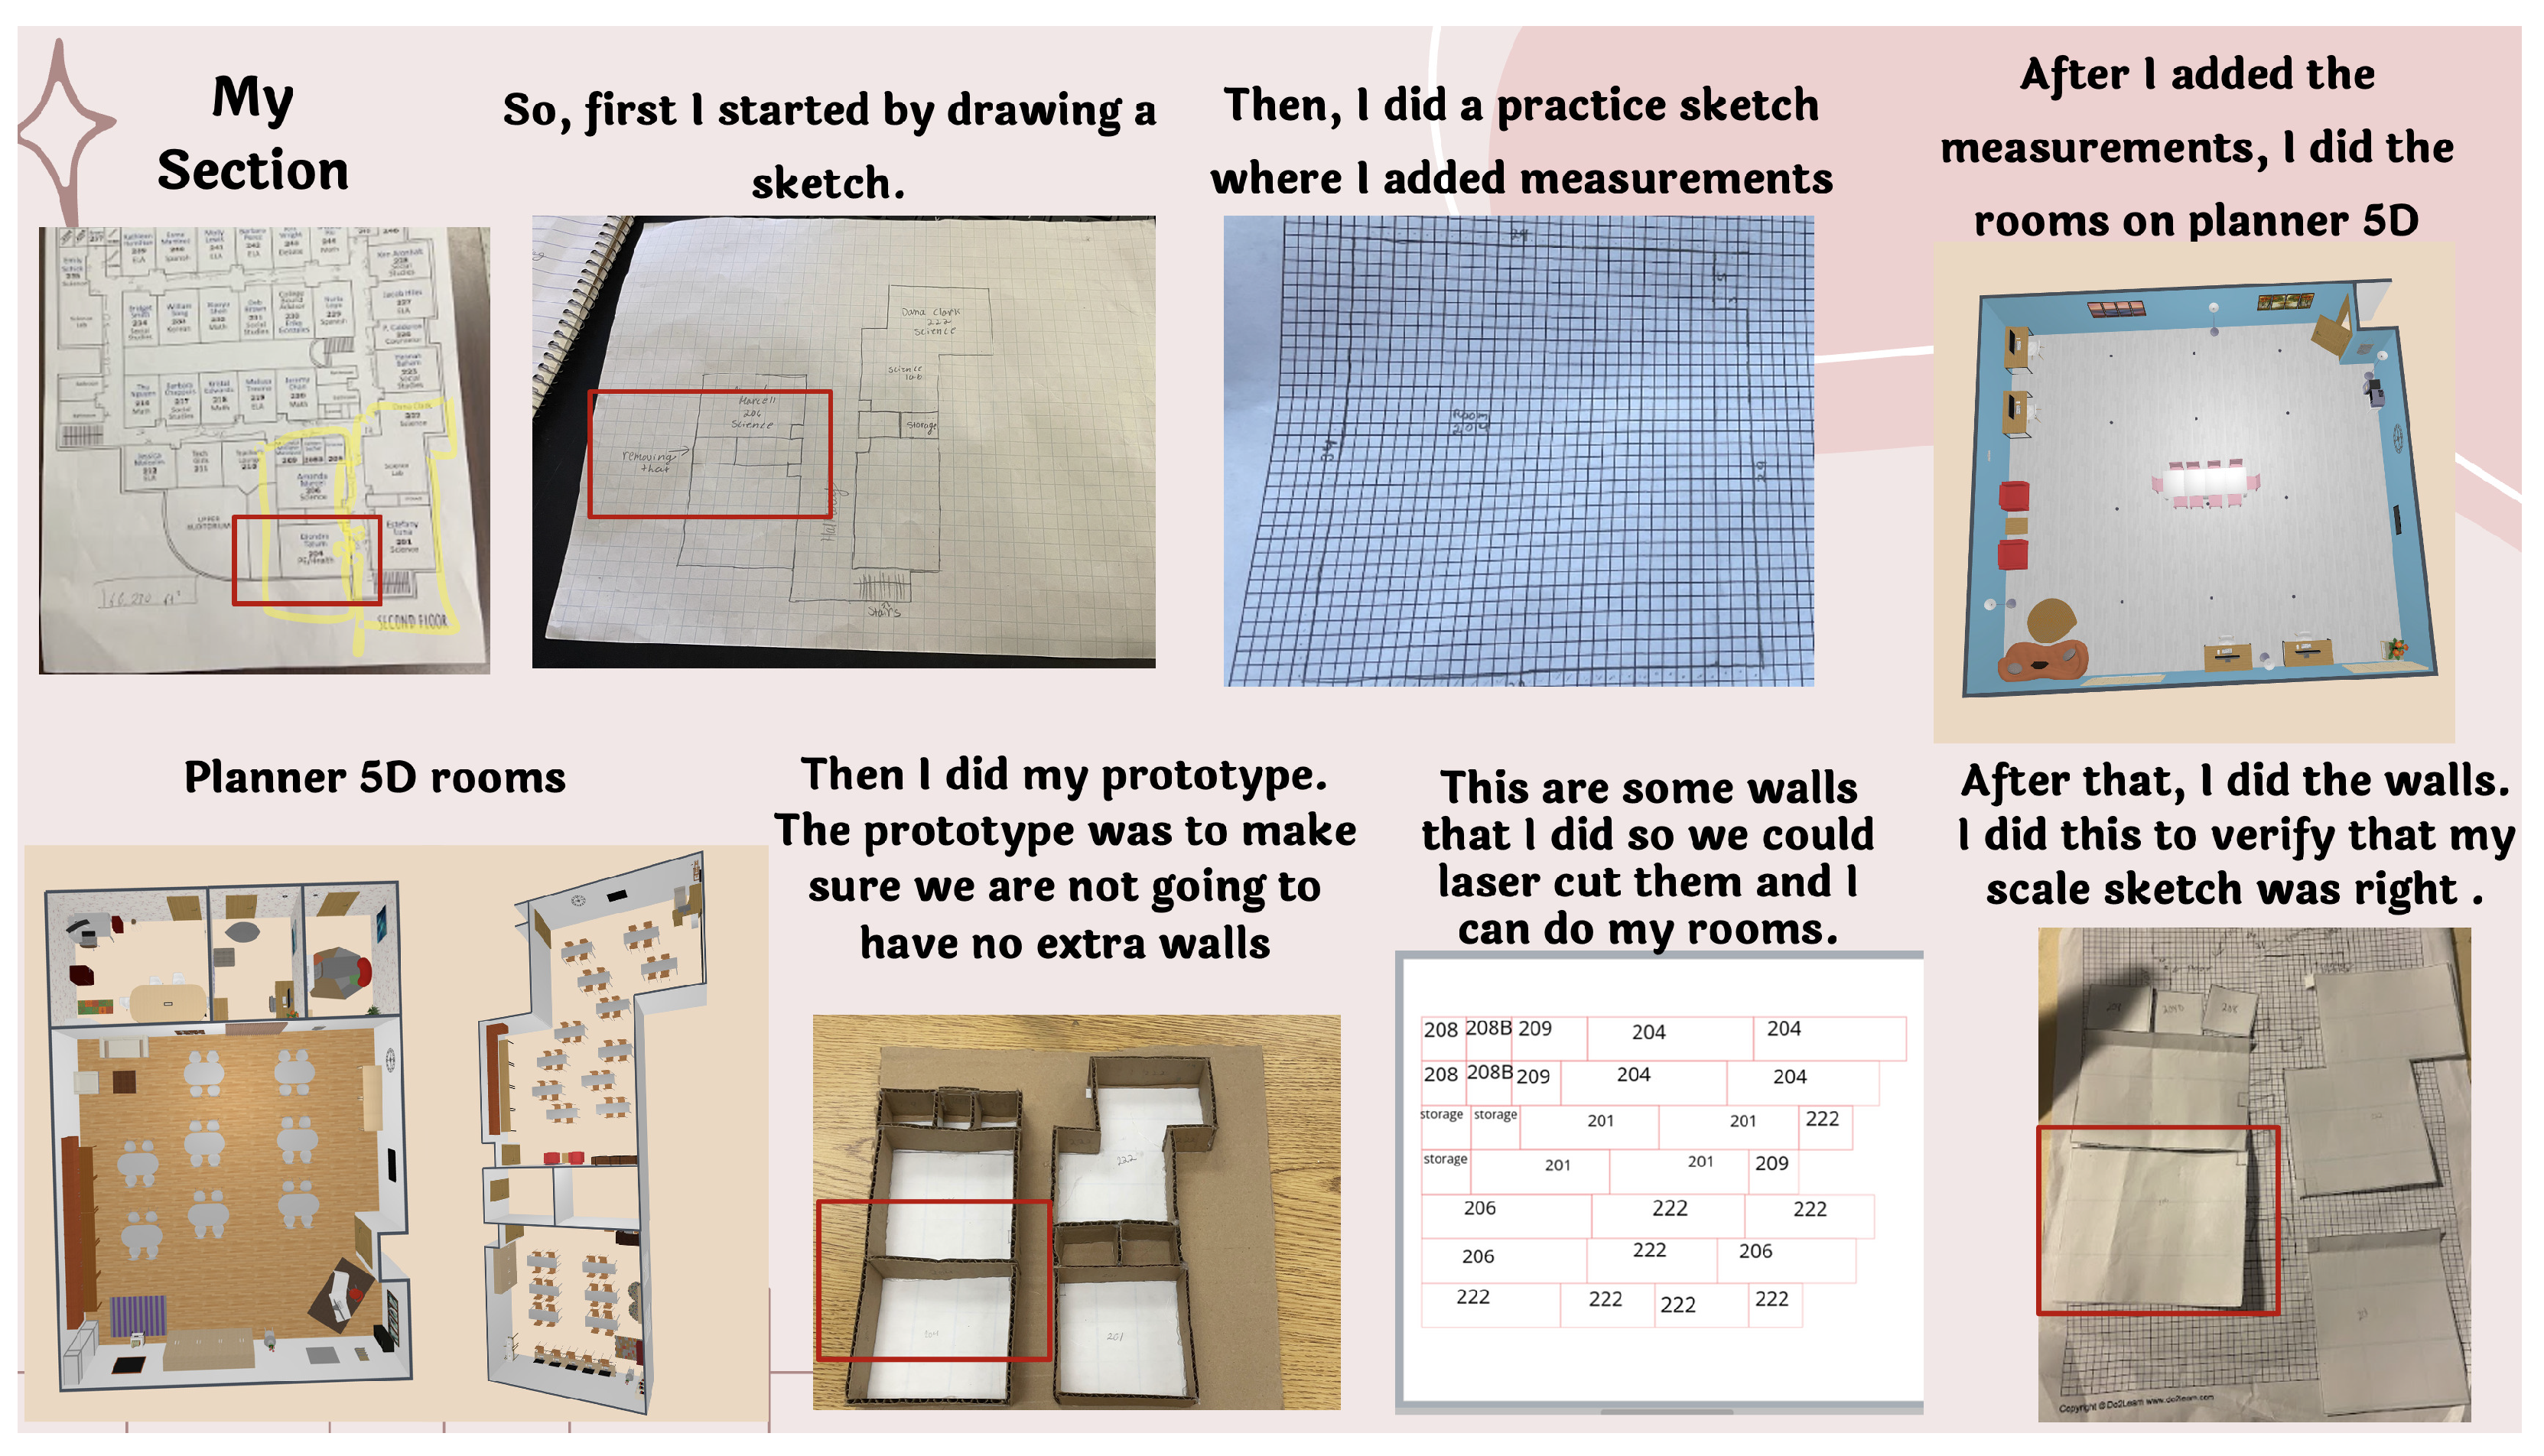
Figure 6 shows Mary’s work, the only instance in which a student’s scaled drawing and prototype were proportionally accurate, but the corresponding digital 3D model was not. Even though each 3D model had scaled drawings with measurements that accurately represented the physical buildings, the furniture in one of the classroom models looked relatively smaller than the rest of the room, which made the entire digital 3D model appear disproportionately designed. When we revisited Mary’s digital portfolio to locate the 3D model’s corresponding location on the campus map, we noticed a hand-written note describing the removal of a storage space between two rooms to make each room larger. Furthermore, on the section describing her progress on the scaled drawing, Mary wrote the following:
This is how my practice scale sketch is going. I am going to be removing the storage room and extending more the 206 classroom. I am leaving some other classrooms empty so that we can use them for other things. One thing we can use one of them is for meetings. The class officers have meetings every now and then. Take in mind that when they have their meetings they do them in teachers’ classrooms. Now with that space or classroom they can have their own space and have their own meetings without having to interrupt the teacher class.
This additional information on Mary’s digital portfolio provides her reasoning for this classroom having far less furniture than the other ones she redesigned. From the 3D digital model alone, the room might look unfinished and internally disproportionate. However, her description of the scaled drawing on her digital portfolio clearly justifies her decision to keep it spacious and open, basing it on the students’ needs and previous challenges securing a place to conduct their meeting activities.
Lastly,
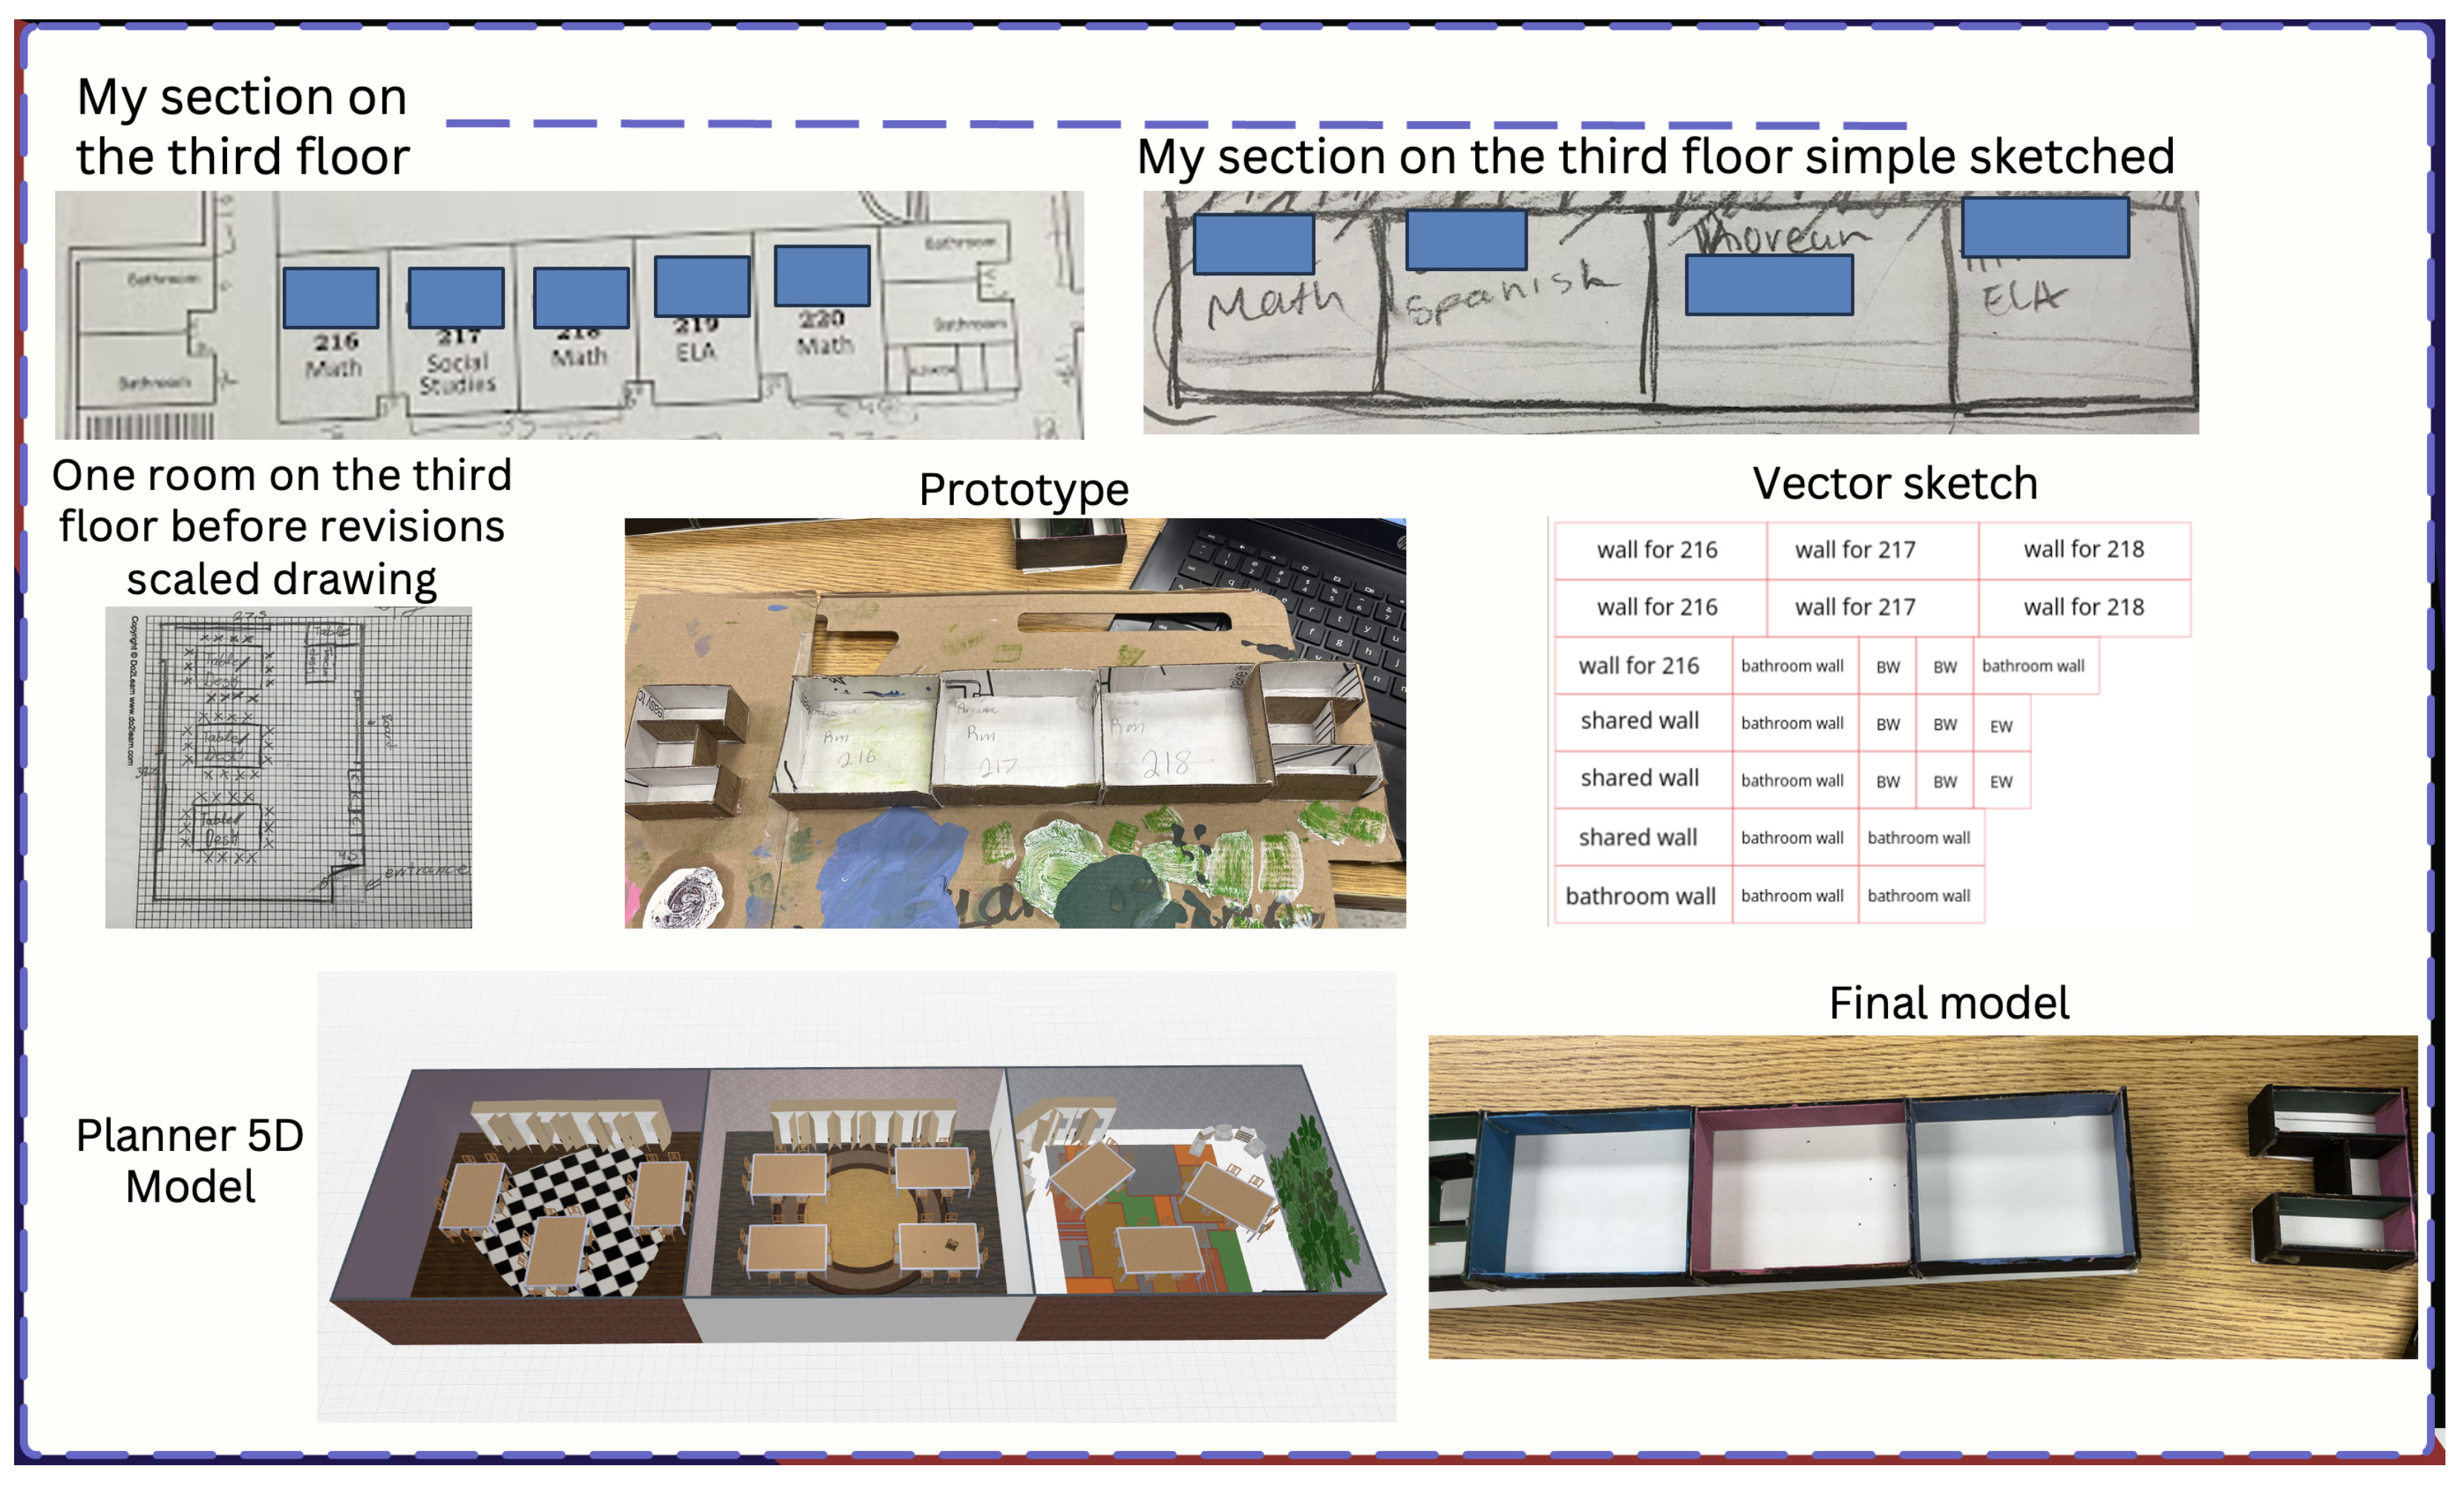
Figure 7 shows one of several instances in which students measured and designed one room first and used the same dimensions to replicate the remaining rooms. This technique was not taught to the students by the experts or the teacher. However, they found the duplicate feature of the Planner 5D software and realized they did not have to create each room separately if they had several that were supposed to be exactly the same size. Additionally, students who designed rooms with congruent dimensions also described utilizing a similar technique in the vector software to create the laser cut walls for the final model. They simply duplicated the number of walls needed for one room and removed the extra shared walls. These instances of unit rates representations in the digital 3D models, vector files, and physical models would not have been captured with the artifacts and written descriptions alone, as the duplication technique was only shared during the oral presentation.
Collectively, these examples show the different ways in which students demonstrated their understanding of the numeric and geometric dimensions of proportional reasoning. Individually, they provide a different version of how students can demonstrate their understanding of scale, quantity, and proportion, when more than one representation modality is available to them. Though we only include a limited number of instances in this paper, the remaining sixteen presentation slides displayed consistency among each of their respective artifacts, with rich detail and proportional accuracy in the digital 3D models, further emphasizing the impact the integration of professional technologies can have in students’ ability to demonstrate their mathematical content knowledge.
5. Discussion
In this work, we set out to investigate the ways in which middle school students represented their understanding of proportional reasoning through making in a Challenge-Based Learning project. Guided by the Framework for K-12 Science Education: Practices, Crosscutting Concepts, and Core Ideas (
National Research Council, 2012) and the constructionist principles of Challenge-Based Learning and Maker-Based Instruction (
Kafai, 2005), we designed and implemented a nine-week design challenge for an exploring engineering class of 20 seventh grade students, centered around seventh grade proportionality state standards as a crosscutting concept. Student artifacts, written descriptions and reflections, and oral presentations were collected and analyzed to investigate how students represented their understanding of proportional reasoning through those modalities. Our findings showed that students represented their understanding of the geometric dimension of proportionality through their artifacts far more than through their written explanations and oral presentations. These findings contrast our previous work in similar learning contexts where students best represented their understanding of content knowledge more accurately through the writing modality than any other (
Torralba & Rouse, 2024). Unlike our previous work, however, the present study involved more opportunities for students to demonstrate their understanding of proportionality concepts through the creation of artifacts, in the form of a learning progression, beginning from sketching the most basic idea of their design, without measurements or details, to gradually incorporating the dimensions of their buildings in their scaled drawing, cardboard prototype, digital 3D model, and final physical design. As students progressed from one stage to the next, they received mentorship and guidance from the professionals involved in the project and feedback on their progress from their classmates in other teams. The iterative design and continuous feedback component of this project is an essential part of the Challenge-Based Learning through Making model, specifically intended to provide students with opportunities to advance their learning with continuous guidance and mentorship of experts. The expert feedback focused only on the accuracy and feasibility of the students’ designs and ideas to avoid limiting the creative aspect of the project. Our findings support previous work in MBI regarding the benefits of consistent feedback in projects of this kind, and further emphasize the benefits of the CBL model in the middle grades, with respect to the involvement of industry experts and integration of professional technologies for design in highly collaborative real-world projects.
The integration of Planner 5D, as a professional design software, is an essential component of the CBL model. Notably, this integration required additional training for the facilitators and the students, which became a concern at the start of the project, as we did not want the focus of the project to deviate from the main goal. Nevertheless, the completed digital 3D models created with this technology provide a solid visual of the ideas for the school redesign students proposed, suggesting that the integration of the Planner 5D technology was an essential tool for students to reach their final goal, rather than a challenge they had to overcome in the process. Once students learned the basics of Planner 5D, the software allowed them to elevate their designs to a level where they were mathematically accurate and aesthetically superior to their physical prototype versions. The use of real-world measurements, proportional to those in their scaled drawings, further emphasized the relationship between the scaled measurements on their designs and those on Planner 5D showing how the campus would look if their proposal was implemented. From a mathematical perspective, students represented their understanding of proportionality through the multiple versions of their designs represented in different dimensions. Each of their designs progressed from the most basic representation on a 2D sketch to one that came to life when they virtually walked through it, using the virtual reality feature of Planner 5D. From a skills development perspective, the artifacts and their respective descriptions are evidence of the various maker skills students developed through the learning unit with the mentorship of experts. During the Skill Building activities, students learned how to create accurate scale drawings of their designs, use a professional design software to create a digital 3D model using the measurements on the scale drawing, and use a vector program to design and laser cut the walls for their physical prototype. Our findings suggest that in addition to providing opportunities for students to reflect on what they are learning through the artifacts they create in a design challenge, providing ample opportunities for them to learn new technological tools that allow them to apply their understanding of proportionality in various ways may help them better demonstrate their conceptual understanding of the components of proportionality such as similarity, scale, and unit rates.
Lastly, our analysis revealed an incidental finding that most students engaged in realistic estimation of measurements for the design of additional, remodeled, or extended sections of their current building. This was an interesting finding, as the estimation was mathematical in nature, but appeared to be driven by the desire to design something new and appealing to them. Almost half of the students described engaging in estimation when creating their sketches and scaled drawings, even though only one student worked on a section of the building that did not exist and therefore could not obtain the exact dimensions. Although proportional estimation was not the focus of this work, its prevalence in the data connected to accurate proportional representations suggests there is much to uncover regarding its benefits in CBL projects through making. This finding can serve as a starting point for future work on the role of mathematical estimation in CBL and MBI projects.
6. Implications and Limitations
In this work, we set out to investigate how seventh grade students in an exploring engineering class represented their understanding of mathematical content through participation in a Challenge-Based Learning through Making project. This work was motivated by the identified need to develop student understanding of STEM crosscutting concepts, such as proportional reasoning, beyond the mathematics classroom (
National Research Council, 2012). Our findings suggest that it is possible to pursue standards-based mathematics learning within the context of an engineering class, when students engage in making activities that meaningfully integrate the target mathematics concepts, provide them with mentorship and guidance of experts, and strategically integrate the use professional technologies that allow them to demonstrate what they know in various modalities (e.g., artifact constructions, written reflections, and verbal explanations). We argue that our integrated Challenge-Based Learning through Making instructional model holds great potential to teach students challenging crosscutting concepts (e.g., scale, proportion, and quantity), as such a model can provide students with opportunities to learn new technological tools that allow them to apply their understanding of proportionality in various ways, reflect on what they are learning through the artifacts they create and continuously improve through iterative cycles, and demonstrate their understanding of STEM content through the solutions they share with an authentic audience.
It is important to emphasize that our Challenge-Based Learning through Making instructional model is rooted in similar theoretical foundations as other instructional models such as design thinking (
Bush et al., 2018), which has shown to benefit students’ development of 21st century skills in various contexts (
Rusmann & Ejsing-Duun, 2022). However, our model goes beyond the shared design components of empathizing, defining, ideating, prototyping, and testing, by integrating as core elements the CBL component of industry expert involvement and mentorship throughout the design stages and the MBI component of publicly sharing a solution to a relevant problem in the form of a proposal presented to an authentic audience. In terms of skills development, our model also integrates the acquisition of maker skills (e.g., 2D/3D designing, prototyping, 3D printing, laser cutting, etc.) as a core element of the design challenge. While these components may also be emphasized in other instructional models such as Project-Based Learning (
Krajcik & Shin, 2014), in our model, they are purposefully and strategically integrated as part of a skills development progression, where participants can transfer and apply learned maker skills in future maker projects. The gradual acquisition and application of maker skills, along with the close collaboration with industry experts, is meant to help students develop an understanding of learning as a dynamic and collaborative process.
6.1. Practical Challenges and Opportunities
From a practical perspective, we acknowledge that our instructional model requires the integration of various components that most under-resourced schools may not have available (e.g., access to professional software, maker tools and technology, industry experts). From our experience working with schools implementing similar projects, we have found that those resources can be obtained in several ways. The Planner5D software was obtained by directly contacting the vendor. Similar to other online design software, such as SketchUp and TinkerCAD, Planner5D offers full access to their online software free of charge to under-resourced schools. For our project, Planner5D provided us with 150 individual licenses to use for an entire school year, with opportunities for renewal. However, it is worth mentioning that in previous implementations of similar projects, students were able to access all the necessary features on the free version of Planner5D. The main difference between the free version and the license was access to the full collection of decorative items.
Regarding the involvement of industry experts, we understand that such a level of commitment from professionals is not easy to find. Rather than searching outside the community for industry partners willing to work with our students for a period of nine weeks, we reached out to parents and community members who had expertise in the fields relevant to the design challenge. This approach was strategic, as we also wanted to highlight the presence and proximity of industry professionals in the students’ communities. It is worth noting that in a previous implementation of a similar project, we collaborated with graduate students from a nearby university who collectively mentored our students by taking turns. This approach not only provided our students with continuous expert mentorship, but also allowed them to work with and learn from different experts throughout the project.
Lastly, the acquisition of maker tools and technology has always been a challenge for practitioners interested in implementing maker projects. The most common misconception is that a school needs to obtain various types of maker tools and technology before they can engage their students in maker activities. This approach is not only expensive but also impractical. Our advice is to partner with other teachers (e.g., arts, technology, technical education) to find the tools and technology already available at their schools and push the learning as far as possible. In other words, a teacher can replicate our project with their own students, using prototyping materials from the arts classroom and some sort of computing device with internet access (e.g., computers or tablets) from the technology classroom. Students will still engage in all the design stages of the project, except for laser cutting and 3D printing, both of which are elevated versions of the physical prototypes and clay models.
6.2. Limitations and Future Research
The present study provides insights into how our Challenge-Based Learning through Making instructional approach can be implemented within the context of a formal middle grades classroom, and also serves as a starting point to not only investigate student learning of STEM crosscutting concepts through such instructional models, but also other academic content standards beyond STEM (e.g., social studies, language arts, business, etc.). While our findings are promising, our sample was only one classroom of 20 students at a high-performing all-girls school. Future work is needed to further understand whether and to what extent similar results can be found with a much larger sample and within different educational contexts. Regarding the next steps in our work, future research will investigate whether and to what extent students can benefit from the use of virtual reality, mixed reality, and extended reality when participating in similar design challenges, extending Planner 5D’s VR navigation feature to one that allows students to build while they navigate the virtual space, similar to Roblox and Minecraft.
